SULFATED nuxzn oxmzs or ‘rm WITH A SOME RARE EARTH …
175
STUDIES ON THE CATALYSIS BY SULFATED nuxzn oxmzs or ‘rm WITH A SOME RARE EARTH ELEMENTS THESIS SUBMITTED TO THE COCHIN UNIVERSITY OF SCIENCE AND TECHNOLOGY IN PARTIAL FULFILMENT OF THE REQUIREMENTS FOR THE DEGREE or DOCTOR OF PHILOSOPHY IN CHEMISTRY IN THE FACULTY OF SCIENCE B Y JYOTHI T. M. DEPARTMENT OF APPLIED CHEMISTRY COCHIN UNIVERSITY OF SCIENCE AND TECHNOLOGY KOCHI - 682 022 JANUARY 1999 T
Transcript of SULFATED nuxzn oxmzs or ‘rm WITH A SOME RARE EARTH …

STUDIES ON THE CATALYSIS BY
SULFATED nuxzn oxmzs or ‘rm WITH ASOME RARE EARTH ELEMENTS
THESIS SUBMITTED TO THECOCHIN UNIVERSITY OF SCIENCE AND TECHNOLOGY
IN PARTIAL FULFILMENT OF THEREQUIREMENTS FOR THE DEGREE or
DOCTOR OF PHILOSOPHY
IN
CHEMISTRY
IN THE FACULTY OF SCIENCE
B Y
JYOTHI T. M.
DEPARTMENT OF APPLIED CHEMISTRYCOCHIN UNIVERSITY OF SCIENCE AND TECHNOLOGY
KOCHI - 682 022
JANUARY 1999
T

Dedicated to my loving parents

CERTIFICATE
This is to certify that the thesis herewith is an authentic record of research
work carried out by jyothi T.M under my supervision, in partial fulfillment of
the requirements for the degree of Doctor of philosophy of Cochin University of
Science and Technology, and further that no part thereof has been presented
6%Dr.S .Sugunan
(Supervising teacher)Professor in Physical Chemistry
Department of Applied ChemistryCochin University of Science and Technology
Kochi— 22
before for any other degree.
Kochi—22
13th January 1999

DECLARATION
I hereby declare that the work presented in this thesis entitled, “ Studies on the
catalysis by sulfatcd mixed oxides of tin with some rare earth elements ”, isentirely original and was carried out by me independently under thesupervision of [)r. S. Sugunan, Professor in Physical Chemistry, Department of
Applied Chemistry, Cochin University of Science and Technology, Kochi—22,
India, and has not been included in any other thesis submitted previously for
the award of any degree.
msfiflx_1Yo'rH1. T.M
Kochi—22
13th January 1999

ACKNOWLEDGEMENTS
With great pleasure, I wish to express my deep sense of gratitude andobligation to my supervising guide, Prof. (Dr) S. Sugunan for his valuable guidance.
research training, constant encouragement, inspiring discussions and valuablesuggestions throughout this investigation.
I am equally indebted to Dr. B. S. Rao, Deputy director, National Chemical
Laboratory, Pune, who helped me enormously with concrete suggestions.stimulating discussions and thought provoking comments during my stay at NCL,Pune. I will ever remain grateful to him for his sincere help.
I feel grateful to Prof. Mohammed Yusuff, Head of the Department ofApplied Chemistry and former Head of the Department Prof. P. Madavan Pillai, for
providing the necessary facilities for carrying out my work.
I am extremely thankful to Dr. A. V. Ramaswamy, Head. Catalysis Division.
NCL, Pune and Dr. Paul Ratnaswamy, Director, NCL for permitting me to carry out a
part of my research work in NCL.
I take this opportunity to thank all the teaching, administrative andtechnical staff of the Department of Applied Chemistry for their help during variousoccasions. I also extend my appreciation and thanks to scientific and supportingstaff of Catalysis Division, NCL for their cooperation and help. I am also delighted to
thank Dr. M. B. Talawar. HEMRL, Pune for his encouragement and love.
I must gratefully acknowledge Dr. P. A. Unnikrishnan, Mr. Binoy Jose. Mr.
Rohit, Mr. Xavier. Ms. Rani Abraham, Mr. Suresh, Dr. H. 5. Sony. Dr. Mirajkar, Dr.
Bhelekar, Dr. Budhkar, Mr. Ramakrishnan, Dr. Gopinathan, Dr. (Mrs) Nalini Jacob, Mr.
Kavedia, Ms. Violet Samuel, Dr. A. P. Singh, Dr. S. G. Hegde, Dr. Akashe. Dr. V. R.
Chumbale, Dr. Shaikh, Mr. Rajagopal, Mr. Thomas Mathew, Mr. Sivasankar Mr. Kiran
Rao, Mr. Prakash Bhosle, Ms. Ranjeet Ahedi and Dr. T. Raja for the help rendered by
them whenever sought.
I should specially thank my labmates Dr. Anto Paul, Dr. C. R. Seena, Dr.Bindhu Jacob, Dr. Binsy Varghese, Prof. C. G. Ramankutty, Mr. Sreekumar, Ms.
Renuka, Ms. Rehna and Ms. Suja for the warmth they have shown towards me and
also for their encouragement and cooperation. I wish to place on record mysincere gratitude to Ms. Renuka for helping me a lot in completing the thesis.

Special regards lo all my friends, teachers and family members for their love
and affection which enabled me to pursue my goals wholeheartedly.
Financial assistance from U.G.C, New Delhi is greatly acknowledged.
Jyolhi T.M

PREFACE
It is well known that upon proper treatment with SUlfiJl'lC acid or ammonium
sulfate, many metal oxides exhibits strong acidity The sulfate modified ZrO2,
Fe2O_~., SnO2, TiO2 and zirconia containing mixed oxides have been found to be
promising catalysts for the low temperature esterification, isomerisation,
alkylation and cracking. The discovery of strong non-zeolitic solid was a
breakthrough because of the simple method of preparation, high thennal
stability and low reducibility.
A comparative account of the acid-base properties and catalytic activity
of mixed oxides of tin with lanthanum and samarium and their sulfate modified
analogues is presented in this thesis. Alcohol decomposition reaction is used to
probe surface acid-base properties of the catalysts. Catalytic activity study
comprises the oxidative dehydrogenation reactions of ethanol, cyclohexanol,
cyclohexane and ethylbenzene and alkylation of phenol, anisole and aniline with
methanol.
The general conclusions drawn fi'om the study are summansed in the
last chapter of the thesis. The development of new processes based on strong
solid acid catalysts to replace HF and H280. is needed for environmental as
well as safety considerations. The addition of a second metal oxide component
to sulfate modified oxides is very important as it enhances the thermal stability
and catalytic activity and hence there is a plenty of scope for fiJrther research in
this field.

CHAPTERI
1.1
1.2
1.3
1.4
1.5
1.5a
1.5b
1.5c
1.5d
1.5e
1.6
1.7
1.8
1.9
CHAPTER II
2.1
2.2
CONTENTS
INTRODUCTION
Heterogeneous catalysis
Metal oxides as catalysts
Acid-base properties and oxidation activity of SnO2
containing systems
Rare earth oxides as catalysts
Modified oxides
Different types of sulfated oxides
Effect of sulfate treatment on surface area and
crystalline structure of the oxide
Mechanism of sulfate adsorption
Creation of strong Lewis and Bronsted acid sites
Metal promoted sulfated oxides
Determination of acid-base properties; titration
methods
Alcohol decomposition as a test reaction to probe
acid-base properties
Oxidative dehydrogenation of ethanol, cyclohexanol,
ethylbenzene and cyclohexane
Alkylation of phenol, anisole and aniline with
methanol
Reduction of aromatics containing different reducible
groups
Present work
Main objectives of the work
REFERENCES
EXPERIMENTAL
Introduction
Materials
10
12
13
13
14
14
15
17
18
20
21
21
22
24
31
31

2.3
2.3a
2.3b
2.4
2.4a
2.4b
2.4c
2.4d
2.4e
2.4f
2.4g
2.5
2.5a
2.5b
CHAPTER III
3.]
3.2
3.2.1
3.2.2
3.2.3
3.2.4
3.3
3.3.1
3.3.2
Preparation of the catalysts
Preparation of mixed oxides
Preparation of sulfated oxides
Catalyst characterisation
X-ray diffraction
Infrared spectroscopy
Thermal analysis
Scanning electron microscopy
Surface area measurements
Pore volume measurements
Detennination of acidity and basicity by Hammett
indicator method
Catalytic activity measurements
Liquid phase reactions
Gas phase reactions
REFERENCES
RESULTS AND DISCUSSION
ACID-BASE PROPERTIES AND CATALYTIC
ACTIVITY OF MIXED OXIDES OF TIN WITH
LANTHANUM AND SAMARIUM
Physico-chemical characteristics
Alcohol decomposition as a test reaction
Decomposition of cyclohexanol
Decomposition of t-butanol
Decomposition of isopropanol
Decomposition of butanols as a probr reaction to
investigate acid-base properties of oxide systems
Oxidative dehydrogenation reactions
Oxidative dehydrogenation of ethanol
Oxidative dehydrogenation of cyclohexanol
32
32
33
33
33
34
36
38
38
39
40
42
42
43
45
47
48
58
58
62
63
66
76
76
81

3.3.3
3.4
3.4.1
3.4.2
3.4.3
3.5
CHAPTER IV
4.]
4.2
4.3
4.3 1
4.3.2
4.3.3
4.3.4
4.3.5
4.4
4.4.1
4.4.2
4.4.3
CHAPTER V
5.1
5.2
Oxidative dehydrogenation of ethylbenzene and
cyclohexane
Alkylation of phenol, anisole and aniline
Alkylation of phenol with methanol
Alkylation of anisole with methanol
Alkylation of aniline with methanol
Transfer hydrogenation of nitrobenzene using
isopropanol as a hydrogen donor
REFERENCES
ACID-BASE PROPERTIES AND CATALYTIC
ACTIVITY OF SULFATED MIXED OXIDES OF
TIN WITH LANTHANUM AND SAMARIUM
Physico-chemical characteristics
Decomposition of Alcohols
Oxidative dehydrogenation reactions
Oxidative dehydrogenation of ethanol
Oxidative dehydrogenation of ethylbenzene and
cyclohexane
Oxidative dehydrogenation of cyclohexanol
Comparative study of the catalytic activity of S042
and STS82 in the dehydrogenation of cyclohexanol
Mechanism of oxidative dehydrogenation reactions
Alkylation of phenol, anisole and aniline
Alkylation of phenol with methanol
Alkylation of anisole with methanol
Alkylation of aniline with methanol
REFERENCES
SUMMARY AND CONCLUSIONS
Summary
Conclusions
84
87
87
96
I02
108
115
119
132
137
137
140
142
144
I47
149
155
156
156
159
162
164

CHAPTER I
INTRODUCTION

1.1 HETEROGENEOUS CATALYSIS
It is well known that a catalyst affects the kinetics of a reaction, through the
provision of an alternative reaction mechanism of lower activation energy, but
cannot influence the thermodynamic constraints governing its equilibrium. A
catalyst can be defined as a substance that increases the rate at which a
chemical reaction approaches equilibrium, while not being consumed in the
process. The name heterogeneous catalysis implies that the catalyst and
reactants are in different phase. Most often reactants are in gaseous phase and
catalyst is in solid phase. Use of an insoluble, nonvolatile solid as catalyst for
fluid phase reactions has several advantages; loss of the catalyst is minimised, it
does not significantly contaminate the reaction products, and it stays physically
in place in the reaction chamber The use of liquid phase catalysts presents
serious problems. It is oflen difficult to separate the catalyst and the product
stream, large amount of catalyst is usually required, and the catalyst waste is
significant (particularly acids) causing an environmental hazard. Also the cost
of process installation and maintenance is high since the liquid acids are highly
corrosive. From the above discussion it is clear that heterogeneous catalysis
has several advantages over the conventional homogenous catalysis including
the easy separation of products from the reaction stream, design of continuous
flow reactors, environmentally benign processes etc. to name a few Although
the general definition of a catalyst given above emphasizes the acceleration of
approach of equilibrium, the selectivity of a catalyst is ofien more important
than its overall activity. An unselective catalyst may accelerate undesirable
reaction pathways. In recent years the studies on heterogeneous catalytic
process have been expanded so much that even selective formation of desired
products become possible. The surface acid base properties of a given catalyst
can be so tuned to get desired activity and selectivity In many cases product
selectivity depends on the strength, number and distribution of acid-base sites
on catalyst surface. The important types of heterogeneous catalysts in use
include, metals, metal oxides (single, mixed and supported oxides), zeolites,
clays and supported heteropoly acids.
1.2 METAL OXIDES AS CATALYSTS
Most of the solid acid base catalysts used in various chemical transformations
are based on inorganic oxides as single, mixed or supported oxides. In most
cases these oxides are to be modified chemically or physically so as to get
desired catalytic activity for a particular reaction. Oxides because of their
ability to take part in the exchange of electrons, protons or oxide ions are used
as catalysts in both redox and acid base catalysis [1]. The most important type
of reactions catalysed by oxides are oxidation reactions. For many years they
have been the subject of considerable interest because more than 50% of the
production of the chemical industry obtained from catalytic processes are
oxidation products. Historically the first catalytic process, introduced into
industrial operation (even before the term ‘catalysis’ was coined in scientific
literature) was the oxidation of S02. Some of the important reactions which
require metal oxides as catalysts are oxidation of cyclohexane to
cyclohexanone, oxidative dehydrogenation of ethylbenzene to styrene,
oxidation of methane to formaldehyde, oxidative dehydrodimerisation of CH4
to form ethane and hydroquinone, oxidation of benzene to phenol and
conversion of phenol to catechol and hydroquinone, oxidation of toluene to
benzaldehyde, and complete oxidation of hydrocarbons and CO [2]. The
generation of new acid sites on mixing oxides was first proposed by Thomas
[3] and further developed by Tanabe and co-workers [4]. There seems to be a
common view in these reports that the generation of new sites is associated
with the charge imbalance at locally formed M1—O—M2 bonding where M. is
the host metal ion and M2 is the doped or mixed metal ion. For a certain
combination of the metal oxides the number, strength and type of acid and base
sites, usually generated are affected by preparation methods. Common
methods of preparation include kneading, [5] co-precipitation [6], cogelation
[7], complexation method [8], combustion synthesis [9], freeze drying
technique [10] and spray drying technique [10]. The method followed in the
present study is co-precipitation method because of its numerous advantages
and simplicity
Several processes can take place when two oxides are mixed together,
consequently there are different explanations for synergy involved,
(a). Formation of a new compound or a solid solution by reaction between two
phases.
(b). Contamination of the surface of one phase by element coming from the
other, namely mutual contamination, such as SnO2 by Sb or vice-versa.
(c). Formation of a monolayer of one oxide over the other
(d) Classical bifunctional catalysis.
(e) Formation of mobile oxygen species and some chemical action of the latter
In the last two cases two possibilities appear;
[i]. The mobile oxygen species produced from one phase react directly with
reactants adsorbed on the other (spillover oxygen is being used as reactant).
&
[ii]. The mobile oxygen species emitted from one phase migrates on to the
surface of the other and by reacting with it improves the catalytic activity
(spillover oxygen being used as a controlling species) — this is the remote
control mechanism [1 1].
In metal oxides two possible states of activated oxygen can be
recognized; highly reactive surface states of adsorbed oxygen and less active
lattice incorporated oxygen species. Obviously the former species are usually

considered to be important ones involved in complete oxidation and latter are
believed to participate in selective partial oxidation. In both types the relation
between the catalytic activity and physico-chemical characteristics of metal
oxides is understood to confirm the redox model with volcano-type relations
[12] The major advantage of the multicomponent oxide is that it is possible to
tune oxygen sorption properties by meticulously choosing the required metal
components so as to crystallize in a particular structural system. In such cases
the reactivity of oxygen is strongly dependent on the kind of neighbouring
metal cations as well as metal oxygen bond distance and bond strength.
According to Ai et al the correlation between the catalytic activity and
acid-base properties can be explained by the strength of acid base interactions
between the reacting molecules and catalyst surface [13]. In the case of
oxidation of butadiene which is basic the catalytic activity of several Mo-Bi-P
and V-Mo mixed oxides increased with the acid amount of the catalyst.
According to the investigators the more acidic catalysts interact more strongly
with basic butadiene and activate it more easily The oxidation activity of acetic
acid over Mo-Bi-P and Ti-V-P oxides was correlated with the base amounts.
1.3 ACID-BASE PROPERTIES AND OXIDATION ACTIVITY OF
SnO2 CONTAINING SYSTEMS
Tin oxides are active catalysts for oxidation and are also used as a component
of oxidation catalysts. However reports on acidic and basic catalysis of the
oxides are not abundant. Tin oxide is often used in the form of a mixed oxide.
In the presence of SnO2 alone a few reactions are known viz., the oxidation of
CO [14], the reduction of NOx [15], the oxidation of olefin [16], and
isomerisaton [17]. The IR spectra of adsorbed pyridine and ammonia revealed
that SnO2 exhibits weak Lewis acidity, but doesn’t show Bronsted acidity even
in the presence of H20. Adsorption of organic molecules often gives rise to the
oxidation of adsorbates. Methanol is chemisorbed to give methoxyl groups,
but they are readily oxidised to a surface fonnate [18]. Acetone and
acetaldehyde are adsorbed predominantly as acetates. Itoh et al showed that
tin (IV) oxide evacuated above 673 K gave an ESR signal at g value equal to
l.9 which was assigned to Sn” The signal intensity varied with evacuation
temp, showing maximum at 773 K. The intensity of signal decreased upon
exposure to oxygen and a signal of O2 appeared. On exposure to nitrobenzene
anion radicals were formed and the signal at 1.9 disappeared. These facts
indicate that the paramagnetic centers are electron donating sites and most of
them are located on the surface of SnO2. On exposure to oxygen or
nitrobenzene the conductivity becomes almost zero, indicating that the thermal
reduction of tin (IV) oxide occurs only on the surface layer, but not in the bulk
ofthe solid [19].
Acidity of SnO2:— The acidity of SnO; calcined at 773K was reported to be
0.133 mmol/g as determined by butyl amine titration using methyl red indicator
(Pka=4.8). However, No acid sites stronger than Ho 3 4.0 were detected [20].
The hydrous tin oxide efficiently catalysed the reduction of carboxylic
acid with 2-propanol in the vapour phase at temperatures ranging from 300
330°C, to give the corresponding alcohols The reductive halogenation of
alkyl halides also proceeded over this catalyst. In the case of oxides afier
reaction the peaks assigned as Sn (0) is observed together with those of Sn
(IV) from XPS [21].
Fuller et al reported the reduction of nitrous oxide by CO over tin
oxide. The reaction occurs principally by a redox mechanism involving CO
chemisorption, CO2 desorption via lattice oxygen abstraction, and reduction of
the catalyst by N20, the last being the rate determining step [22]. SnO2 is

active for the oxidation of CO at moderately low temperatures (< 150°C). The
darkening in colour of the catalyst during the partial deactivation to a steady
state condition at low temp is indicative of an overall partial reduction of the
catalyst [23]. Pure SnO2 is impractical as an oxidation catalyst because of its
low activity However the mixed oxide systems with some other metal oxides
are known to be very effective for certain selective oxidations [24]. There have
already been several reports on partial oxidations using such SnO2 containing
binary catalysts as SnO2—V2O5 [25], SnO2—MoO_z [26], SnO2—P2O5 [27],
SnOz—Sb2O5 [28] and SnOg—Bi2O3 [29]. Pure SnO2 has a fair basicity, and
introduction of a small amount of V205 (2-20%) to SnO2 remarkably enhances
its basicity It can be stated that SnO2 rich catalysts are basic and V205 rich
catalysts are acidic [30]. Pt/SnO2 and Pd/SnO2 are interesting catalysts for CO
oxidation because of the synergistic effects [23]. Bond et al suggested that the
spillover of CO and atomised oxygen from metal site to the support SnO2 is
mainly responsible for the enhanced catalytic activity of Pd/SnO2 system
though the extent of spill over is faster than that of oxygen [3]]. A
conspicuous catalytic synergy was observed when methacrolein production and
selectivity were considered. The origin of the observed synergy and other
experimental observation is explained in a satisfactory manner by the existence
of a remote control mechanism, i.e., (1-Sb2O4 produces mobile oxygen species
(spillover oxygen) which by floating on to the surface of SnO2, creates new
selective sites on the surface of the latter and / or regenerates those which have
become deactivated. Spill over oxygen produced by O.-Sb2O4 seems to control
the selective catalytic sites on SnO2 by inhibiting the transformation to reduced
non-selective sites. It also inhibits the formation of carbonaceous deposits[32]
Catalytic properties of binary oxides containing bismuth or tin for the oxidation
of propylene have been studied at 300-600°C. In the case of tin oxide, benzene
formation is highly enhanced by the addition of basic oxides whereas acrolien
formation is promoted by acidic oxides [33]. The acidic property of SnO2 is
greatly enhanced by incorporating sulfate ions into the oxide [34]. Tatke and
Rooney noted that temperature of 473K were required for the isomerisation of
1-butene over SnO2, but the reaction proceeded smoothly over SnO2
containing a small amount of sulfate [3 5] at lower temperature.
[.4 RARE EARTH OXIDES AS CATALYSTS
The use of rare earth oxides as promoters or supports in catalytic reactions has
been grown extensively due to its interesting properties. It is reported that,
following appropriate pretreatment, rare earth sesquioxides are active for a
variety of reactions including ortho/para hydrogen conversion [35], deuterium
exchange reactions [36] of hydrocarbons, H2-D2 equilibration [37], alcohol
dehydration [38], olefin isomerisation [39], decomposition of N20 and NO [40]
and oxidation reactions of hydrogen [41], CO [42] and hydrocarbons [43].
The reactions for which basic sites of rare earth oxides are relevant
include, hydrogenation of olefins, double bond migration of olefins, aldol
condensation of ketones, and dehydration of alcohols. For the isomerisation
and hydrogenation, the oxides of sesquioxide stoichiometry show activity while
the oxides with metal cations of higher oxidation states are highly inactive. The
situation is different in aldol condensation, the oxides with high oxidation state,
CeO;, Tb4O7 and Pr5O” show considerable activity The oxides with metal
cations of oxidation state higher than +3 possess weak basic sites which are
sufficient to catalyse the aldol condensaton but not strong enough to catalyse
hydrogenation and isomerisation [44]. Rare earth oxides show characteristic
selectivity in dehydration of alcohols. 2-Alcohols undergo dehydration to form
1-olefins. The formation of thermodynamically unstable 1-olefrns contrasts
with the formation of stable 2-olefins over acidic catalysts [45]. Rare earth
oxides have been classified as solid base catalysts on the basis of '30 binding
energy studies [46]. Rare earth oxides exhibit activity as oxidation catalysts
and have low work fimctions. Taking advantage of this property of these
oxides, negative ions can be produced by negative surface ionisation [47].
Nonnand et al tested the influence of the support on the reactivity of Pd
/ rare earth oxide catalysts. Based on these results they classified oxides in to
three,
(a). oxides of the type Re2O3 which are unreducible.
(b). CeO2 where anion vacancies can be created extrinsically by reduction
process and
(c). Pr6On and Tb4O7 where anion vacancies exist due to nonstoichiometric
nature of the oxides [48].
It has been reported by several authors that a large part of the basic
sites determined by the adsorption of acidic substances consists of surface
lattice oxygen 02‘ ions. Keulks and Wragg have reported that the active
oxygen species available for oxidation is lattice oxygen 02‘ ions [49]. The
acidic sites contribute to the activation of electron donor type reactants such as
olefins and are connected with oxidising sites [50]. The adsorption and
mechanism of surface reactions of 2-propanol on ceria calcined at different
temperature is known to change the surface species on the oxide and remove
surface bound OH groups with Bronsted type acidity at high temperatures with
the formation of new sites of Lewis acidity from metal cations [51]. According
to the mechanism proposed for this reaction exposed couples of Ce“ and 02
ions are active sites. It is found that in the aldol addition of butyraldehyde
catalysed by rare earth oxides (ZrO2 and La2O3), active site is the the surface
02' ion and rate determining step is the O.-H abstraction [52]. Rare earth
oxides can store the oxygen during the oxidative step of the exhaust cycle and
remove it during the reductive step, thereby broadening the air to fiiel ratio
[53].

In an attempt to identify the active sites for hydrogen atom abstraction,
in the oxidative coupling of methane the catalyst was quenched from 650 to —
196°C and the presence of superoxide ions were detected by the E.P.R
Spectroscopy These ions are believed to be fonned by the reaction of 02
either with thermally generated electron hole pairs or with surface peroxide
ions [54].
Minachev et al suggested that catalytic activity of rare earth oxides
depends on the binding energy of oxygen with the surface, in the oxidation of
hydrogen and propylene [55]. Bakumenko et al explained the difference in
catalytic activity of different rare earth oxides on the basis of the heat of
formation of oxides [56]. Lazukin and co-workers found a good correlation
between the activation energy of the oxidation of propylene and the electrical
conductivity of rare earth oxides and concluded that the electron transfer from
the reactant or the intennediate, to the catalyst surface takes place in the rate
determining step [57]. Some of the authors suggested from the results that the
catalytic activity of the lanthanide oxides depend on the electronic
configuration of the inner 4f subshell [55]. Catalytic activity of rare earth
oxides has recently been reviewed in a book by Tanabe [58].
1.5 MODIFIED OXIDES
It is well known that catalytic activity of a catalyst is greatly affected by the
methods of catalyst preparation and the conditions of pretreatment. This is
illustrated by the fact that the physical or chemical property of a catalyst varies
with the method of preparation and that chemical species adsorbed on the
surface affect the catalytic activity profoundly In most cases these oxides are
to be modified chemically or physically so as to get desired catalytic activity in
a particular reaction [59]. For example, the addition of well dispersed weakly
l0
basic rare earth oxides titrates the stronger acid sites of amorphous silica
alumina and lowers the acid strength to the level shown by halided alumina. So
they can be used in place of halided alumina, which often loses activity due to
the removal of halogen. Rare earth oxides are referred to as permanent
inorganic basic titrants.
** They are weakly basic and they can gradually titrate the acid sites to the
desired level.
** They are easily dispersable. The weakly basic oxide should spread as a
monolayer on the silica-alumina surface (If the oxides agglomerates the acid
sites would not be uniformly titrated)
** They are non-reducible.
In general acid-base properties of catalysts play significant roles not
only in acid base catalysis but also in oxidation catalysis. Acidic or basic
substances such as P205 or K salts are often added to industrial oxidation
catalysts in order to improve catalytic perfonnance [60]. These additives
suppress undesirable side reactions over oxidation by adjusting the acid base
properties of the catalyst surface.
In 1979 Arata and co-workers reported that zirconia upon proper
treatment with Sulfuric acid or ammonium sulfate exhibits extremely strong
acidity after calcination in air at 550°C and is capable of catalysing the
isomerisation of butane to isobutane at room temperature [6]]. In this
connection the extremely high catalytic activity of ZrO2 modified with sulfate
anion (sulfated zirconia, SZ) in various reactions is quite interesting. In fact the
effect of anions on the catalytic activity of metal oxides has been known for a
long time. This catalytic performance is unique compared to typical solid acid
catalysts, such as zeolites, which show no activity for the reaction at such low
temperatures. Using Hammett indicators, Hino and Arata claimed that sulfated
II
zirconia is an acid lO“times stronger than 100% sulfuric acid [62]. Acids
stronger than 100% sulfiiric acid are referred to as superacids. The strength of
an acid can be characterised by the so-called Hammet acidity function, "H0. The
greater the value of the function, the stronger the acid.
-Ho f0f 100°/o H2804 =
-Ho for Sulf.ZrO2 = 16
The strong acidity and the exceptionally high activity of SZ made it
attractive as a catalyst in isomeric hydrocarbon producing processes such as
hydroisomerisation, hydrocraking, alkylation and oligomerisaion. However, a
number of issues regarding the strength of acid sites in SZ, the nature of active
sites, the role of Lewis and Bronsted acid sites in catalysis and the role and
state of platinum supported on SZ are still controversial. Several reviews on
this remarkable catalyst are available in the literature [63]. Since the discovery
of its strong activity, SZ has attracted much attention as a potential process
catalyst. The main reason is associated with the increasing need for
environmentally benign processes. Current technology uses I-IF or HZSO4 as
catalysts which suffer many drawbacks such as high toxicity and extreme
corrosivity in addition to risk of handling large amount of hazardous acids.
1.5a Different types of sulfated oxides
Metal oxides other than ZrO2, which show enhanced acidity on sulfation
include Fe2O_~., TiO2 [64] SnO; [65], A120; [66], and I-IfO2 [67] In addition
sulfation of binary mixed oxides such as ZrO2-TiO2, ZrO2.Al2O3 [68], ZrO2—
NiO [69], ZrO2—V2O5 [70], ZrO2—SiO2 [71], ZrO2—HfO2 [72] and ZrO2—SnO2
[73] are also reported in literature. In recent years the development of metal
promoted sulfated oxides is receiving increasing interest due to their higher
l2
activity and thermal stability A remarkable catalyst formulation consisting of
iron and manganese promoted SZ (abbreviated as SFMZ)has recently been
reported [74]. Hsu et al claimed that SFMZ is three orders of magnitude more
active than the unpromoted catalyst for the isomerisation of butane at low
temperature.
1.5b Effect of sulfate treatment on surface area and crystalline structureof the oxide
As compared to pure metal oxides their sulfated analogues have a higher
surface area after calcination at temperatures > 500 °C in air. The larger
surface area is attributed to the retardation of crystallisation on sulfate
treatment. In the case of zirconia, sulfation inhibits sintering and delays the
transition of amorphous phase to crystalline material as it is obvious from the
shifi in exothennic peak of DTA curves [75].
l.5c Mechanism of sulfate adsorption
The mechanism of sulfate incorporation in the solid is an anionic exchange
between the OH groups of the solid and HSO4’ ions from solution [76]. The
acidity induced by the sulfate anion is then controlled by the presence of OH
groups on the original material, the number of which can be changed by the
conditions of preparation and pretreatment. Superacidity is created by
adsorbing sulfate ion on to amorphous metal oxides followed by calcination in
air to convert it to the crystalline form. So the material should be in the
hydroxide form, which can be dried carefiilly at 110 °C. A1203 is an exception
to this rule.
13

l.Sd Creation of strong Lewis and Bronsted acid sites
Sulfate species are themselves Lewis acids and by attracting electrons they
generate Lewis acid sites on the oxide surface. In other words strong Lewis
acid sites are created by the electron withdrawing inductive effect of S = 0
bonds of the complex formed by the interaction of oxide with sulfate anion
[77] The existence of covalent S = 0 bonds in sulfiir complexes formed are
necessary for superacidity generation or in other words, acidity generation is
brought about by the oxidation of sulfur to its highest oxidation state +6.
l.Se Metal promoted sulfated oxides
The iron manganese modified SZ (SFMZ) catalysts first developed by Hsu et al
have generated strong interest due to their exceptionally high activity toward
butane isomerisation at low temperature. There is no significant difference in
acid strength between SZ and SFMZ. Comparative studies of acidity of
promoted and unpromoted SZ were independently carried out by Tabora and
Davis [78], and Wan et al [79].
More recently it is found that Cr and Mn promoted SZ has activity comparable
to SFMZ [80]. It is inspiring that the incorporation of transition metals may
increase the superacidity and catalytic activity of sulfated zirconia, although the
nature of such an enhancement is far from clear Miao et al has recently
reported that the catalytic activity of sulfated oxides of Cr-Zr, Fe-Cr-Zr and Fe
V-Zr is 2-3 times greater than that of the well known sulfated Fe-Mn-Zr [81]
14

1.6 DETERMINATION OF ACID-BASE PROPERTIES; TITRATION
METHODS
The simplest and most widespread method of the acid strength determination
for a solid catalyst involves a collaboration of suitable colour indicator
adsorbed on its surface, as the acidity of a solid catalyst is manifested by the
conversion of an adsorbed neutral base into its conjugated acid. When the
indicator (B) reacts with a Bronsted acid (AH) to form corresponding
conjugate acid HB” and base A-, the acid strength is expressed by the Hammett
acidity function in the following way,
H., = pKa + log B/BH’
and in the case of the interaction with a Lewis acid site
H., = pKa + logB/AB,
where B is the concentration of the neutral base which reacted with Lewis acid
or electron pair acceptor A.
The amount of acid on a solid is usually expressed as the number or
mmol of acid sites per unit weight or unit surface area of the solid, and is
obtained by measuring the amount of base which reacts with the solid acid.
Each of a series of Hammett indicators in dilute benzene solution is added to
separate samples of the dried solid suspended in benzene and the resulting
colour is noted. If the colour is that of the acid form of the indicator, then the
value of Ho fimction of the surface is the same or lower than the pKa of the
conjugate acid of the indicator Then lower the pKa of the colour changing
indicator is, the greater the acid strength of the solid. The use of various
indicators with different pKa values enable us to determine the amount of acid
at various acid strengths by amine titration method. This method gives the sum
15

ofthe amounts ofboth Bronsted and Lewis acid sites, since both proton donors
and electron acceptors on the surface will react with either the electron pair (
N=) ofthe indicator or that of amine ( sN:) to form coordination bond [82].
The basic strength of a solid surface is defined as the ability of the
surface to convert an adsorbed neutral acid to its conjugate base, i.e. the ability
of the surface to donate an electron pair to an adsorbed acid. For the reaction
of an acid indicator BH with a solid base B,
BH + B c> B + BH', the basic strength H ofB is given by equation,
H = pKa + log B’/BH, where BH is the concentration of the acidic form of
the indicator and B is the concentration of the basic form. The amount of
basic sites at various basic strength can be obtained by titrating a solid base
suspended in benzene with benzoic acid or tiichloroacetic acid using an
appropriate acidic indicator
Both acidic and basic property can be determined on a common H0
scale, where the strength of basic sites is expressed by the Ho of the conjugate
acid sites. It was found that the strongest H0 value of the acidic sites was
approximately equal to the strongest H0 value of the basic sites. The equal
strongest I-10 was termed “Ho.,m” which is a practical parameter to represent
acid-base properties of the solid surfaces. The acidity at an H, value shows the
number of acid sites whose acid strength is equal to or less than the H0 value
and the basicity at an H0 value shows the number of basic sites whose basic
strength is equal to or greater than the Ho value.
16

1.7 ALCOHOL DECOMPOSITION AS A TEST REACTION TO
PROBE ACID — BASE PROPERTIES
Model reactions are recommended as the best method for characterising
industrial acid catalysis. In the decomposition of alcohols over various metal
oxides Ai el al defined the ratio of dehydrogenation rate to the dehydration rate
as a measure of the basicity of the catalyst and the dehydration rate as a
measure of the acidity This conclusion is drawn from the fact that the
dehydrogenation take place with the intervention of both acidic and basic sites
through a concerted mechanism [83]. Gervasini et al have studied isopropanol
decomposition as a test reaction for a number of metal oxide systems and
classified them in scales of acid strength [84]. Not only the nature of sites on
the catalyst surface but the structure of alcohol also determine the reaction
mechanism. Stronger acid sites and more stable tertiary carbenium ions result
in E. mechanism, whereas the E2 mechanism consists of a one step concerted
reaction which require the simultaneous involvement of both acid and basic
sites. However the above mentioned mechanisms are rarely distinguishable and
quite often an intermediate situation occur particularly with E1 and E2 pathways
[85]. Dehydration is favoured over oxides with small, highly charged cations
while dehydrogenation has been associated with large more polarisable cations
such as alkaline earth ions [86]. It has been postulated that acidic OH groups
are required for dehydration. Exposed cations may be needed for
dehydrogenation and in some cases also for dehydration. As a measure of the
base strength of metal oxides Davis suggested the alcohol conversion
selectivity [87]. The amount of 1-alkene produced by water elimination was
proposed to depend on the base strength. Thus studies on alcohol
decomposition may be used to define some of the properties of certain surfaces
and to elucidate the nature of the catalytic sites which are present.
l7

Kibby and Hall conceived the dehydrogenation reaction over hydroxy
apatite catalyst to be as follows. The alcoholic proton is discharged to the
basic site and hydrogen atom at the alpha carbon is discharged to the acidic
site. The transition state has a high electron density as can be deduced from the
positive slope of the linear relation between the logarithms of reaction rate and
Tafi inductive factor for substitution at ot-carbon. This is found to be
consistent with the rate determining transfer of a hydride ion from an adsorbed
alkoxide [88]
The selectivities of dehydration and dehydrogenation products may be
determined by employing a series of alcohlos. They provide a finger print of a
catalyst which if properly related to its structure and chemistry can provide
much useful infonnation concerning the way in which it functions.
1.8 OXIDATIVE DEHYDROGENATION OF ETHANOL,
CYCLOHEXANOL,ETHYLBENZENE AND CYCLOHEXANE
Dehydrogenation is a reaction in which hydrogen is eliminated from a molecule
in the form of dihydrogen or its reacted form by a hydrogen acceptor such as
oxygen. The first one is a case of simple dehydrogenation and the second one
is known as oxidative dehydrogenation. In the case of oxidative
dehydrogenation since the rate determining step is probably the elimination of a
proton, the basicity of the catalyst plays an important role, besides the redox
properties of the catalyst. So acid base properties of catalysts in general play a
significant role not only in acid base catalysis but also in oxidation catalysis.
The mechanisms in which acidity or basicity take part in oxidation catalysis may
be classified into two categories, (i) activation of one or more of the reactants
or products and intermediates and (ii) acceleration of one or more of the
reaction paths involved in overall oxidation reactions.
18

However, very few studies have been attempted concerning the
quantitative relationship between the basicity and catalytic activity Acid - base
properties of catalysts in general play significant roles not only in acid-base
catalysis but also in oxidation catalysis. Acidic or basic substances such as
P305 or K salts are added to industrial oxidation catalysts in order to improve
catalytic performance [89]. These additives suppress side reactions and deep
oxidation by adjusting the acid base properties of the catalysts surfaces.
According to Al er al the correlation between the catalytic activity and acid
base properties of the catalyst can be explained by the strength of acid base
interaction between reacting molecules (reactants or products) and catalyst
surface [90]. In the case of oxidation of butadiene which is basic, the catalytic
activity increases with the acid amount of the catalyst. According to the
investigators the more acidic catalysts interact with basic butadiene and activate
it more easily Similarly the oxidation activity of acidic reactants such as acetic
acid can be correlated with the base amounts.
Styrene is produced industrially by simple dehydrogenation of
ethylbenzene using catalysts containing Fe oxides as the main component (Fe
Cr-K, Fe-Ce-Mo, Fe-Mg-K) or Ca-Ni phosphate in presence of steam.
According to Lee et al the promoting effect of alkali metals were in the order
C5 > K > Na > Li and this order is the order of increasing basicity [91].
According to Tagawa er al the acid sites of Ho between 1.5 and -5.6 are
proven to be the active sites to adsorb ethylbenzene reversibly, whose oxidation
on the other hand, occurs on the base sites of pKa between 17.2 and 26.5 [92].
The absolute activities of all rare earth oxides are quite low in the
dehydrogenation of ethyl benzene and appreciable reactant conversion does not
occur below 450°C [94]. In the dehydrogenation of cyclohexane good
correlation between the rate of dehydrogenation and the acid amount was
obtained by Chang et al [93]. McGough er al found that the lanthanide rare
19

earth oxides are uniformly active for the dehydrogenation of cyclohexane and
that the catalytic activity is notably independent of crystal structure,
paramagnetism and in the case of praseodymium, it is independent of the
valence state, within experimental error According to the authors, the activity
of rare earth oxides is associated with bonding involving the outer 5s and 5p
electrons and that bonding is localised to specific ions in the sense that it is
relatively unaffected by defect structure and crystal field splitting arising from
neighbouring ions [95]. Oxidative dehydrogenation of ethanol gives
acetaldehyde and acetic acid as oxidation products alongwith small quantities
of dehydration products. It is reported that higher content of antimony oxide
(32%) in oxide mixture of two metallic units of Sn and Mo shows higher
selectivity towards acetaldehyde and acetic acid E 67%. Sb2O4 brings about
the increase of activity and selectivity due to spillover oxygen [96]. Vanadium
containing catalysts are the most widely studied systems in the oxidation of
ethanol. Nakagawa et (1! studied the promoting effect of V205 in the oxidation
of ethanol and the promoting effect is attributed to the formation of amorphous
or two dimensional vanadium oxide. According to the authors oxygen in the
surface V=O species act as basic sites in ethanol dehydrogenation [97].
1.9 ALKYLATION OF PHENOL, ANISOLE AND ANILINE WITH
METHANOL
The alkylation of phenol is a very important reaction industrially and alkyl
phenols are used widely in a variety of applications such as antioxidants,
herbicides, insecticides or polymers. Depending on the catalysts, reaction
conditions, and alkylating agents prevailing ortho or para monoalkylated, 2,4 or
2,6 dialkylated and 2,4,6 trialkylated products are formed [98]. Alkylation of
aniline is also an industrially important reaction, as alkylated products are vital
precursors for bigger organic and drug molecular build ups [99]. Alkylation of
aniline and phenol usually yield mono and dialkylated products both at the ring
20
and at the side chain depending on the acidity Large number of metal oxides
were reported for aniline [100] and phenol (101) alkylations. In most cases
anisole is an abundant product isomerisation of anisole to cresols was
considered as an interesting process to be possibly realised as an alkylation of
phenol by anisole. The anisole conversion to cresols can be an intermolecular
reaction with phenol or an intramolecular rearrangement.
1.10 REDUCTION OF AROMATICS CONTAINING DIFFERENT
REDUCIBLE GROUPS
In practice hydrogenation reactions are perfonned with homogenous or
heterogeneous catalysts employing molecular hydrogen or by transfer
hydrogenation [I02]. Transfer hydrogenation has distinct advantages over
molecular hydrogen method. It requires only mild conditions, offer enhanced
selectivity and closed pressure systems involving hazardous hydrogen gas can
be avoided. Most common of the heterogeneous catalysts is Raney nickel and
is used extensively with hydrazine hydrate or propan-2-ol [103]. But it does
not show any chemoselectivity towards the functional groups and also it leads
to the hydrogenolysis during the reduction of ketones. Recently Ni stabilised
zirconia has been reported to show chemoselectivity in transfer hydrogenation
using propan-2-ol [104]
1.11 PRESENT WORK
Metal oxide systems containing Sn and rare earths are widely used in many
oxidation reactions. Catalyst systems based on SnO2 are among the most
efficient for olefin selective oxidation like isobutene to methacrolein. Rare
21

earth oxides like La2O3, Sm;;O; and C602 are employed in the oxidative
coupling of methane and oxidation of butane.
In recent years numerous studies have been devoted to the preparation
of sulfated oxides (e.g. ZrOz) and to their characterisation and catalytic
performance in various chemical reactions. ln many cases, modification with
sulfate anion generates strong acidity even stronger than 100% sulfuric acid
and hence they are useful in reactions like isomerisation, low temperature
esterification, alkylation and cracking.
Single oxides like ZrOz, SnO2, HfO2, Fe2O_~. and A120; generates strong
acid sites upon sulfate treatment. Addition of another metal component
enhances the activity of these oxides (metal promoted sulfated oxides)
However reports on the acid-base and catalytic activity of systems based on
sulfated tin oxide is very sparse. Since SD02 and Fe2O; are useful as oxidation
catalysts, their sulfated analogues can show enhanced activity in such reactions.
Hence a study relating to the promoting effect of rare earth oxide and sulfate
anion on the activity of SnO2 will be interesting.
l.l2 MAIN OBJECTIVES OF THE WORK
The main objectives of the present work are the following .-
* To prepare binary mixed oxides containing varying amount of Sn and rare
earths (La and Sm) and modify them by sulfate treatment by difierent methods
and also to investigate the physico-chemical characteristics of these oxides
using instrumental techniques viz. XRD, EDX, TG-DTA, BET-SA, IR, SEM
and pore volume measurements.
22
** To compare the acid base properties of mixed oxide systems and their
sulfated analogues employing alcohol decomposition as a test reaction.
** Attempts concerning the possibility of employing sulfated oxides with redox
properties in oxidation reactions is very limited. So another objective of the
present work is to find out the etfect of sulfate treatment on the catalytic
activity of aforementioned systems in some oxidation reactions like oxidation
of ethanol. cyclohexanol, ethylbenzene and cyclohexane.
** Anisole, which is a by-product in the alkylation of phenol, could be
converted into more usefiJl products like 2,6 xylenol avoiding the formation of
dealkylated product, phenol. Hence alkylation of anisole with methanol is
carried out to produce 2,6 xylenol selectively.
** To understand the effect of newly created strong acid sites in the alkylation
of phenol, anisole and aniline with methanol.
** Another objective is to highlight the merits and demerits of sulfate treatment
including deactivation studies.
23

REFERENCES
IO
11
12.
13
J. Haber, “Perspectives in catalysis", Blackwell scientific publications, 1992,
371
A. Bielanski, J.Haber, “Oxygen in catalysis", Dekker, New York, 1991. “New
developments in selective oxidations", (Eds.) G. Centi, F Trifiro, Elsevier,
1990; A. Bielanski, J .Haber, Catal. Rev 19 (1979) 1, H. H. Kung, “Transition
metal oxides-surface chemisry and catalysis" Elsevier. 1988
C. L Thomas, Ind. Eng. Chem, 41 (1949) 2564.
K. Tanabe, T Takeshita., in “Advances in catalysis", Academic press, New
York, 17 (1967) 315.
A. K. Chetam, P Day, “Solid state chemistry teclmiques"., Oxford University
press, 1987
P Courty, C. Marcilly, in “Preparation of catalysts" Stud. Surf. Sci. Catal., 1
(1976) 119.
L. Hench, J. K. West, Chem. Rev., 90 (1990) 33.
C. N. R. Rao, J. Gopalakrishnan, Acc. Chem. Res, 20 (1987) 228
R. Gopichandran, K. C. Patil, Mater Lett., 12 (1992) 437
D W Johnson, P K. Gallogher, F Schrey, W W Rhodes, Am. Ceram. Soc.
Bull., 55 (1976) 520; A. A Balandin, Advan. Catal. Academic press, New
York, 10 (1958) 95.
L. T Weng, N. Spitaels, B. Yasse, J. Ladriere, P Ruiz, B. Delmon, J Catal.,
132 (1991) 319
M. J. Fuller, M. E. Warwick, J.Catal., 29, (1973) 441, E. W Thorton, P G.
Harrison. J. Chem. Soc. Faraday Trans. 1, 71 (1975) 461.
M. J. Fuller, M. E. Warwick, J. Catal, 39 (1975) 412; F Solymosi, J. Kiss, .1
Chem. Soc. Chem. Commun., (1994) 509.
24

K) b)
Ix) J’-‘
to 111
T Seiyama, M. Egashira, T Sakamoto, 1. Aso, J Catal., 24 (1972) 76
C Chemball, H. F Leach, 1. R. Shannon, J. Catal, 29 (1973) 99
T Seiyama, M. Egashira, T Sakamoto, I. Aso, J. Catal., 24 (1972) 76
C Chemball, H. F Leach, l. R. Shannon, J. Catal, 29 (1973) 99
E. W Thorton, P G Harrison,J Chem. Soc. Faraday Trans. 1, 71 (1975) 2468
M. ltoh, H. Hattori, K. Tanabe, J Catal., 43 (1976) 192.
G W Wang, H. Hattori, K. Tanabe, Bull. Chem. Soc. Jpn., 56 (1983) 2407
K. Takashi, M. Shibagaki, H. Kuno. H. Matsushita, Bull. Chem. Soc. Jpn.. 67
(1994) 1107
M. J Fuller, M. C. Warwick, J. Catal, 39 (1975) 412.
M. J. Fuller, M. C Warwick, J. Catal., 29 (1973) 441
D J Hucknall “Selective oxidation of hydrocarbons”, Academic press, London.
1974
K. Kaneko, T Koyama, H. Furukawa, S. Wada, Nippon Kagaku Kaishi.. 1 105
(1974) 1111
J Builen, J.Catal., 10 (1968) 188.
Y Marakami, M. Inagaki, K. Iwayama, H. Uchida, Shokubai., 12 (1970) 89
K. Wakabayeshi, Y Kamiya, N. Ohta, Bull.Chem.Soc.Jpn., 40 (1967) 2172; 41
(1968) 2776.
T Seiyama, T Uda, I. Mochida, M. Egashira, J.Catal., 34 (1974) 29
M. Ai, J.Cata1., 40 (1975) 318.
G. C Bond, M. J Fuller, 1. R. Molly, Proc. 61/1 intern. (.‘0ng.on (.7ataly.s'i.s', I
(1997) 356.
L. T Weng, N Spitaels, B. Yasse, J. Ladriere, P Ruiz, B. De1mon,J.Cata1.,
132 (1991) 319
T Seiyama. M. Egashira, T Sakamoto, J Aso, J.Catal., 24 (1972) 76.
D G. Tatke, J. J .Rooney, Chem. Commun., (1969) 612, G. W Wang, H.
Hattori, K. Tanabe, Chem.Lett., (1983) 959
P W Selwood, J. Catal., 22 (1971) 123.
K. M. Minachev, E. G. Vakk, R. V Dmitrier, E. A Nasedkin, Izv.Akad.Nauk,
25

37
38.
39
40
41
43
44
45
46.
47
48.
49
50
51
52
54
55
56
57
SSSR, Serkhim., 3 (1964) 421
D. R. Ashmead, D. D Eley, R. Rudham, J Catal., 3 (1964) 280
K. M. Minachev, “Catalysis", J W High Tower, North Holland, (1973) p 219
Y S. Kodakov, V K. Nosteror, K. M Minachev, Izu. Akad Nauk SSSR
Serkhim, 9 (1975) 2012.
J. F Road, J Catal., 28 (1973) 428, E. R. S Winter, J Catal. 22, (1971) 158
J. F Road, R. E. Conrad, J Phys. Chem., 76 (1972) 2199
E. V Aratamonov and L. A. Sazonov, Kinet. Katal 8 (1967) 131
K. M. Minachev, D A. Kondrat’ev, G. V Antoshin, Kinet. Katal., 8 (1967)
131, H. Hattori, J. Inoko, Y Murakami, J. Catal., 42 (1976) 60
H. Hattori, H. Kumai, K. Tanabe, G Zheng, Proc. 8th National Symp Catal.
India, Sindri, (1987) p.243, K. Tanabe, M. Misono. Y Ono, H Hattori. “New
solid acids and bases”, Kodansha, Elsevier, New York, ( 1989) p-43
Y Wakano, T Lizuka, H. Hattori, K. Tanabe, J. Catal., 57 (1978).
H. Vinek, H. Nolle, M. Ebel, K. Schwarz, J. Chem. Soc. Faraday Trans. 1, 73
(1997) 734.
J. E. Delmire, J. Phys. Chem, 91 (1987) 2883.
F Le. Normand, J. Harrauh, R. Breauoh, I. Hilaire, A. Kiennemann, J
Phys.Chem., 95 (1991) 257
K. Tanabe, K Saito, J Catal., 32 (1974) 144
G. W Keulks, J. Catal., 19 (1971) 232.
M. I. Zaki, N. Shepard, J. Catal., 80 (1983) 114.
R. Zhang, H. Hattori, K. Tanabe, Bull Chem Soc Jpn., 62 (1989) 2070
Y F F Yao, J. Catal., 87 (1984) 152.
R C. H. Lin, K. D Campell. J. X. Weng, J. H. Lunsford, J Phys. Chem. 90
(1986) 534
K. M. Minachev, Proc. Int. Congr. Catal., 5th (1973) 219
T T Bakumenko, 1. T Chachenokova, Kinet. Katal.. 10 (1969) 796.
V I. Lazukin, K. M Kholyavenko, M. Y Rabanik, A. I Khanik, Katal., 29
(1971).
26

58.
59
60.
61
63
64
65
66
67
68.
69
70
71
72.
74
75
K. Tanabe, M. Misono, Y Ono, H. Hattori, “New solid acids and bases"
Kodansha, Elsevier, New York, (1989) p-18, 265
K Morikowa. T Shirasaki. M. Okada. Adv Catal., 20 (1969) 97
K. Tanabe, M. Misono, Y Ono, H. Hattori, Stud. Surf. Sci. Catal., 51 (1989).
M. Hino, S. Kobayashi, K. Arata, J. Am. Chem. Soc.,10l (1979) 6439, J
Chem Soc. Chem. Commun, 851 (1980).
G. A. Olah, G. K. S Prakash, J. Sommer, “Superacia'.s"' John Wiley & Sons.
Newyork, (1985).
A. Corma, Chem. Rev 95 (1995) 559 , X. Song, A.Sayari, CHEMTECH
(August1995) 27; K. Tanabe, H. Hattori, T Yamaguchi, Crit. Rev Surf.
Chem.,1 (1990) 1
K. Tanabe, M. Misono, Y Ono, H. Hattori, Stud. Surf. Sci. Catal., 51 (1989)
199
H. Matsuhashi, M. Hino, K. Arata, Chem. Lett., (1988) 1027
K. Arata, M. Hino, Appl. Catal., 59 (1990) 197
K. Arata, M. Hino, React. Kinet. Catal. Lett., 25 (1984) 143.
S. Baba. Y Shibata, T K Awamura, H. Takaoka, T Kimura, K. Kousaka, Y
Minato, N. Yokoyama, K. Lida, T Imai., EP 17478369 (1986).
J R. Sohn, H. W Kim, J T Kim, J. M01. Catal., 41 (1987) 375.
J. R. Sohn, Y I. Pae, M. Y Park, S. G Jo, React. Kinet. Catal. Lett., 55 (1995)
325
J. R. Sohn, H. J. Jang, J. M01. Catal., 64 (1991) 349
M. Y Wen, I. Wender, J W Tierney, Energy Fuels, 4 (1990) 372.
A. Pate1,G. Coudurier, J. Vedrine, Abstr. Book I 4th North Am. Meeting (‘ma/.
Soc, Snowbird, Utah, June (1995), p-A67
C Y Hsu, C. R. Heimbuch, C. T Armes, B. C Gates, J Chem. Soc. Chem.
Commun., 1645 (1992); E. J. Hollstein, J. T Wei, C. Y Hsu, US Patent
4918041 (1990); 4956519 (1990).
X. Song, Ph.D. dissertation, University Laval, 1995; K. Arata, M. Hino, Mater
Chem. Phys., 26 (1990) 213, K. Arata, Trends Phys. Chem., 2 (1991) 1
27
76.
77
78
79
80.
81
83
84
85
86
87
88
89
90.
91.
92.
93
94
95
96
97
T Lopez, J Navarrete, R. Gomez, Appl. Catal. Gen, 125 (1995) 217
D. A. Word, E. 1. K0, J Catal., 150 (1994) 18.
J. E. Tabora, R. J Davis, J. Chem. Soc. Faraday Trans. 1, 91 (1995) 1825
K. T Wan, C. B. Khouw, M. E. Davis, Abstr. Book, 209th Am. Chem. Soc.
National Meeting, part I, Pap No. COLL-186 (1995).
X. Song, K. R. Reddy, A. Sayari, J. Catal., 161 (1996).
C Miao. W Hua, J Chen, Z. Gao, Cat. Lett., 37 (1996) 187
K. Tanabe, “Solid acids" and ba.s‘c.s', their catalytic prupcrtie.s"’, Accaden1ic press.
New York, (1970); C. J. Walling, J. Am. Chem. Soc, 72 (1950) 1164, H A
Bensi, J. Am. Chem. Soc., 78 (1956) 5490.
M. Ai, Bull. Chem. Soc. Jpn., 49 (1976) 1328; M. Ai, J. Catal., 40 (1975) 318.
40 (1975) 327
A. Gervasini, A. Auroux, J. Catal., 131 (1991) 190
C. L. Kibby, w K. Hall, J. Catal., 29 (1973) 144
A. Eucken, E. Wicke, Naturwissen Schatten, 32 (1994) 161.
B. H. Davis in “Adsorption and catalysis on oxide surfaces”, (Eds.) M. Che, G
C. Bond, Elsevier, Stud. Surf. Sci. Catal., 21 (1985) 309
C. L. Kibby, W K. Ha11,J. Catal., 29 (1973) 144
K. Tanabe, M. Misono, Y Ono, H. Hattori, Stud. Surf. Sci. Catal., 51 (1989)
M. Ai, T Ikawa, J Catal., 40 (1975) 203, M. Ai, S. Suzuki, Nippon Kagaku
Kaishi., (1973), 21
E. H. Lee,CataI. Rev., 8 (1973) 285.
T Tagawa, T Hattori, Y Murakami, J. Catal., 75 (1982) 66.
R. C Chang. 1. Wang, J Catal., 107 (1987) 195
E. Sushina, T V Meshcheryakwa, Vestn. Mosk.Univ Khim., 11 (1970) 106
C. B. McGough, G. Houghton, J. Phys. Chem., 65 (1961) 1887
P A. Avasarkar, V R. Chumbhale, A. Y Sonsile, “Catalysis Modern trends”
N.M Gupta, D.K. Chakrabarty (Eds.) New Delhi p.284.
Y Nakagawa, T Ono, H. Miyata, Y Kubokawa, J . Chem. Soc. Faraday
Trasns.1, 79 (1983) 2929.
28

98
99
100.
101
102.
103.
104
H. Fiege, Ulmann in W Gerhartz, Y S Yamamoto, F T Cambell, R.
Pfeffertorn, .1 F Rounsaville (Eds.), “[:'ncycl0pedia of Industrial (,'hemisIry“
5th edn., VCH Ver1ag,vo1. 48, 1987, p.45.
S. Narayanan, V Durgakumari, A. Sudhakar Rao, Appl. Catal. A, 1 11 (1994)
133
S. Balsama, P Beltrame, P L Beltrame, Appl. Catal., 13 (1984) 161; E.
Santacesaria, D. Grasso, D. Gelosa, S. Carra, Appl. Catal., 64 (1990) 83, J M
Perera, A. Gonzalez, M. A. Burral, Ind. Eng. Chem, 7 (1968) 259
V Durgakumari, S. Narayanan, L. Guczi., Catal. Lett., 5 (1990) 377; E.
Santacesaria, M. Diserio, P Ciambelli, D Gelosa, S Carra, Appl. Catal.. 64
(1990) 101, Z. H. Fu, Y Ono, Cata1.Lett., 21 (1993) 43
R. A. W Johnstone, A. H. Wilby, I. D Entwistle, Chem. Rev., 85 (1985) 129
M. J. Andrews, C. N. Pi11ai, Ind. J. Chem, Sect. B, 16 (1978) 465.
T T Upadhya, S .P Katdare, D. P Sabde, V Ramaswamy, A. SudalaiJ
Chem. Soc. Chem. Commun., (1997) 1119
29

CHAPTER II
EXPERIMENTAL

2.1 INTRODUCTION
Heterogeneous catalysis deals with the transformations of molecules at the
interface between a solid (catalyst) and the gaseous or liquid phase carrying
these molecules. This transformations involves a series of phenomena. the
understanding and the control of which requires the study of,
(a). How the catalyst is constituted in the bulk and at its surface and what
transformation it undergoes (chemical reactions, exchange of atoms between
surface and bulk, sintering etc.)
(b) How the gaseous or liquid phase is modified ( composition. kinetics etc.)
and
(c). The nature of the interface ( adsorbed species and bonds between these
species and the catalyst surface) etc
It is known that the activity of a catalyst is greatly influenced by the
method of catalyst preparation and the conditions of pretreatment. This is
illustrated by the fact that the physical or chemical structure of a catalyst varies
with the method of preparation and that chemical species adsorbed on the
surface affect the catalyst activity profoundly [1]. The development of
powerful investigation methods (essentially physico-chemical phenomena) for
the characterisation of catalysts has been a major advance in recent years.
2.2 MATERIALS
All the catalysts were prepared from corresponding metal salts. Samarium
chloride (99.9%) and lanthanum chloride (99 9%) were obtained from Indian
rare earths Ltd, Udyogamandal, Kerala and tin (II) chloride (98%) from

Ranbaxy India Ltd. All other chemicals were purified before experiments by
standard procedures reported earlier [2].
2.3 PREPARATION OF THE CATALYSTS
2.2a Preparation of the mixed oxides
The mixed oxides were prepared from their corresponding mixed hydroxide
precursors. The co-precipitation method [3] was employed for the preparation
of mixed hydroxides. Required quantities of Sn (IV) solution and rare earth
chloride solutions were mixed, diluted with water and boiled for l0 minutes.
To this solution 1 l aq. NH; was added slowly with constant stirring to
complete the precipitation. The pH of the final solution was in the range 8.5
95 The solution was boiled for 5 minutes more and allowed to stand
overnight. This precipitate was washed several times with deionised water by
decantation method untill the precipitate was free from chloride ions. It was
filtered, dried at 110 °C for 6 hours and finally calcined at 500 °C in air for 3
hours. These oxides were then sieved to get particles of 100-200 microns mesh
size. The mixed oxides of the following compositions were prepared.
SnO2 80°/o LazO_~. 20%-----TL82 SnO2 80°/o Sm2O_~. 20%-----TS82
SnO2 50% La2O3 50"/o—----TLSS SnO2 50% Sm2O3 50%-----TS55
SnO2 20% La2O3 80°/o-----TL28 SnO2 20% Sm2O3 80%-----TS28
Sn (IV) salt solution was prepared from Sn(II) chloride by oxidation with
conc.HNO3. Sn (II) chloride was taken in a china dish and conc.HNO_~. was
added dropwise untill a pasty material is formed. It was then dissolved in
minimum amount of aqua-regia on a sand bath to get Sn (IV) solution. It was
then diluted with distilled water.
2.2b Preparation of Sulfated oxides
Sulfated oxides were prepared [4,5,6] by the following three different methods.
(i). In the first method the mixed metal hydroxide was dried at ll0 "C for 6
hours followed by another temperature treatment at 300 "C for 3 hours. IO g
ofthis material was immersed in ISO ml of 0.5 M (NH4)2SO4 solution for 3hrs
and then filtered without washing and dried at l 10 "C for 6 hours.
(ii). In the second method the catalyst precursor was the mixed metal
hydroxide itself which was dried at 90-100 °C for 2 hours. l0 g of this material
was immersed in 0.5 M (NH4)2SO4 solution for 3 hours and then filtered
without washing and dried at 11o"C for 6 hours.
(iii). In the third method 10 g of tin hydroxide dried at 90-I00 “C for 2 hours
was immersed in 3 M H2804 for 3 hours and finally evapourated to dryness
very carefiilly on a waterbath. It was then dried at 110 °C for 3 hours. The
sulfate modified SnO2 so obtained was then impregnated with rare earth nitrate
solution. The material was dried at 1 10°C for 6 hours to get rare earth modified
sulfated tin oxide.
All the catalysts were calcined at 550 °C for 3 hours, sieved to a particle size of
100-200 microns and were kept in glass ampoules.
2.4 CATALYST CHA RACTERISATION
All the catalysts were characterised by different physico-chemical techniques
viz., XRD, surface area measurements (BET), pore volume measurements.
thermal analysis (TG-DTA), IR spectroscopy (DRS), energy dispersive X-ray
analysis, scanning electron microscopy, and acidity-basicity measurements by
Hammett indicator method.
2.4a X-ray Diffraction

XRD is one of the most widely used and versatile techniques for the qualitative
and quantitative analysis of solid phases and can provide useful information
about the particle size of specific components. Other uses include the
identification of the structure of the substance, its allotropic transformation,
transition to different phases, purity of the substance, lattice constants and
presence of foreign atoms in the crystal lattice of an active component. The
principle of XRD is based on the interaction of X-ray with the periodic
structure ofa polycrystalline material which act as a diffraction grating. In this
technique a fixed wavelength is chosen for the incident radiation and Bragg
peaks are measured by observing the intensity of the scattered radiation as a
function of scattering angle of 29, the interplanar distances or d-spacings are
calculated from the values of the peaks observed from th Bragg equation,
n}. = Zdsine, where ‘n’ is the order ofreflection.
The X-ray patterns of the samples were recorded using Ni filtered Cu
Kot radiation (K = 1.5404A° ). Silicon was used as an internal standard to
calibrate X-ray line patterns.
2.4b Infrared spectroscopy
The infrared spectrum is obtained when a molecule produces a change in
dipolemoment due to vibration. It can provide valuable information about the
basic characteristics of the molecule, namely the nature of atoms, their spatial
arrangement and their chemical linkage forces. IR spectroscopy has been
extensively used for identifying various fimctional groups on the catalyst itself.
as well as for identifying the adsorbed species and reaction intermediates on the
catalyst surface. It can also be used to determine the surface acidity of
catalysts employing suitable probe molecules.
34
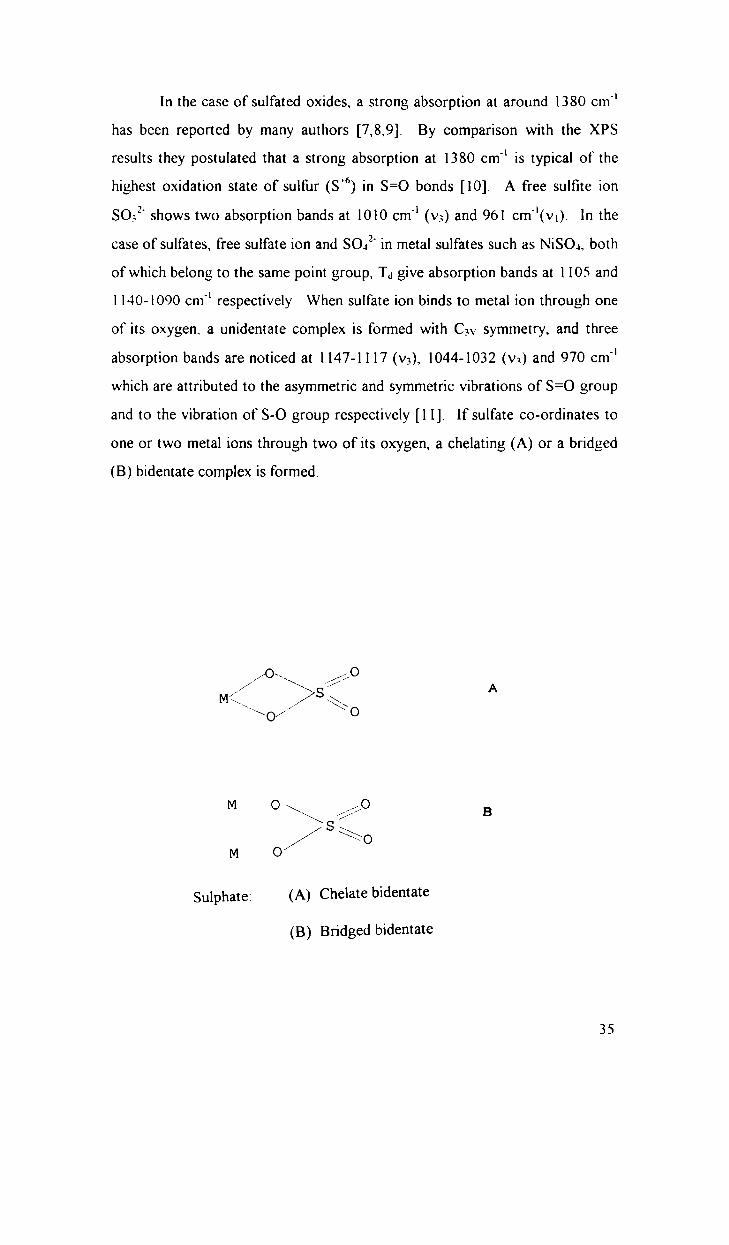
In the case of sulfated oxides, a strong absorption at around 1380 cm"
has been reported by many authors [7,8,9]. By comparison with the XPS
results they postulated that a strong absorption at 1380 cm” is typical of the
highest oxidation state of sulfur (S6) in S=O bonds [10]. A free sulfite ion
SO_-.2" shows two absorption bands at 1010 cm“ (V3) and 961 cm"(v.). 1n the
case of sulfates, free sulfate ion and S042‘ in metal sulfates such as NiSO4, both
of which belong to the same point group, Td give absorption bands at 1 105 and
1 1-40-1090 cm" respectively When sulfate ion binds to metal ion through one
of its oxygen. a unidentate complex is formed with C_w symmetry, and three
absorption bands are noticed at 1147-1117 (V3), 1044-1032 (V3) and 970 cm"
which are attributed to the asymmetric and symmetric vibrations of S=O group
and to the vibration of S-O group respectively [1 1]. If sulfate co-ordinates to
one or two metal ions through two of its oxygen, a chelating (A) or a bridged
(B) bidentate complex is formed.
/’O‘\\ _//20M’: />5 A1 \O// O
M o \\ //////.0 B\ s/ X0oM
Sulphate: (A) Chelate bidentate
(B) Bridged bidentate
35

A chelating bidentate complex (A) has four absorptions at 1240-1230
(v_~.), 1125-1090 (V3), 1035-995 (V3) and 960-940 cm" (v.), which are assigned
to the asymmetric and symmetric stretching frequencies of the S=O and S-O
bonds. The bridged bidentate complex (B) also has four bands at 1 195-1160
(v;), 1110-1105 (V3,). 1035-1030 (V3), and 990-960 cm" (V1). The highest v~.
frequency in the chelating bidentate complexes is higher than that in the case of
bridged bidentates [12]. Organic sulfates and molecular H2804 belong to the
same point group C2»-, show four absorptions at 1440-1350, 1230-1150, 960
1000 and around 910 cm" The characteristics of these species are the
remarkably high S=O stretching frequencies (asymmetric at 1440-1350 cm"
and symmetric at 1230-1150 cm") well above those of inorganic sulfate
complexes.
The IR spectra were recorded using a FTIR spectrometer (Perkin Elmer
Series1600) in the range of 400-1700 cm" using nujol mull techniques. 20 mg
of the sample was taken mulled with nujol to form a homogenous mixture and
was applied to KBr plates to record the spectrum. In some cases material was
pelletised with KBr and spectra were taken. Diffuse reflectance spectra (DRS)
were taken by supporting the pure sample on a sample holder
2.4c Thermal analysis
Thermography has found wide importance in different fields of science. In
chemistry it is used to determine phase composition, hydration, polymerisation,
solvent retention, purity, meltingdecomposition etc. The most commonly used
thermal methods are thermogravimetry(TG) and differential thermal
analysis(DTA). In TG the weight of a substance heated at a controlled rate is
36

recorded as a function of time or temperature. The information that can be
obtained from the TG curve is as follows.
i. The curved portions in the graph indicate weight losses.
ii. Weight loss can be used to determine the composition of a compound.
iii. lfthere is no weight loss at a particular temperature it can throw light on its
thermal stability
iv It can also give information about the procedural decomposition
temperature (the lowest temperature at which cumulative mass change attains a
magnitude which the thermobalance can easily read out).
DTA is a technique in which the temperature difference between the
sample and a thermally inert reference substance is continuously recorded as a
function of fiirnace temperature or time. The measurement of changes in heat
content is carried out by heating the two materials at elevated temperatures at a
predetermined rate. The thermal effects may be either endothermic or
exothermic and are caused by physical phenomenon such as fusion, crystalline
structure inversions, boiling, vapourisation, sublimation and others. Some
enthalpic effects are also caused by chemical reactions such as dissociation or
decomposition, oxidation, reduction, combination and displacement etc. In this
manner endo and exothermal bands and peaks appearing on the thermograms
give informations regarding the detection of enthalpy changes. It has been
found that most of the above transitions or reactions produce endothermic heat
effects. Only a few such as oxidation, some decomposition reactions, certain
crystalline inversions give exothermic heat effects.
Simultaneous TG-DTA analysis of the samples were performed on a
automatic derivatograph (SETARAM TG-DTA92). The thermograms of the
samples were recorded under the following conditions, weight of the sample
37

30mg, heating rate-10 K/minute, atmosphere-air flow. <1-Alumina was used as
the reference material.
2.4d Scanning electron Microscopy
This technique allows essentially the imaging of the topography of a solid
surface by use of back scattered or secondary electrons, with a good resolution
of about Snm. In the SEM a fine probe of electrons is scanned over the
specimen surface using deflection coils.
Interaction between the primary beam and the specimen produces
various signals(back scattered electrons, secondary electrons, X-ray etc.) which
may be utilized to form an image. The appropriate signal is detected, amplified,
and displayed on a cathode ray tube screened synchronously with the beam
The incorporation of wavelength or energy dispersive X-ray detectors with the
SEM provides a powerful analytical facility
In the present study the morphology and crystal size of the samples
were investigated using a Scanning Electron Microscope (Stereoscan 440
Cambridge,UK).
2.4e Surface area measurements
Omnisorb 100 CX (supplied by COULTER Corporation, USA) unit was used
for the measurement of N2 adsorption to determine surface areas. The samples
were activated at 673K for 2 hours in high vacuum (106 Torr ). Then the
weight ofthe sample was noted and it is then cooled to 94K using liquid N;
After this sample was allowed to adsorb nitrogen gas and the BET surface area
was calculated.
38

The general form of BET equation can be written as follows.
1/V,,,,(p,,-p) = 1/VMS + [C-1/VMS] p/p., where,
V“, = volume of the gas adsorbed at pressure p,
p, = saturated vapour pressureV,,, = volume of the gas adsorbed for monolayer coverage
C = BET constantBy plotting the left side of the above equation against p/p.,, a straight line is
obtained with a slope of C-I/V,,,C and an intercept of l/V,,.C The BET surface
area is calculated using the following formula,
s.,..;T = X“_N.A,,..10'2"
where N is the avagadro number, A... is the cross sectional area of the adsorbate
molecule and XM is the number of moles of N2 adsorbed.
2.4!‘ Pore volume measurements
According to Dubinin [l3] pores can be classified according to their diameter,
as micropores (<20 A°),mesopores (20-200 A0) and macropores (>200A").
The adsorption behaviour of a solid is largely determined by the number, shape
and size of the pores. In the present study Mercury porosimeter is used for
determining pore size distribution of the catalysts. A wetting liquid like water
or alcohol will enter into a capillary on its own because of the hydrostatic
pressure difference. For a non-wetting liquid like mercury, sufficient pressure
will have to be applied to force it into the capillary. The relation between the
pore radius(r,,) and the radius of the meniscus (r,) is obtained by,
rp =—rs cosG (1)2VAp =—‘ (2)
S
expressing in r,,
39

Ap = ZYCOSU (3), where ‘G’ is the contact angle of mercury and solid.In
The above equation allows to calculate the pressure that will be needed to force
mercury into pores of radius,r,,. In this instrument, the solid sample is
immersed in a reservoir of mercury, the upper part of which ends in a narrow
capillary The upper part of mercury is in contact with a conducting wire just
touching the mercury surface. As pressure is applied, the wire loses contact
with mercury cutting of the electrical circuit. The wire is then lowered by a
micrometer arrangement till the contact is made. The difference in volume in
the capillary is the volume ofthe pore occupied by mercury under pressure.
Measurements of specific surface area and pore size distributions of the
catalysts were carried out using Quantachrome, Autoscan-92 porosimetry
(USA) by taking 300—400mg of sample. Accurate data acquisition was made as
the instrument is connected through a computer
2.4g Determination of acidity and basicity by Hammett indicator method
The indicators used for determining the acidity and basicity are summarised in
tables 2.1 and 2.2. Two drops of 0.] % solution of the indicator in benzene
was added to 0.1 g of solid suspended in Sml dry benzene and allowed to stand
for five minutes. The acidity at various acid strength of the solid was measured
by titrating with a 0.1 N solution of n-butyl amine in benzene. In all cases
titration was continued untill a permanent colour change is obtained. It took
about [0 hours for each titration. At the end point the basic colour of the
indicator appeared [14].
40
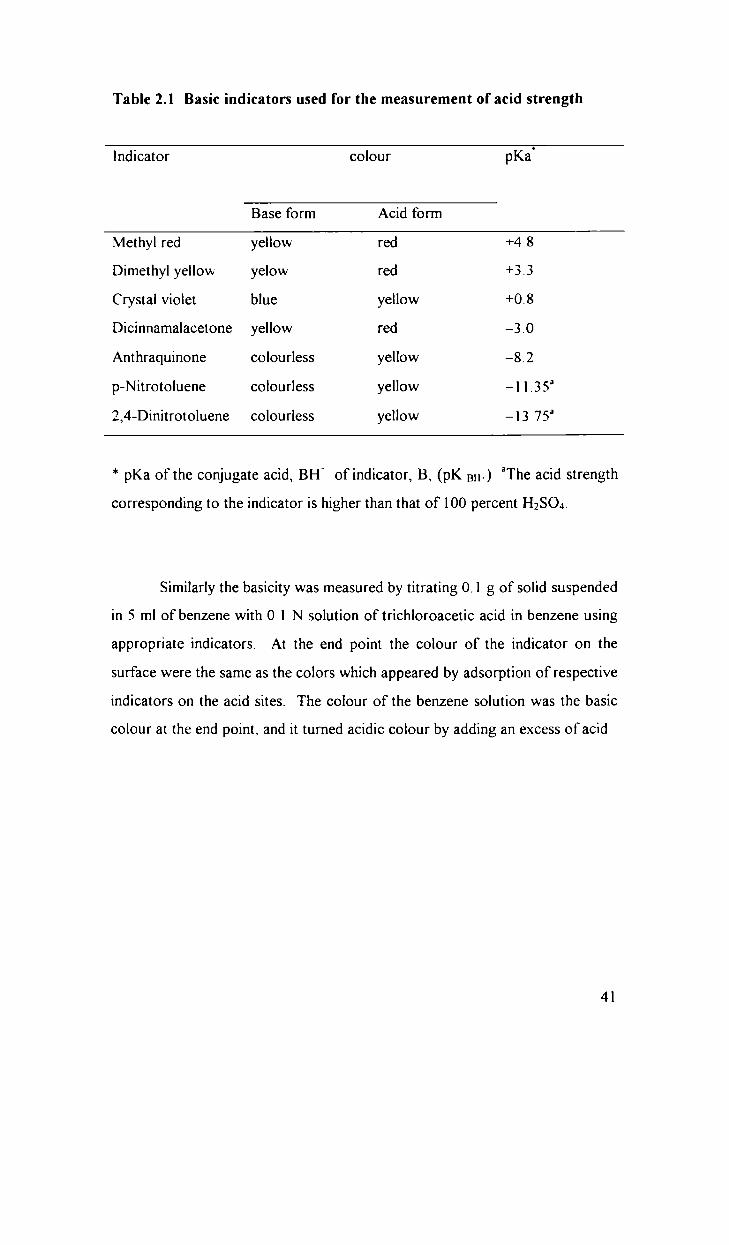
Table 2.1 Basic indicators used for the measurement of acid strength
0lndicator colour pKaBase form Acid form
Methyl red yellow red +4 8Dimethyl yellow yelow red +3.3Crystal violet blue yellow +0.8Dicinnamalacetone yellow red -3.0Anthraquinone colourless yellow -8.2p-Nitrotoluene colourless yellow -1 1.35’2,4-Dinitrotoluene colourless yellow -13 75“
* pKa of the conjugate acid, BH' of indicator, B, (pK 3”.) ‘The acid strength
corresponding to the indicator is higher than that of 100 percent H2804.
Similarly the basicity was measured by titrating 0.1 g of solid suspended
in 5 ml of benzene with 0 1 N solution of trichloroacetic acid in benzene using
appropriate indicators. At the end point the colour of the indicator on the
surface were the same as the colors which appeared by adsorption of respective
indicators on the acid sites. The colour of the benzene solution was the basic
colour at the end point, and it turned acidic colour by adding an excess of acid
41
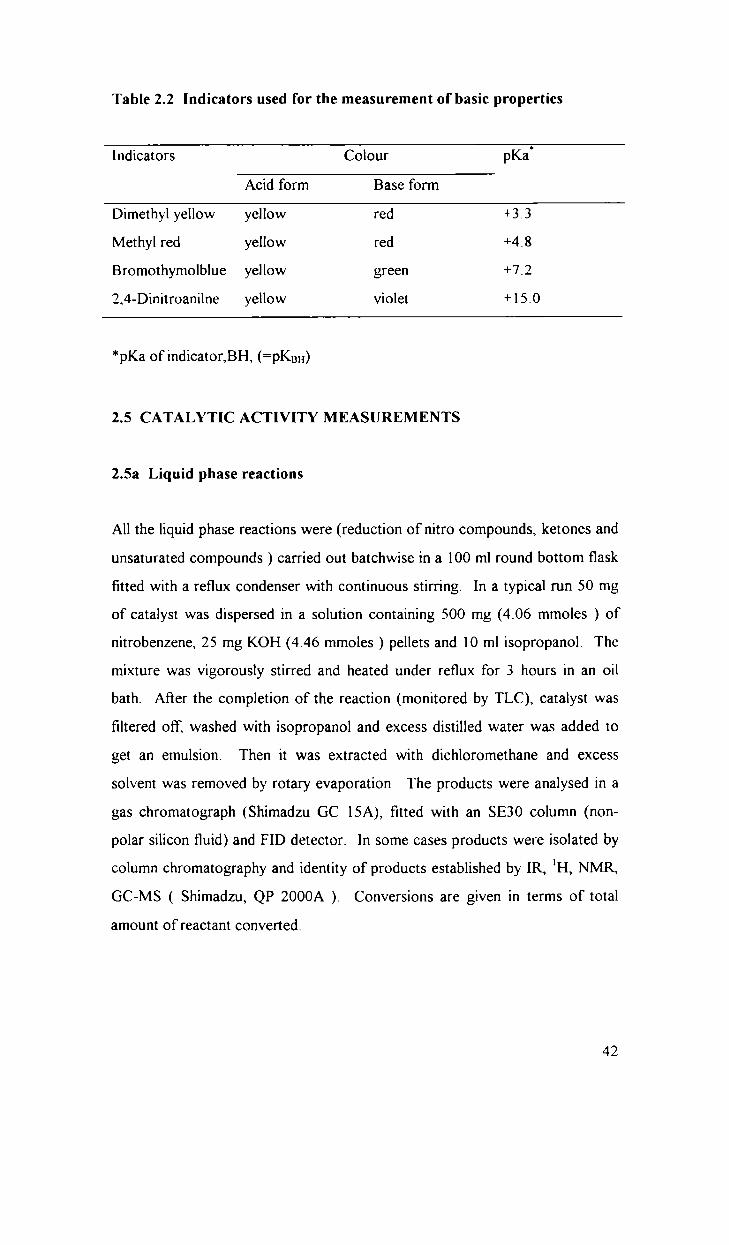
Table 2.2 Indicators used for the measurement of basic properties
0Indicators Colour pKaAcid form Base fonn
Dimethyl yellow yellow red +3.3Methyl red yellow red +4.8Bromothymolblue yellow green +7.22,4-Dinitroanilne yellow violet +1 5.0
*pl(a of indicator,BH, (=pKBH)
2.5 CATALYTIC ACTIVITY MEASUREMENTS
2.5a Liquid phase reactions
All the liquid phase reactions were (reduction of nitro compounds, ketones and
unsaturated compounds ) carried out batchwise in a 100 ml round bottom flask
fitted with a reflux condenser with continuous stirring. In a typical run 50 mg
of catalyst was dispersed in a solution containing 500 mg (4.06 mmoles ) of
nitrobenzene, 25 mg KOH (4.46 mmoles ) pellets and 10 ml isopropanol. The
mixture was vigorously stirred and heated under reflux for 3 hours in an oil
bath. Afier the completion of the reaction (monitored by TLC), catalyst was
filtered off, washed with isopropanol and excess distilled water was added to
get an emulsion. Then it was extracted with dichloromethane and excess
solvent was removed by rotary evaporation The products were analysed in a
gas chromatograph (Shimadzu GC 15A), fitted with an SE30 column (non
polar silicon fluid) and FID detector. In some cases products were isolated by
column chromatography and identity of products established by IR, ‘H, NMIL
GC-MS ( Shimadzu, QP 2000A ). Conversions are given in terms of total
amount of reactant convened.
42

2.5b Gas phase reactions
All the vapour phase reactions were carried out in a vertical flow-type reactor
consisting of 2.2 cm [.D and 30 cm length, kept in a cylindrical furnace
mounted vertically The catalyst (2.5-3 grams as pellets) was loaded in the
middle of the reactor and packed with glass beads. The temperature was
measured by a thermocouple placed in the middle of the catalyst bed Before
each experiment catalyst was activated in a current of dry air at 500 "C for
6hours and then brought to the reaction temperature in presence of nitrogen
flow The reactant feed was introduced at the top of the reactor by means of
an infusion pump (SAGE, USA) in the absence of any carrier gas. Afier the
reaction, products were cooled using ice cooled water in a condenser
connected to the reactor and collected at the bottom in a sample tube for
analysis. The mass balance was noted each time. The products were analysed
in a gas chromatograph (GC 15-A) fitted with FID and TCD The gas
products were collected using an ORSAT apparatus. The analysis was fiirther
confirmed by GC-MS and GC-FTIR. After each experiment the same catalyst
was reactivated at 500°C in dry air for subsequent runs. A schematic diagram
of the reactor set up used in the present study is shown.
43
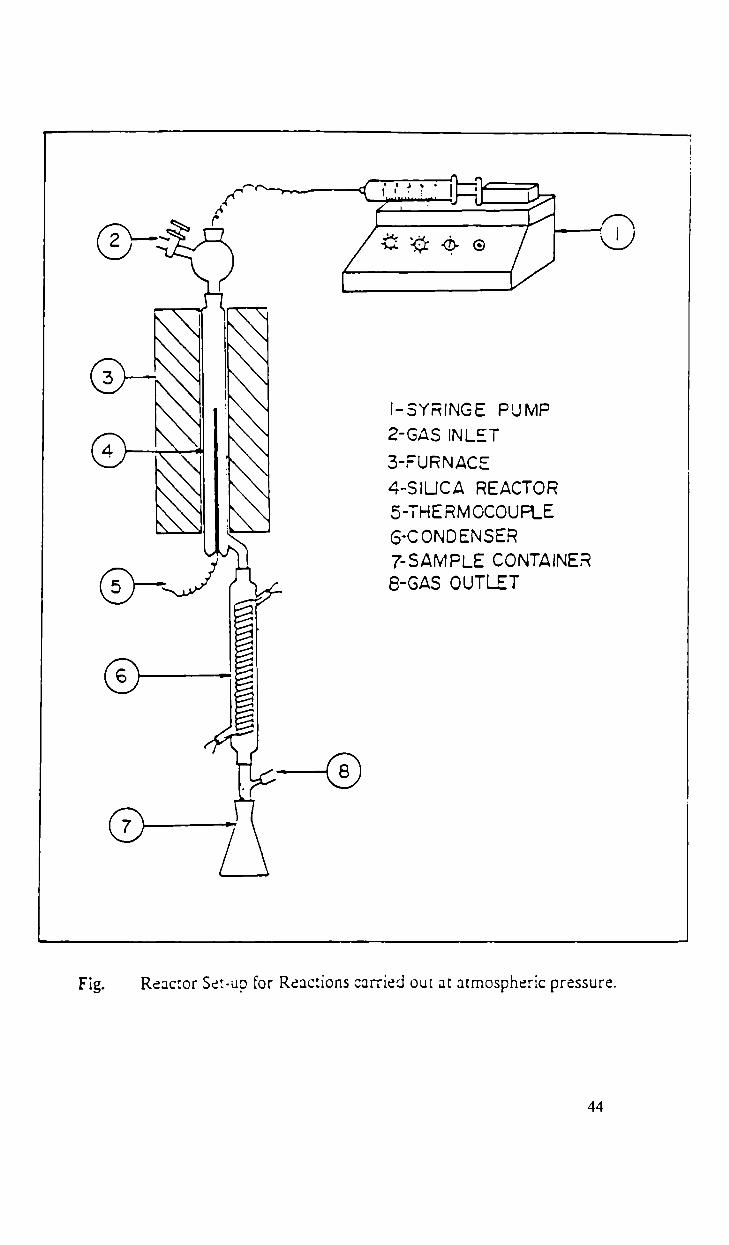
<2 @ <59
////777/J
I-SYRINC-E PUMP2-GAS INLET
3-FURNACE4-SILICA REACTOR5-THERMOCOUFLEGCONDENSER7-SAMPLE CONTAINER8'6/AS OUTLET
Fig. Reactor Sc:-up for Reactions carried out at atmospheric pressure.
44

REFERENCES
[J
D)
10.
11
12.
13
14
K. Morikawa, T Shirasaki, M. Okada, Adv Catal., 20 (1969) 97; R. J Peglar,
F H. Hambleton, J. H. Hockey, J Catal., 20 (1971) 309
D D Perrin, W L. F Armarego, D R. Perrin, in “1’uri_'ficaIi0n Qflabiiraiory
chemicals”, 2nd edition Pergamon press, 1980.
P Courty, C Marcilly, in “l’reperaii0n Qfcaialysi.s"' Stud. Surf. Sci. Catal 1
(1976) 119
H. Matsuhashi, M. Hino, K. Arata, Chem. Lett., (1988) 1027
H. Matsuhashi, M. Hino, K. Arata, Appl. Catal., 59 (1990) 205
M Hino. S. Kobayashi, K. Arata,J Am. Chem. Soc, 101 (1979) 6439; M
Hino, K. Arata, J. Chem. Soc. Chem Commun., (1980) 851, M. S. Scurrell.
Appl. Catal., 34 (1987) 109; M. Hino, K. Arata, Catal. Lett., 30 (1995) 25
K. Nakamoto, “Infrared and Raman spectra of inorganic and co-ordination
compoimds", 3rd edition, Wiley, New York, (1978) 241
T Jin, Inorg. Chem. 23 (1984) 4376.
R. L. Parfitt, R. S. C. Smart, J. Chem. Soc. Faraday Trans.1, 73 (1977) 796
J R. Sohn, H. W Kim, M. Y Park, E. H. Park, J. T Kim, S. E. Park, Appl.
Catal. A General., 128 (1995) 127; D A. Ward, E. 1. K0, J. Catal., 150 (1994)
18.
N. B. Colthup, J. Opt. Soc. Am., 40 (1950) 397
R. A. Maruis, J. M. Fresio, J Chem. Phys., 27 (1957) 564
M. M. Dubinin, Chem. Rev., 60 (1960) 235.
K. Tanabe, M. Misono, Y Ono, H. Hattori, "New solid acids and bases, their
caialytic properties” (Eds) B. Delmon, J. T Yates, Elsevier, Stud. Surf. Sci.
Catal., 51 (1989).
45

RESULTS AND DISCUSSION

CHAPTER III
AC|D—BASE PROPERTIES AND CATALYTIC ACTIVITY OF
MIXED OXIDES OF TIN WITH LANTHANUM AND
SAMARIUM

3.1 PHYSICO-CHEMICAL CHARACTERISTICS
Energy dispersive X-ray analysis is used to determine the chemical composition
of all the mixed oxides prepared. The metal oxide percentage and metal
percentage are given in Table 3 1
Table 3.1 EDX analysis of metal oxide samples*
Composition TS82 TS55 TS28 TL82 TL55 TL28Atom °/o Sn 76.18 47.63 16.11 78.22 46.90 21.83
Sm 23 82 52.37 83.89La 21.78 53.10 78.47
Oxide% SnO2 76.05 44.27 14.34 78.11 45.68 17.83Sm2O:. 23 95 55.73 85.66
148.203 21.39 54.32 82.17
*All the samples were calcined at 500 °C in air
X-ray diffraction patterns of Sn-Sm and Sn-La mixed oxide systems
calcined at 500 °C for 6 hours are shown in Figure 3 1(a) and 3 l(b). It can be
noted that the intensity of diffraction peaks decreases afler the addition of
Sm2O3 or La2O:, (10 mol%) to SnO2 system. So the addition ofa second oxide
hinder the crystallisation of SnO2 phase by preventing the aggregation of the
smaller particles. Similar observation was reported when TiO2 is added to
ZrO2 [1]. TS82 sample shows casitterite as the prominent phase, no reflections
due to Sm2O_~. or La2O_~. are detected. This means that La2O3 or S.m2O3 is well
dispersed on the SnO2 support material. The specific surface areas of these
samples (TS82 and TL82) are higher (102.7 and 105 7 m2/g) compared to
other systems. TS55 and TL55 shows the co-existence of both SnO2 and rare
earth oxide phases. However, no compound formation is observed at 500 °C,
48

Fig. 3 l(b) X-ray diffraction patterns of SnO “ and TS82" calc ned m air at(I

which is the temperature at which the material is calcined. Similarly TS28 and
TL28 also show both SnO2 and rare earth oxide phases.
The BET surface areas determined by N; adsorption are in the order
TS82 > TS55 > TS28 and TL82 > TL55 > TL28. The higher surface area of
TS82 and TL82 samples may be due to the presence of small amount of Sm2O;
or La;O_~., which prevent the aggregation of SnO2 particles As more and more
rare earth oxide is added to SnO2, agglomeration takes place and this may be
the reason for the lower surface area of other systems. The BET surface area
of all the samples are presented in Table3.3 No micropores are detected in any
case except TS28 and TL28, where very small amount of micropores are
detected.
Pore volume of all the catalysts are also given in Table 3.3 Porevolume increases in the order TL82 > TL55 > TL28 and TS82 > TS55 > TS28.
The catalysts TL82 and TS82 contain only few number of pores with radius >
30 A0 Almost all the pores are in the region 20-30 A0 No pores are detected
below 20 A" So they can be considered as mesoporous materials (pore radius
20-200 A0) in which most of the pores are of almost uniform size and radius
[2] Compared to TS82 and TL82, other systems TS55 and TL55 contain
more number of pores with radius > 30 A0 Some pores are detected in the
macroporous region also (>200). In the case of TL28 and TS28 pore radius
ranges from 30 to 1000 A0 or more. A large number of pores with radius > 30
A" are detected. So a notable variation in the pore volume and pore size
distribution is observed, as the composition of the catalyst changes. TS82 and
TL82 are catalysts in which pores are of uniform size, while in the extreme
cases, TS28 and TL28 pores are not of uniform size. The pore volume
distribution curves are shown in Figure 3.2.
50
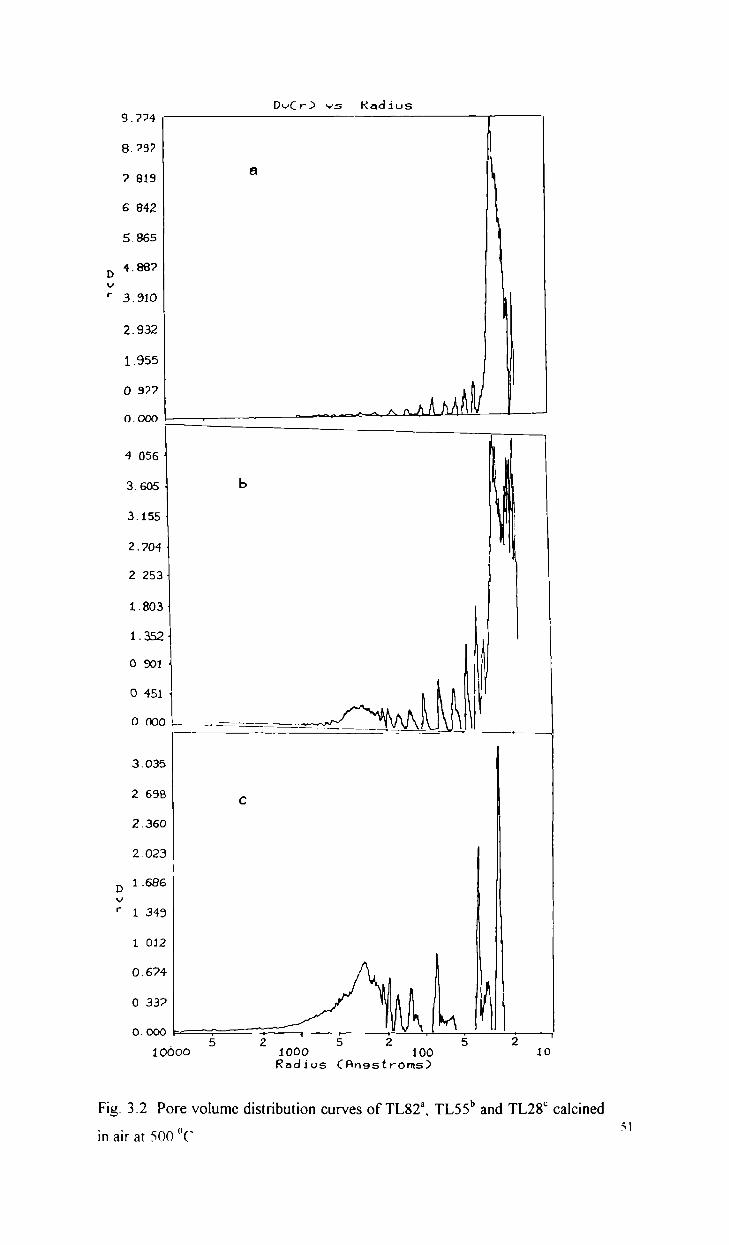
DvCr-D vs Radius9.774
8. ?37
7 B13
6 842
5.865
4.88?
‘(O 3.910
2.932
1.955
O 377W fl MMM/LMA J4 056‘
3.5o5- b3.155
2.704
2 253
1.803
1.352‘
0301‘
O 451
0 000 —- -—- .3.035
2 698
2.360
2.023
1 .686
‘(U 1 343
1 012
0.674
0 33?
0.000 . + . r . .5 2 5 2 510600 1000 100 10Radios Cfinsstrorns)
Fig. 3.2 Pore volume distribution curves of TL82“, TL55" and TL28° calcined
in air at 500 "C

Only one distinct weight loss has been seen, from 37 to 275 "C (7 35
%) in the case of TS82. Another gradual and slow weight loss is observed
from 276 to 586 0C (2.41 %). The weight loss ofthe catalyst below 150 0C is
due to the desorption of adsorbed water The weight loss from 150-500 "C
may be due to the evolution of structural water and also due to the
dehydroxylation of the catalyst [3]. Above 400 °C the catalyst lose structural
water due to excessive dehydration. Three distinct weight losses are observed
in the case of TS28, one at 32-260 "C (4.04 %). another at 263-445 °C and one
more at 402-518 °C (2.6 %). These weight losses are in accordance with the
one reported in the case of lanthanum hydroxide [45], since in TS28 or TL28
percentage of rare earth component is more. In the case of La(OH)_~., an initial
small weight loss at 100-200 "C is due to the removal of adsorbed water or
water of crystallisation, the first true stage of La(OI-I); occurs in the range 250
350 "C and results in the formation of a well defined hexagonal LaOOH
intermediate.
La(OH)3 LaOOH ___,-‘5°‘*-‘° La2O3
Subsequent dehydration of oxyhydroxide to La2O3 occurs at 350-420
°C and is completed at 420 °C. The final broad peak showing weight loss at
450-800 °C is due to the decomposition of a surface layer of unidentate
carbonate species existing on the oxide as a result of interaction of the highly
basic lanthanum hydroxide precursor with atmospheric carbon dioxide during
preparation and handling [6].
In the case of TS55 also three characteristic weight losses are seen
similar to that ofTS28 system. Ifwe examine the DTA of TS55 an exothermic
peak can be seen around 850 "C, which may be due to the formation of a new
compound or a phase change. Same type of exotherm is obtained in the case of
TS28 also but not very distinct as in the case of TS55. However no exothenn

TC’/o
mg/min
I400 260 360 S30 70‘0 8:10Fig. 3.3(a) TG curves of smog‘, T332“, TS55° and TS28"
a
b
C
ol.
6
160 250 360 450 530 660 ‘ 760 830 960
Fig.3.3(b) DTG curves of snof. T532“ TS55° T323“ and smzos 53

—') CSO
emln (
I00 2 [I0
Fig_3.3(c)
Jun 400 500 600 T00
DTA curves of snoz“, TS82", TS55° and TS28"
-mu

could be detected in the case of TS82. The TG-DTA curves are shown in
Figures 3.3(a), 3.3(b) and 3.3(c).
The IR spectra of TS82, TS55 and TL82 catalysts are shown in Figure
3 4 (a) and 3 4 (b). Bands in the region 400-550 cm" are representative of the
metal oxygen absorptions [7,8] McDewitt and Davidson have obtained the [R
lattice vibrational spectra in the region 700-500 cm" of eight cubic rare earth
oxides [9] Oxides are usually non-absorbing above 1000 cm" but most show
a strong band and some weaker one in the 900-300 cm" region. Other lattice
vibrational modes occur below this region. A band near 1645 cm" could be
due to bending vibrational modes of OH, if the hydrogen of OH belong to the
molecularly adsorbed water [10]. Other bands in the region 1200-1600 cm"
are believed to be associated with surface bicarbonate species [8].
The basicity at various pKa values using different Hammett indicators
are summarised in Table 3.2. The oxides under study responded only to
bromothymol blue (pKa 7.2), methyl red (pKa 4.8) and dimethyl yellow (pKa
3 3). All the catalysts except TS55 gave basic colour change [1 1]. It can be
seen that basicity of the catalysts are in the order TS82 > TS28 > TS55 and
TL82 > TL28 > TL55 at an activation temperature of 500 °C.
The acid-base strength curves intersect at a point on the abscissa where
acidity = basicity = 0, known as PIo_,,,_._. [11,12]. A catalyst with a large I-[mm
value has strong basic sites and weak acid sites and if Hum.‘ is small it has
strong acid sites and weak basic sites. We found that TS55 has a I-lam, value
of 4.6 at 500 °C and 6.3 at 700 °C. This means that basicity increases with
increase in activation temperature from 500 to 700 "C. We could not
determine the Humx value of TS82, TL82, TL55 and TL28 since these oxides
were purely basic at activation temperatures of 300, 500 and 700 °C Hit...“ of
TS28 catalyst is 6.4 at 700 0C.
55

Table 3.2 Basicity and acidity of catalysts activated at 500 "C
Catalysts Basicity mmol/g Acidity mmol/g
pKa27.2 pKa24 8 pKa23.3 pKaS7.2 pKas4 8 pKa£3 3TS82 0 064 0.139 0 178 --TS55 --- 0102 0.015 0.015TS28 0.038 0.076 0.127 --TL82 0.076 0.203 0.165 --TL55 0.051 0.114 0.139 --TL28 0.038 0.063 0.152 --SnOz --- 0.108 0.104 0.076La2O_~, 0.400 0.870 1 420 --Sm2O3 0.560 0.660 0.980 --
Table 3.3 Physico-chemical properties of the catalysts
Catalysts‘ Surface area Pore volume XRD phase Basicity
m2/g cm?’/g detected mmol/gTS82 102.70 0.315 SnO2 0.178TS55 69.05 0.447 mixed 0.102TS28 31.59 0.691 mixed 0.127TL82 105.70 0.283 SnO2 O 165TL55 55.63 0.416 mixed 0 139TL28 26.42 0.719 mixed 0 152
*Catalysts calcined at 500 °C in air

Intensity
A_
1600.0 1500.0 1400.0 1300.0 1200.0 1100.0 1000.0 900.0 800.0 700.0 600.0
Fig.3 4(a) FTIR spectra of TL82“ and TL55b
1/’ '
L L n .4 .1 - I ‘ ‘1600.0 15CX).0 1400.0 1300.0 1200.0 1100.0 1000.0 900.0 800.0 7CXJ.0 600.0 500.0 Cm
Fig.3.4(b) FTIR spectra of TS82
.\‘.usu.nu|

3.2 ALCOHOL DECOMPOSITION AS A TEST REACTION
3.2.1 Decomposition of Cyclohexanol
Both dehydration and dehydrogenation proceeds over the mixed oxide systems
under study Dehydrogenation is the main reaction. Selectivity towards
dehydration and dehydrogenation are summarised in Table 3 4 Selectivity
towards dehydration products are in the order TS55 > TS28 > TS82 and TL55
> TL28 > TL82. Only traces of methyl cyclopentenes are detected, indicating
that acid sites strong enough to isomerise cyclohexene formed, are not present.
Pines and Pillai have reported the formation of methyl cyclopentene over highly
acidic aluminas [13]. Compared to isopropanol and t—butanol dehydration
cyclohexanol requires stronger acid sites. According to Bezouhnua et al
Bronsted acid sites are responsible for the dehydration of cyclohexanol to
cyclohexene [14]. They also postulated the following hydrogen abstraction
scheme for cyclohexanol dehydrogenation (Fig. 3.5)
Fig.3 5 Mechanism of dehydrogenation of cyclohexanol
58
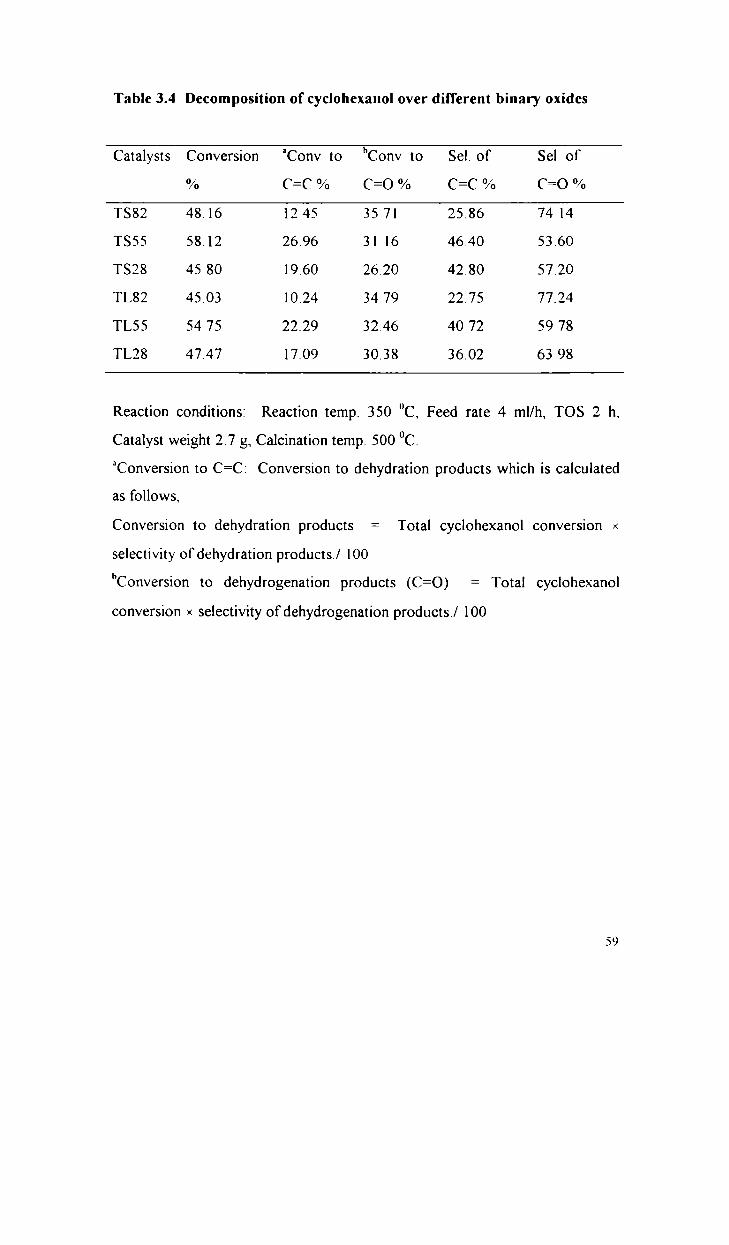
Table 3.4 Decomposition of cyclohexanol over different binary oxides
Catalysts Conversion “Conv to "Conv to Sel. of Se] of% C=C % C=O % C=C °/o C=O %
TS82 48.16 l2 45 35 7] 25.86 7414TS55 58.12 26.96 3] l6 46.40 53.60T528 45 80 19.60 26.20 42.80 57.20TL82 45.03 10.24 34 79 22.75 77.24TL55 54 75 22.29 32.46 40 72 59 78TL28 47.47 17.09 30.38 36.02 63 98
Reaction conditions: Reaction temp. 350 "C, Feed rate 4 ml/h, TOS 2 h,
Catalyst weight 2.7 g, Calcination temp. 500 OC.
“Conversion to C=C: Conversion to dehydration products which is calculated
as follows,
Conversion to dehydration products = Total cyclohexanol conversion x
selectivity of dehydration products./ 100
“Conversion to dehydrogenation products (C=O) = Total cyclohexanol
conversion x selectivity of dehydrogenation products./ 100
5‘)

90 I30 1 .____.——-—-’° '070
so ¥50 _:_:j.W0 I40 ‘L30
20
100 . : :500 550 600 650Activation temperature °C
—o—seI. of cyclohexanone —I—conversion
Fig. 3.6 Effect of activation temperature of the catalyst on the selectivity of
cyclohexanone.
Reaction conditions. Reaction temp 350 °C, Feed rate 4 ml/h, TOS 2 h,
Catalyst (TS82) weight 2.7 g.
()0

0.1017 0.1269 0.139 0.152 0.165 0.177Base amount mmol/g
Fig. 3 7 Effect of base amount on the selectivity of cyclohexanone
Reaction temp 350 "C, Feed rate: 4 ml/h, TOS 2 h, Catalyst weight 2.7 g,
Calcination temp. 500 “C
note: base amount is determined by Hammett indicator method and catalysts
are arranged in the increasing order of their basicity.
In the mechanism of dehydrogenation of cyclohexanol tocyclohexanone the metal cation is acting as a Lewis acid site. According to the
authors the basic sites originating from the oxygen in oxide lattice is
responsible for dehydrogenation We activated the catalyst to different
temperatures prior to the reaction and found an increase in cyclohexanone
selectivity (Fig.3 6) with increase in activation temperature. This may be due
to the formation of 02' ions at higher temperatures. As determined by
Hammett indicator method basicity increases slightly by activation, from 500 to
61

650 "C and then decreases. Correlation of basicity determined by Hammett
indicator method and selectivity of cyclohexanone is demonstrated in Fig 3 7
As the base amount increases cyclohexanone selectivity also increases. High
activity in the formation of cyclohexanone is probably due to the presence of
stronger basic centres. The lower yield of cyclohexanone in the case of TS55
and TL55 compared to other catalysts indicate the absence of strong basic
centres though weak or medium strength basic centres may be present. So the
formation of cyclohexene and cyclohexanone indicates the presence of weak
and / or medium strength acidic centres and medium and / or strong basic
centres respectively Thus the test reaction of cyclohexanol indicates the
presence of acidic and basic centres of probably different strengths as the
composition of the catalyst is varied. Based on the above results catalysts can
be arranged in the increasing order of their basicity as TS55 < TS28 < TS82
and TL55 < TL28 < TL82 and their acidity follows the reverse order
3.2.2 Decompositon of t-butanol
t-Butanol can undergo only dehydration reaction without any other side
reactions like dehydrogenation. So it is useful for comparing the acidity of a
set of catalyst systems [15]. Reaction is carried out at 200 0C at a feed rate of
6 ml/h. From the results obtained it is clear that the acidity of tin-samarium
oxide and tin-lanthanum oxide systems are in the order TS82 < TS28 < TS55
and TL82 < TL28 < TL55 lsobutene is the main product with small amounts
of other products like l-butene and 2-butene. So the lsobutene formed cannot
undergo further isomerisation reaction, which must be due to the scarcity of
stronger acid sites [16, l 7]
62
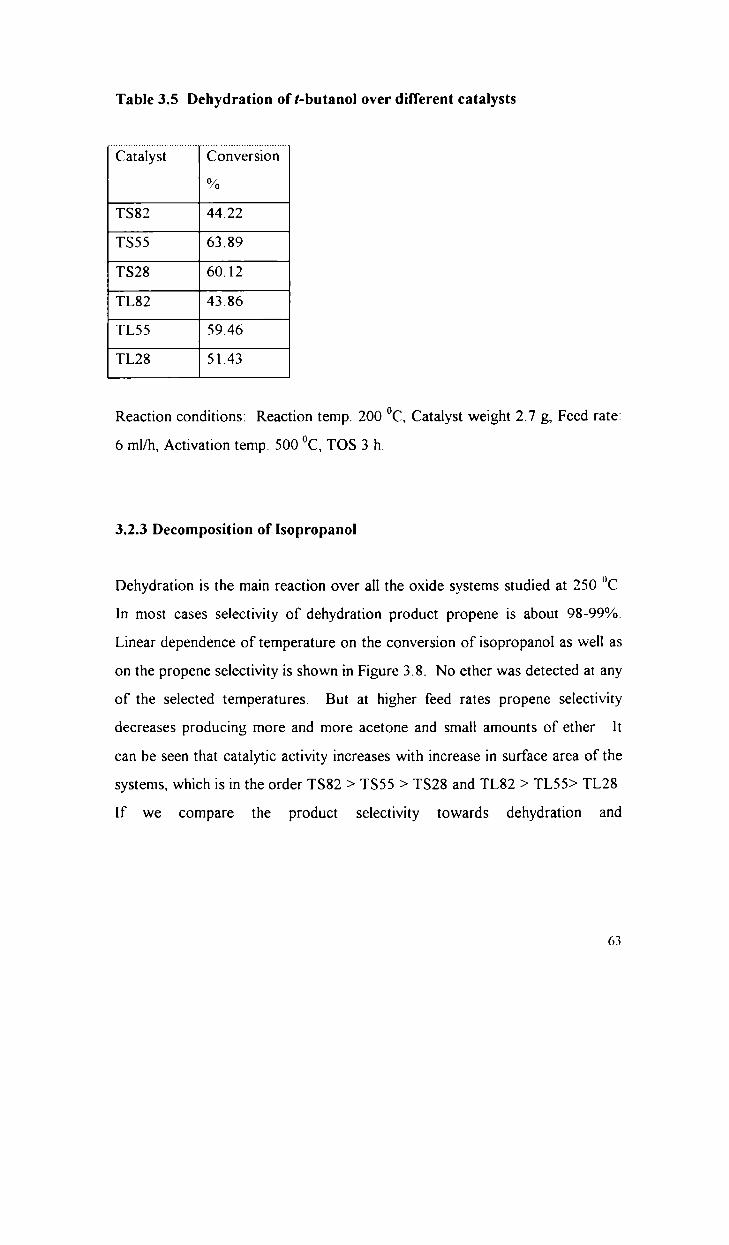
Table 3.5 Dehydration of t-butanol over different catalysts
Catalyst Conversion%
TS82 44.22TS55 63 .89TS28 60. 12TL82 43.86TL55 59.46TL28 51.43
Reaction conditions: Reaction temp. 200 °C, Catalyst weight 2.7 g, Feed rate:
6 ml/h, Activation temp. 500 °c, TOS 3 h.
3.2.3 Decomposition of Isopropanol
Dehydration is the main reaction over all the oxide systems studied at 250 “C
In most cases selectivity of dehydration product propene is about 98-99%.
Linear dependence of temperature on the conversion of isopropanol as well as
on the propene selectivity is shown in Figure 3.8. No ether was detected at any
of the selected temperatures. But at higher feed rates propene selectivity
decreases producing more and more acetone and small amounts of ether It
can be seen that catalytic activity increases with increase in surface area of the
systems, which is in the order TS82 > TS55 > TS28 and TL82 > TL55> TL28
If we compare the product selectivity towards dehydration and

dehydrogenation it is obvious that there is not much difference if go from one
system to another. In the case of TL series comparison is possible, where we
get maximum propene selectivity in the case of TL55. So on the basis of
propene selectivity alone the increasing order of acidity is TL82 < TL28 <
TL55. The ratio of dehydrogenation activity to the dehydration activity which
is a measure of the basicity of a system [18] matches well with the those
obtained by Hammett indicator method, so the basicity ofthe systems are in the
order TL82 > TL28 > TL55 and TS82 > TS28 > TS55 The higher
dehydrogenation activity of (partial oxidation) of systems containing more
amount of SnO2 indicate that the redox properties are predominating over the
acid base properties. The dehydrogenating activity is in general attributed to
the redox properties as well as to the acid base properties in the decomposition
of alcohols [19]. The product inhibition studies with H20 and Hz were also
carried out. It is found that dehydrogenation activity is favoured by the
introduction of water alongwith the feed, however conversion of alcohol is
decreased. When the reaction is conducted in the presence of controlled flow
of hydrogen, the dehydrogenation is almost completely suppressed giving only
dehydration products propene and water. Poisoning of the catalyst with
pyridine prior to the experiment resulted in a considerable decrease in
conversion to about 5%. Furthermore, after the poisoning of the catalyst with
ammonia vapours even traces of propene is not detected. Pyridine adsorbs
predominantly on Lewis acid sites and ammonia on both Lewis and Bronsted
acid sites.
64

s
oaassasassé
33i,-é‘:‘\150 200 250 3(1)
.661‘/°E':’a§88885‘88§/
Temperature °C
—I—se| propene -—4—se| acetone —K—conversion
Fig.3.8 EtTect of temperature on the selectivity of propene and acetone
Reaction conditions. Activation temp. 500 "C, Feed rate 4 ml/h, TOS 3 h,
Catalyst TS82 (2.7 g).
Table 3.6 Decomposition of isopropanol over different catalysts
Catalyst Sel Sel. Conv to Conv to v,* v..* vb/v, Convc=c c=o propene acetone x 10‘ x 10“ x 10*‘ %
wrsiisiii """""" 5é>""2"<'9' """ "6'5'i """" '§'5"52i """""""" '6'.’6'i """"""""" "4"2t5 """"""" '§”i'6 """"" "636 """"" "é"6I'§'6
TS55 99 62 0 38 80.60 0 30 6 24 2 32 3 70 80 91T528 99 42 0 58 79 24 0.46 13 40 7 79 5 80 79 7lTL82 96 49 3 SI 69 78 2.53 3 53 l2 80 36 00 72 32TL55 99 28 0 72 62.86 0 45 6 04 4 32 710 63 32TL28 9701 2.79 59 56 L83 1210 3700 30 50 6140v, Dehydration rate
v.,. Dehydrogenation rate
* Rate in mol/h g catalyst = Fractional conversion x feed rate in mol/h / weight
ofthe catalyst in g.
Reaction conditions: Activation temperature 500 °C, Reaction temperature
250 “C, Feed rate 4 ml/h, TOS 3 h.
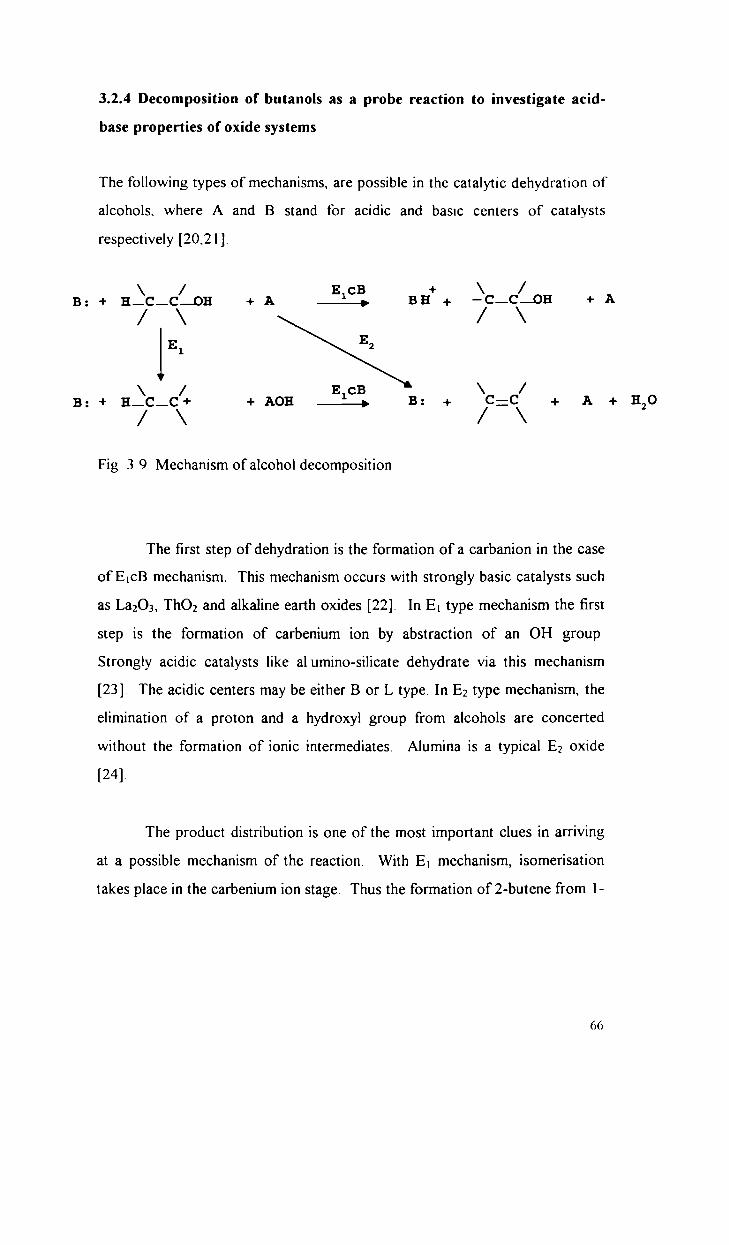
3.2.4 Decomposition of butanols as a probe reaction to investigate acid
base properties of oxide systems
The following types of mechanisms, are possible in the catalytic dehydration of
alcohols. where A and B stand for acidic and basic centers of catalysts
respectively [202]].
E B + \+ H_C_C/_0H + A :13. an + —/C_C\_0H + AEl E2\ / E1cB \ /;+ H_c_C+ + AOH _% B: + C:C + A + H20/\ /\Fig. 3 9 Mechanism of alcohol decomposition
The first step of dehydration is the formation of a carbanion in the case
of E.cB mechanism. This mechanism occurs with strongly basic catalysts such
as La2O3, Th0; and alkaline earth oxides [22]. In E; type mechanism the first
step is the formation of carbenium ion by abstraction of an OH group
Strongly acidic catalysts like al umino-silicate dehydrate via this mechanism
[23]. The acidic centers may be either B or L type. In E; type mechanism, the
elimination of a proton and a hydroxyl group from alcohols are concerted
without the formation of ionic intermediates. Alumina is a typical E2 oxide
[24].
The product distribution is one of the most important clues in arriving
at a possible mechanism of the reaction. With E; mechanism, isomerisation
takes place in the carbenium ion stage. Thus the formation of 2-butene from 1
66

butanol is indicative of the E1 mechanism. High selectivity for 1-butene (
Hoffmann orientation) from 2-butanol is indicative of E1cB, whereas E1 and E2
give mainly 2-butene (Saytzeff orientation). Noller and Thomke [25]
recommended the use of deuterated reactants or catalysts and give the
following criteria for the three mechanisms.
(i). With the ECB mechanism, exchange is found in both the alcohol and the
olefins. but only in beta positions. indicating that the carbanion undergoes
reconversion to the alcohol
(ii). With the E. mechanism exchange in all positions of the olefins is observed,
but no exchange at all in the alcohol (this indicate that the carbenium ion
formed is not reconverted into alcohol).
(iii). With E; mechanism, exchange doesn’t occur, both alcohols and olefins
retaining their original isotope composition. The mechanism of dehydration
may differ from alcohol to alcohol, even if the same catalyst is used. Most of
the examined alcohols showed E1 on BPO4, E; (sometimes mingled with E1) on
Ca3(PO4)2 and E1cB on Sm2O3. There are two exceptions, dehydration of
ethanol over BPO4 and 2-methyl 2-propanol over Sm2O3, both proceed with
E2 mechanism [26].
The reaction of isobutanol over these oxides show that both
dehydration and dehydrogenation take place, the extent of which depends on
the acid-base properties of the catalysts. Isobutene is the major product,
alongwith some amount of butenes which must be formed by the isomerisation
of isobutene. The selectivity of dehydration products is in the order TS55 >
TS28 > TS82 and TL55 > TL28 > TL82. Moreover the selectivity of
isomerisation products also follow the same order Isomerisation reaction
requires stronger acid sites and hence the formation of 1-butene and 2-butene
indicate the presence of some stronger acid sites. The dehydrogenation activity
follows the reverse order The results are summarised in Table 3.7 The ratio
of dehydrogenation rate to dehydration rate which is a measure of the basicity,
67

correlates well with what is obtained by Hammett indicator method. As the
temperature is increased the selectivity of the aldehyde is decreased whereas
the selectivity of butenes is increased, since as the temperature increases the
contribution of ionic structures increases. An increase in feed rate increases the
selectivity of dehydrogenating product as expected. Addition of water
alongwith the feed also enhanced the dehydrogenation selectivity. When the
reaction is carried out separately over SnO2 and La2O3, isobutene 60% and
aldehyde 35% are formed in the case of SnO2 and isobutene 78% and aldehyde
20% are formed in the case of La2O_: A slow and steady deactivation is
observed in the case TS82 and TL82 with time on stream which indicate the
participation of redox centers in the dehydrogenation reaction. The colour of
the catalyst after the reaction turned gray which suggest the reduction of Sn“
species during redox cycle [27].
Reactions of t-butanol, 2-butanol, 1-butanol also are conducted. (
Butanol dehydrated to isobutene with small amounts of butenes 2-Butanol
dehydrated mainly to 2-butene (Saytzeff elimination) with small amounts of 1
butene and a considerable amount of dehydrogenated product (18%) is also
formed. Dehydration of 1-butanol afforded 1-butene as the major product
alongwith 2-butene and isobutene. These observations suggest that
dehydration occur via Saytzeff elimination and hence the mechanism can be
either E, or E; type. Since dehydration products requiring isomerisation are
formed in very less quantities, the dehydration over these systems is proposed
to be mainly E2 type probably mixed with some E1. In the case of TS82 only
small quantities of isomerisation products are formed, whereas in the case of
TS55 and TS28 the yield of isomerisation products are comparatively greater
and hence the contribution of an E, type mechanism cannot be excluded.
68
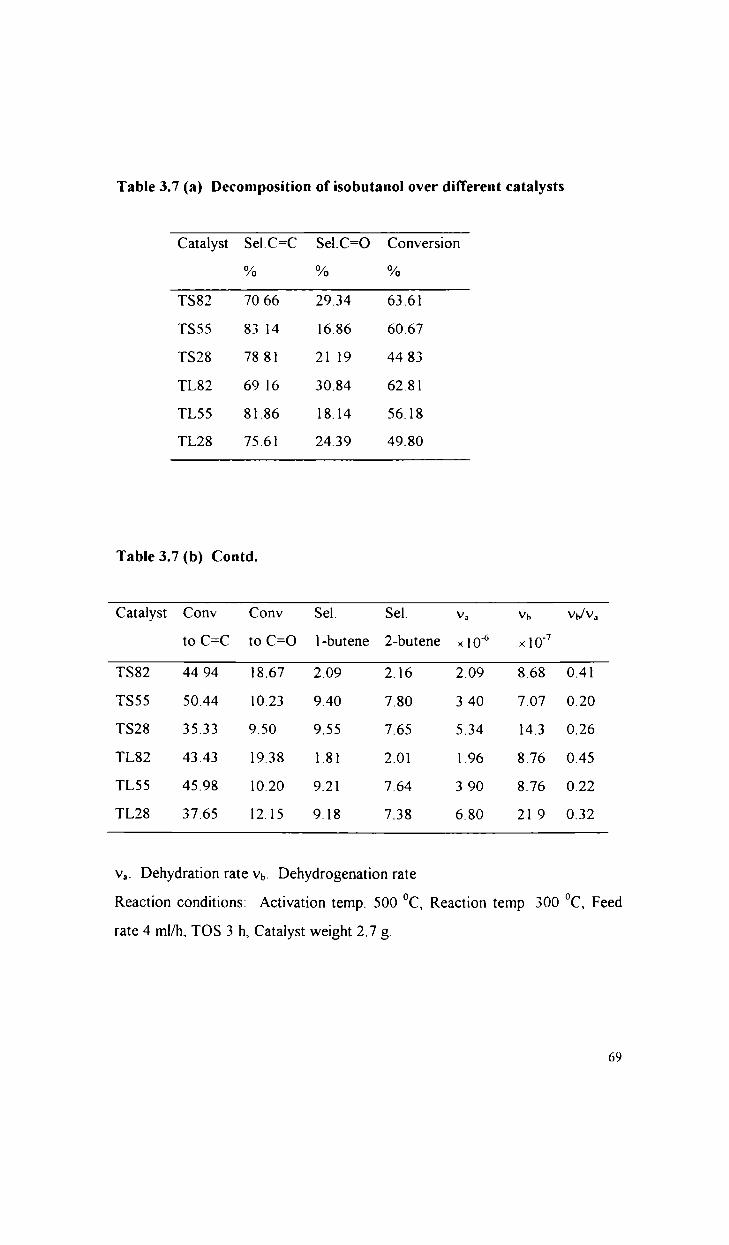
Table 3.7 (a) Decomposition of isobutanol over different catalysts
Catalyst Se|.C=C Se1.C=O Conversion% °/o °/o
TS82 70 66 29.34 63.61TS55 83 14 16.86 60.67TS28 78 81 21 19 44 83TL82 69 16 30.84 62.81TL55 81.86 18.14 56.18TL28 75.61 24.39 49.80
Table 3.7 (b) Contd.
Catalyst Conv Conv Sel. Sel. v, vb vb/v,to C=C to C=O 1-butene 2-butene x 10“’ X10”
TS82 44 94 18.67 2.09 2.16 2.09 8.68 0.41TS55 50.44 10.23 9.40 7.80 3 40 7.07 0.20TS28 35.33 9.50 9.55 7.65 5.34 14.3 0.26TL82 43.43 19.38 1.81 2.01 1.96 8.76 0.45TL55 45.98 10.20 9.21 7.64 3 90 8.76 0.22TL28 37.65 12.15 9.18 7.38 6.80 21 9 0.32
v,.,. Dehydration rate vb. Dehydrogenation rate
Reaction conditions: Activation temp. 500 °C, Reaction temp 300 °C, Feed
rate 4 ml/h, TOS 3 h, Catalyst weight 2.7 g.
69

In the case of catalyst having more number of acid sites (and also
stronger sites) the mechanism is E. type and literature survey shows that
catalyst having very weak acid sites and very strong basic sites dehydrate
alcohol via E1cB mechanism. So it is expected that catalysts having acidic and
basic sites with intermediate strength can dehydrate alcohol via E2 route.
Moreover in the case of oxides where dehydrogenation products are also
formed, the most viable mechanism of dehydration will be one involving both
acid and base sites simultaneously Le, E2 mechanism.
10
9o\" $’:1.) 3 0C ‘U8 7 >3 6 5-9 ‘U(\l_ 5 E’g 4 E’to 2‘5 3 3“,3 2 o1- II)1 _o . .300 325 350 400Temperature °C
1 1-butene 2-butene —6—isobutene —fi—aldehyde
Fig.3 10 Effect of temperature on the product distribution
Reaction conditions: Activation temp. 500 °C, Feed rate 4 ml/h, TOS 3 h.
Catalyst weight 2.7 g (TS82).
70

. 300 °C, TOS 3Ion temp
71
ion
. 500 °C, React’
$uu>cuu_n oc3_.5om_
w w w w m m 0
\\.s\\s..\.\\\\\\\\\\.\\\\\\\\\.\\\
\\ \ .. \ \\ ....
“m.3$t§\ t““\““t< Q“
\
butistn
:..::::...v
10 15
——~ — Isobutene —><— aldehyde
ivation temp
5
Flow rate mvh
Act
\
§RRt.~. .“§&.t.&
. \\\\.\\\\.\.\.\ .\ \\\ \><\\.§\ >.
V“. .“..\v .. u§.a§3~\\\\\ \\\§« \ \\\\\\\\\\\\\\\\\\\\\\\\\\N
§§§x\\V .\\\\\\\..\\\\.\\\\\\\\\\\\\\
\ >5. u\\\\\\\\\\\\\\\\\ ..
\\\ \\\\\\\\\ \
..\.\\\\\
R \.“.K\. x
\ .mmu
§§a\.§ \
.33:3
.l 1 Efiect of feed rate on the product d
=====z 1-butene I112-butene
‘D.3
09875543210
$ucmSn-N.uc£:m. _ : kt
ig.
Reaction conditions
h, Catalyst weight 2.7 g (TS82)
Water%
D aldehyde sel conversion
: Reaction temp. 300 °C, Feed rate 4 ml/h, TOS 3 h,
Catalyst weight 2.7 g (TS82).
Fig 3 12 Effect of water on the selectivity of aldehyde
Reaction conditions

j 2-buteneQ $ Q .°., 3 °,L_. iisobutenec o.3 .g ‘Q —O—a|dehyde:3 7;; E —O—alcoholQ’. Q; 3 conversionc C —2 2 E3 3 o'1? *3 2.— 1) ‘V, o 0IIMEIQ4 5 61 2 3
Time on stream hour
Fig 3 13 Effect of time on stream on the product distribution and conversion
Reaction conditions: Reaction temp. 300 °C, Catalyst TL82 (2.7 g), Feed rate
4 ml/h
70 60O0 6° " ‘7 so\°_ Q_ 50 - O oO.) ‘D A "40 C”’ ’>-a oE. tn 40 -r * 0 '5.c C IT“ .30 I6E g 30 .. i E< D I *- 20 o10 .. I 100 : : : 0500 550 600 650
Activation temperature °C
—I—a|dehyde sel —A——isobutene sel —o—conversion
Fig 3 14 Effect of activation temperature on the selectivity of products
Reaction temp 300 °C, Catalyst TL82 (2.7 g), Feed rate 4 ml/h
72

The conversion of four alcohols are in the order I-butanol (100%) > 2
butanol (55.03%) > isobutanol (52.93%) > l-butanol (31 79%) at 350"C
Branching of alcohol molecule promotes olefin formation and enhances the
reactivity, this reactivity increases in the order of primary, secondary and
tertiary alcohols [28].
In the present study the order of reactivity of ethanol, n-butanol and
isopropanol are compared. The high reactivity of IPA is due to the effect of
the substituted methyl group attached to the ot-carbon atom. n-Butanol is more
reactive than ethanol because of the longer chain of the alkyl group. The
activation energy for dehydration follow the sequence given below in the case
of zeolites [29].
C—C—C—C > C-C > C—C—CI | 1on OH onFig. 3.15 The order of activation energy for alcohol dehydration.
This order shows that activation energy increases with alkyl chain length in
primary alcohols but decreases with branched alcohol. The sequence of
decrease in activation energy corresponds to decreasing acid strength of the
hydrogen atom on the beta carbon atom. The lower the acidity, the higher the
energy required for H atom abstraction. However when the acidic sites on the
catalyst are strong enough to give complete abstraction of OH groups, the
abstraction of hydrogen atoms from the beta carbon becomes the rate
determining step in the formation of activated complex.
73

Fig. 3 I6. Transition state for the dehydration of alcohol.
It is found that the dehydration of most reactive alcohol requires the
least activation energy [30]. In the catalytic dehydration of aliphatic alcohols
the alcohol chain length therefore affects both the abstraction of the OH group
from the alpha carbon atom and the hydrogen from the beta carbon atom. The
alkyl chain length exerts an inductive effect on the OH group increasing the
electronegativity of the latter [31]. This increase in electron density favours
strong interaction between the OH group and the acidic sites on the catalyst
surface. We have already seen that the alcohol dehydration via E. mechanism
produces an intermediate carbenium ion; the E2 mechanism involves the
simultaneous abstraction of the hydrogen atom from the beta position by the
basic site and the OH group from the alpha carbon by the acid paired sites.
The inductive effect on the OH group probably shifis the reaction mechanism
from E2 to E. in the dehydration of longer chain alcohols.
Comparison of the dehydration of ethanol, IPA and n-butanol
The activity of these alcohols are in the order IPA > ethanol > n-butanol. We
have already showed that these catalysts contain only weak acid sites. So the
possibility ofEl mechanism is less, even in the case of n-butanol which is a long
chain alcohol whose alkyl chain inductive effect is to be taken into account.
However acid strength of beta hydrogens are in the order ethanol > n-butanol.
So the abstraction of beta hydrogen atom must be important, in the case of
these oxide systems.
74

30 100-u wE 5 up ‘r ww E3 $ 20 ,_ " 70 in g 1—butene£3 E -L 60 3 E 22-butene(D2 8 15 -- ~- 50 2 5 iketoneE" .3 -- 40 ‘E E —o—isobutene.. .o .§ “ 1° 30 3 U -—JI(—conversionE 5 .. ~ 20- 100 . . 0
EED
‘.32—butanol 1-butanol
isobutanol
Fig 3.17 Effect of alcohol structure on the selectivity of products
Reaction temp 300 “C, Catalyst TL82 (2.7 g), Feed rate 4 ml/h
Had the mechanism been E; in the case of n-butanol, it would have
given more conversion than ethanol under similar experimental conditions.
Also n-butanol dehydration produced little isomeriastion products. Here three
things are to be considered (i). inductive effect of the alkyl chain length which
polarises OH group (ii). The acidity of beta hydrogen atom and (iii) the
strength of acid base sites on the catalyst surface. So a consideration of all
these factors can give an idea about the reaction mechanism. Presence of
strong acid sites on the catalyst surface and a favourable inductive etfect of the
alkyl chain length can always shift the mechanism towards E.. In the present
systems, we found that little isomerisation products are formed even in the case
of n-butanol, where the inductive effect of alkyl chain length must play some
role. This may be because the acid sites are weak and hence not strong enough

to immediately generate carbenium ion. Again if the basic sites present are very
strong we expect more Hoffmann elimination products. So these catalyst
systems contain probably more number of medium and weak basic sites and
weaker acid sites. Also in such cases it is expected that dehydration is
accompanied by dehydrogenation.B0 7170 ,.———I I u. 70R m om OE0 Q 50 0m .913 o_ 40 -67 9E 3 -65 cuO 1) mx 0% EIL!) 20 ..54 810 .i.&0 : : - In Go 62N In 6) Nco In N 0 In N£1’ E E2 r—‘ r.‘ .1‘catalysts
—I—c=c sel —A——c=o sel —iK—conversion
Fig. 3 18 Decomposition of ethanol over different catalysts
Reaction temp. 400 °C, Feed rate 4 ml/h, Catalyst weight 2.7 g
3.3 OXIDATIVE DEHYDROGENATION REACTIONS
3.3.1 Oxidative dehydrogenation of ethanol
In the oxidative dehydrogenation of ethanol; acetaldehyde, ethane and small
amounts of carbon oxides and aetic acid are formed. The acetic acid is formed
by the oxidation of acetaldehyde. The effect of temperature on product
selectivity is presented in Figure 3 19 At lower temperature acetaldehyde
selectivity is less, which increases with increase in temperature. But even at
450°C ethylene is the major product. So at higher ethanol conversions the
undesirable dehydration predominates. Out of the four catalyst systems
investigated the aldehyde selectivity follows the order TL82 > TS82 > TS55 >
76
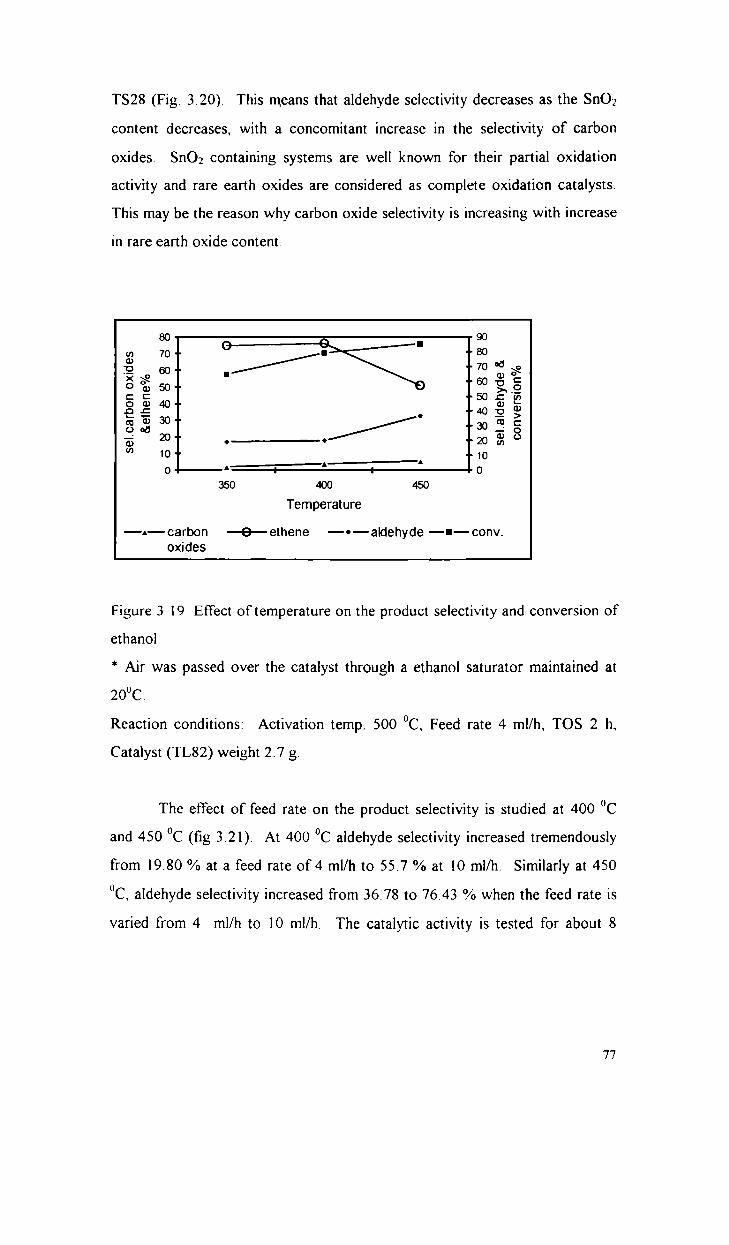
TS28 (Fig. 3.20). This means that aldehyde selectivity decreases as the SnO2
content decreases. with a concomitant increase in the selectivity of carbon
oxides. SnO2 containing systems are well known for their partial oxidation
activity and rare earth oxides are considered as complete oxidation catalysts.
This may be the reason why carbon oxide selectivity is increasing with increase
in rare earth oxide content.
so 908 70 .. - 30-E: .. 60" ”° 2 $0 % 50 .. ‘L 60 T; 8C C ‘L50 E :3O q) 40.. Q) 5-E ‘E "40 E >8 3 30:. ‘.30 83; 2°" --20 3 °"’ 10" -- 10_ A0 ‘ . : 0350 400 450Temperature
—-—carbon —6—ethene —o—a|dehyde —I—conv.oxides
Figure 3 19 Effect oftemperature on the product selectivity and conversion of
ethanol
* Air was passed over the catalyst through a ethanol saturator maintained at
20°C.
Reaction conditions: Activation temp. 500 °C. Feed rate 4 ml/h, TOS 2 h,
Catalyst (TL82) weight 2.7 g.
The effect of feed rate on the product selectivity is studied at 400 °C
and 450 "C (fig 3.21). At 400 °C aldehyde selectivity increased tremendously
from 19.80 % at a feed rate of4 ml/h to 55.7 % at 10 ml/h. Similarly at 450
0C, aldehyde selectivity increased from 36.78 to 76.43 % when the feed rate is
varied from 4 ml/h to 10 ml/h. The catalytic activity is tested for about 8
77

hours and it is found that aldehyde selectivity dropped considerably after 6
hours (Fig 3.22). The conversion also is affected during the same period
Alter 8 hours period catalyst turned slightly gray in colour However its activity
is regenerated afier the calcination in air at the same temperature for about 24
hours. This is probably due to the reduction of Sn" sites during the redox
cycle. The effect of catalyst activation temperature is shown in Table 3.8.
Aldehyde selectivity increases with rise in temperature and reaches a
maximum at 650 °C and then decreases. The activity of present systems are
compared with that of single oxide components SnO2 and La2O_-.. It can be
seen that SnO; shows better aldehyde selectivity but conversion is low La2O;
produces a large amount of carbon oxides alongwith acetaldehyde (Table 3 9).
The conversion to aldehyde is greater in the case of TL82, which follows the
order TL82 > SnO2 > La2O;. This shows that mixed oxide is a better catalyst
compared to their single oxide analogues.
9 o——90 _ _ B /so70 g 7 /so 3 5 ,so 5% 840 Q 4 '30 6 320 O 21o 1o TLB2 TL55 1125 TSB2 °
TL82 TL55 T128 T382Catalysts
ethene Daldehyde I conversion Catawsts(8) (b)Figure 3.20: Effect of catalyst composition on the selectivity of products and
conversion of ethanol
Reaction conditions: Activation temp. 500 OC, Reaction temp. 400 OC, Feed
rate 4 ml/h, TOS 2 h, Catalyst (TL82) weight 2.7
78

SeI°/o
oaB8888Ea‘88
se|°/o
6 10Flow rate mllhr Flow rate ml/hr
—O—C=C —-I— C=O —r— conv. —O—C=C —l—C=O —-—conv(a) (b)Figure 321 Effect of feed rate on the product selectivity and ethanol
conversion at (a) 400 OC and (b) 450 °C
Reaction conditions: Activation temp 500 °C, TOS 2 h, Catalyst (TL82)
weight 2.7 g.
90 |\‘ ‘w ‘ Tr:-A—.\70 A$9/ 50 .___._._—o , . o 0 9 A0 40 I I I ' I ‘mum K.20
100 . : : : : . . :1 2 3 4 5 6 7 B 9Time on stream hours
-—°—ethene —I—aldehyde —A——conversion
Figure 3.22 Effect of time on stream on the conversion of ethanol
Reaction conditions: Activation temp. 500 °C, Reaction temp. 450 0C, Feed
rate 4 ml/h, Catalyst (TL82) weight 2.7 g.
79

Table 3.8 Effect of catalyst activation temperature on the product
selectivity and ethanol conversion
Selectivity % 500 "C 600 °C 700 "CCarbon oxides 5.57 5.38 5 23Ethene 50 70 47.8 45.21Aldehyde 36.78 42.86 47 10Conversion “/o 85.20 83.8 66.8
Reaction conditions: Reaction temp. 450 OC, Feed rate 4 ml/h, Catalyst (TL82)
weight 2.7 g.
Table 3.9 Comparative study of TL82, SnO; and La2O3 in the oxidative
dehydrogenation of ethanol
Selectivity % TL82 SnO2 La2O;,Carbon oxides 5.57 19 86 28.18Ethene 50.70 5.18 18.02Aldehyde 36.78 73 96 53.80Conversion (%) 85.20 32.80 23.60Conversion 31.33 24.25 12.69to aldehyde (%)
Reaction conditions: Activation temp. 500 °C, Reaction temp. 450 °C, Feed
rate 4 ml/h, Catalyst weight 2.7 g.
80
3.3.2 Oxidative dehydrogenation of cyclohexanol
The effect of temperature on the conversion and product selectivity is
presented in Fig.3.23 The product selectivity is not much influenced by
temperature, even though conversion of cyclohexanol increased with increase
in temperature. All the catalysts showed very good selectivity > 90 % towards
cyclohexanone. In this case also TS82 and TL82 gave better cyclohexanone
yield. The selectivity of cyclohexanone is in the order TL82 > TL28 > TL55
We have already found that the basicity of these catalysts also follows the same
order This means that not only the redox properties of the catalysts, their
acid-base properties also influence the product selectivity in the oxidative
dehydrogenation reaction of cyclohexanol. Furthermore the selectivity of
cyclohexanone is more in the case of present systems than in the case of
individual oxides SnO2 and La2O3. So the combination of these components
increases notably the activity and selectivity towards dehydrogenation product.
The effect of water on the product selectivity is investigated over TL82 at 350
"C Conversion of cyclohexanone is decreased afier introducing more and
more water (Table 3.11). The selectivity of cyclohexanone increases slightly
from 90.1 to 96.3 %. Water is the by product of dehydration reaction and so it
is expected that addition of water can suppress this side reaction and enhance
the selectivity of dehydrogenation product. The selectivity of cyclohexanone
increased slightly by changing the calcination temperature (Table 3 12), but
conversion is affected badly due to the decrease in surface area at higher
temperature. The effect of feed rate on the selectivity of cyclohexanone is
shown in Table 3.13 The dehydrogenation activity increased slightly as the
feed rate is increased.
81

Table 3.10
cyclohaxanone and cyclohexene
Effect of catalyst composition on the selectivity of
Selectivity % TL82 TL55 TL28 TS82Cyclohexene 6.20 8.80 7 90 6.30Cyclohexanone 93.60 90.80 91.60 93.10Conversion (%) 52.10 50.80 42.18 53.61
Reaction conditions. Activation temp. 500 °C, Reaction temp. 350 °C, Feed
rate 4 ml/h, Catalyst weight 2.7 g.
ketone se|%
oasassaassé
‘ A _ Q 70Ha)lI$.. 40
.. 3)
.. 20
-10I ' I I: o300 350 400 425Temperature °C
alkene sel
—I—aIkene sel —A— ketone sel —G—conversion
8. conversion
Figure 3.23 Effect of temperature on the product selectivity and cyclohexanol
conversion
Reaction conditions:
(TL82) weight 2.7 g.
Activation temp. 500 0C, Feed rate 4 ml/h, Catalyst
82

Table 3.1] Effect of water on the product selectivity and conversion of
cyclohexanol
Selectivity % Water in the alcohol feed0 °/o 5°/o IO% 15% 20°/o
Cyclohexene 8.90 6.40 5.90 3.80 3 70Cyclohexanone 90 10 93.60 94.10 96.20 96.30Conversion (°/o) 42.03 45.80 45 60 40 16 35 02
Reaction conditions: Activation temp. 500 OC, Feed rate 4 ml/h, Catalyst
(TL82) weight 2.7 g.
Table 3.12 Effect of catalyst activation temperature
Selectivity % 500 °C 600 °C 650 °c 700 °CCyclohexene 8.90 5.20 3.10 3.00Cyclohexanone 90.10 94.80 96.90 97.00Conversion (%) 42.03 48.86 39.16 28.06
Reaction conditions: Activation temp. 500 “C, Feed rate 4 ml/h, Catalyst
(TL82) weight 2.7 g.

Table 3.13 Effect of feed rate on the product selectivity and conversion of
cyclohexanol
Selectivity % 4 ml/h 6 ml/h 10 ml/hCyclohexene 8.90 7.80 5.60Cyclohexanone 90 IO 92.02 94 40Conversion (°/o) 42.03 37 18 32.20
3.3.3 Oxidative dehydrogenation of ethyl benzene and cyclohexane
The oxidative dehydrogenation of ethyl benzene and cyclohexane are studied at
425 °C in the presence of air In the absence of air conversion is very low and
moreover benzene and styrene are formed in almost equal amounts. In the
presence of air styrene is the main product. The same type of observations are
made in the case of cyclohexane also. Out of the four catalyst systems studied
TS82 showed better conversion and styrene yield. Conversion of ethyl benzene
follows the order TS82 > TS55 > TS28. Considerable amount of carbon
oxides are formed in the case of TS28 by the complete oxidation of
ethylbenzene. Single oxides SnO2 and La2O3 showed poor yield. According to
Tagawa et al the acid sites of Ho between 1.5 and -5 6 are proven to be the
active sites to adsorb ethyl benzene reversibly, whose oxidation on the
otherhand occurs on the basic sites of pKa between 17.2 and 26.5 [35]. The
tendency to have maximum activity suggests the co-operative effect of the acid
base properties of the catalysts which varies with catalyst composition.
However, in the present systems no acid sites or basic sites in the
aforementioned ranges are observed. So it must be noted that apart from the
acid base properties of catalysts, their redox properties also influence the
catalytic activity to a greater extent. In this reaction, the catalytic activity
84

increases as a fimction of SnO2 content. Hence Sn" sites may be the active
sites in the oxidative dehydrogenation reaction. The addition of rare earth
oxide increases the surface area and amorphous nature of the catalysts. These
factors also may contribute towards increase in catalytic activity Moreover the
oxygen in the rare earth oxide lattice are highly mobile.
Table 3.14 Effect of catalyst composition on the selectivity of styrene
Product TS82 TS55 TS28 TL82 SnO2 La2O:.distribution %
Benzene 4.49 5.40 1.19 3 75 0.31 0.18Ethylbenzene 70.41 81.95 85.95 72.12 94.40 96.10Styrene 23.68 9.42 5.00 22.82 4.90 3.10Carbon oxides 1 42 3.23 7.86 1.31 0.39 0.72Conversion 29 59 18.05 14.05 27.88 5 60 3 90(°/o)
Reaction conditions: Activation temp. 500 °C, Reaction temp. 450 °C Feed
rate 4 ml/h, Catalyst weight 2.7 g.

Table 3.15 Reaction in the absence of air
Product Absence Presencedistribution % of air of airBenzene 3.38 4.49Ethylbenzene 92.31 70.41Styrene 3.23 23.08Carbon oxides l 08 1 42Conversion (%) 7.69 29.59
Reaction conditions: Activation temp. 500 °C, Reaction temp. 450 °C, Feed
rate 4 ml/h, Catalyst (TS82) weight 2.7 g.
Table 3.16 Oxidative dehydrogenation of cyclohexane over TL82
Product Absence Presencedistribution % of air of airBenzene 0.66 4.80Cyclohexene 3.83 14.20Cyclohexane 95.13 78.50Others 0.38 2.50Conversion (%) 4.87 21.50
Reaction conditions: Activation temp. 500 °C, Reaction temp. 450 °C, Feed
rate 4 ml/h, Catalyst (TL82) weight 2.7 g.
86

3.4 ALKYLATION OF PHENOL, ANISOLE AND ANILINE WITH
METHANOL
3.4.1 Alkylation of Phenol with methanol
Conversion and selectivities of different products in the alkylation of phenol
with methanol over Sn-La and Sn-Sm binary mixed oxides of varying
composition are shown in Table 3 17 It can be seen that all the catalysts give
very little O-alkylated products and hence the C-alkylation takes place
predominantly over these catalyst systems. The selectivity of o-cresol and 2.6
xylenol, which are the main products varies with the catalyst composition.
Maximum 2,6-xylenol selectivity is observed in the case of TS55 and TL55
catalysts. Moreover some amount of trimethyl phenols are also formed over
these catalysts. In the case of TS82 and TL82 o-cresol is the main product,
whereas TS28 and TL28 afforded o-cresol and 2,6-xylenol in nearly equal
amounts. The conversion of phenol over these two catalysts is lesser, which is
due to lower surface area of these samples. It is well known that the selectivity
of products depends on the acid-base properties of the catalysts [36]. Oxide
catalysts are reported to be more selective for the synthesis of 2,6-xylenol and
o-cresol [3 7].
At low temperatures (250 °C) anisole and o-cresol are formed at a
phenol conversion of only 2.64%, anisole being the main product (selectivity
85.64%). It is reported that the activation energy of O-alkylation is lower than
that of C-alkyation [3 8]. As the temperature is increased o-cresol selectivity is
decreased while the selectivity of 2,6-xylenol is enhanced, alongwith small
amounts of trimethyl phenol. In the temperature range 300-425 °C, the
87

selectivity of anisole remained practically constant. There can be two
important pathways for the formation of 2,6-xylenol and o-cresol. First one is
through the fonnation of anisole formed initially, which further react with
methanol to give 2,6-xylenol via methylanisole isomerisaton. Second one is
direct C-alkylation in which o-cresol formed initially react again with one mole
of methanol to give 2,6-xylenol.
.5,‘k_/\» -'5
I E-\‘_ ~-'»if '\\,Jv\ . .O‘ I]. 9 C; ICi'i K lI {c}._,<, 1K .'.“J H L!It
/ l_/ +1 ciraow. . 3C\l¢l\/CH‘'\.a .\ ‘ (I3)(G) O‘Glk5'[G“'iO” it‘) C'C”’-‘;-"lC-3'30“ (C) lntcr rnoi-2'cul;:c.'
r.zc;c'i‘.c.'~.
Fig. 3.24. Pathways of phenol alkylation.
88

The surface acid base properties of the catalysts determine the reaction
mechanism and reaction pathway. It is reported that acidic catalysts such as
silica-alumina or condensed phosphoric acid promote the O-alkylation reactions
giving phenyl ethers while basic catalysts such as MgO or ZnO-Fe2O; promote
the direct alkylation giving o-cresol without passing through the phenyl ether
intermediate [39,40]. The ortho selectivity of the catalysts (formation of o
cresol, 2,6-xylenol, 2- methylanisole) can be attributed to the nature of
adsorption of phenol over the catalyst surface. As described by Tanabe. the
phenolate ion is adsorbed such that the ortho position is very near to the
catalyst surface in the case of basic catalysts such as MgO, hence the ortho
position can be methylated. However the interaction of acidic catalysts are
different which influence the electron current around the benzene ring such that
the aromatic ring lie parallel to the catalyst surface.
£03H c‘) II’! <|3—©3lr . ,,_. .. -: ,_ v. _ » K3 -v-
/3*-s-7*/0'/7,;-‘~l3;r7 ,0 /.7’.‘l-‘;‘,,', «,’/’/,'(,"",«,’/O 17/" f/7/(37/7vr'= 3' :»7/>;7/’7i/////'/./:.4«/’/// //.42.///://; V./,/,<-A2;//7 ;//7/://///;///,-’//,.. I,(:1) (b)
Fig. 3.25. Adsorption of phenol on (a) MgO and (b) A1203.
89

So the methylation can takes place at all possible positions. This is actually
observed in the case of acidic catalysts. It has been found that catalysts with
strong acid sites favour O-alkylation while weak acid sites or strong basic sites
favour C-alkylation [42]. In the present case to understand the mechanism by
which the alkylation takes place we carried out the following experiments. We
found that at 350 °C o-cresol and 2,6-xylenol are the main products. If the
reaction proceeds via anisole intermediate at low phenol conversions, anisole
must be formed. So we increased the feed rate (decreased the contact time)
step by step. But even at low contact time (higher feed rate) only a small
amount of anisole is formed. The selectivity of anisole remained constant with
increase in phenol conversion, while the yield of o-cresol reached a maximum,
then decreased with consequent increase in the yield of 2,6-xylenol. These
results indicate that the o-cresol undergo secondary reactions to give 2,6
xylenol and trimethyl phenol to a greater extent. From these results it is
concluded that the formation of anisole does not occur appreciably over these
catalysts, and hence the alkylation of phenol over these catalysts proceedes
through direct C-alkylation without the intervention of anisole as theintermediate. When a mixture of o— cresol and methanol in 1'7 molar ratio was
passed over these catalysts a large amount of 2,6-xylenol is formed.
When a mixture of anisole and methanol were passed over these
catalysts 2,6-xylenol 80.52 %, cresol 8.59 %, phenol 9.2 % and TMP 1.43 %
are fonned at a conversion of 27.21 %. This means that the conversion of
anisole to 2,6-xylenol is possible over these catalysts. When 2- methylanisole
alone was passed over these catalysts at the same temperature and it can be
seen that 2,6-xylenol is the main product alongwith small amounts of cresol
and TMP This supports the above mechanism for the formation of 2,6-xylenol
from anisole.
90

We tried to correlate the acid base properties of the catalysts with
dehydration and dehydrogenation activity employing cyclohexanol
decomposition as a test reaction. The selectivity of cylohexene is found to be
in the order TL55 > TL28 > TL82 and TS55 > TS28 > TS82. So TS55 and
TL55 systems are more acidic and TS82 and TL82 systems are least acidic.
Now the product selectivity in the alkylation of phenol with methanol can be
easily correlated with the acid base properties of the catalysts. The higher
selectivity of secondary alkylated product, 2,6-xylenol in the case of TS55 and
TL55 must be due to its higher acidity Whereas over less acidic systems TS82
and TL82 o-cresol is the main product. In the decomposition of cyclohexanol.
dehydrogenation was the main reaction. However, in the reaction of
isopropanol and isobutanol selectivity of dehydration products was high. Only
weak acid sites are required for the dehydration of isopropanol and isobutanol.
Stronger acid sites are needed for the dehydration of cyclohexanol.
Qualitatively it can be concluded that most of the acid sites present on these
catalysts are weak acid sites. From titration methods it is found that
comparatively strong basic sites are also present on these systems. These
observations are supported by the observation of Benzouhanava et al that the
weak acid sites or strong basic sites faour C-alkylation [43]. Moreover Tilmat
Muy et al and Marzaenski etc. claimed that weak acid sites favour C-alkylation
[44,45].
91

Table 3.18 Effect of catalyst composition in the alkylation of phenol with
methanol.
Product TS82 TS55 TS28 TL82 TL55 TL28distribution
(Wt°/o)
Anisole 0.15 0.31 0.18 0.15 0.30 0.17Phenol 23.86 23.21 40.00 24.69 24.39 43.82o-Cresol 45.61 22.74 29 96 43.25 26.97 26.752,6-Xylenol 27.64 41.79 27.26 29.14 41 84 26.57TMP* 2.70 9.05 1 43 2.45 6.50 1.58Others 0.04 2.90 1.17 0.32 nil 1 11Conversion 76.14 76.79 60 75.31 75.61 56.18Sel.C-alkylation 99.81 99.60 99.70 99.80 99.60 99.67Sel.o-cresol 59.90 29.61 49.93 57.42 35 66 47.61Sel. 2,6-xylenol 36.30 54.42 45.43 38.69 55.33 47.29
* Trimethylphenol
Calcination temp. 500 "C, Reaction temp. 350 "C, Molar ratio ( Phenol
methanol ) 1:6, Feed rate 4 ml/h, T08 1 h, Catalyst. 3 g.
92

conversion wt%
0 5 B 8 8 8 8 5‘ 8 8
8
selectivity %
Temperature °C
—O—conversion -9-<—se|.aniso|e —o——se|.o-cresol —I—sel.2,6xyIenol
Figure 3.26 Effect of temperature in the alkylation of phenol with methanol
Calcination temp. 500 °C, Molar ratio ( Phenol methanol ) 1'6, Feed rate. 4
ml/h, Catalyst (TS82) 3 g.
93

Table 3.19 Effect of Feed rate on the selectivity of products in the
alkylation of phenol with methanol.
Product 4 ml/h 6 ml/h 8 ml/h 10 ml/hdistribution %
Anisole 0.14 0.19 0.20 0.21Phenol 23 86 38.69 49.23 69 90o-Cresol 45.61 43.44 39.14 24.202,6-Xylenol 27.64 16.74 10.88 5.69TIVH’ 2.70 0.91 0.21 nilConversion 76.14 61.31 49.23 30.1Se1.C-alkylation 99.81 99.76 99.60 99. 31Sel.o-cresol 59.90 70.85 79.50 80.39Sel.2,6-xylenol 36.30 27.30 22.10 18.90
Calcination temp. 500 °C, Reaction temp. 350 OC, Molar ratio ( Phenol
methanol ) 1:6, TOS 1 h, Catalyst TS82 3 g
94
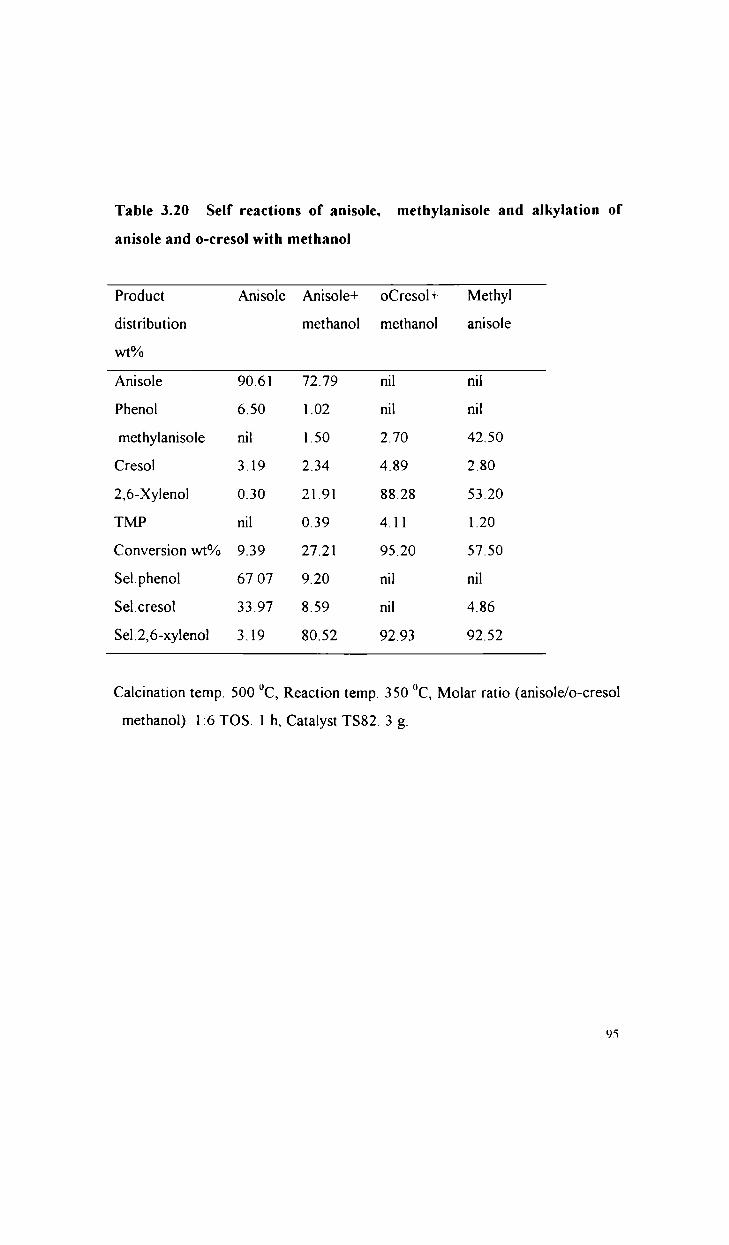
Table 3.20 Self reactions of anisole, methylanisole and alkylation ofanisole and o—cresol with methanol
Product Anisole Anisole+ oCresol+ Methyldistribution methanol methanol anisolewt%
Anisole 90.61 72.79 nil nilPhenol 6. 50 1.02 nil nilmethylanisole nil 1.50 2. 70 42.50Cresol 3.19 2.34 4.89 2.802,6-Xylenol 0.30 21.91 88.28 53.20TMP nil 0.39 4.11 1.20Conversion wt% 9.39 27.21 95.20 57.50Sel.phenol 67 07 9.20 nil nilSel.creso1 33.97 8.59 nil 4.86Sel.2,6-xylenol 3.19 80.52 92.93 92.52
Calcination temp. 500 °C, Reaction temp. 350 °C, Molar ratio (anisole/o-cresol
methanol) 1:6 TOS. 1 h, Catalyst TS82. 3 g.
3.4.2 Alkylation of anisole with methanol
In order to choose an optimum feed mix, the alkylation reactions were carried
out at 380 °C taking several anisole to methanol molar ratios. In the figure the
selectivity of products and conversion are plotted against molar ratios (Figure
3.28). We have selected a molar ratio of 16 for further study as the
conversion and selectivty were better
The product distribution and selectivity to 2,6-xylenol over Sn-La and
Sn-Sm binary mixed oxides of different compositions are presented in Table
3.20. It can be seen that 2,6-xylenol is the main product in all cases (> 80%).
Selectivity of products is not much influenced by catalyst composition. In all
cases the amount of dealkylated product, phenol is very less. The lower
activity in the case of TL28 and TS28 catalysts is attributed to their low surface
area. We compared the activity of the present catalyst systems with two acidic
catalysts H-beta zeolite and silica-alumina and a basic catalyst, Mg-Al
hydrotalcite. The results are summarised in Table 3.21 All these catalysts
gave poor selectivity to 2,6-xylenol under same experimental conditions. Mg
Al hydrotalcite afforded 2,6-xylenol with a selectivity of 58.4%, alongwith
other products like methylanisole and o-cresol [46]. However, the
dealkylation is very less in this case compared to silica-alumina and H-beta
zeolite. Dealkylation must be due to the presence of strong acid sites present in
these catalysts.
The effect of temperature on the conversion and selectivity of 2,6
xylenol was studied in the temperature range 350-420 °C. Anisole conversion
increased with temperature and also an increase in the selectivity of 2,6
xylenol is observed. Moreover the selectivity of methylanisole decreases with
increase in temperature and are not detected above 380 °C. This suggests that
‘)6

the methylanisole as soon as it is formed is isomerised to xylenol. To
understand the mechanism in detail, we conducted the reaction of
methylanisole alone at different temperature and contact time. As the
temperature increases the conversion to xylenol increases. Conversion to 2,6
xylenol is fimher increased by increasing the contact time of the feed. If the
reaction takes place via the isomerisation of methylanisole the effect of feed
rate will give an idea about the mechanism of the reaction. When we changed
the feed rate from 4 ml/h to 10 ml/h (Figure3.29),it is found that the selectivity
of methylanisole increases with increase in feed rate with a concomitant
decrease in the selectivity of 2,6-xylenol. As expected the conversion of
methylanisole dropped down at higher feed rates. Based on the above results
the alkylation of anisole to 2,6-xylenol takes place in two steps, (i). Formation
of methylanisole and (ii) lsomerisation of methylanisole to 2,6-xylenol.
ocna OCH3<5 CHJOH CH3T
(b)
I
I
.' (c)I
l
OH
rgcjfi], CH3
Fig. 3.27 Pathway of anisole alkylation.
97
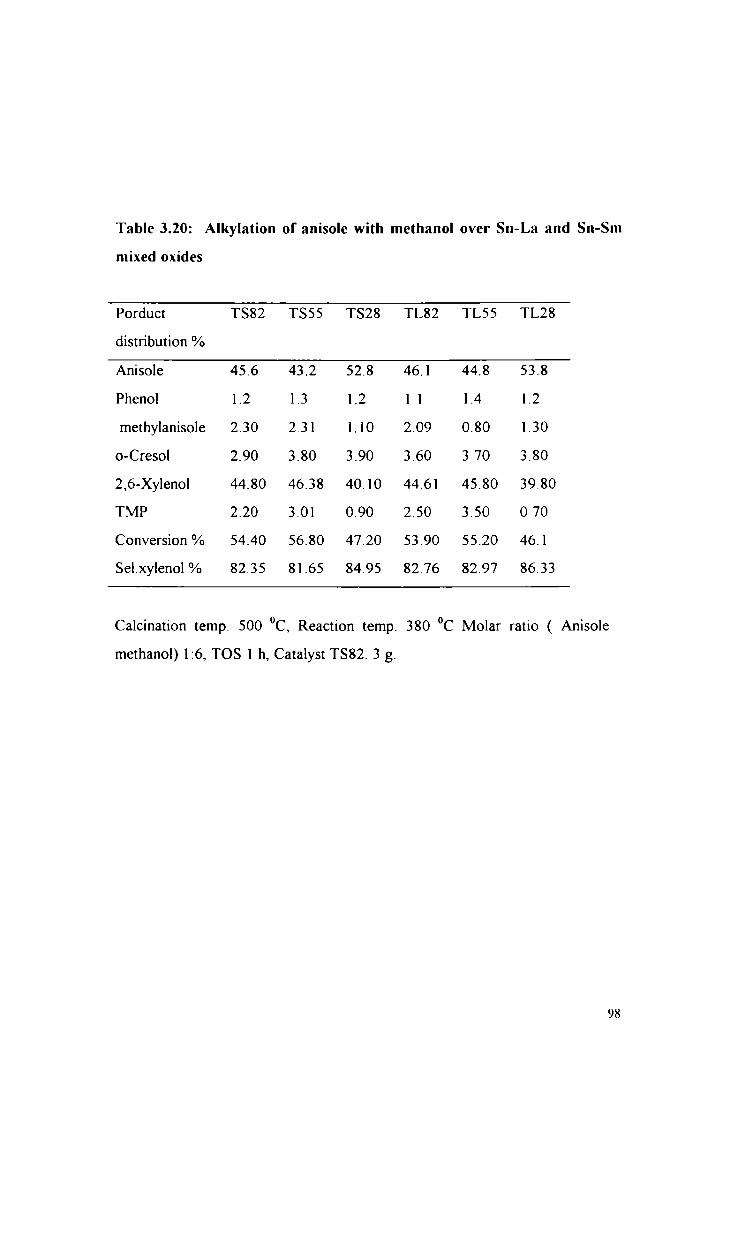
Table 3.20: Alkylation of anisole with methanol over Sn-La and Sn-Smmixed oxides
Porduct TS82 TS55 TS28 TL82 TL55 TL28distribution %
Anisole 45.6 43.2 52.8 46.1 44.8 53.8Phenol 1.2 1.3 1.2 1 1 1.4 1.2methylanisole 2.30 2.31 1.10 2.09 0.80 1.30o—Cresol 2.90 3.80 3.90 3.60 3 70 3.802,6-Xylenol 44.80 46.38 40.10 44.61 45.80 39.80TMP 2.20 3.01 0.90 2.50 3.50 O 70Conversion°/o 54.40 56.80 47.20 53.90 55.20 46.1
Se|.xylenol% 82.35 81.65 84.95 82.76 82.97 86.33
Calcination temp. 500 OC, Reaction temp. 380 °C Molar ratio ( Anisole
methanol) 1:6, TOS 1 h, Catalyst TS82. 3 g.
98
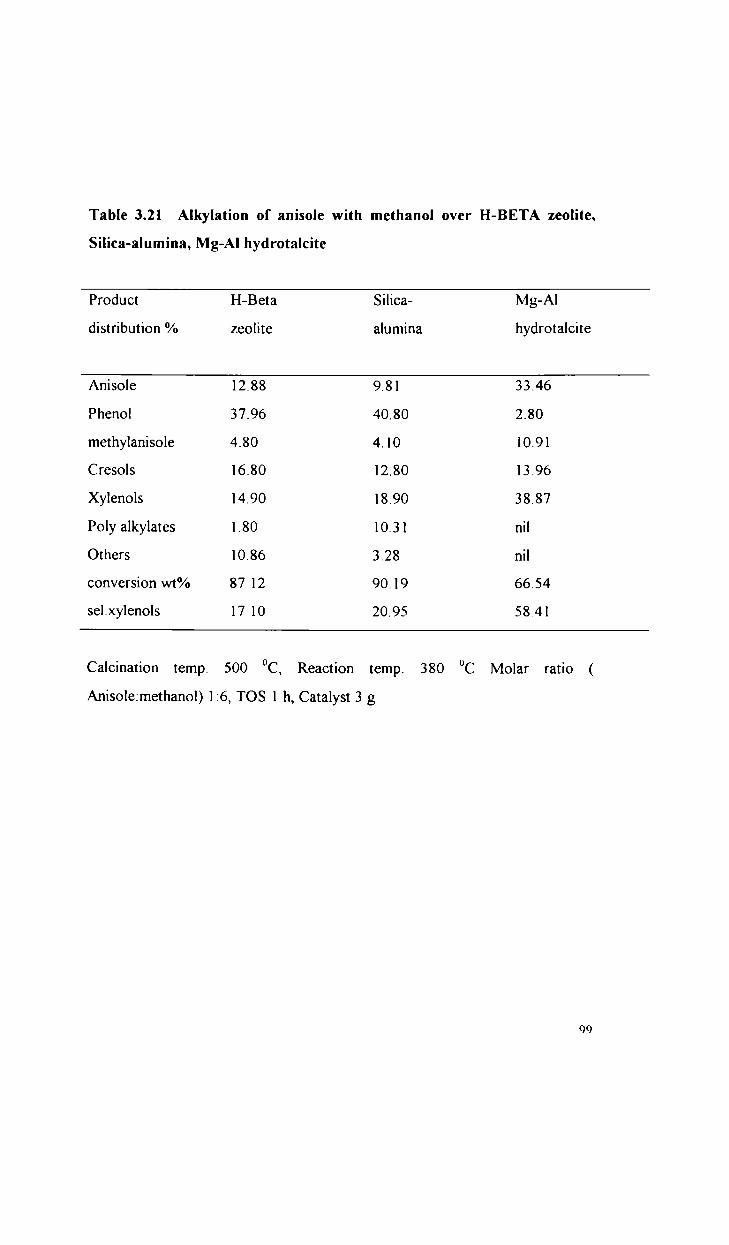
Table 3.21 Alkylation of anisole with methanol over H-BETA zeolite.
Silica-alumina, Mg-Al hydrotalcite
Product H-Beta Silica- Mg-Aldistribution % zeolite alumina hydrotalcite
Anisole 12.88 9.81 33.46Phenol 37.96 40.80 2.80methylanisole 4.80 4.10 10.91Cresols 16.80 12.80 13.96Xylenols 14.90 18.90 38.87Poly alkylates 1.80 10.31 nilOthers 10.86 3.28 nilconversion wt% 87 12 90.19 66.54se1.xyleno1s 17 10 20.95 58.41
Calcination temp. 500 "C, Reaction temp. 380 "C Molar ratio (
Anisolezmethanol) 1:6, TOS 1 h, Catalyst 3 g
99
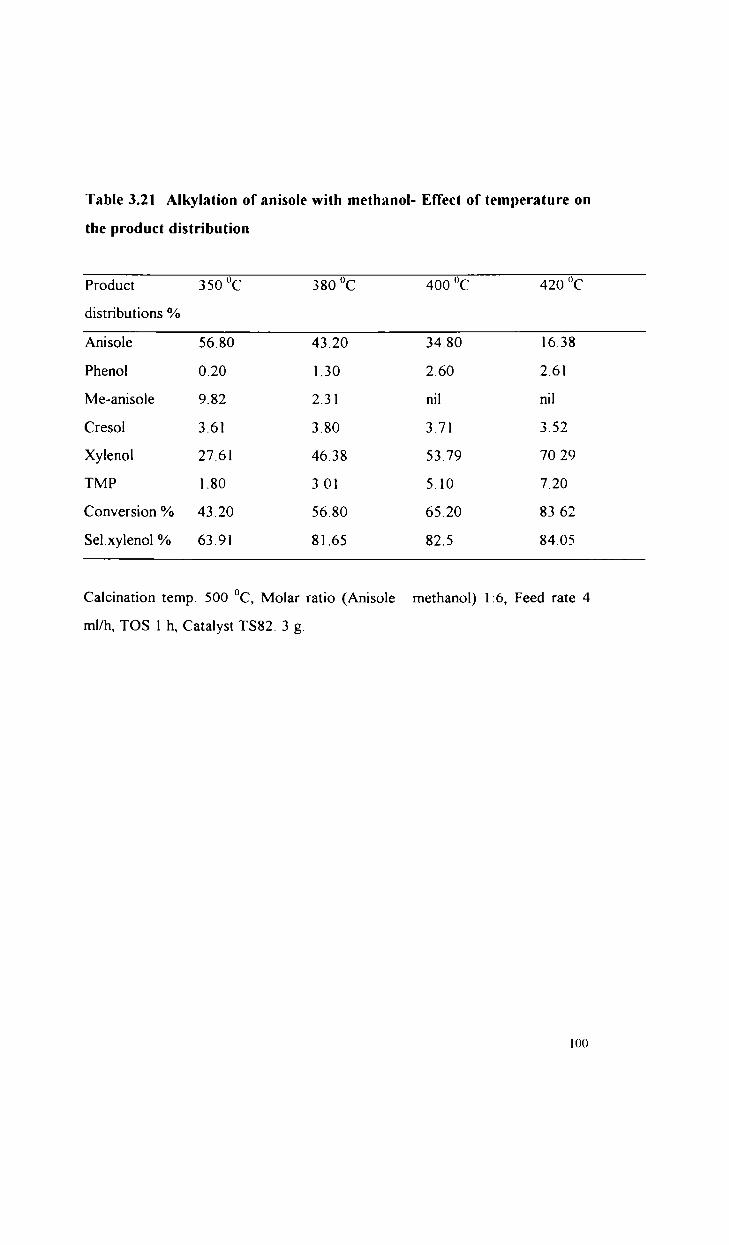
Table 3.21 Alkylation of anisole with methanol- Effect of temperature on
the product distribution
Product 350 "C 330 °C 400 "C 420 "Cdistributions %
Anisole 56.80 43.20 34.80 16.38Phenol 0.20 1.30 2.60 2.61Me-anisole 9.82 2.31 nil nilCresol 3.61 3.80 3.71 3.52Xylenol 27.61 46.38 53.79 70.29TMP 1.80 3 01 5.10 7.20Conversion % 43.20 56.80 65.20 83 62Sel.xylenol % 63.91 81.65 82.5 84.05
Calcination temp. 500 DC, Molar ratio (Anisole methanol) 1:6, Feed rate 4
ml/h, TOS 1 h, Catalyst TS82. 3 g.
l 00
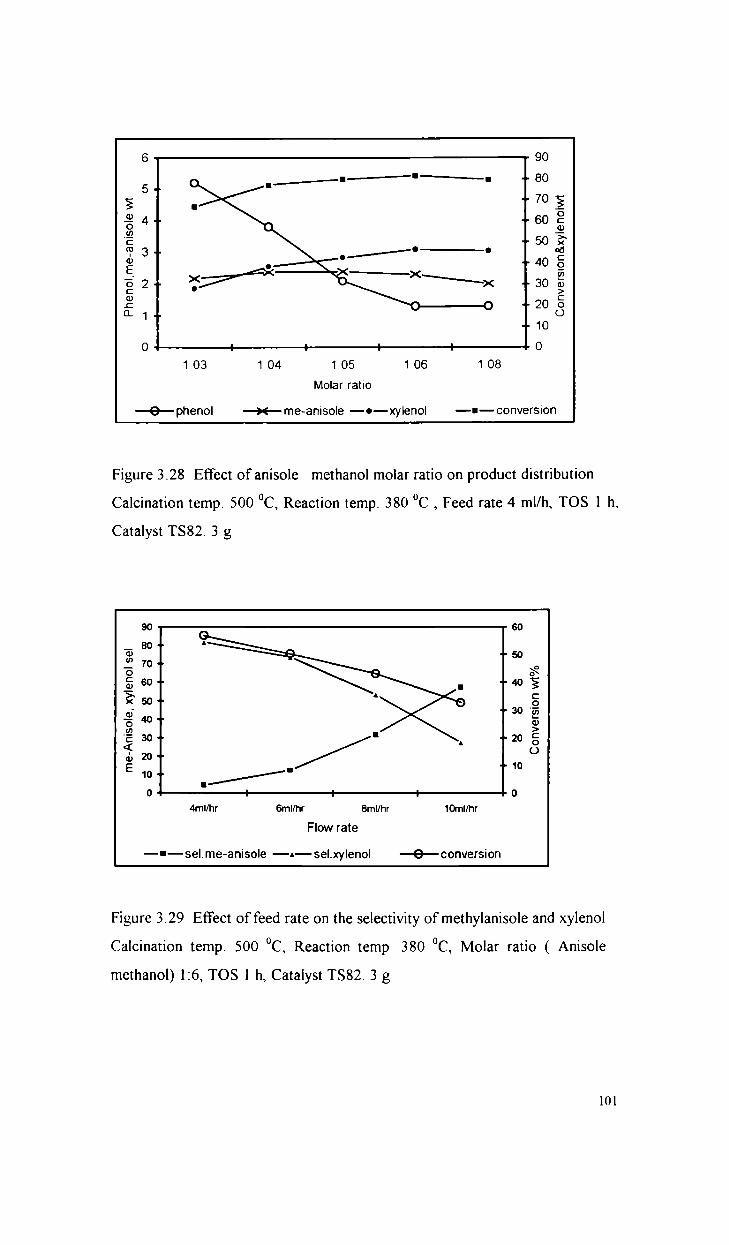
6 90-- 80
5 ..§ an %(Dg 4 .. .. 50 E"E -- 50 Q33 3 “EE. -r 40 pg6 2 -- 30 EC >E’ -- 20 8CL 1 .r. O.. 10O : : : : 01 03 1 04 1 05 1 06 1 08Molar ratio
-9-—pheno| —)<-—me-anisole —o—xy|eno| —u—conversion
Figure 3.28 Effect of anisole methanol molar ratio on product distribution
Calcination temp. 500 °C, Reaction temp. 380 °C , Feed rate 4 ml/h, TOS 1 h,
Catalyst TS82. 3 g
me—Anisole, xylenol sel
Conversion wt°/o
4ml/hr 6ml/hr 8ml/hr 10ml/hrFlow rate
—I—seI.me—aniso|e —n— sel.xy|eno| —6—conversion
Figure 3.29 Effect of feed rate on the selectivity of methylanisole and xylenol
Calcination temp. 500 °C, Reaction temp 380 °C, Molar ratio ( Anisole
methanol) 1:6, TOS 1 h, Catalyst TS82. 3 g.
101
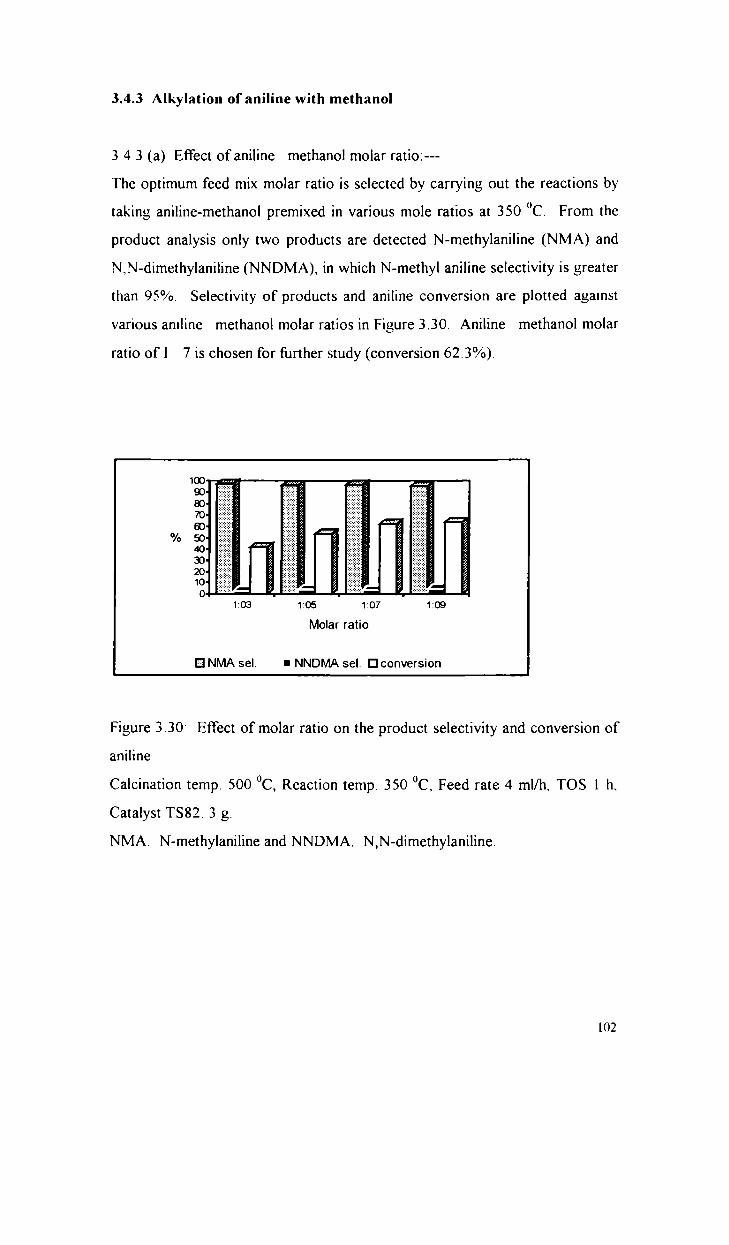
3.4.3 Alkylation of aniline with methanol
3 4.3 (a) Efl°ect of aniline methanol molar ratio:--
The optimum feed mix molar ratio is selected by carrying out the reactions by
taking aniline-methanol premixed in various mole ratios at 350 "C. From the
product analysis only two products are detected N-methylaniline (NMA) and
N,N-dimethylaniline (NNDMA), in which N-methyl aniline selectivity is greater
than 95%. Selectivity of products and aniline conversion are plotted against
various aniline methanol molar ratios in Figure 3.30. Aniline methanol molar
ratio of 1 7 is chosen for fiirther study (conversion 62.3%).
oaasseaasaé
%:4
32-7
'f_C
95
2:
¥255"".
1:03 1:C5 1:07 1:CBMolar ratio
NMA sel. I NNDMA sel. Elconversion
Figure 3.30" Effect of molar ratio on the product selectivity and conversion of
aniline
Calcination temp. 500 °C, Reaction temp. 350 °C, Feed rate 4 ml/h, TOS l h,
Catalyst TS82. 3 g.
NMA. N-methylaniline and NNDMA. N,N-dimethylaniline.
I02
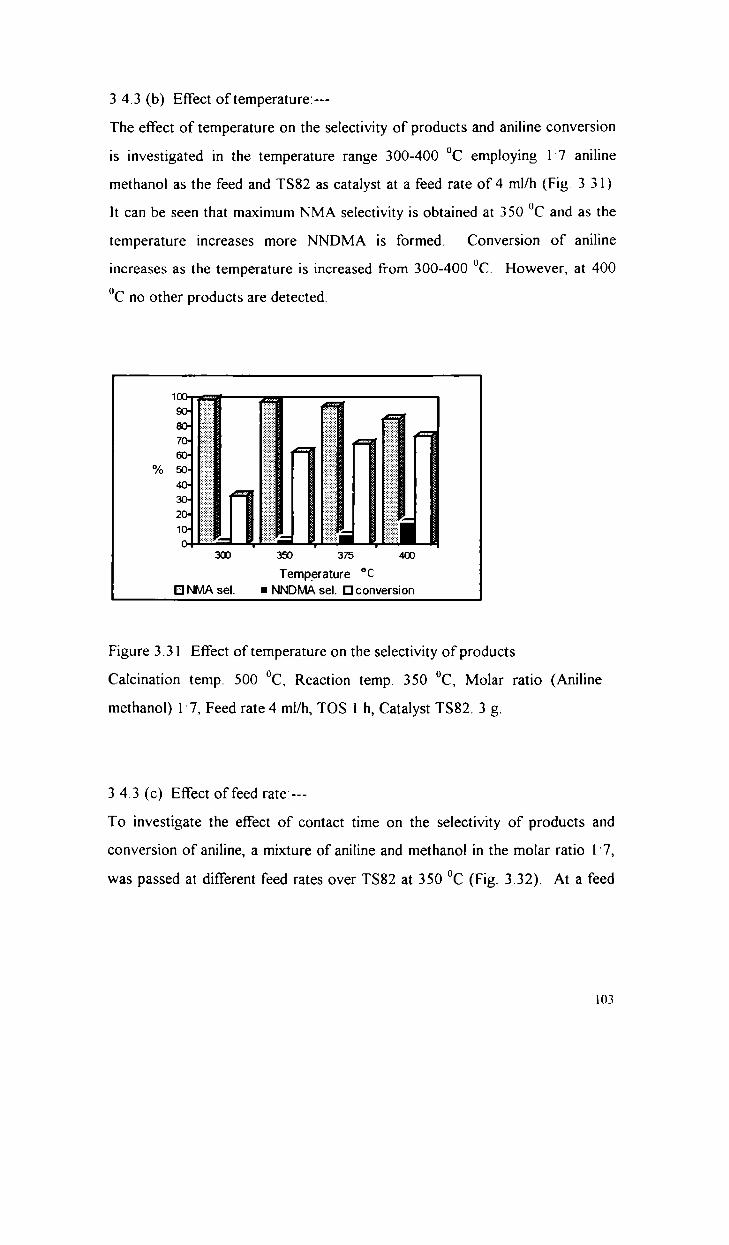
3 4.3 (b) Effect of temperature:--
The effect of temperature on the selectivity of products and aniline conversion
is investigated in the temperature range 300-400 "C employing l'7 aniline
methanol as the feed and TS82 as catalyst at a feed rate of4 ml/h (Fig. 3 3 I)
It can be seen that maximum NMA selectivity is obtained at 350 "C and as the
temperature increases more NNDMA is formed. Conversion of aniline
increases as the temperature is increased from 300-400 °C. However, at 400
0C no other products are detected.
3(1) 350 375 4CDTemperature °C
El NMA sel. I NNDMA sel. El conversion
Figure 3.3] Effect of temperature on the selectivity of products
Calcination temp. 500 °C, Reaction temp. 350 °C, Molar ratio (Aniline
methanol) 1'7, Feed rate 4 ml/h, TOS l h, Catalyst TS82. 3 g.
3 4.3 (c) Effect offeed rate:--
To investigate the effect of contact time on the selectivity of products and
conversion of aniline, a mixture of aniline and methanol in the molar ratio 17,
was passed at different feed rates over TS82 at 350 °C (Fig. 3.32). At a feed
l03

rate of 10 ml/h, 99 6% NMA selectivity is obtained( aniline conversion 29.6%)
At higher feed rates contact time is low and hence subsequent alkylation of
NMA is difficult. The conversion of aniline decreases as expected at higher
feed rates.
1CD I —_.— I I 70$4 9 H)%-L \ "Uo oOK’ 70+ L 5DEo\3 5° 0g 40 0Z 3)!20110‘ -10o ‘ J - . - 0Flow rate ml/h
—I— NMA sel. —a— NNDMA sel. —o— conversion
Figure 3.32 Effect of feed rate on the selectivity of products
Calcination temp. 500 OC, Reaction temp. 350 "C, Molar ratio (Aniline
methanol) 1'7, TOS 1 h, Catalyst TS82. 3 g.
3 4.3(d) Effect of catalyst composition on the selectivity of products:--
The product selectivity and aniline conversion as a function of catalyst
composition is presented in the Figure 3.33. The selectivity of l\H\/IA decreases
in the order TL82>TL28>TL55 and TS82 > TS28 > TS55. In the case of
TS55 and TL55 an appreciable amount of dialkylated product is formed. The
maximum NMA selectivity is found in the case of TL82. The lower aniline
conversion in the case of TL28 and TS28 must be due to their low surface
area. The selectivity of products (NMA and NNDMA) can be correlated
with the dehydration or dehydrogenating activity in the decomposition of
cyclohexanol (Fig.3.36). The selectivity of dehydrogenation products are in the
I04

order TL82 > TL28 > TL55 which correlates with the NNDMA selectivity
TS55 and TL55 systems which are more acidic give more NNDMA. This can
be accounted by the presence of relatively stronger acid sites, which might be
necessary for the consecutive methylation of aniline in the formation of N,N
dimethylaniline. As the basicity increases NNDMA selectivity decreases with a
concomitant increase in the selectivity of NMA. The mechanism of aniline
methylation is shown in Figure 3.37, which involves simultaneous participation
of both acid and basic sites [47]. However, the overall basicity must be
determining the product selectivity The higher selectivity of NMA may be due
to the fact that the removal of hydrogen from N-methylaniline and approach of
methyl group to the N-atom in a concerted way possesses a high order of steric
hindrance [48]. However, at higher temperatures dialkylation may occur
provided the desorption of NMA is not fast.
$
oasassaasaé
T882 T555 T828 TL82 TL55 11.23catalysts
l\MA sel. I NNDMA sel. Dconversion
Figure 3.33 Effect of catalyst composition on the selectivity of products and
aniline conversion
Calcination temp. 500 °C, Reaction temp. 350 °C, Molar ratio (Aniline
methanol) 1:7, Feed rate 4 ml/h, TOS l h, Catalyst TS82. 3 g.
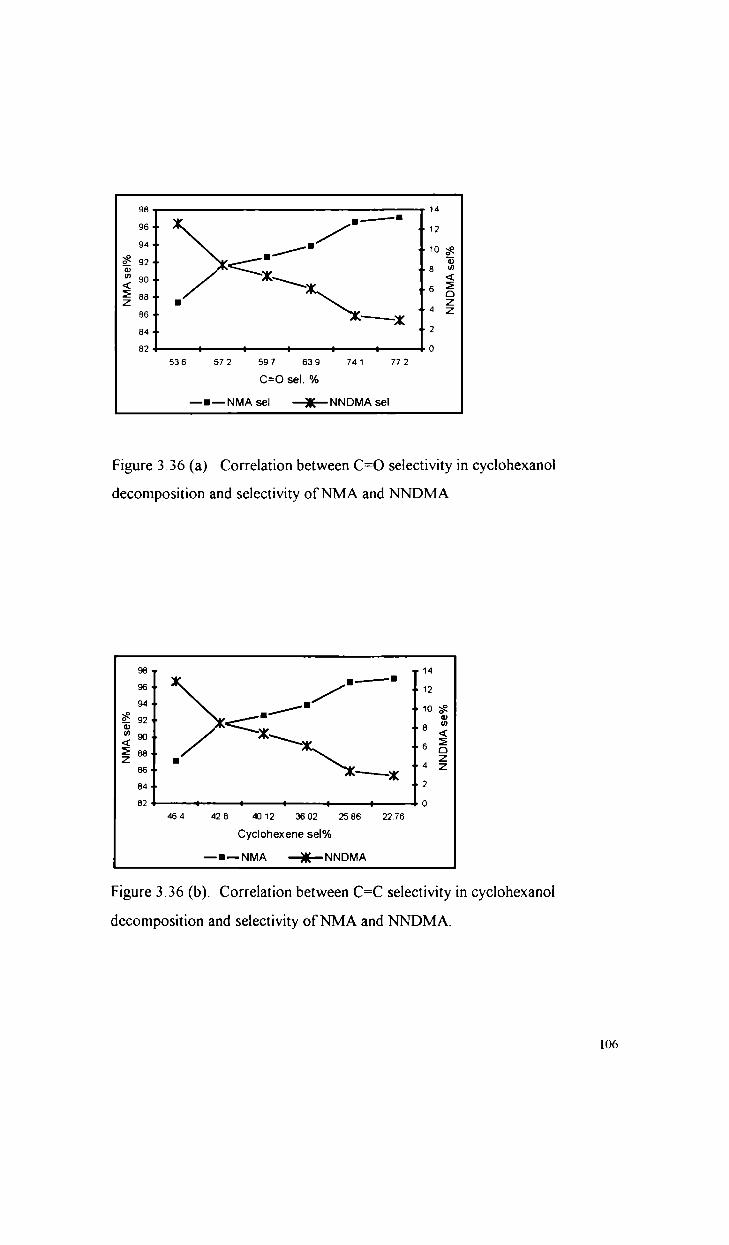
98 14._._——-I96 «- / ..1294 \" ‘ /- "10 ‘E1 92» < 8 3E 90 .. l EE 33.. V6 D
..z u 4 :§'56» ex54 . 1- 2B2 : : : : : O536 572 59.7 639 741 772
C=O sel. %
—I—NMA sel —X—NNDMA sel
Figure 3.36 (a) Correlation between C=O selectivity in cyclohexanol
decomposition and selectivity of NMA and NNDMA
93 14.__.—-I96 / 12\° 94 1?. 10 §% 92 < B U,as 90 x <:2 \ e 32 B3 I Z4 z36 ex64 232 . : - : : : . 0
464 423 4012 3602 2586 22.76Cyclohexene se|%
—I—NMA —X—NNDMA
Figure 3.36 (b). Correlation between C=C selectivity in cyclohexanol
decomposition and selectivity of NMA and NNDMA.
106

./‘x.
@/W’ 30)‘(I3 -a--——> H-H-CII, Ol
‘ 1,-_I_-_.7_-r_I.lIf.‘.'.|.'.".'.' ‘j.'7;'I7. 71/.’...... .. '7"
C07
-.——r/-_.-.-V; A‘-'6" l O/ll........ -— llns-r H'”‘C”)
Fig. 3.37 Mechanism ofaniline alkylation.
3.4.3 (e) Time on stream study of the catalysts
The activity of the catalyst for a 5 hours period is tested to see whether any
deactivation is taking place. The catalysts TL82 and TS82 deactivates very
slowly however faster deactivation is observed in the case of TS55 and TS28.
Conversion
wt°/o
o 8 3 8 8
0' am3 4Time on stream hour
.4 yqn
—~—rLa2 —-—TL55 —.—ri23 —o—rsa2
Figure 3.38 Time on stream study ofthe catalysts in the methylation of aniline,
l07

3.4.-5 TRANSFER HYDROGENATION OF NITROBENZENE USING
ISOPROPANOL AS A HYDROGEN DONOR
A wide variety of homogenous as well as heterogeneous catalyst systems in
combination with different hydrogen donors have been employed for selective
fimctional group reductions [49]. Reduction of nitrobenzene can afford
nitrobenzene[50], phenyl hydroxylamine [51], p-aminophenol [52], azobenzene
[53], azoxybenzene [54], hydrazobenzene [55] or aniline [56] depending on the
reaction conditions.
Aniline and azoxybenzene are the major products of this reaction. The
selectivity of these products is greatly influenced by different reaction
parameters. Aniline is the end hydrogenation product of this reaction whereas
azoxybenzene is resulted from the partial reduction of nitro group. In the
reduction of nitro group the oxygen is progressively being replaced by
hydrogen. The reaction is highly exothermic, the heat of reaction being
estimated to be 130 kcal/mol [57]. The mechanism of fonnation of different
products is shown in Figure 3.39. The reaction proceeds via the intennediates
as proposed by Haber from his work on the electrochemical reduction of
nitrobenzene [58]. The final product aniline can be formed either from the
partially hydrogenated product, N-phenylhydroxylamine, or from azobenzene
or hydrazobenzene by reductive cleavage of these molecules. However when
separately tested, they failed to undergo reductive cleavage to aniline under
identical conditions over these catalysts. Hence formation of aniline via
azobenzene is excluded. Azoxybenzene found in the reaction mixture, which
might result from nitrosobenzene and N-phenylhydroxylamine finther confirm
the formation of this intennediates. Moreover N-phenylhydroxylamine is
completely converted to aniline over these catalysts.
108

Taking into account the above conclusions a plausible reaction pathway is
depicted in Figure 3 40, for the formation of aniline and azoxybenzene.
The activity of these catalyst towards transfer hydrogenation is
evidently due to their bifimctional behaviour. lsopropanol is adsorbed on the
basic site and the substrate on the adjacent acid site and finally the hydrogen is
transferred as hydride on to the substrate to be reduced [59].
The product distribution is greatly affected by the catalyst concentration
(Figure 3 41). At lower catalyst concentration (4%) nitrobenzene conversion is
complete. Selectivity of azoxybenzene is maximum at lower catalyst
concentrations whereas aniline selectivity is maximum at higher catalyst
concentrations (>l0%). When the catalyst concentration in the reaction
medium decreases the complete reduction of nitro group become less probable
leading to more partial reduction products like nitrosobenzene and N
phenylhydroxylamine which condense together to form azoxybenzene.
However, at higher catalyst concentration transfer of hydrogen becomes more
probable resulting in the formation of aniline selectively. The catalyst
concentration is varied between 4 to 20 % by weight of the substrate. The
catalytic activity of different catalysts follows the order TS82 >TS28>TS55
and TL82 > TL28 > TL55 (Fig 3 42). The observed order of catalytic activity
can be correlated with the dehydrogenation activity of different catalysts in
alcohol decomposition reactions which in turn is directly related to their
basicity
In the beginning of the reaction a small amount of nitrosobenzene is
detected. Maximum aniline selectivity is found during the first hour of the
reaction. Then it decreased steadily giving more partial reduction products as
indicated by the increase in amount of azoxybenzene. Other products like
azobenzene, hydrazobenzene etc, are absent in the final stages of the reaction.
109

An optimum catalyst concentration (10%) is chosen for observing changes in
the selectivity and conversion during five hour reaction period. At lower
catalyst concentrations products resulting from the partial reduction
predominates. However when sufiicient amount of catalyst is used these side
products are minimised even after five hour reaction time. Even at low catalyst
concentrations about 80% of the reaction is complete in just one hour There
afier the nitrobenzene conversion increases slowly taking about three more
hours for the complete conversion. This is evidently due to other competitive
reactions following the partial reduction of nitrobenzene. Use of other
hydrogen donors like hydrazine and ammonium formate instead of isopropanol
revealed that they are less effective as compared to the latter (Table 3.22).
Conversion as well as the selectivity of the products are notably influenced by
the use of different hydrogen donors. Employing ammonium formate as
hydrogen donor enhanced the selectivity of azobenzene at about 15%
nitrobenzene conversion; only traces of aniline being detected. When hydrazine
is used a mixture of all the products are obtained, showing good selectivity
towards azobenzene (62%). So in the case of mild hydrogen donors partial
reductions are prominent than the complete reduction to aniline.
The addition of varying quantities of DMSO affected the conversion as
well as the product selectivity (Table 3.23). DMSO concentration varied
between 20 to 60% by the weight of nitrobenzene. Nitrobenzene conversion is
unaffected even afier the addition of, 40% by weight of DMSO However.
fiirther increase in its concentration reduced the nitrobenzene to about 12%.
Selectivity of aniline is decreased by the addition of increasing amount of
inhibitor however a slight increase in aniline selectivity is observed at higher
(60%) DMSO concentration. Decrease in aniline selectivity is accompanied by
an increase in selectivity of azoxybenzene. An examination of effect of reaction
time indicate that at lower nitrobenzene conversion (5%) azobenzene is the
main product followed by azoxybenzene and small quantities of nitrobenzene
ll()
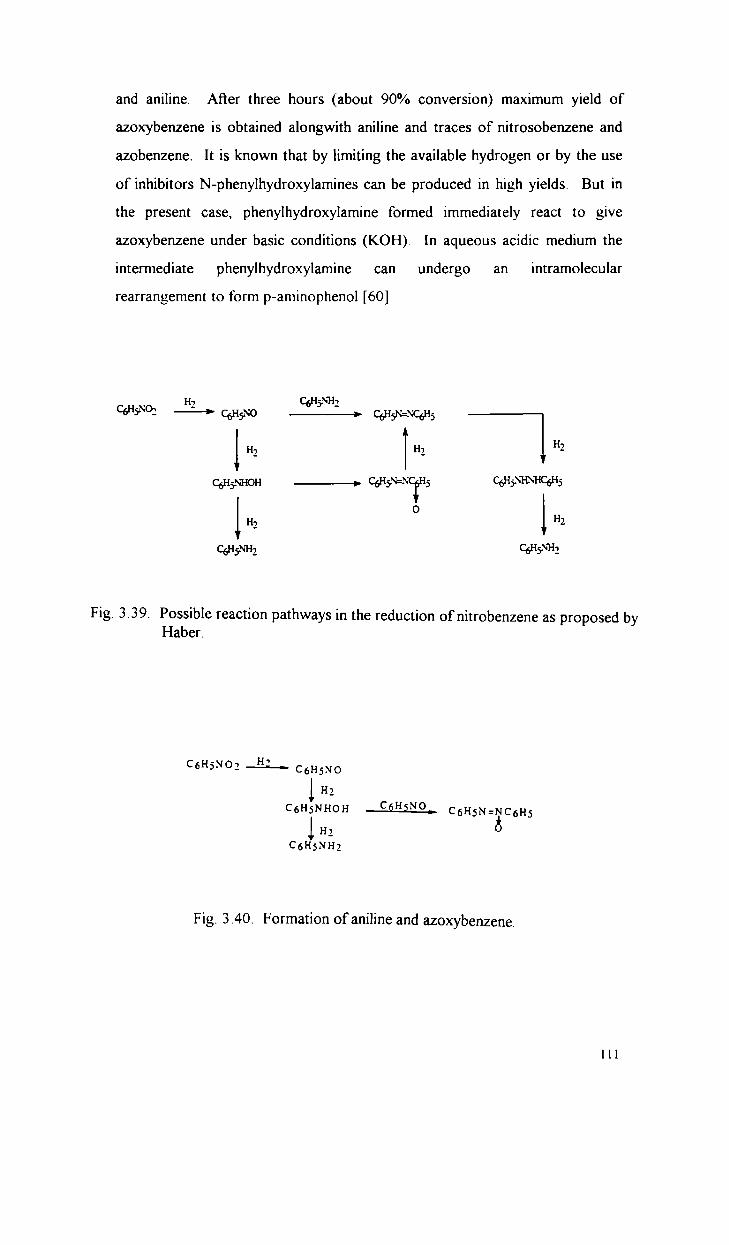
and aniline. Afler three hours (about 90% conversion) maximum yield of
azoxybenzene is obtained alongwith aniline and traces of nitrosobenzene and
azobenzene. It is known that by limiting the available hydrogen or by the use
of inhibitors N-phenylhydroxylamines can be produced in high yields. But in
the present case, phenylhydroxylamine formed immediately react to give
azoxybenzene under basic conditions (KOH). In aqueous acidic medium the
intermediate phenylhydroxylamine can undergo an intramolecular
rearrangement to form p-aminophenol [60]
--‘H7
C4350‘ ————> céfixo _£EE:;__,. qflgexgfls
1 H2 I H2 i H2C6H5NHOH ::> C6H5N=i"'Cf'l5 C6H.=>H‘<HC6H5H2 H2CGHSNHZ C6H5“H2
Fig. 3.39. Possible reaction pathways in the reduction of nitrobenzene as proposed byHaber.
- HH2
C5H5NHOH _£6_H_fl2. c5H5N=Nc6H5H2
C5H5NH2
Fig. 3.40. Formation of aniline and azoxybenzene_
lll
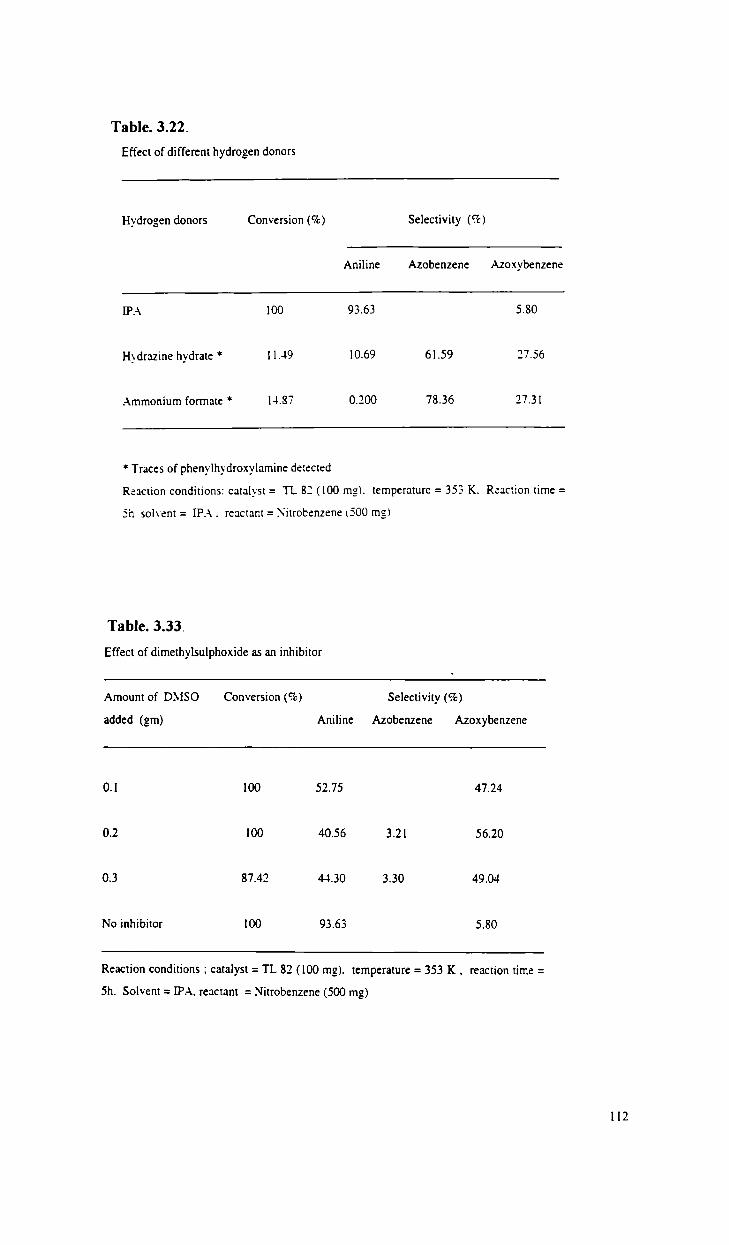
Table. 3.22.
Effect of different hydrogen donors
Hydrogen donors Conversion (%) Selectivity (‘."c)
Aniline Azobenzene Azoxybenzene
IP.-\ 100 93.63 5.80Hydrazine hydrate * 11.49 10.69 61.59 27.56
Ammonium formate * 14.37 0.200 73.36 27.31
* Traces of phenylhydroxylamine detected
Reaction conditions: catalyst: TL 82 (100 mg). temperature = 353 K. Reaction time =
Sh Solvent: 1P.-\. reactant=.\'itrobenzene (500 mg)
Table. 3.33.
Effect of dimethylsulphoxide as an inhibitor
Amount of D.\1SO Conversion (%) Selectivity (9%)added (gm) Aniline Azobenzene Azoxybenzene
0.1 100 52.75 47.240.2 100 40.56 3.21 56.200.3 87.42 44.30 3.30 49.04No inhibitor 100 93.63 5.80Reaction conditions ; catalyst = TL 82 (100 mg). temperature = 353 K . reaction time =
Sh. Solvent = IPA. reactant = Nitrobenzene (500 mg)
112

10 2°Catalyst Concentration (','.)
Fig. 3 41 Effect of catalyst concentration on the producrt selectivity
/':3In 2:
Z -- Selectivity of Azoxybenzene_/ 3 __ Selectivity o1 Aniline9) _ Conversion
v- ‘éJ
Fig. 3 42 Effect of catalyst composition on the product selectivity
113

Since these catalysts show activity in the reduction of nitrobenzene, they were
tested in the reduction of aromatics containing various reducible groups.
Recently Ni stabilised zirconia has been reported to show chemoselectivity in
transfer hydrogenation using propan-2-ol as a hydrogen donor. The results of
the reduction of various substrates is summarised in table]. It can be seen that
the present catalyst system efficiently reduces both nitrobenzene and
acetophenone. Remarkably p-nitrobenzophenone and cinnamaldehyde are
chemoselectively reduced to p-aminobenzophenone and cinnamyl alcohol
respectively Moreover C-Cl bond, C-CH; and C-OCH; are not affected by
reduction. Interestingly m-dinitrobenzene is regieoselectively reduced to m
nitroaniline.
Table 3.24: Transfer hydrogenation of various aromatic substrates using
propan-2-ol over TL82'
Substrate Time (h) Product Yield(%)bnitrobenzene 3 aniline 95p-chloronitrobenzene 3 p-chloroaniline 92p-nitroanisole 3 p-anisidine 93o-nitrotoluene 3.5 o-toludine 89m-dinitrobenzene 4 m-nitroaniline 65
m—phenylenediamine 22
acetophenone 3 1-phenethylalcohol 93benzophenone 4 benzhydrol 90p-nitrobenzophenone 3 p-aminobenzophenone 80cinnamaldehyde 3 cinnamylalcohol 72
‘Reaction conditions substrate 10 mmol, KOH 10 mmol, catalyst 10 wt% of
substrate, propan-2-ol 15 ml, reflux. blsolated by column chromatography
ll-1

REFERENCES
10.
11.
12.
13.
14.
15
16
17
18.
19
20.
F Lonyi, J Valyon, J Engelhardt, F Mizukami., J. Catal. 160 (1996) 279
M. M. Dubinin, Chem. Rev., 60 (1960) 235.
S. Caillere, S. Henin, in “The Differential Thermal Investigation of Clays" (Eds.)
R. C. Mackenzie, The Central Press, Abardeen, (1956) p. 240.
M. P Rosynek, P T Magnuson, J. Catal., 46 (1977) 402.
M. N. Ambrozhi, L. M. Dvornikova, Zh. Neorg. Khim., 11 (1966) 86.
M. P Rosynek, D. T Magnusun, J. Catal., 48 (1977) 417; M. L. Hair. “Infrared
spectroscopy in surface chemistry”, Dekker, New York, 1967
K. A. Wickersheim, R. A. Lefever, J. Am. Chem. Soc., 83 (1961) l 147
R. A. Nyquist, R. O. Kagel, “Infrared Spectra of Inorganic Compounds”;
Academic press, 1971
N. T McDevitt, W L Baun., Spectrochim. Acta., 20 (1964) 799
G. C. Bond, A. J. Sarkani,, G. D. Parfitt, J. Catal., 57 (1979) 476.
K. Tanabe, M. Misono, Y Ono, H. Hattori,“New solid acids, bases, their
catalytic properties”, Stud. Suf. Sci. Catal., (Eds.) B. Delmon, J. T Yates,
Elsevier, 51 (1989) 15.
T Yamanaka. K. Tanabe, J. Phys. Chem., 80 (1976) 1723.
H. Pines, C. N Pillai, J. Am. Chem. Soc.,82 (1960) 2401
C. P Bezouhnua, M. A. Al—Zihari, Catal. Lett., 11 (1991) 245.
C. N. Pillai, H. Pines, J. Am. Chem. SoC., 83 (1961) 3274.
S. Kotasarenku, L. V Malysheva, Kinetai Katal.,24 (I983) 877
J. Take, T Matsumoto, Y Yoneda, Bull. Chem. Soc. Jpn., 47 (1974) 424.
A. Gervasini, A. Auroux, J. Catal., 131 (1991) 190.
K. Tanabe, M. Misono, Y Ono, H. Hattori, “New solid acids and bases, their
catalytic properties”, Stud. Suf. Sci. Catal., (Eds.) B. Delmon, J. T Yates,
Elsevier, 51 (1989) 316.
I. Halasz, H. Vinek, K. Thomke, H. Noller, Z. Phys. Chem. Neue. Folge., 144
(1985) 157

21
35
36.
37
38.
39
40
41
42.
43.
K. Tanabe, M. Misono, Y Ono, H. Hattori, “New solid acids and bases, their
catalytic properties”, Stud. Suf. Sci. Catal., (Eds.) B. Delmon, J. T. Yates,
Elsevier, 51 (1989) 261.
A. J. Lindeen, R. Van Hoozer, J. Org. Chem., 32 (1979) 3387
T Yamaguchi, K. Tanabe, Bull. Chem. Soc. Jpn., 47 (1974) 424
H. Pines, C. N. Pillai, J. Am. Chem. Soc., 83 (1961) 3270
H. Noller, K. Thombke, J. Mol. Catal., 6 (1979) 376
K Thombke, Z Phys. Chem. Neue. Folge, 106 (1977) 302
M. J Fuller, M. E. Warwick, J. Catal., 29 (1973) 441
J D. Butler, T C Poles, B. T Wood, J. Catal., 16 (1970) 239
L. Yue, O. Olaofe, Chem. Eng. Res. Des., 62 (1984) 81
H. Noller,, W Klading, Catal. Rev., 13 (1976) 149
D E. Bryant, W L. Kranich, J. Catal., 8 (1969) 8.
A. J. Lundeen, R. Van Hoozer, J. Org. Chem, 32 (1979) 3386.
L. T Weng, P Patrono, E. Sham, P Ruiz, P Delmon, J Catal., 132 (1991) 360
M. Ai, S. Suzuki, J Catal, 30 (1973) 362; L. T Weng, B. Yasse. J. Ladriere.
P Ruiz, B. Delmon, J. Catal., 132 (1991) 343
M. P Rosynek, Catal. Rev Sci. Eng., 16 (1) (1977) 111
T Tagawa, T Hattori, Y Murakami, J. Catal., 75 (1982) 66.
C. Bezouhanova, M. A. A1-Zihari, Appl. Catal.A General, 83 (1992) 45
V V Rao, V Durgakumari, S. Narayanan, Appl. Catal., 49 (1989) 165
E. Santacesaria, M. Diserio, P Ciambelli, Appl. Catal., 64 (1990) 101
S. Balsama, P Beltrame, P L. Beltrame, L. Forni, G. Zuretti, Appl. Catal., 13
(1984) 161.
F Nozaki, I. Kimura, Bull. Chem. Soc. Jpn.,5O (3) (1977) 614.
K. Tanabe, T Nishizaki, Proc. 6"‘ Intern. Congr Catal., 2 (1977) 863; B Xu,
T Yamaguchi, K. Tanabe, Materials Chem. and Phys., 19 (1988) 291
C. Benzouhanava, M. A. A1-Zihari, Appl. Catal., 8 (1992) 45; R. T Tilemat
Manzalji, D. B. Bianchi, G. M. Pajonk, Appl. Catal., 101 (1993) 339
C. Benzouhanava, M. A. A1-Zihari, Appl. Catal., 8 (1992) 45.
116
44
45
46.
47
48
49
50.
52.
53.
54
55.
56
57
58.
59
60.
R. T Tilemat-Manzalji, D. B. Bianchi, G M. Pajonk. Appl. Catal, 101 (1993)
339
M. Marczewski, J. P Bodibo, G. Perof, M. Guisnel, J Mol. Catal., 50 (1989)
21 1
S. Velu, C S. Swamy, Appl. Catal. A General 119 (1994) 241
J. M. Parera, A. Gonzalez, M. A. Burral, Ind. Eng. Chem., 7 (1968) 259', K T
Li, I Wang, K R. Chang, Ind. Eng. Chem. Res., 32 (1993) 1007, E.
Santacesaria, D Grassu, D. Gelosa, S. Carra. Appl. Catal., 64 (1990) 83
J Santhanalakshmi, T Raja, Appl. Catal.A General, 147 (1996) 69
J. R. Kosak, “( 'atalysis of Organic Reactions”, Marcel Dekker. Inc. New York.
1984 R. L. Augustine, “Heterogeneous ( .'ata/ysis for the Synthetic (.'hemt.s't"
Marcel Dekker, Inc. New York, 1996.
J M. Schkeryantz, S. J. Danishefsky, J. Am. Chem. Soc., 117 (1995) 4722.
P E. Fanta, J Am. Chem. Soc., 75 (1953) 737
E. L. Derrenbacker, U.S. Patent, 4, 264, 529 (1991).
P N. Rylander, I. M. Karpenko, G. R. Pond, N. Y Ann, Acad. Sci., 172 (1970)
266.
Osuka, Shimizu, Suzuki, Chem. Lett., (1983) 1373.
S. L. Karwa, R. A. Rajadhyaksha, Ind. Eng. Chem. Res., 27 (1988) 21
S. A. Moya, R. Pastene, R. Sariego, R. Sanori, P Aguirre. H. Lebozec,
Polyhedron, 15 (1996) 1823
J I. Mcnah, Inst. Chem. Eng. Symp. Ser 15 (1981) 68.
F Haber, Electrochem, 4 (1898) 1506; F Haber, C. Z. Schmidt, Physik.
Chem., 32 (1900) 279.
T T Upadhya, S. P Katdare, D. P.Sabde, V Ramaswamy, A. Sudalai, J Chem
Soc. Chem. Commun., (1977) 1119.
Engelhard Minerals and Chemicals Corp.,U.S.Patent,3, 715, 397
ll7

CHAPTER IV
ACID—BASE PROPERTIES AND CATALYTIC ACTIVITY OF
SULFATE MODIFIED MIXED OXIDES OF TIN WITH
LANTHANUM AND SAMARIUM
4.1 PHYSICO-CHEMICAL CHARACTERISTICS
For simplicity the sulfate modified oxides prepared by different methods are
denoted as,
STS82 (I) :> sulfated TS82 prepared from the mixed hydroxide heat treated to
300 °C, by ammonium sulfate method (Method I).
STS82 (II) :> sulfated TS82 prepared from the mixed hydroxide dried carefiilly at
I 10 “C, by ammonium sulfate method (Method II).
STS82 (III) :> sulfated TS82 prepared fi'om SO42‘/SnO2 followed by
impregnation with samarium nitrate solution (Method III).
The other sulfated analogues denoted as STS55 (sulfated TS55), STS28 (sulfated
TS28) and STL82 (sulfated TL82) were prepared by method 11.
The surface molar composition of the mixed oxides treated with sulfate
anion was determined by EDX. The metal oxide percentage and SUlfiJI' percentage
(as S03) are given in Table 4.1. The sulfur content obtained from EDX of STS82
and STS55 matches well with those calculated from the weight loss in
thennogravimetric analysis. However a large variation is observed in the case of
STS28. EDX of all the samples were taken after calcination at 500 °C. The large
variation in the sulfate content of STS28 is due to the fact that a large amount of
sulfate is retained on the sample even afier heating to 1100 °C in air. To confirm
this the sample treated to I 100 "C was subjected to EDX analysis and it was found
that a considerable amount of sulfate was still retained in the sample (see Table
41)
H9

Table 4.1 EDX analysis of sulfated oxides
Chemical composition %
Catalysts Calcination SnO2 Sm2O3 S03 S03”temperature
°C
STS82(1) 500 72.59 25.11 2.30STS82 (II) 500 72.63 25.03 2.34 2.24STS82 (III) 500 70 62 24.58 4.80STS55 (II) 500 45.16 50.88 3.96 3.60STS28 (II) 500 14.93 78.93 6.14 3 42STS82 (II) 1100 75.93 23.94 0.13STS55 (II) 1100 44.10 55.62 0.28STS28 (II) 1100 13.80 83.62 2.58
b Calculated from TG weight loss.
120

The EDX analysis of other samples STS82 and STS55, heat treated at the
same temperature, showed very small amount of sulfate. These observations
suggest that the sulfate treatment ofthe system TS28, which contain more amount
of samarium oxide, probably lead to the formation of bulk like sulfate species.
which is retained on the sample even after heat treatment at high temperature. The
sulfate content of different sulfated oxides prepared by different methods is also
given in Table 4 1
The XRD patterns of TS82 and its sulfated analogue is shown in Figure
4 I The intensity of diffraction peaks decreased afier sulfate treatment [1]. We
have noticed that addition of a second oxide viz. La2O3 or Sm2O3 to tin oxide
decreases the XRD peak intensity So the addition of sulfate and a second oxide
to SnOz hinders the crystallisation of the originally amorphous material. It has
been reported that the degree of crystallisation of the sulfated oxides is much lower
than that of the oxides without the sulfate treatment [2]. Lonyi et al found that
addition of sulfate and titania as a second oxide to zirconia hinder the
crystallisation of the amorphous ZrO2 [3]. No structural deterioration is observed
in the case of sulfate treated samples. However from the present study it is not
clear whether any metal sulfates are formed, particularly in the case of samples
containing more amount of rare earth oxide, TS28. The SEM pictures of TS82
and STS82 are shown in Figure 4.2. Bigger crystallites are seen in the case of
TS82 whereas in the case of STS82, smaller particles with almost uniform size are
seen This is expected as the addition of sulfate prevent the agglomeration of
smaller particles [4].
121
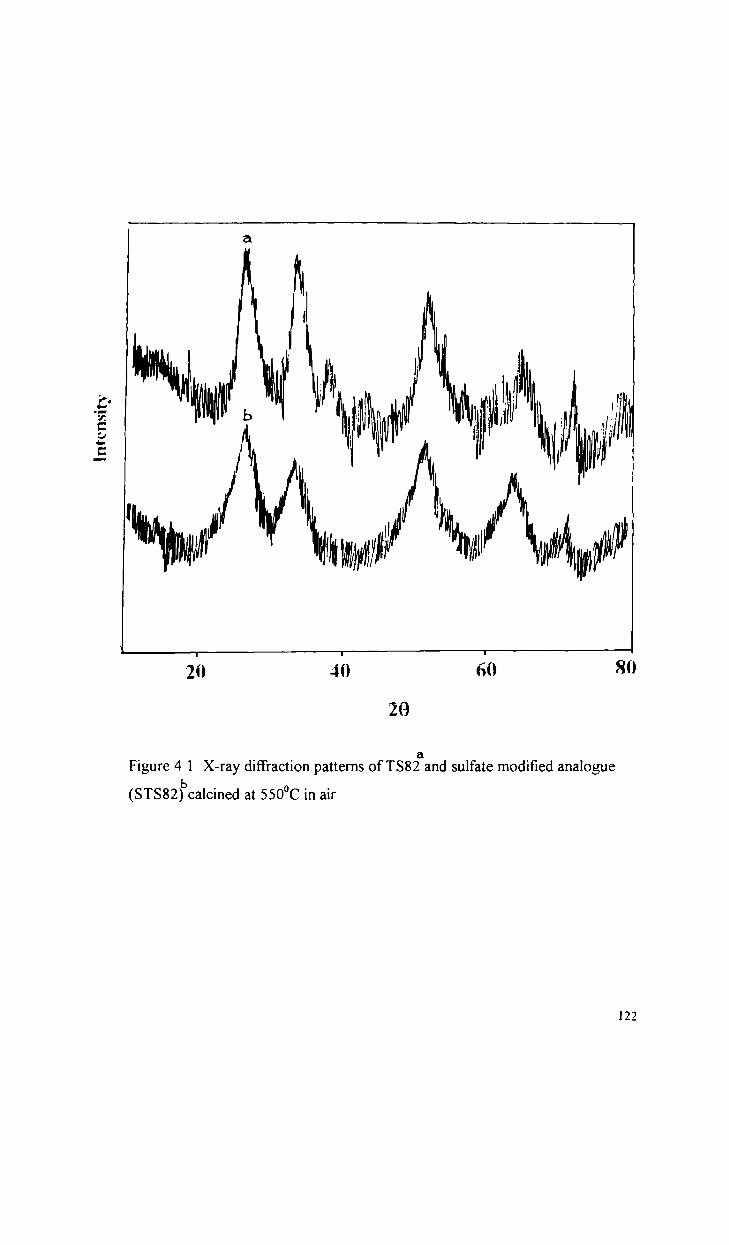
80604}»

ZBIRU X3oO0OV
Figure 4.2 SEM pictures of TS82‘ and STS82 (II)" and STS82 (IIl)° calcined at
550°C
123

The specific surface areas of the these catalysts are much higher than those
of the unmodified oxides [4]. The reason for area increment is the retardation of
crystallisation due to sulfate treatment. A large variation in surface area is
observed as the method of preparation of catalyst is changed. Results are
summarised in Table 4.2. The calcination of the sulfated material to high
temperature produces a decrease in surface area but the fraction of decrease in
surface area is smaller than that of the unmodified oxide [5]
Table 4.2 BET surface area of sulfated oxides
Catalyst Calcination Surface area
temp. °C m2/ g
STS82 (I) 500 124.9 (102.7)‘STS82 (I) 550 130.6 (92.60)STS82 (11) 550 152.1s'rs32 (III) 550 195.6STS82 (11) 600 143.1 (79.1)STS82 (11) 650 131.1 (60.80)STS82 (11) 750 91 1 (42.10)STL82 (I) 500 110.5 (105.7)“
" Values given in parenthesis are the surface area of unmodified analogue at the
same temperature.
The pore volumes of the sulfated oxides are shown in Table 4.3 Pore
volume decreased after sulfate treatment [5]. The pore volume of the unmodified
124

sample decreased from 0.30 to 0.18 m3/g by calcination, while that of the sulfated
sample dropped from 0.28 to 0.23 m3/g by calcination.
Table 4.2 Pore volume of sulfated oxides:-- effect of method of preparation
and calcination temperature
Catalyst Heat Pore volumetreatment "C m“‘/g
srssz (1) 500 0.237 (0.315)srssz (1) 550 0.235 (0.300)‘srssz (11) 550 0.279 (0.300)srssz (111) 550 0.278 (0.300)srssz (II) 600 0.241 (0.271)srssz (11) 650 0.233 (0.221)srssz (11) 750 0.230 (0.131)STL82 (1) 500 0.273
’ Values given in parenthesis are the pore volume of unmodified analogues at the
same temperature.
The decomposition of sulfate takes place at higher temperature than in the
case of sulfated tin oxide or zirconium oxide [6]. In SO42"/SnO2 sulfiJr oxide
evolution takes place in the temperature range 700-750 °C and in the case of S042’
/ZrO; the temperature of sulfate evolution is 700-740 °C. In the case of STS82
decomposition of sulfate takes place at very high temperature (> 920 ° C) and the
process is completed above 1000 °C (Figure 4.3b). Removal of sulfate in STS55
started around 900 °C and is completed near 1000 0C (Figure 4.3a and 4.3c). A
l25
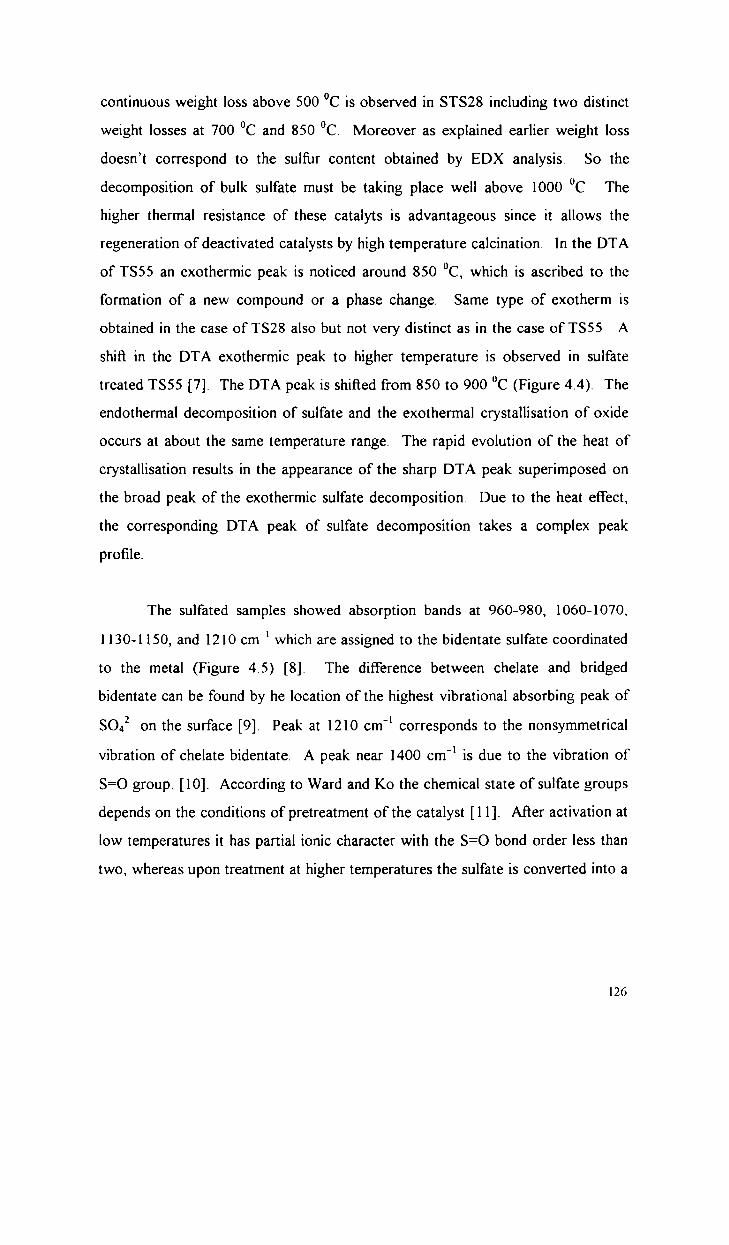
continuous weight loss above 500 °C is observed in STS28 including two distinct
weight losses at 700 0C and 850 °C. Moreover as explained earlier weight loss
doesn’t correspond to the sulfiir content obtained by EDX analysis. So the
decomposition of bulk sulfate must be taking place well above 1000 "C The
higher thermal resistance of these catalyts is advantageous since it allows the
regeneration of deactivated catalysts by high temperature calcination. In the DTA
of TS55 an exothermic peak is noticed around 850 °C, which is ascribed to the
formation of a new compound or a phase change. Same type of exotherm is
obtained in the case of TS28 also but not very distinct as in the case of TS55 A
shift in the DTA exothermic peak to higher temperature is observed in sulfate
treated TS55 [7]. The DTA peak is shifted from 850 to 900 "C (Figure 4.4). The
endothermal decomposition of sulfate and the exothermal crystallisation of oxide
occurs at about the same temperature range. The rapid evolution of the heat of
crystallisation results in the appearance of the sharp DTA peak superimposed on
the broad peak of the exothermic sulfate decomposition. Due to the heat effect,
the corresponding DTA peak of sulfate decomposition takes a complex peak
profile.
The sulfated samples showed absorption bands at 960-980, 1060-1070,
1130-1 150, and 1210 cm"' which are assigned to the bidentate sulfate coordinated
to the metal (Figure 4.5) [8]. The difference between chelate and bridged
bidentate can be found by he location of the highest vibrational absorbing peak of
SO42 on the surface [9]. Peak at 1210 cm" corresponds to the nonsymmetrical
vibration of chelate bidentate. A peak near 1400 cm‘! is due to the vibration of
S=O group. [10]. According to Ward and K0 the chemical state of sulfate groups
depends on the conditions of pretreatment of the catalyst [1 1]. After activation at
low temperatures it has partial ionic character with the S=O bond order less than
two, whereas upon treatment at higher temperatures the sulfate is converted into a
126

strongly covalent species with S=O bond order close to two. The existence of
these covalent S=O bonds in sulfur complexes formed are necessary for
superacidity generation.
By comparison with the XPS results it is clear that a strong absorption
around 1380 cm" is typical of the highest oxidation state of sulfiir (+6) in S=O
bonds. It is concluded that the acidity generation is independent of the sulfating
agents used and is brought about by the oxidation of sulfur to its highest oxidation
state, +6.
The acid strength of the catalysts measured qualitatively afier the
pretreatment, (550 “C in air) using a series of Hammett indicators is given in Table
4.3. The acid strength of sulfated oxides prepared by different methods are in the
order STS (III) > STS (11) > STS (I). Only weak acid sites are created by sulfate
treatment employing method 1, whereas the method III resulted in the creation of
superacid sites with Ho 3 13.75. Super acidic character of the catalyst is retained
even at very high temperature (800 °C).
l27
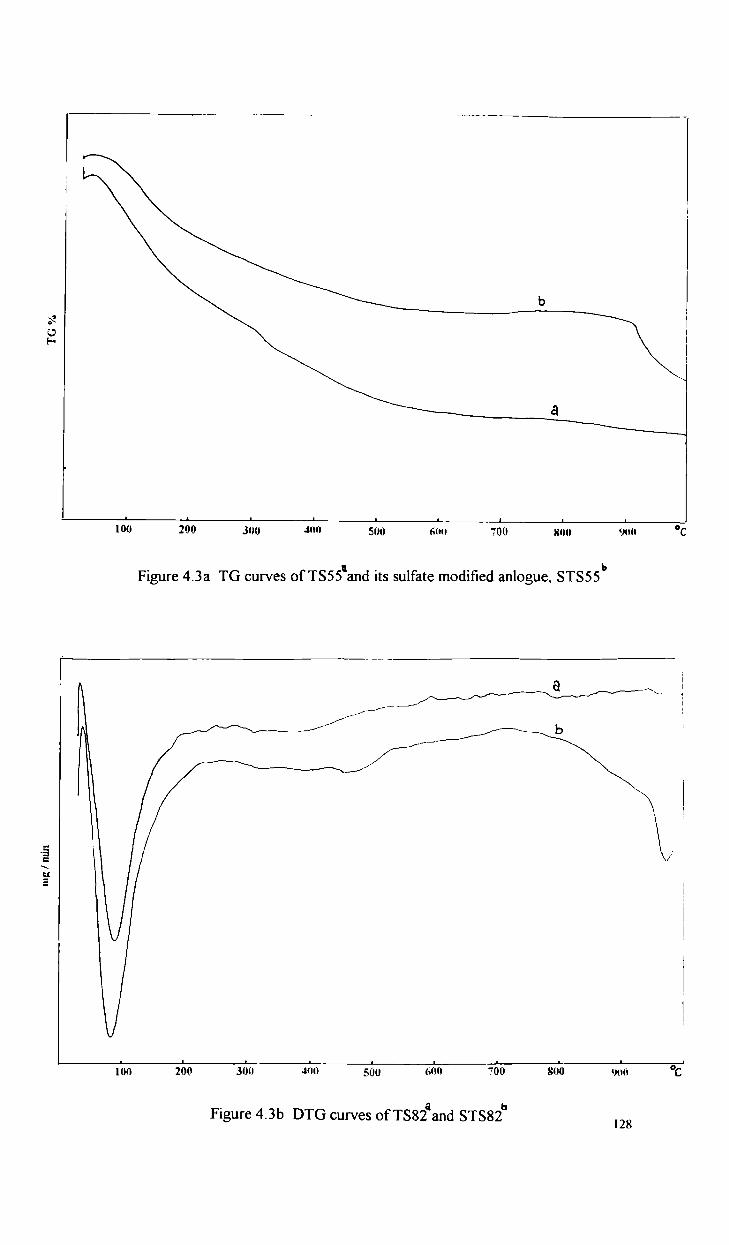
i
:
<3
ufu 260 3&0 460 530 fillm 760 8430 Km °c
Figure 4.33 TG curves of TS55‘and its sulfate modified anlogue, STS55h= a 3i/f“ b\ 9‘ E
I
i
I
E0 200 300 um 560 65!.» 760 8IJ‘0 om": °c
Figure 4.3b DTG curves ofTS82aand STS82b I28
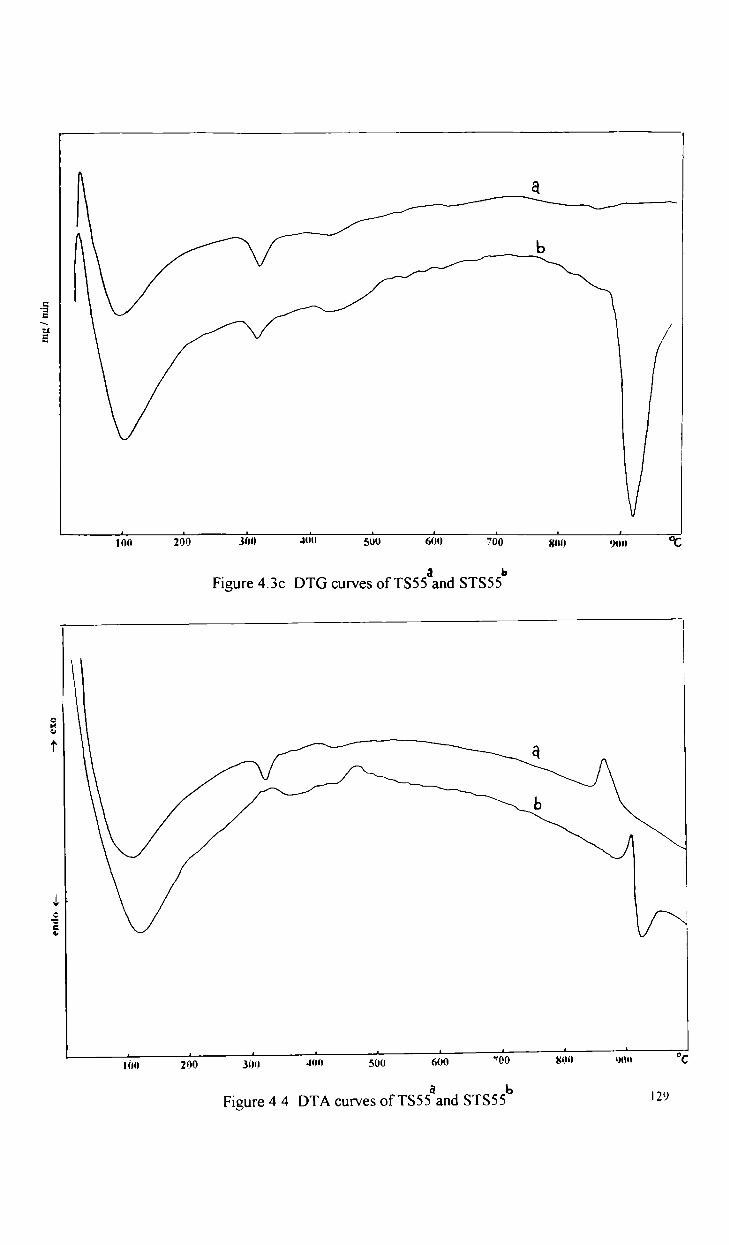
nu: / min
-9 9X0
endo <
1‘oo 260 33:1; «in 560 660 760
Figure 4.3c DTG curves of TS55aand STS55b
81'“) 900
100 200 300 .mn 500 600 ‘O0b
Figure 4 4 DTA curves of TS55aand STS55
81:“) ‘Hill

lnn'n.<ir_\'
/\ \_, /I V \1300 1100 900 100 500 Cm‘
Figure 4.5 IR spectrum of sulfate modified TS82.
I30

Table 4.3 Acid strength of sulfated oxides
Catalysts pKa values of the indicators-0.8 -3 0 -8.2 -11.35 -13 75
STS82 (I) + * — — — —STS82 (II) + + + — —STS82 (III) + + + + + *STS55 (II) + + + * — —STS28 (II) + + * — — —STS82 (II)‘ + + + — —STS82 (11)’ + + + — —STS82 an)’ + + + + + *1 calcined at 700 °C, 2 calcined at 800 °C, ‘ colour not very distinct.
131
4.2 DECOMPOSITION OF ALCOHOLS
A comparative study of the various sulfated oxides under study are presented in
Table 4.4 Sulfated oxides prepared by different methods show difference in
catalytic activity Catalyst prepared by method III gave maximum activity,
however catalyst prepared from the oxide heated to 300 "C (method I) showed
lesser activity Catalytic activity decreases in the Sn-Sm and Sn-La series in the
order STS82 > STS55 > STS28 and STL82 > STL55 > STL28. STS82 (I)
produced a large amount of aldehyde via dehydrogenation. Only weak acid sites
are detected in this case. Isobutanol decomposition is feasible at lower
temperature over sulfated oxides compared to their unmodified analogues. The
alcohol conversion is completed at 325 0C over STS82. At lower temperatures a
large amount of dehydrogenation product; aldehyde is formed. However, the
activity of unmodified oxide is very poor at this temperature (250 °C). Conversion
to aldehyde is about 15.62 % at 250 °C, employing sulfated oxide as the catalyst
whereas in the case of unmodified analogue it is about 18.59 % at 350 °C and only
5.25 % at 250 °C. This indicates that there is an enhancement in the
dehydrogenation activity after sulfate treatment. But at higher temperature and
low contact time dehydration predominates. When the feed rate is increased from
4 ml/h to 8 ml/h STS82 displayed an enhancement in the selectivity of
dehydrogenation product, aldehyde. We have already noticed that the isobutanol
dehydration over unmodified oxide systems afforded mainly isobutene alongwith
small amounts of other butenes. From the results it is clear that sulfate addition
resulted in the creation of strong acid sites capable of initiating isomerisation
reactions. Alcohol dehydration usually require weak acid sites whereas
isomerisation reactions requires stronger sites. A secondary carbenium ion formed
l32
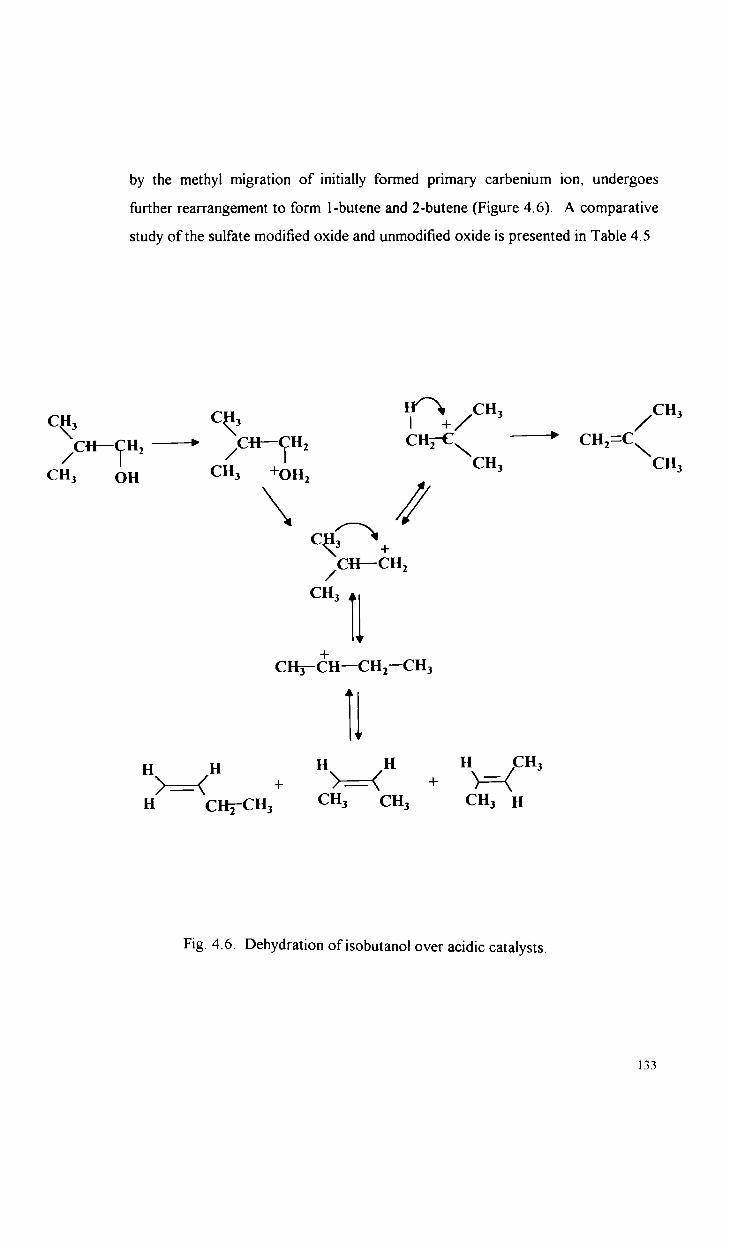
by the methyl migration of initially formed primary carbenium ion, undergoes
further rearrangement to form l-butene and 2-butene (Figure 4.6). A comparative
study of the sulfate modified oxide and unmodified oxide is presented in Table 4.5
H”\ CH CHC 3 C 3 l +/ 3 / 3CH__$H2 ———> /Cl-l—— H2 CH3'C\ CH2"—‘C\CH
CH} OH CH3 +0H2 / 3 CH3\ /N _/CQ3 +
llllH H H H H CH,>-:< '’f‘ > —‘ < + H
H CH;-CH3 CH3 CH3 CH3 H
Fig. 4.6. Dehydration of isobutanol over acidic catalysts.
133

Table 4.4 Decomposition of isobutanol over different catalysts
Catalyst Selectivity % Conversionisobutene 1-butene 2-butene ketone %
STS82' 34.80 38.10 20.80 4.30 88.00STS82" 37.30 37 10 18.43 4.50 37.20STS82° 66.16 5.60 4.12 30.12 63 80STS55b 43.90 32.18 20.72 3.20 86.10STS28b 68.18 15.60 14.80 1.42 71.20STL82b 40.16 34.81 19.55 5.08 87.80STL55b 42.60 35.18 22.22 4.90 86.90STL28b 71.80 13.10 12.60 2.50 72.80
Reaction conditions: Temperature 250 OC,
catalysts prepared by method 1, 2 and 3 respectively.
feed rate 4 ml/h, TOS 3 h,
134
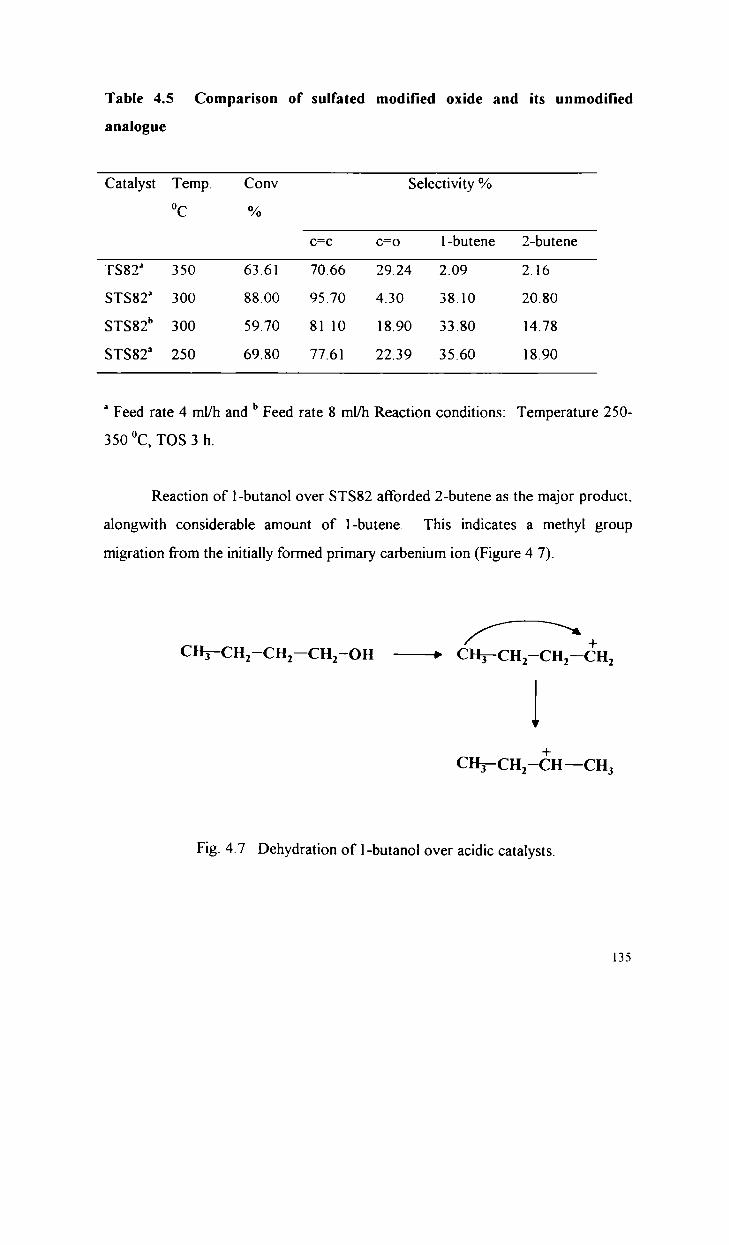
Table 4.5 Comparison of sulfated modified oxide and its unmodified
analogue
Catalyst Temp. Conv Selectivity %°c %c=c c=o 1-butene 2-butene
TS82“ 350 63.61 70.66 29.24 2.09 2.16STS82" 300 88.00 95.70 4.30 38.10 20.80STS82“ 300 59.70 81 10 18.90 33.80 14.78STS82’ 250 69.80 77.61 22.39 35.60 18.90
‘ Feed rate 4 ml/h and b Feed rate 8 ml/h Reaction conditions: Temperature 250
350 °C, TOS 3 h.
Reaction of 1-butanol over STS82 afforded 2-butene as the major product,
alongwith considerable amount of 1-butene. This indicates a methyl group
migration from the initially formed primary carbenium ion (Figure 4 7).ACH,—CH,—cH,—cH,—oH —» CH3—CH2—CH2— +H2
1
+CH3—CH2-CH—CH3
Fig. 4.7 Dehydration of 1-butanol over acidic catalysts.
135

Generally the formation of 2-butene from 1-butanol is indicative of the E.
mechanism. This mechanism occurs with strongly acidic catalysts such as
aluminosilicates [12, 13].
The product distribution of I-butanol, isobutanol. l-butanol and 2-butanol
decomposition over sulfated oxide are also given in Table 4.6. I-Butanol is
dehydrated mainly to isobutene alongwith a large amount of l-butene and 2
butene. The initially formed isobutene can undergo isomerisation reactions to form
l-butene and 2-butene.
Table 4.6 Decomposition of different butanols over STS82
Product t-Butanol Isobutanol 1-Butanol 2-Butanolselectivity
lsobutene 48.92 34.60 3.18 9.801-Butene 24.34 38.10 26.30 20.102-Butene 21.94 20.10 62.46 60.45Others 4.80 3.90 3.70 6.24Ketone nil 4.90 4.20 3 40/Aldehyde
Conv % 100.00 88.00 83.00 84.00
Reaction conditions: Temperature 250 °C, feed rate 4 ml/h, TOS 3 h, Catalyst
weight 2.7 g.
Dehydration of 2-butanol produced a mixture of 2-butene, l-butene and
isobutene. The formation of Saytzefi‘ elimination products suggest that the
mechanism of dehydration can be either E1 or E2 type [13]. Here dehydration
136

products initially formed isomerises to produce other alkene isomers in presence of
strong acid sites created by sulfate treatment. Hence the mechanism must be E.
type. As discussed earlier the type of mechanism is influenced mainly by the
strength of acid sites present on the catalyst surface.
From the above results we observed a possible change in the mechanism of
alcohol dehydration afier the sulfate treatment of a series of Sn-La and Sn-Sm
binary oxide systems, which is ascribed to the generation of strong acid sites on the
catalyst surface by sulfate treatment.
4.3 OXIDATIVE DEHYDROGENATION REACTIONS
4.3.1 Oxidative dehydrogenation of ethanol
Acetaldehyde and ethene were formed as the main products alongwith small
amounts of acetic acid and carbon oxides. The effect of temperature on the
product selectivity and conversion is presented in the Table 4.7 The selectivity of
aldehyde is maximum at 400 °C (74.1l%). But at higher temperatures aldehyde
selectivity is decreased considerably. Alcohol is completely converted at 450 "C
But in the case of non-sulfated analogues, at lower temperature acetaldehyde
selectivity is less, which increases with increase in temperature. At 450 “C it gave
an aldehyde selectivity of only 36.78 % and at 400 0C aldehyde selectivity is only
19 80 %. The effect of feed rate on the selectivity is studied at 400 °C, and a
small increase in acetaldehyde selectivity is observed when the feed rate is
increased from 4 ml/h to 10 ml/h (Table 4.8). Conversion of alcohol decreases as
expected. When aqueous ethanol (75 %) is used as the feed, a tremendous
137

increase in the selectivity of aldehyde is observed (96.37%) at a conversion of
so 93% (Table 4.9) [14].
Table 4.7 Effect of temperature on the product selectivity and conversion ofethanol
Selectivity % Temperature °C350 400 450a b a b a bEthene 74.80 35.15 76.10 20.18 50 70 45 00Acetaldehyde 18.90 63.84 19.80 74 11 36.78 52 80Carbon oxides 7 10 0.98 3.80 1.50 5.57 3 15Conversion % 64.80 75.70 76.10 85.73 85.20 99.3
nonsulfated oxide, " sulfated analogue Reaction conditions: Reaction
temperature 400 °C, feed rate 4 ml/h, TOS 2 h, Catalyst weight 2.7 g, Calcination
temperature 500 and 550 °C, for TL82 and STL82 respectively
138

Table 4.8 ElTect of feed rate on the product selectivity and conversion ofethanol
Selectivity % Feed rate ml/h4 6 10Ethene 20.18 17.86 19 16Aldehyde 74.11 79 98 80 12Carbon oxides 1.50 0.81 0.71Conversion % 85.73 73.80 59 10Reaction conditions: Reaction temperature 400 °C, TOS 2 h, Catalyst weight 2.7
g. Calcination temperature 550 "C.
Table 4.6 Effect of water on the product selectivity and conversion of ethanol
Selectivity % Water wt%20 % 25 % 30 %
Ethene 10.80 3.63 3.20Aldehyde 88.70 96.37 96.80Conversion % 82.10 80.93 69 13
Reaction conditions: See foot notes in Table 4.8
139
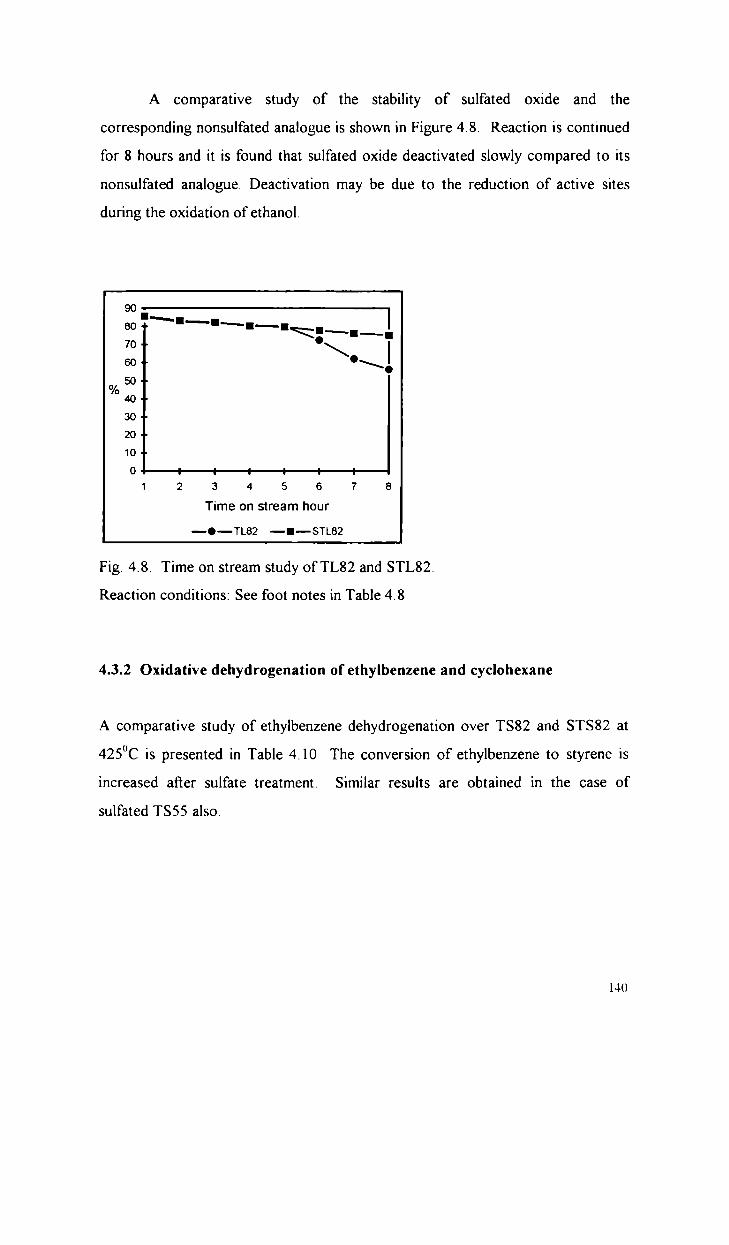
A comparative study of the stability of sulfated oxide and the
corresponding nonsulfated analogue is shown in Figure 4.8. Reaction is continued
for 8 hours and it is found that sulfated oxide deactivated slowly compared to its
nonsulfated analogue. Deactivation may be due to the reduction of active sites
during the oxidation of ethanol.
90-§I._—_-__,B0 I—I<l§.?.7o \ l50 \.
O 50/o40
30
20
100 . . . : ' 1 . .1 2 3 4 5 6 7 3Time on stream hour
—O—TLB2 —I—STL82
Fig. 4.8. Time on stream study of TL82 and STL82.
Reaction conditions: See foot notes in Table 4.8
4.3.2 Oxidative dehydrogenation of ethylbenzene and cyclohexane
A comparative study of ethylbenzene dehydrogenation over TS82 and STS82 at
425°C is presented in Table 4.10 The conversion of ethylbenzene to styrene is
increased afier sulfate treatment. Similar results are obtained in the case of
sulfated TS55 also.
140

Table 4.10 Comparison of non-sulfated and sulfated oxides in the oxidative
dehydrogenation of ethyl benzene
Product TS82‘ srssz‘ srss?’ TS55‘ STS55‘distribution
%
Benzene 4 49 5.80 3.10 5 40 3 54Ethylbenzene 70.41 50 60 66.20 81 95 71 81Styrene 23.68 39.80 28.78 9.42 22.85Carbon 1.42 3.80 1.92 3.23 1 80oxides
Conversion 29.49 49 40 33.80 18.05 28.19%
’ Reaction temperature 425 °C and b 400 "C
Reaction conditions: Feed rate 4 ml/h, TOS 2 h, Calcination temperature 550 °C
Carbon oxides selectivity is not much influenced by sulfation. According
to Tagawa et al the acid sites of Ho between 1.5 and -5.6 are proven to be the
active sites to adsorb ethylbenzene reversibly, whose oxidation on the otherhand
occurs on the basic sites of pKa between 17.2 and 26.5 [15]. In the oxidative
dehydrogenation of cyclohexane; the main products were benzene and cyclohexene
(Table 4.1 1). As in the case of ethylbenzene reaction, the sulfate treatment lead to
an enhancement in oxidation activity [16].
141

Table 4.11 Comparison of sulfate modified and unmodified oxides in the
oxidative dehydrogenation of cyclohexane
Product TS82 STS82distribution %Benzene 4.80 6.80Cyclohexene 14.20 24.48Cyclohexane 78.56 66.90Others 2.56 1.82Conversion % 21.50 33.10
Reaction conditions: Reaction temperature 425 °C, Feed rate 4 ml/h, TOS 2 h,
Calcination temperature 550 °C.
4.3.3 Oxidative dehydrogenation of cyclohexanol
The effect of temperature on the conversion and product selectivity is depicted in
Table 4.12. Compared to unmodified oxide reaction takes place at lower
temperature and cyclohexanol conversion is completed at 400 °C. The
cyclohexanone selectivity is maximum at 250 °C. As the temperature increases
cyclohexanone selectivity decreases. But in the case of unmodified oxide,
cyclohexanone selectivity is not much influenced by increase in temperature. The
unmodified oxide, TS82 at 400 °C showed 93.1 % selectivity towards
cyclohexanone at a total cyclohexanol conversion of 53.61%. The corresponding
sulfated analogue showed 74.9 % selectivity at 350 °C at a cyclohexanol
conversion of 75.89 %. Thus the cyclohexanone yield (conversion x
selectivity/100) is 56.84 % at 350 0C using STS82 as catalyst, whereas it is 49 9 %
at 400°C employing TS82 as catalyst. At 300 °C cyclohexanone yield is 46 % for
142
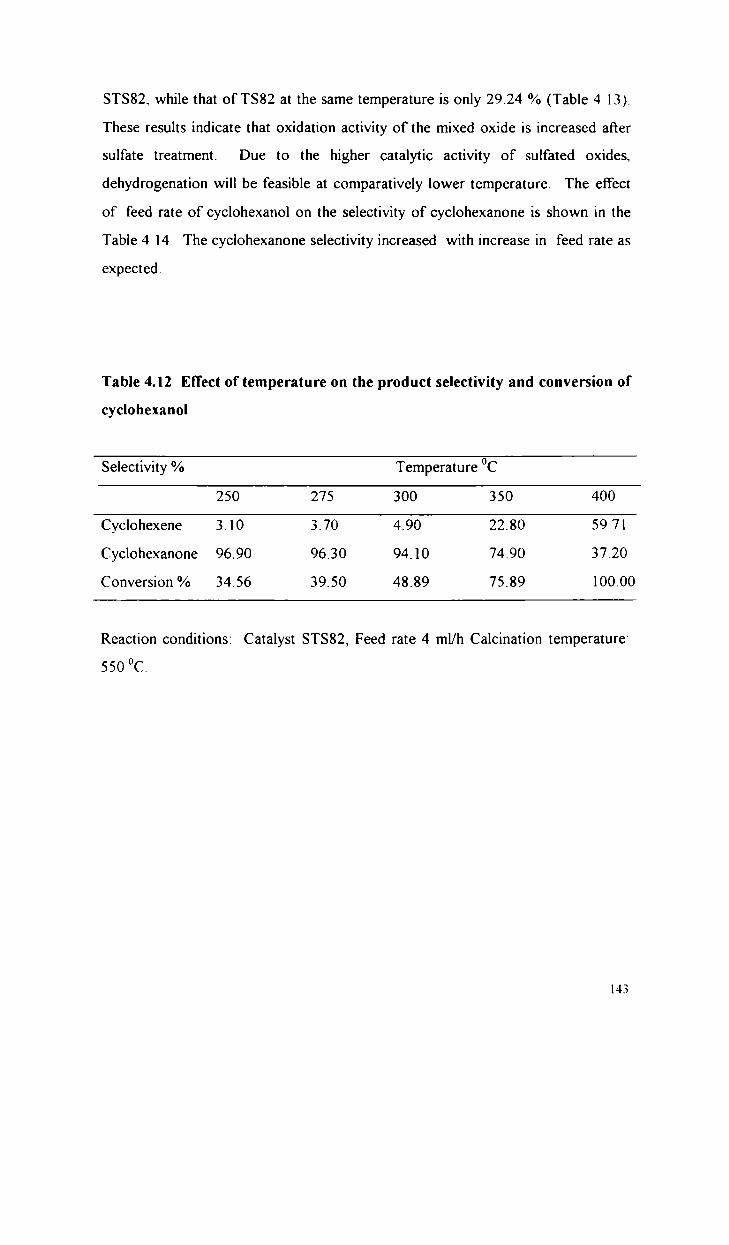
STS82, while that of TS82 at the same temperature is only 29.24 % (Table 4 13).
These results indicate that oxidation activity of the mixed oxide is increased after
sulfate treatment. Due to the higher catalytic activity of sulfated oxides,
dehydrogenation will be feasible at comparatively lower temperature. The effect
of feed rate of cyclohexanol on the selectivity of cyclohexanone is shown in the
Table 4 l4 The cyclohexanone selectivity increased with increase in feed rate as
expected.
Table 4.12 Effect of temperature on the product selectivity and conversion of
cyclohexanol
Selectivity % Temperature °C250 275 300 350 400Cyclohexene 3.10 3.70 4.90 22.80 59 71Cyclohexanone 96.90 96. 30 94.10 74.90 37.20Conversion % 34.56 39.50 48.89 75.89 100.00
Reaction conditions: Catalyst STS82, Feed rate 4 ml/h Calcination temperature"
550 °C.
143

Table 4.13 Comparative study of sulfate modified and unmodified oxides at
different temperatures
Catalyst 250 °C 300 °C 350 °C 400 °Ca b a b a b a bTS82 15.39 97.20 31.86 91.30 42.03 9010 52.31 9360STS82 34.56 96.90 43.39 94.10 75.39 7490 100.00 37.20
a: conversion of cyclohexanol, b: selectivity of cyclohexanone Reactionconditions: See foot notes to Table 4.12
Table 4.14 Comparative study of sulfate modified and unmodified oxides at
different feed rates
Catalyst 4 ml/h 6 ml/h 10 ml/h 12 ml/ha b a b a b a bTS82 42.03 90.10 37 18 92.02 32.00 94.40 21.89 94 60STS82 100.00 37.20 81.19 46.90 69 90 59.20 41.00 62 20a: conversion of cyclohexanol, b: selectivity of cyclohexanoneReaction conditions. See foot notes to Table 4.8
4.3.4 Comparative study of the catalytic activity of SO42 '/ SnO2 and STS82
in the oxidative dehydrogenation of cyclohexanol
The oxidative dehydrogenation of cyclohexanol over SO42 '/ SnO2 and STS82
(both catalysts prepared by method II) is presented in Table 4.15 for comparison.
I-H
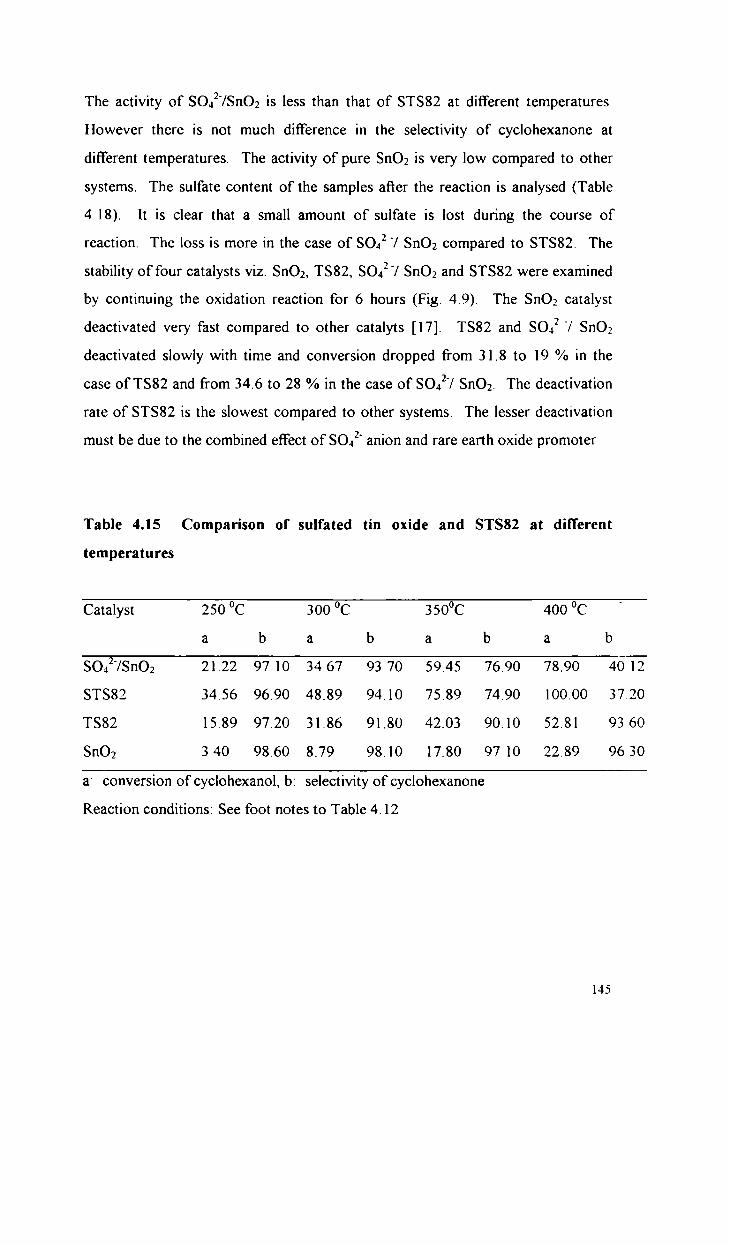
The activity of SO42‘/SnO2 is less than that of STS82 at different temperatures.
However there is not much difference in the selectivity of cyclohexanone at
different temperatures. The activity of pure SnO2 is very low compared to other
systems. The sulfate content of the samples after the reaction is analysed (Table
4 18). It is clear that a small amount of sulfate is lost during the course of
reaction. The loss is more in the case of SO42 '/ SnO2 compared to STS82. The
stability of four catalysts viz. SnO2, TS82, SO42 '/ SnO2 and STS82 were examined
by continuing the oxidation reaction for 6 hours (Fig. 4.9). The S1102 catalyst
deactivated very fast compared to other catalyts [17]. TS82 and S042 '/ SnO2
deactivated slowly with time and conversion dropped from 31.8 to 19 °/o in the
case of TS82 and from 34.6 to 28 % in the case of S0427 SnO2. The deactivation
rate of STS82 is the slowest compared to other systems. The lesser deactivation
must be due to the combined effect of S042’ anion and rare earth oxide promoter
Table 4.15 Comparison of sulfated tin oxide and STS82 at different
temperatures
Catalyst 250 °c 300 °C 350°C 400 °Ca b a b a b a bSO42"/SnOz 21.22 9710 34.67 93 70 59.45 76.90 78.90 4012STS82 34.56 96.90 48.89 94.10 75.89 74.90 100.00 37.20TS82 15.89 97.20 31.86 91.80 42.03 90.10 52.81 93 60S1102 340 98.60 8.79 98.10 17.80 9710 22.89 9630a: conversion of cyclohexanol, b: selectivity of cyclohexanone
Reaction conditions: See foot notes to Table 4.12

Table 4.13 EDX analysis of samples after reaction
Sample Sulfate‘ % Sulfate” %STS82 3.40 3 .25S037 SD02 3.20 2.91
“ Sulfate content before the reaction, b sulfate content afler the reaction
5045 I I I I I .4035 0 .30 ‘\ O .°/o 25 ‘20 \15103 . —9 1. 4. 41 2 3 4 5 6
Time on stream hours
— 0 — Sulf.SnO2 —I— STS82 —A— TS82 -0- SnO2
Fig.4.9 Time on stream study of SO42 '/ SnO2, STS82, TS82 and SnO2Reactionconditions: See foot notes to Table 4 12
146

4.3.4 Mechanism of oxidative dehydrogenation reactions
It is well known that dehydration prevails over metal oxides which are acidic and
dehydration become dominant over basic oxides. In the case of oxidative
dehydrogenation reactions since the rate determining step is probably the
elimination of a proton, the basicity of a catalyst plays an important role, besides
the redox properties of catalysts. The reaction proceeds via the abstraction of a
proton by basic site (02), which is generally rate determining [l8,l9,20]. The
mechanism of the simple dehydrogention is shown below (Fig. 4.10) [21]. The
alcoholic proton is discharged to the basic site and the hydrogen atom at the (1
carbon atom is discharged to the acid site.\ / / \ / /C_C_OH _ . .., C_C:-O/ /H
A B
Fig. 4.10 Mechanism of dehydogenation of alcohol A and B denote an acid site
and a basic site respectively
Ai and Co-workers reported that for several oxidation reactions catalysed
by binary and ternary metal oxide catalysts, the catalytic activity and selectivity are
correlated with the acid-base properties of the catalysts [22,23]. The correlation
was explained by the strength of acid base interactions between reacting molecules
and the catalyst surface [24]. According to the investigators more acidic catalysts
interact more strongly with basic reactants and activate it more easily. It is fiirther
I47

claimed that the selectivity of the oxidation is classified to various types according
to the acid base strength of reactants and products. Acid catalysts readily activate
the reactants but not the products. In the oxidation of basic molecules to acidic
products acid catalysts are more efiective [25].
In the oxidative dehydrogenation of ethanol over nonsulfated oxides the
selectivity of dehydrogenation product followed the order TS82 > TS55 > TS28
However the basicity of the oxides as determined by alcohol decomposition
reaction follows the order TS82 > TS28 > TS55 We have already noticed that
two factors are to be considered to explain the oxidation activity of metal oxide
catalysts. First one is the acid-base properties of the catalysts and second one is
their redox properties. The conversion of ethanol to acetaldehyde can be regarded
as a process in which a basic substrate is converted into an acidic product. So it is
expected that acidic catalysts can activate ethanol more easily and bring about
oxidation. However, it is not clear whether strength of the acid sites present in the
catalyst is higher than the acidity of ethanol. If so the order of catalytic activity
should have been different. This suggests that in the present case the redox
properties of the catalyst systems are important. The reaction takes place by the
adsorption of ethanol on the catalyst surface followed by interaction with acid-base
centres But the total number of such sites also influence the rate of the reaction
It can be seen that as the SnO2 percentage decreases the catalytic activitydecreases. From this it can be concluded that Sn“ sites could be the active sites
for the reaction. The interaction of ethanol and Sn“ sites lead to the reduction of
these sites since oxidation is a process in which reactant losses electron [26]. The
colour of the catalyst turned gray after continuos use due to reduction and
consequently catalyst deactivation is observed. However SnO2 deactivated very
fast as a result of deep reduction. In metal oxides two possible states of activated
oxygen can be recognized; highly reactive surface states of adsorbed oxygen and
I48

less active, lattice incorporated oxygen species. Obviously the former species are
usually considered to be important ones involved in complete oxidation and latter
are believed to participate in selective partial oxidation [27]. In the present
systems, rare earth oxide can produce mobile oxygen species which can migrate to
the surface of SnO2 and can regenerate the active sites by reoxidation of reduced
sites (remote control mechanism). This may be the reason for slower deactivation
of tin-samarium and tin-lanthanum binary oxides compared to pure SnO2. It has
been experimentally evidenced by '80 isotopic study that migration of oxygen
species takes place from Sb2O4 to SnO2 [28].
After sulfate treatment of the mixed oxides strong acid sites are created so
that they can strongly activate alcohol molecule to bring about oxidation. The
electron withdrawing effect of adsorbed sulfate species increases the electron
deficiency of Sn" sites greatly So these sites will have a greater tendency to
accept electrons from the reacting species, which lead to the oxidation of the
adsorbed species. This explains the enhancement in oxidation activity after sulfate
treatment. Basic reactants like ethylbenzene can interact very strongly with acid
sites. According to Tagawa et al the acid sites of Ho between 1.5 and -5 6 are
proven to be the active sites to adsorb ethylbenzene [29].
4.4 ALKYLATION OF PHENOL, ANISOLE AND ANILINE
4.4 1 Alkylation of phenol
A comparative account of TS82 and its sulfated analogue, STS82 at different
temperatures is given in Table 4.17 Compared to TS82, sulfated catalyst
produced an appreciable amount of O-alkylated product, anisole. Moreover large
amounts of polyalkylated products are also formed when sulfated oxide is
149

employed as the catalyst. At 350 0C it afforded a mixture of different products
including anisole, cresols, xylenols and polyalkylated phenols. This is expected as
sulfate treatment lead to the creation of strong acid sites. It is reported that acidic
catalysts such as silica-alumina and zeolites promote O-alkylation reactions giving
anisole [30,3l,32]. We have already discussed in section 3 4 1 how the acid base
properties of catalysts affect product selectivity The electron current the around
benzene ring is influenced by strong acid sites and hence the aromatic ring lie
parallel to the catalyst surface [33,34]. Since the alignment of phenol is parallel to
the catalyst surface methylation is possible at all the positions, which lead to a
mixture of various C-alkylated products.
The effect of feed rate on the product selectivity and conversion is studied
to get an idea about the mechanism of the reaction (Table 4 18). The selectivity of
anisole increases with increase in feed rate. This indicates that at low feed rates
anisole is undergoing secondary reactions but as the feed rate is increased
secondary reactions are suppressed, which results in increase in the anisole
selectivity The selectivity of o-cresol is almost constant whereas the selectivity of
xylenol and polyalkylated products is decreased as the feed rate is increased.
Xylenol may be formed by the direct C-alkylation of phenol via, o-cresol or from
anisole. Anisole can undergo an intramolecular rearrangement to give o-cresol or
it can undergo fiirther methylation to give xylenol. The selectivity of o-cresol
remained almost constant as the feed rate is changed, which suggests that the
fonnation of o-cresol takes place by direct C-alkylation. Moreover the anisole
formed initially must be undergoing further methylation to give xylenol From the
above discussion phenol methylation over the sulfated oxide is possible via, both
pathways, (1) direct C-alkylation and (ii) involving anisole as the intermediate.
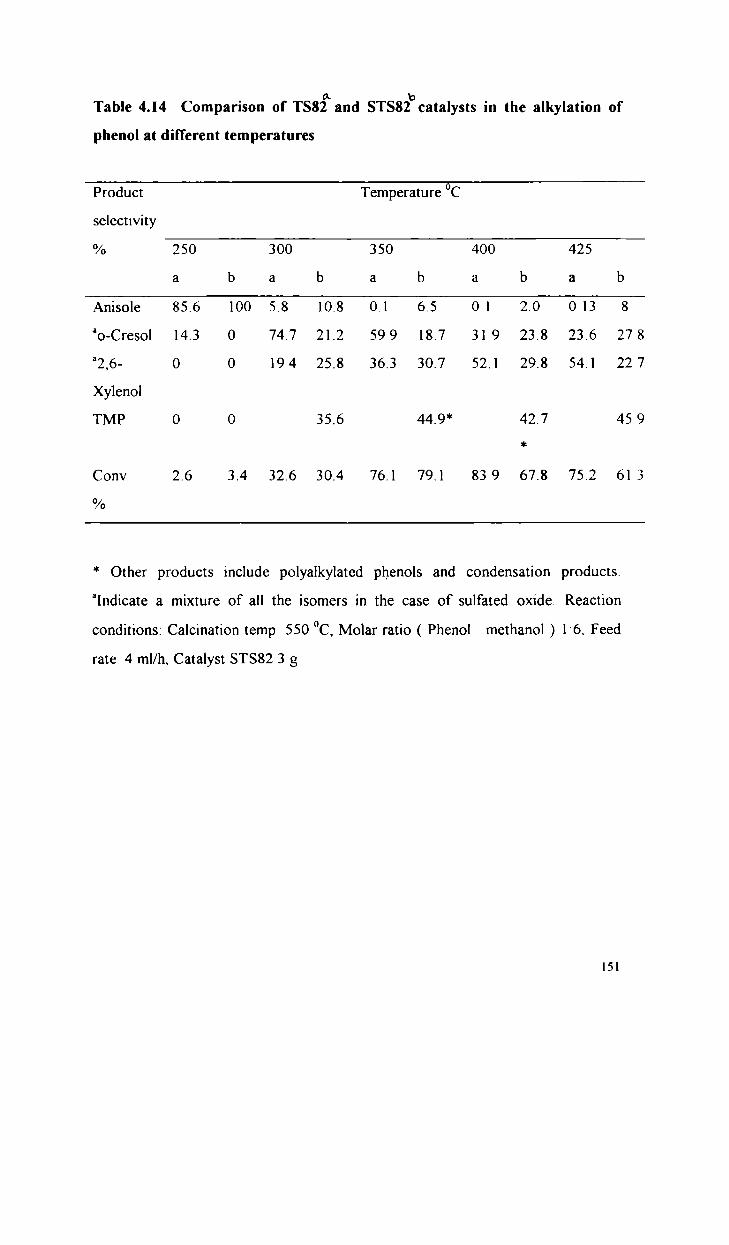
Table 4.14 Comparison of TS82A and STS82bcatalysts in the alkylation of
phenol at different temperatures
Product Temperature °Cselectivity% 250 300 350 400 425a b a b a b a b a bAnisole 85.6 100 5.8 10.8 0.1 6.5 O 1 2.0 O 13 8'0-Cresol 14.3 0 74.7 21.2 59 9 18.7 319 23.8 23.6 27 8‘‘2,6- 0 O 194 25.8 36.3 30.7 52.1 29.8 54.1 22 7XylenolTMP O 0 35.6 44.9* 42.7 45 9
=1:
Conv 2.6 3.4 32.6 30.4 76.1 79.1 83 9 67.8 75.2 61 3%
* Other products include polyalkylated phenols and condensation products.
‘Indicate a mixture of all the isomers in the case of sulfated oxide. Reaction
conditions: Calcination temp. 550 °C, Molar ratio ( Phenol methanol ) 1'6. Feed
rate. 4 ml/h, Catalyst STS82 3 g
151
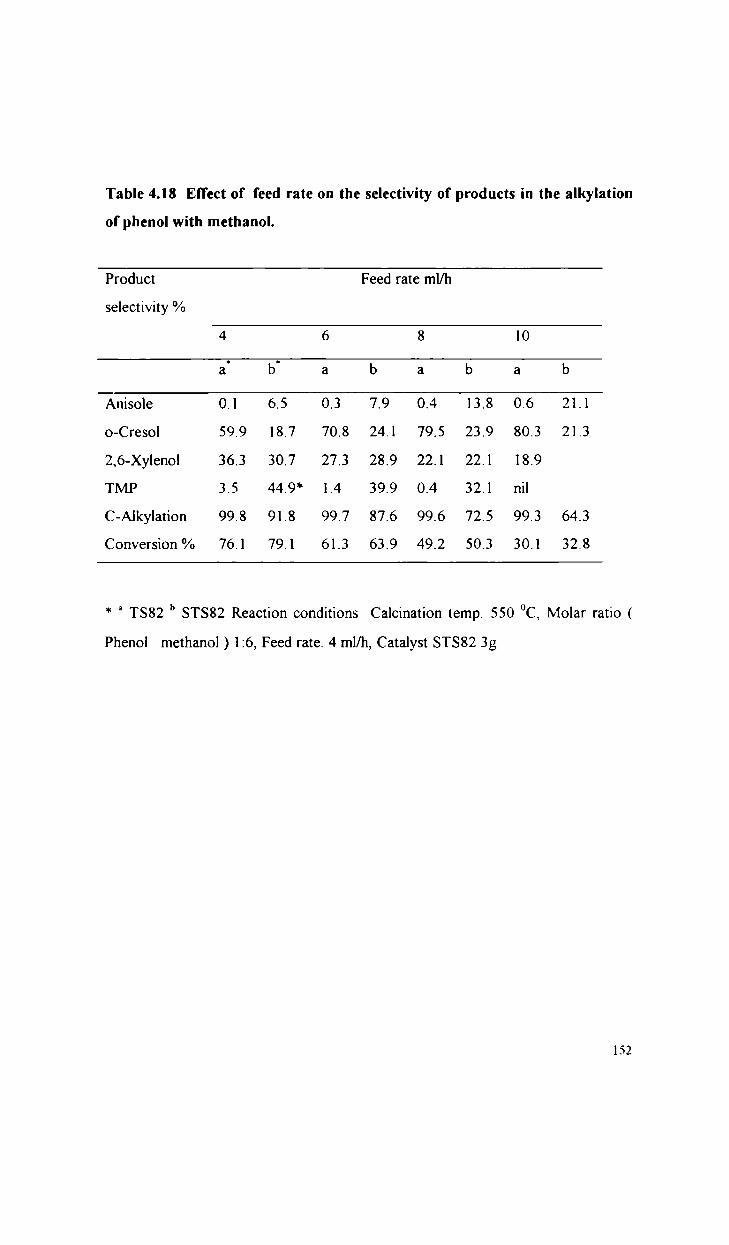
Table 4.18 Effect of feed rate on the selectivity of products in the alkylation
of phenol with methanol.
Product
selectivity %
Feed rate ml/h
4 6 8 10a‘ b. a b a b a b
Anisole 0.1 6.5 0.3 7.9 0.4 13.8 0.6 21.1o-Cresol 59.9 18.7 70.8 24.1 79.5 23.9 80.3 21.32,6-Xylenol 36.3 30.7 27.3 28.9 22.1 22.1 18.9TMP 3.5 44.9* 1.4 39.9 0.4 32.1 nilC-Alkylation 99.8 91.8 99.7 87.6 99.6 72.5 99.3 64.3Conversion % 76.1 79.1 61.3 63.9 49.2 50.3 30.1 32.8
* “ TS82 " STS82 Reaction conditions Calcination temp. 550 °C, Molar ratio (
Phenol methanol ) 1:6, Feed rate. 4 ml/h, Catalyst STS82 3 g
152

Self reactions of anisole and methylanisole were conducted for fiJrther
study (Table 4 19). Anisole is converted into phenol alongwith only small amounts
of o-cresol and xylenol. Phenol is formed by the dealkylation of phenol over
strong acid site. Methylanisole is converted into xylenol alongwith small amounts
of phenol, o-cresol and trimethylphenol. 2,6-xylenol must be formed by the
imramolecular rearrangement of methylanisole. The reaction of anisole with
methanol produced a mixture of products viz. phenol, 2,6-xylenol and small
amounts of cresol, methylanisole and trimethylphenol. Compared to unmodified
oxide, phenol fonnation is greater in the present case.
When a mixture of o-cresol and methanol is passed over the catalyst xylenol and
trimethylphenol are fonned as the major products alongwith other polyalkylated
products.
The effect of time on stream on the conversion of phenol is shown in the
Figure 4.11 Sulfated oxide deactivated very fast compared to its unmodified
analogue. Faster deactivation may be due to the formation of coke.
153
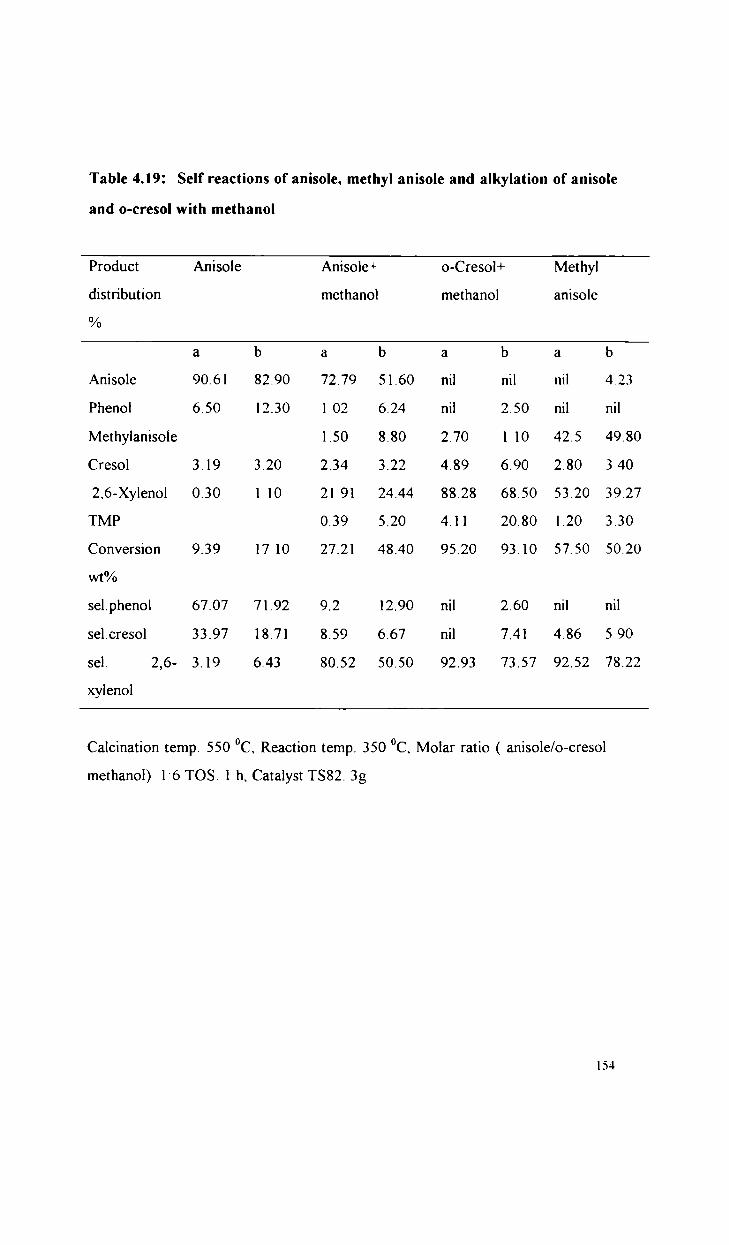
Table 4.19: Self reactions of anisole, methyl anisole and alkylation of anisole
and o-cresol with methanol
Product Anisole Aniso1e+ o-Cresol+ Methyldistribution methanol methanol anisole°/o a b a b a b a bAnisole 90.61 82.90 72.79 51.60 nil nil nil 4.23Phenol 6.50 12.30 1 02 6.24 nil 2.50 nil nilMethylanisole 1.50 8.80 2.70 1 10 42.5 49.80Cresol 3.19 3.20 2.34 3.22 4.89 6.90 2.80 3 402.6-Xylenol 0.30 1 10 21 91 24.44 88.28 68.50 53.20 39.27TMP 0.39 5.20 4.11 20.80 1.20 3.30Conversion 9.39 17 10 27.21 48.40 95.20 93.10 57.50 50.20wt%
se1.pheno1 67.07 71.92 9.2 12.90 nil 2.60 nil nilsel.cresol 33.97 18.71 8.59 6.67 nil 7.41 4.86 5 90sel. 2,6- 3.19 6.43 80.52 50.50 92.93 73.57 92.52 78.22xylenol
Calcination temp. 550 °C, Reaction temp. 350 °C, Molar ratio ( anisole/o-cresol
methanol) 16 TOS. 1 h, Catalyst TS82. 3g
154

30 070 \....§0\ \O\E .\ O0/. ‘O .+.———. .30
20
100 . : : :1 2 3 4 5 6Time on stream
-—O—TSB2 —-O-STS82
Fig4 l I Effect of time on stream-comparison of TS82 and STS82
Reaction conditions: See foot notes to the Table 4.18
4.4.2 Alkylation of anisole with methanol
A comparative study of STS82 and TS82 in the alkylation of anisole with methanol
is depicted in Table 4.20. The sulfate treatment resulted in the formation of an
appreciable quantity of phenol alongwith xylenol and trimethylphenol The
formation of phenol is expected as strong acid sites lead to dealkylation reactions
The xylenol formed must be undergoing further methylation to produce
trimethylphenol and other polyalkylated phenols. The decrease in conversion of
anisole in the case of STS82 above 400 °C must be due to the self decomposition
of methanol. From the above discussion it is clear that sulfate treatment of the
mixed metal oxide resulted in the nonselective fonnation of 2,6-xylenol from
anisole.

Table 4.20: Alkylation of anisole with methanol- Effect of temperature on
the product distribution
Product
selectivity 350 “C 330 "C 400 "C 420 "C°/o a b a b a b a bPhenol 0 40 12.90 2.20 17 90 3.93 20.10 3 12 13 30Methyl 22.63 13.20 4.06 2.23’ nil nil nil nilanisole
Cresol 3.610 6.67 6.69 9 90 5.69 3.30 4.20 4 40Xylenol 63.91 50.50 31.65 47 14 32.50 43.20 34 05 44.20TMP 4 16 10.76 5.29 13.9 7.32 25.40 8.61 29.20Conv 43.20 43.40 56.30 62.10 65.20 69 40 33.62 65 3mo./3
at TS82 bi STS82
Reaction conditions: Calcination temp. 550 °C, Reaction temp. 350 °C._ Molar
ratio ( anisole: methanol) 1:6 TOS. l h.
4.4.3 Alkylation of aniline with methanol
The alkylation of aniline with methanol over STS82 lead to the formation of
benzene, toluene, N-methylanilne, N,N-dimethylanilne and small amounts of
toludines and condensation products (4.21). Benzene is formed by the
dealkylation of anilne. Toluene must be formed by the methylation of benzene.
Sulfate treatment of TS82 lead to so many undesirable side reactions and
selectivity of NMA is decreased alongwith total selectivity of N-alkylated

products. Since aniline is a base it can be easily adsorbed on strong acid sites
created by sulfate treatment. This will alter the selectivity of products. Another
disadvantage of the sulfated system is that it deactivates faster (Figure 4. 12).
Table 4.21
different temperatures
Alkylation of aniline with methanol over STS82 and TS82 at
Product sel. Temperature °C% 300 350 375 400a b a b a b a bBenzene nil 3.40 nil 8.90 nil 11 70 nil 17 90+ Toluene
NMA 98.10 77 70 96.60 61 18 93.30 48.23 84.61 40.20NNDMA 1.90 17.30 3.40 28.20 6.70 38.10 15.39 36.30*Conversion 32.80 29 10 62.30 56.98 68.10 72.30 73.18 74 12%
a: TS82 b: STS82
* Other products include C-alkylated products and condensation products.
Reaction conditions: Reaction temp. 350 OC, Feed rate 4 ml/h TOS 1 h
157

70 TO C Q60 -T C O50 '\4° I-—_._____-L°/. I30
20
100 . . . . .2 3 4 5Time on stream hour
—O—TSB2 —I—STSB2
Fig.4. 12 Effect of time on stream on the conversion of aniline over STS82
Reaction conditions: See foot notes to Table 4.21
158

REFERENCES
.o~.=~4>w
11
12.
13.
15
16.
17
C. J. Norman, P A. Goulding, 1. McA1pine, Catal. Today., 20 (1994) 313.
K. Arata, Appl. Catal. A General, 146 (1996) 3
H. Matsuhashi, M. Hino, K. Arata, Appl. Catal., 59 (1990) 205 M. Hino,
Ph. D. Thesis, Hokkaido Univ 1982.
F Lonyi, J Valyon, J Engelhardt, F Mizukami, J Catal., 160 (1996) 279
A. Corma, Chem. Rev 95 (1995) 559
J. M. Parera, Catal. Today, 15 (1992) 481
R. Srinivasan, R. A. Keogh, D. R. Milburn, B. H. Davis, J. Catal., 153
(1995) 123 R. A. Keogh, R. Srinivasan, B. H. Davis, J. Catal., 151 (1995)
123.
F Lonyi, J. Valyon, Therm. Anal., 46 (1996) 211
R.T Parfitt, R. S. C. Smart, J. Chem. Soc., Faraday Trans. 1, 73(9)
(1977)796; T Xingyin, K. Fangming, Z. Iiqing, Chemical Journal of Chinese
Universities, 7(2) (1986) 161.
R. A. Nyquist, R. O. Kagel, “Infrared spectra of inorganic compounds”
Academic press ( 1971).
T Jin, Inorg. Chem, 23 (1984) 4376
D. A. Ward, E. I. Ku, J. Catal., 150 (1994) 18.
T Yamaguchi, K. Tanabe, Bull. Chem. Soc. Jpn., 47 (1974) 424.
K. Tanabe, M. Misono, Y Ono, H. Hatton' “New solid acids and bases,
their catalytic properties”, Stud. Surf. Sci. Catal. (Eds.) B. Delmon, J. T
Yates, 51 (1989) 262.
H. Matsuhashi, M. Hino, K. Arata, Appl. Catal., 59 (1990) 205.
T Tagawa, T Hattori, Y Murakami, J. Catal., 75 (1982) 66.
H. Matsuhashi, M. Hino, K. Arata, Chem. Lett., (1988) 1027
M. J Fuller, M. E. Warwick, J. Catal., 29 (1973) 441.
159

18.
19
20
21
23
24
25
26
27
28
29.
30
31
32.
33
34
H. Niyama, E. Echigoya, Bull. Chem Soc. Jpn., 44 (1971) 1739
L. Nodek, J. Sedlacek. J Catal., 40 (1975) 34, N. Takezawa, C. 1-lanamaki,
H. Kobayashi, J Catal., 34 (1974) 329
K. Thomko, Z. Phys. Chem. NF, 106 (1977) 225
C L. Kibby, W K. Hall. J Catal., 29 (1973) 144.
M. Ai, T lkawa, J. Catal., 40 (1975) 203
M. Ai. Shokubai. 18 (1976) 17 , M. Ai, T Niikuni. S Susuki, Kogyo
Kagaku Zasshi, 73 (1979) 950; D. B. Dadyburjor, S. S Jawur, E.
Ruckenstain, Catal. Rev Sci. Eng, 19 (1979) 293
M. Ai, T Niikuni, S. Susuki, Kogyo Kagaku Zasshi, 73 (1979) 950.
T Seiyama, N. Yamazoe, M. Egashira, Proc. 5"‘ Intern. Congr Catal. Palm
Beach, (1972) 997
M. J. Fuller, M. E. Warwick, J. Catal., 29 (1973) 441
M. J. Fuller, M. E. Warwik, J. Catal., 29 (1973) 441, E W Thorton, P G
Harrison, J. Chem. Soc, Faraday Trans. 1, 71 (1975) 461
K. WaKabayeshi, Y Kamiya. N. Ohtu, Bull. Chem. Soc. Jpn. 40 (1967)
2172; 41 (1968) 2776.
T Tagewa, T Hattori, Y Musakami, J. Catal., 75 (1982) 66.
M. Inoue. S. Enomoto, Chem. Pharm. Bull. (Tokyo), 20 (1972) 232.
K. Tanabe, T Nishizaki, Proc. 6"‘ Intern. Congr Catal. London, (1977) 863
Y Fulcuda, T Nishizaki, K. Tanabe, Nippon Kagaku Zasshi, ( 1972) 1754.
B. Xu, T Yamaguchi, K. Tanabe, Materials Chem. Phys., 19 (1988) 291
K. Tanabe, M. Misono, Y Ono, H. Hattofi “New solid acids and bases,
their catalytic properties”, Stud. Surf. Sci. Catal. (Eds.) B. Delmon. J T
Yates, 51 (1989) 23
160
CHAPTER V
SUMMARY AND CONCLUSIONS

5.1 SUMMARY
A comparative study of acid-base properties and catalytic activity of Sn-La and
Sn-Sm mixed oxides and their corresponding sulfate modified analogues are
reported in this thesis. The catalytic activity and product selectivity in the
decomposition of alcohols are correlated with the acid-base and redox properties
of the catalyst systems under study The effect of catalyst preparation,
pretreatment and various reaction parameters on the catalytic activity of sulfate
modified oxides is investigated in the oxidative dehydrogenation reactions The
experimental conditions are optimised to synthesise industrially important organic
chemicals viz. 2,6 xylenol, o-cresol, N-methylanilne and N,N-dimethylaniline
employing the mixed oxide systems. The effect of sulfate treatment on the
catalytic activity of these systems in the alkylation reactions of phenol, anisole and
aniline is also investigated and the merits and demerits of sulfate treatment are
highlighted.
CHAPTER I narrates a thorough review of the published literature on the acid
base properties and catalytic applications of oxide systems containing tin oxide and
rare-earth oxides. The important physico-chemical aspects and catalytic reactions
of sulfate modified metal oxides are also included in this chapter
CHAPTER II discusses the preparation of catalyst and experimental techniques
employed for the characterisation. The different methods for the preparation of
sulfate modified mixed oxides are described. It is found that the generation of
superacid sites depend on the method of preparation of the catalyst. The
experimental set up used for the evaluation of catalytic activity is also
incorporated.
162

CHAPTER III is devoted to the discussion of physico-chemical characteristics,
acid-base properties and catalytic activity of the mixed oxide systems. The
catalytic activity study comprises alcohol decomposition reactions, oxidation
reactions, reduction of aromatics containing various reducible groups and
alkylation reactions of phenol, anisole and aniline. From the results of n
butylamine and trichloroaceticacid titrations using Hammett indicators and alcohol
decomposition reactions, it is found that basicity of the mixed oxides are in the
order SnO2 (80%)-La2O3 (20%) > SnO2 (20%)-La2O3 (80%) > SnO2 (50%)-La2O_:
(50%) and SnO2 (80%)-Sm2O3 (20%) > SnO2 (20%)-Sm2O;. (80%) > SnO2 (50%)
Sm2O; (50%). The catalytic activity in the oxidative dehydrogenation reaction is
found to depend on catalyst composition, acid-base properties, redox properties,
catalyst pretreatment and various reaction parameters like, temperature, feed rate
and presence of water. The product selectivity in the alkylation of phenol, anisole
and aniline depends mainly on the acid-base properties of the catalysts. These
oxides catalysed transfer hydrogenation of nitrobenzene efficiently with
isopropanol and also resulted in the chemoselective reduction of aromatics
containing different reducible functional groups.
CHAPTER IV of the thesis focuses on a comparative study of the physico
chemical characteristics and catalytic properties of the aforementioned mixed oxide
systems and their sulfate modified analogues. An appreciable change in the
physico-chemical properties of the catalyst is observed upon sulfate treatment
followed by calcination in air The sulfate treatment leads to the formation of
stronger acid sites, though the strength of these sites varies with the method of
preparation of the catalyst. The activity of sulfate modified systems in the alcohol
decomposition reactions and oxidative dehydrogenation reactions is much greater
than unmodified counterparts. The stronger acid sites lead to the faster
l63
deactivation of the catalysts and to the formation of undesirable products in the
alkylation of phenol, anisole and aniline.
CHAPTER V includes the summary and conclusions of the results which are
obtained from the present study
5.2 CONCLUSIONS
The following conclusions are drawn from the experimental investigations carried
out to elucidate the effect of sulfate modification of binary mixed oxides containing
tin and rare earth elements (La and Sm) on their acid-base properties and catalytic
activity.
1 The textural properties, acid-base properties and catalytic activity of the Sn-La
and Sn-Sm binary oxide systems vary appreciably with their chemical composition
2. The decomposition of different alcohols can be used to gather very important
informations about the surface acid-base properties of the catalysts.
3 The catalytic activity in the oxidative dehydrogenation reaction is found to
depend on catalyst composition, acid-base properties, redox properties, catalyst
pretreatment and various reaction parameters like, temperature, feed rate and
presence of water.
4. The mixed oxides containing Sn and rare earth elements (La and Sm) are
effective in the synthesis of industrially important chemicals like 2,6-xylenol, o
cresol, N-methylanine and N,N-dimethylanilne.
164

5 The Sn-La and Sn-Sm mixed oxides can be used for the chemoselective transfer
hydrogenation of various aromatics containing different reducible groups. under
optimised conditions.
6. The sulfate treatment leads to a remarkable increase in the surface area of the
oxides because samples were cracked into fine particles, which is confirmed from
SEM pictures and broadening of XRD peaks.
7 The decomposition of sulfate takes place at higher temperature compared to
sulfated tin oxide and sulfated zirconia and decomposition temperature depend on
the catalyst composition.
8 The strength of acid sites created as a result of sulfate treatment depend on the
method of preparation, catalyst pretreatment, sulfating agent and chemical
composition of catalyst precursor
9. The activity of sulfate modified systems in the alcohol decomposition reactions
and oxidative dehydrogenation reactions is much greater than unmodified
counterparts.
10. In the alkylation of phenol, anisole and aniline, the stronger acid sites lead to
the faster deactivation of the catalysts and to the formation of undesirable
products.
1 l Sulfated mixed oxides are found to be more active than sulfated SnO2.
I65


![Sulfated zirconia[1]](https://static.fdocuments.net/doc/165x107/5568f2ecd8b42aff2e8b4932/sulfated-zirconia1.jpg)