Sukriti Project Report Neva
66
Chapter 1 Introduction STUDY TOPIC The study financial statement reflect the financial position and operating strengths or weaknesses of the concern by properly establishing relationship between the items of the balance sheet and financial statements. Financial statement analysis deals with meaningful interpretation of financial data available in financial statements to serve specific purpose of organizations of such data for their decision making .this involves identifying the purpose and selecting suitable means of analysis. Financial statement analysis is essentially purposive. Hence it is overall responsibility of the management to see that the resources of the firm are used efficiently and effectively and the firm’s financial position is good. Financial statement analysis does indicate what can be expected in future from the firm. MEANING & IMPORTANCE OF FINANCIAL ANALYSIS The accounting process begins with the recording of transactions in the books of primary entry. The accounting information resulting from the transactions so recorded gets posted in to various accounting heads in the ledger. In the ledger each account is balanced at the end of an accounting period and a summary of all balances in the various accounting heads from the ledger is prepared which is known as trial balance from such trial balances and after effecting certain adjustments considered necessary (which is dependent on the particular accounting system followed by the organizations) the financial statements relating to the accounting period are prepared.
-
Upload
ujranchaman -
Category
Documents
-
view
62 -
download
0
Transcript of Sukriti Project Report Neva
Chapter 1
Introduction
STUDY TOPIC
The study financial statement reflect the financial position and operating strengths or weaknesses of the concern by properly establishing relationship between the items of the balance sheet and financial statements.
Financial statement analysis deals with meaningful interpretation of financial data available
in financial statements to serve specific purpose of organizations of such data for their decision making .this involves identifying the purpose and selecting suitable means of analysis. Financial statement analysis is essentially purposive.
Hence it is overall responsibility of the management to see that the resources of the firm are used efficiently and effectively and the firm’s financial position is good. Financial statement analysis does indicate what can be expected in future from the firm.
MEANING & IMPORTANCE OF FINANCIAL ANALYSIS
The accounting process begins with the recording of transactions in the books of primary entry. The accounting information resulting from the transactions so recorded gets posted in to various accounting heads in the ledger. In the ledger each account is balanced at the end of an accounting period and a summary of all balances in the various accounting heads from the ledger is prepared which is known as trial balance from such trial balances and after effecting certain adjustments considered necessary (which is dependent on the particular accounting system followed by the organizations) the financial statements relating to the accounting period are prepared.
There are some questions, which arise from the study of financial statements. These could be “Is Company’s profitability adequate? Why is a profit low in spite of increased sales? Why is there liquidity problem though profitability is good? Why no reasons for changes in assets, liabilities and equity between two dates? Why no dividends are paid though there are good profits? From where have come cash flows and how they are applied? These and many other questions need answers, which can be possible when the financial statements are suitably analyzed
The first task of financial analysis is to select the information relevant to the decision under consideration to total information contained in the financial statement. The second step is to arrange the information in a way to highlight significant relationship. The final step is interpretation and drawing of the interface and conclusions. Financial Statement is the process of selection, relation and evaluation.
The information in the statements is used by
Trade creditors, to identify the firm’s ability to meet their claims i.e. liquidity position of the company.
Investors, to know about the present and future profitability of the company and its financial structure.
Management, in every aspect of the financial analysis. It is the responsibility of the management to maintain sound financial condition in the company.
Documents Used in Financial Analysis
The two main sources of data for financial analysis are :-
BALANCE SHEET
INCOME STATEMENTS (Profit &Loss Account)
The balance sheet outlines the financial and physical resources that a company has available for business activities in the future. It is important to note, however, that the balance sheet only lists these resources, and makes no judgment about how well they will be used by management. For this reason, the balance sheet is more useful in analyzing a company's current financial position than its expected performance.
The main elements of the balance sheet are Assets and Liabilities.
Assets generally include both current assets (cash or equivalents that will be converted to cash within one year, such as accounts receivable, inventory, and prepaid expenses) and noncurrent assets (assets that are held for more than one year and are used in running the business, including fixed assets like property, plant, and equipment; long-term investments; and intangible assets like patents, copyrights, and goodwill). Both the total amount of assets and the makeup of asset accounts are of interest to financial analysts.
Liabilties also genrally includes two categories current liabilities (debts that will come due within one year, such as account payble, short-term loans, and taxes) and long-term debts (debts that are due more than one year from the date of the statement). Liabilities are important to financial analysts because businesses have same obligation to pay their bills regularly as individuals, while business income tends to be less certain. Long-term liabilities are less important to analysts, since they lack the urgency of short-term debts, though their presence does indicate that a company is strong enough to be allowed to borrow money.
The balance sheet also commonly includes stock-holders' equity accounts, which detail the permanent capital of the business. The total equity usually consists of two parts: the money that has been invested by shareholders, and the money that has been retained from profits and reinvested in the business. In general, the more equity that is held by a business, the better the ability of the business to borrow additional funds.
In contrast to the balance sheet, the INCOME STATEMENT provides information about a company's performance over a certain period of time. Although it does not reveal much about the company's current financial condition, it does provide indications of its future viability. The main elements of the income statement are revenues earned, expenses incurred, and net profit or loss. Revenues consist mainly of sales, though financial analysts may also note the inclusion of royalties, interest, and extraordinary items. Likewise, operating expenses usually consist primarily of the cost of goods sold, but can also include some unusual items. Net income is the "bottom line" of the income statement. This figure is the main indicator of a company's accomplishments over the statement period.
Importance
The financial statement analysis is important for different reasons:
1. Holding Of ShareShareholders are the owners of the company. Time and again, they may have to take decisions whether they have to continue with the holdings of the company's share or sell them out. The financial statement analysis is important as it provides meaningful information to the shareholders in taking such decisions.
2. Decisions And PlansThe management of the company is responsible for taking decisions and formulating plans and policies for the future. They, therefore, always need to evaluate its performance andeffectiveness of their action to realise the company's goal in the past. For that purpose, financial statement analysis is important to the company's management.
3. Extension Of CreditThe creditors are the providers of loan capital to the company.Therefore they may have to
take decisions as to whether they have to extend their loans to the company and demand for higher interest rates. The financial statement analysis provides important information to them for their purpose.
4.Investment DecisionThe prospective investors are those who have surplus capital to invest in some profitableopportunities. Therefore, they often have to decide whether to invest their capital in the company's share. The financial statement analysis is important to them because they can obtain useful information for their investment decision making purpose.
NEED TO STUDY FINANCIAL ANALYSIS
Financial statement analysis is used to identify the trends and relationships between financial statement items. Both internal management and external users (such as analysts, creditors, and investors) of the financial statements need to evaluate a company's profitability, liquidity, and solvency. The most common methods used for financial statement analysis are cash flow statement, fund flow statement, and ratio analysis. These methods include calculations and comparisons of the results to historical company data, competitors, or industry averages to determine the relative strength and performance of the company being analyzed.
SCOPE OF FINANCIAL STATEMENT ANALYSIS
The role of financial reporting by companies is to provide information about their performance, financial position, and changes in financial position that is useful to a wide range of users in making economic decisions.1 The role of financial statement analysis is to take financial reports prepared by companies, combined with other information, to evaluate the past, current, and prospective performance and financial position of a company for the purpose of making investment, credit, and other economic decisions.
In evaluating financial reports, analysts typically have an economic decision in mind. Examples include the following:
• Evaluating an equity investment for inclusion in a portfolio.
• Evaluating a merger or acquisition candidate.
• Evaluating a subsidiary or operating division of a parent company.
• Deciding whether to make a venture capital or other private equity investment.
• Determining the creditworthiness of a company that has made a loan request.
• Extending credit to a customer.
• Examining compliance with debt covenants or other contractual arrangements.
• Assigning a debt rating to a company or bond issue.
• Valuing a security for making an investment recommendation to others.
• Forecasting future net income and cash flow.
RESEARCH METHODOLOGY
RESEARCH
Research is defined as a systematic, gathering recording and analysis of data about problem relating to any particular field.
METHODOLOGY
The information is collected through secondary sources during the project. That information was utilized for calculating performance evaluation and based on that, interpretations were made.
The data is collected by 2 methods:
Primary data
Secondary data.
Primary data is collected through collecting information from company officers, from external guide.
Secondary data, which is secondary in nature i.e. already, collected information this secondary data is collected through Company’s Annual Report and discussion with them.
Interpretation of:
Balance sheet
Profit and loss account
Annual reports
Sources of data
Entire information is collected through a secondary source i.e. through a data, which have been gathered for some other purposes. Some of the sources of secondary data are;
Sources of secondary data:
1. Most of the calculations are made on the financial statements of the company provided statements.
2. Referring standard texts and referred books collected some of the information regarding theoretical aspects.
3. Method- to assess the performance of the company method of observation of the work in finance department in followed.
OBJECTIVES OF STUDY
The major objectives of the resent study are to know about financial strengths and weakness of NEVA GARMENTS LTD. through FINANCIAL RATIO ANALYSIS.
The main objectives of resent study aimed as:
1. To study the present financial system at NevaLtd.
2. To know the financial condition of the company.
3. Interpret the financial statement so that the strength and weakness of a firm. Historical performance and current financial condition can be determined.
4. To analyze the liquidity position of the company.
5. Throw light on a long term solvency of a firm.
6. To offer appropriate suggestions for the better performance of the organization.
RESEARCH DESIGN
A research design is the specification of method and procedure for accruing the information needed. It is overall operational pattern of frame work of project that stipulates what information is to be collected for source by that procedures. Descriptive Research design is appropriate for this study.
Descriptive study is used to study the situation. This study helps to describe the situation. A detail descriptive about present and past situation can be found out by the descriptive study. In this involves the analysis of the situation using the secondary data.
It follows the following steps:
Collection of data
Oraganisation of data
Presentation of data
Analysis of data
Interpretation of data
DATA COLLECTION
This research study is based on secondary data, means data that are already available i.e. the data which have been already collected and analyzed by someone else.
Secondary data are used for the study of Ratio analysis of this company. To collect the data I have refer – Company annual report, annual magazine, last 5 year balance sheet, and cash flow statements. TOOLS USED FOR ANALYSIS
In this present study ratio analysis is used as a tool for doing financial analysis of NEVA GARMENTS LTD.. Ratio analysis, cash flow statements, and fund flow statement are used to depict the financial information.
CHAPTER 3
ORGANISATION INFORMATION-
NEVA GARMENTS LTD
HISTORY
THE N0.l brand of the t- shirt company DUKE FASHION INDIA LTD. Pionered the t-shirtculture and exported it to countries like UK US introduced DUKE INTERNATIONAL PVT LTD.Ln 26.08 1998 a step towards capturing thermal winter innerwear by Mr. Nirmal Kumar Jain younger brother of duke group. Later the games changed to KNA international ltd in 01.08.2000 and know as NEVAGARMENTS LTD.
The affairs of the NEVA GARMENT S LTD. are controlled and manage by Mr.Nirmal Kumar Jain managing director Mr. Vishal Jain (executive director) and Mr.Nitin Goyal as director Mr. Vishal Kumar Jain is looking afier human resources developments activities, Production,Maintenence Designing quality and dispatch debarments of the company and Mr.Nitin Kumar Goyal, director is looking up finance,marketing, sales and purchase departments.
NEVA becomes market leaders in no time and today it boasts of 25% share. Of the 100 corer branded thermnal market. We have state of the art resources at Ludhiana and employing direct and indirect more than1000 employees and with imported machines from Germany USA Japan and Taiwan. Providing its strength on the domestic soil NEVA is playing to takes the products to international shores.
Being a premium quality brands with economical pricing have helped Neva to establish itself in the markets of Middle East and the gulf.
Over the years company progressed in strength and resources. The production capacity was set up first in theyear 1998, with a small 3000 pcs. per day and over the years, the company has under taken several phases of expensionand since then the production capacity has increased from 20000 pcs. per day.
In 1998 Indian winters changed forever. Duke-lndia’s number one T-shirt company and exported to
Countries like UK and US introduced NEVA, a step towards capturing Thermal Winter Innerwear. It was a never before concept in the innerwear market in India. The product becomes an instant success and NEVA becomes a household name. It sold more than 2 laky garments in the first year itself. Today the group enjoys the total turnover of more than 300 crores.
Neva became leaders in no time, today it boasts of 25% share of the 100 crore branded thermal market. We have a state of the art factory located in Ludhiana employing more than 1000 employees and with machines imported fiom Germany, U.S.A. Japan and Taiwan, the company produces 20000 Pcs. Per day.

Neva is responsible for turning thermal innerwear first into a necessity and then into an industry in India.Today we produce India’s World’s largest range of thermals. Afier the phenomenal success of thermal innerwear, it was a natural for Neva to expand its portfolio of offering. Filling ventured into high quality innerwear DNA lingerie. What was a modest beginning in 2001has now become a sweeping was of success.
Proving its strength on the domestic soil, Neva is now planning to take this product to international shores.Being a premium quality brand with economical pricing has helped Neva establish itself in the markets of Middle East and the Gulf. Afier the first successful phase of overseas expansion, Neva is now poised to enter other global markets.
Right from the beginning, Neva has had a policy to provide innovative products to our consumers. Carrying forward this policy, we at Neva are proud to introduce the perfect way to combat winters: Neva Leave, Neva we also have an Active Wear range the best choice of apparel when you are active and energetic.
Sensing the changes the market is undergoing and anticipating future selling trends; Neva has strategically decided to for a into large foreign stores and multi branded outlets. As the portfolio of products of the company is increasing rapidly, it is considering showcasing the range in multi branded stores through a special counter. This will enable the customer to see and choose from the large range of the brand’sproducts. The future holds tremendous opportunities as Neva moves from one Milestone to the next.
Mod Quilt, Neva Maxx Essencial and Neva Pep Thermals for all age groups. We hope that these products like any Neva product exceed our customer’s expectations. You can also make your summer collection look more stunning with our world class products: Neva Mod (In Co-branding with Birla Cellulose of Adyta Birla Group), Neva Pep, Neva maxx, with these products, you can make a style statement and at the sametime, stay comfortable too.

ABOUT KNA
Established more than three decades ago “DUKE” today is a household name in India. Consistently providing the Indian consumers, their means of maximum satisfaction by giving them best quality products and services at an affordable process.
Coming Of DUKE group of companies KNA INTERNATIONS, L.T.D. Synonyms with excellence in its structural and functional perspectives.
The house of “KNA” has contributed their mite in satisfying the customers need for wearing only Unique and global quality “Thermal” inner wears for the first time in India.
The group concerns have in house facilities right from your drying facilities right from yarn drying.
“Knitting, fabric processing and finishing up to manufacturing of garments.
KNA having computerized plants state of art machinery for latest garment processing and manufacturing and is one of the most capable units of North India to Crum out satisfaction to millions of its customers under the supervision of skilled and teaching qualified professionals. Our commitment to the nation is to make available to the Indian masses History goods,. Knitted fabrics, garments and Thermal inner wear at most affordable process.
PRODUCTS QF NEVA GARMRENTS
WINTER WEAR
Neva Body Warm Neva essences
Neva Quilt Neva elevate
Neva Mate Pep thermal
Track suit
SUMMER WEAR
Neva Pep range Neva bra
Neva Max range Neva mode
Neva Panties Neva active wears
The distribution network consists of distributors retailers who form an important channel. Neva is a main supplier to north zone, south zone, Delhi, Bihar, Maharashtra, UP. Gujarat ,Himachal Pradesh.
DEPARTMENTS OE NEVA
PRODUCTION DEPARTMENT
Thread combination used. They used 60 ticket thread and 100-ticket thread. The 100 ticket thread is more strong is compare to the 60 ticket thread as so it is used to sew the elastic or stretchable fabric. The various accessories that are used in the article primarily comprise of elastic, labels, laces, buttons etc. at each of the processes a due consideration to quality checking was given. The quality check was done while cutting of the articles, online sewing, after sewing the entire articles, after pressing, before packing and while packing
The total number of machines in the department was about 150 with 5 units and 5 supervising on an average 30 machines at a time. There are a few single needle machines to stitch labels to the articles. There are aover locking machines, flat looking machines, flat Seminars machines, machines with auto thread trimmer, machines for embroidery, buttonhole button stitching etc.
Also I learnt the importance of laying in cutting, usually before cutting of the article is done, the clothes is laid on the table in layers straight and then cut accordingly as how may pieces can be cut in one go. The process of laying basically help in decreasing the time taken to cut bulk amount of pieces, help cutting maximum pieces in one ago, decreased the incurred cost and standard cutting of pieces is ensured, but the person set on the cutting job is not a well trained one or is not accurate and precise in his job, there may bechance of bulk wastage. The unfinished goods that are still undergoing the process of manufacturing are called Work-in —progress.
About 10,000-11000 pieces both summers wear and winter wear are produce in a day in a firm. The maindefects based by production that of calendaring dying problem, knitting problem, drafiing problem, bundling problem, wrong needle used etc quality control has to look for defects by broken interlock stitch, over
stitching, knitting faults, machines oil on clothe, unseen or improper sewn pieces, wrong labels, wrong measurement, stitch shipped, discoloring etc.
Then after the article is made, it is pressed and checked by the quality control and packed into the transparent poly bags and boxes Mr. Ajay showed me around how the packing is done

and highlighted the while packing it must be kept into consideration that the right size sets get into right packing and standard folds, have right label, have QC label are correctly fit into the right size boxes, have right price tags and holograms. They are then sent to the finished goods departments.

KNITTING DEPARTMERNT
There are basically two types of the knitting machines.
Sinker machines which is single knit used in Fauna Jersey
Interlock machines which is double knit are used in Neva quilt, Neva mate etc.
Between two layers of cotton poly is done. There are in all 37 machines out of which 16 are imported ones.The edge of the imported.
MARKETING DEPARTTMENT
All the marketing &market related function performed by marketing Dept. The entire distribution network has been divided in zones namely North Zone, South Zones, East Zones, Delhi, NCR, Bihar, Maharashtra, Gujarat, Chhattisgarh, Rajasthan, Uttaranchal, Utter Pradesh.
MIS DEPAR TMENT
The various functions of MIS department are:-
I) To collect facts and figures from various departments
2) To have monthly/ quarterly report generation from relevant figures.
3) To formulate the system in each and every department in shape of various requisite formats so as to clarify the doubts and confusions.
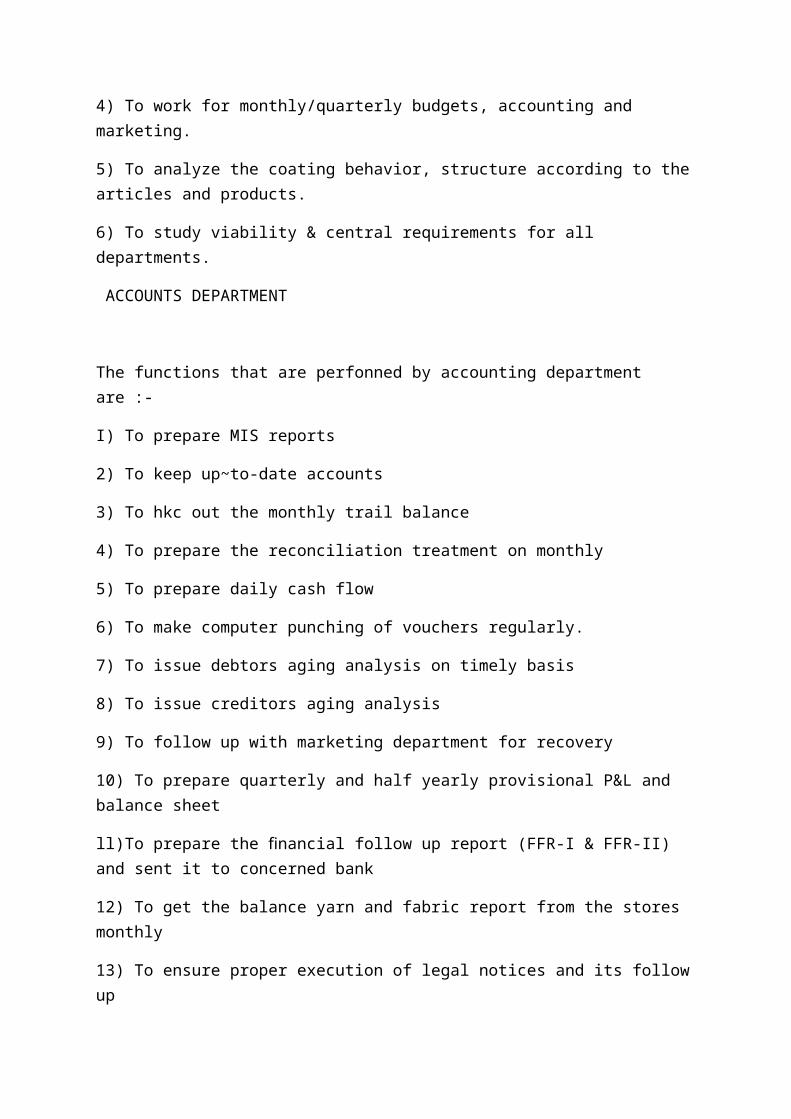
4) To work for monthly/quarterly budgets, accounting and marketing.
5) To analyze the coating behavior, structure according to the articles and products.
6) To study viability & central requirements for all departments.
ACCOUNTS DEPARTMENT
The functions that are perfonned by accounting department are :-

I) To prepare MIS reports
2) To keep up~to-date accounts
3) To hkc out the monthly trail balance
4) To prepare the reconciliation treatment on monthly
5) To prepare daily cash flow
6) To make computer punching of vouchers regularly.
7) To issue debtors aging analysis on timely basis
8) To issue creditors aging analysis
9) To follow up with marketing department for recovery
10) To prepare quarterly and half yearly provisional P&L and balance sheet
ll)To prepare the financial follow up report (FFR-I & FFR-II) and sent it to concerned bank
12) To get the balance yarn and fabric report from the stores monthly
13) To ensure proper execution of legal notices and its follow up
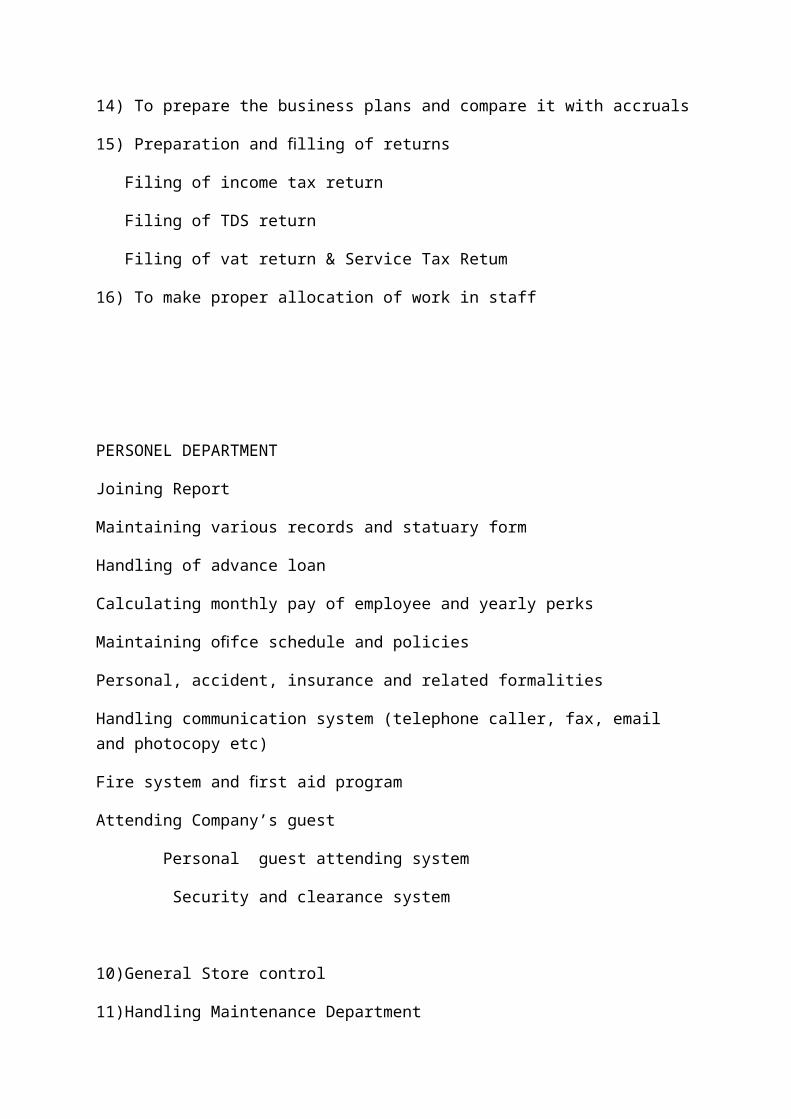
14) To prepare the business plans and compare it with accruals
15) Preparation and filling of returns
Filing of income tax return
Filing of TDS return
Filing of vat return & Service Tax Retum
16) To make proper allocation of work in staff
PERSONEL DEPARTMENT
Joining Report
Maintaining various records and statuary form
Handling of advance loan
Calculating monthly pay of employee and yearly perks
Maintaining ofifce schedule and policies
Personal, accident, insurance and related formalities
Handling communication system (telephone caller, fax, email and photocopy etc)
Fire system and first aid program
Attending Company’s guest
Personal guest attending system
Security and clearance system
10)General Store control
11)Handling Maintenance Department
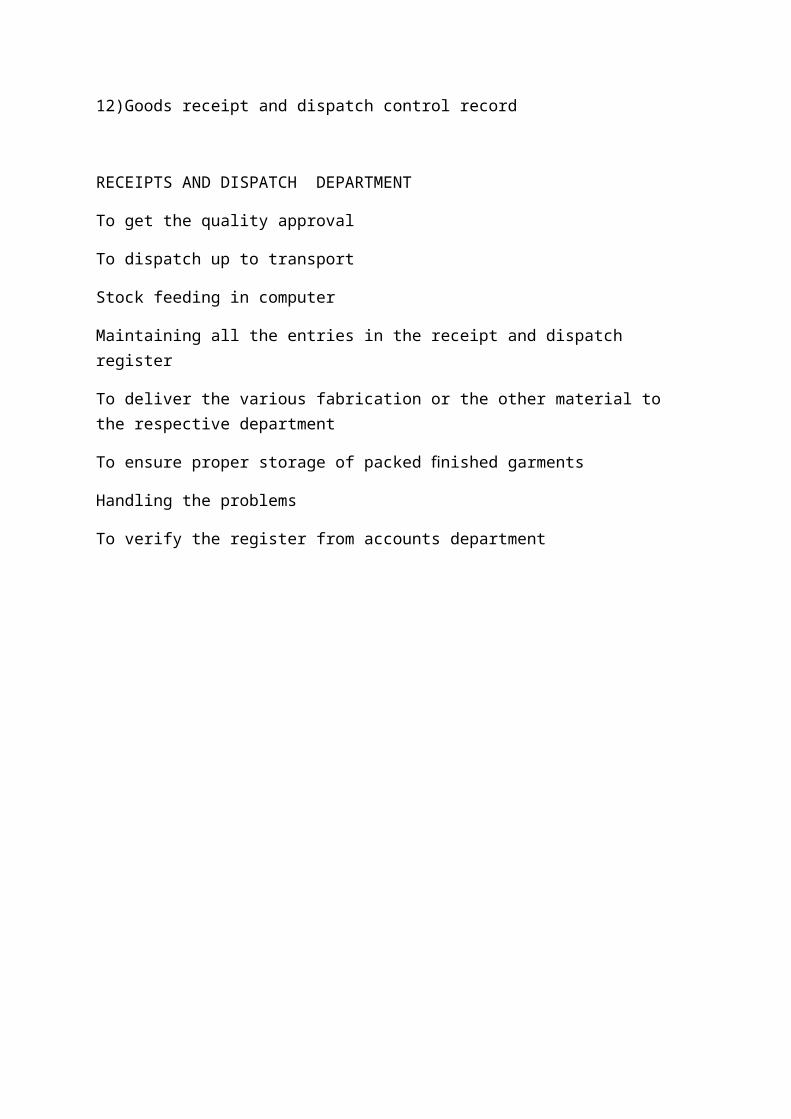
12)Goods receipt and dispatch control record
RECEIPTS AND DISPATCH DEPARTMENT
To get the quality approval
To dispatch up to transport
Stock feeding in computer
Maintaining all the entries in the receipt and dispatch register
To deliver the various fabrication or the other material to the respective department
To ensure proper storage of packed finished garments
Handling the problems
To verify the register from accounts department
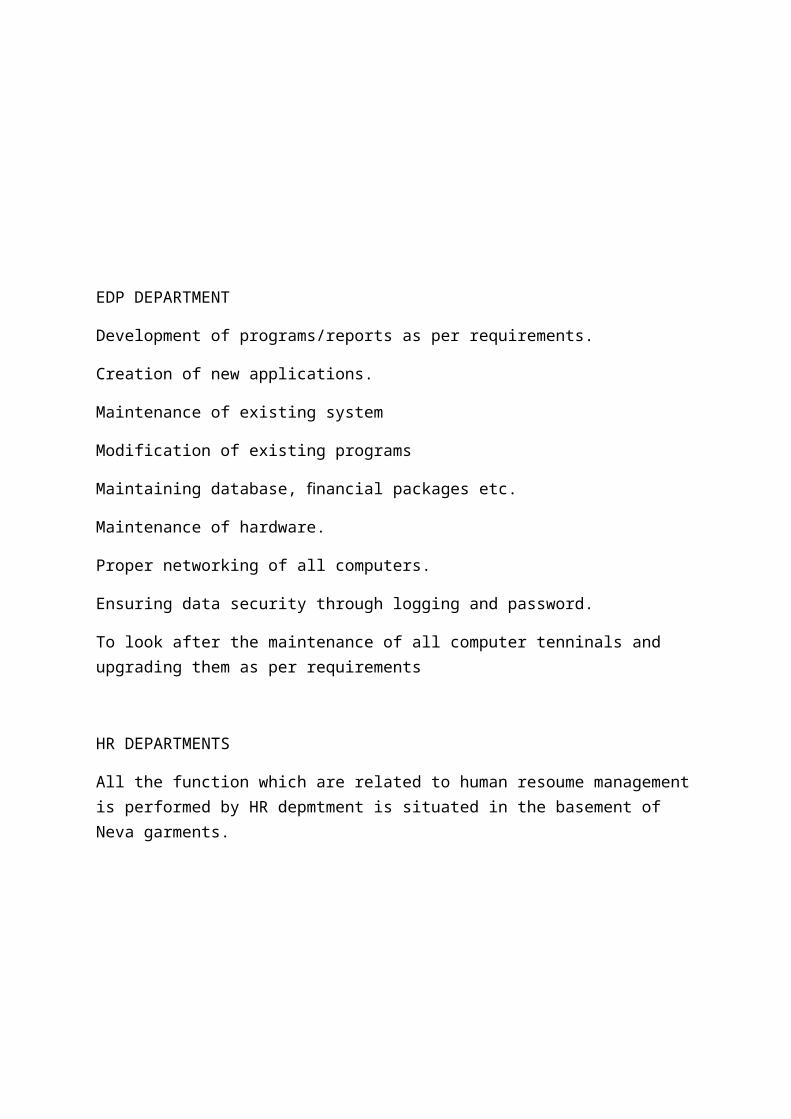
EDP DEPARTMENT
Development of programs/reports as per requirements.
Creation of new applications.
Maintenance of existing system
Modification of existing programs
Maintaining database, financial packages etc.
Maintenance of hardware.
Proper networking of all computers.
Ensuring data security through logging and password.
To look after the maintenance of all computer tenninals and upgrading them as per requirements
HR DEPARTMENTS
All the function which are related to human resoume management is performed by HR depmtment is situated in the basement of Neva garments.
ACCETABLE&ALTERATION
STORES OF NEVA G S
Accessories Store & Packing store Mr. Naveen Kumar
Finished Fabric Store Mr. Sunil Kumar
Finished Sample Store Mr.Ritesh Shanna
Finished Goods Store Mr. Sanjay Kumar
General Store Mr. Mahesh
Gray Fabric Store Mr. Inderjeet
Retail counter Mr.Dheeraj Sharma
Yarn store Mr. Inderjeet sh.
GENRAL STORE
In general store general items are stored like pencil, rubber, sharpener, file, computer accessories, fax papers, paper weight ,pads, various forms, A-4 sheets, envelopes, refills ,stapler, stamp, attendance register,circulars, calendars, soaps, towel, jugs, kitchenware’s, oil, fabricators. The material is issued to various departments by the process of an requisition form .the requisition form is a form which is filled by various departments for the fulfillment of need by them, in requisition form the quantity, item, date of issue,suppliers are written .the requisition form is signed by the departmental heads, then the form is pass on to the general department then the general store head issued the items or material to various departments morning to their need
PACKING AND ACESSORIES STORE
The head of accessories store is Mr.Naveen Kumar Sharma. in accessories store accessories like buttons, buckram, snap button, clips , packaging material , folders , Dabbi, trade box , elastics, labels are stored. The main suppliers of labels are golden art gallery Hoshiarpuncrafiax ,Delhi, screen art Bombay, Uni royal textiles ,Panchkula etc.the main suppliers of buttons are Kailas ribbon Delhi,Gurgaon.the suppliers of buckram are Chandra traders ,Ludhiana,suppliers of clips are Shubam enterprises ,Delhi. V
The supplier of packaging material, folders, Dabbi, trade boxes, is Jain pack wall, Ludhiana. They check the quotations of various vendors and the they find is most suitable in the sense good quality with reasonablerates are preferred by them. material afier cutting and before dispatch is stored in this store. There is a credit period of 60 days within which they have to clear all the payments to their supplier’s extra inventory of about one month bise stored in order to meet the future requirements. The material in accessories store is stored in accessories store in racks according to their articles for example the inventory for article Neva pep is stored differently and the material for article Neva quilt is stored differently.The head of general store is Mr. Mahesh and there is one helper in that store.
PACKING AND ACESSORIES STORE
The head of accessories store is Mr.Naveen Kumar Sharma. in accessories store accessories like buttons,buckram, snap button, clips , packaging material , folders , Dabbi, trade box , elastics, labels are stored. themain suppliers of labels are golden art gallery Hoshiarpuncrafiax ,Delhi, screen art Bombay, Uniroyal textiles ,Panchkula etc.the main suppliers of buttons are Kailas ribbon Delhi,Gurgaon.the suppliers of buckram are Chandra traders ,Ludhiana,suppliers of clips are Shubam enterprises ,Delhi.
The supplier of packaging material, folders, Dabbi, trade boxes, is Jain pack wall, Ludhiana. They check thequotations of various vendors and the they find is most suitable in the sense good quality with reasonablerates are preferred by them. material afier cutting and before dispatch is stored in this store. There is a creditperiod of 60 days within which they have to clear all the payments to their supplier’s extra inventory of about one month stock stored in order to meet the future requirements. The material in accessories store isstored in accessories store in racks according to their articles for example the inventory for article Neva pep is stored differently and the material for article Neva quilt is stored differently.
FABRIC STORE
In fabric department fabric after dying is stored according to the color, size and quantity in racks. The fabricis issued by the department according to the order or according to the requirement. There is about 65 tone of fabric placed there in that store.
1) The main I found in fabric department is that the fabric which is 2, 3 yrs old is still lying there in that store.
2) The helpers there in fabric department are only 5 6 class pass they are not properly able to understand the order or to find the requirement quantity and color of fabric, the head of that department helped the helpers in finding out the correct fabric to be issued.
DYEING STORE
The dying of materials in NEVA is done through DUKE. The grey fabric is sending for dying by the grey store for dying. For this purpose a Performa is there in which operations are to applied on the fabric are written the various operations include like silicon sofiening, enzyme wash, compaction . DYEING — Fabric is dyed as per the requirement and dried for further processing
CALENDERING— Calendar is a mechanical device consisting of two or more large rotating cylindrical rollers stacked on top of each other and usually heated. The cylindrical rollers are in contact with each other under presure. Fabric being calendared passes around and between these cylinders.
SIMPLE CALENDARING:— It consists of passing the fabric around and between the heated cylinders of the calaldar. It is, in effect, a mass production ironing or pressing of the fabric, removing all the wrinkles from the previous processes.
GLAZING CALENDARING: — It produces a highly glazed effect on one side of the fabric surface. The calendar machine used for this purpose is called friction calendar or chasing calendar. One cylinder of the calendar is made of highly polished steel. It rotates at a speed much higher than that of the fabric passing around and between the rollers, thus, literally polishing the fabric surface.
MERCEIZATION:- It involves treating the material while under tension with cold concentrated sodiumhydroxide solution. Both fabrics and the yarn are mercerized but the fiber cannot. This finish imparts luster to the cotton, increases its strength by nearly 25% and improves dye affinity producing brighter shades than unmarcerized cotton.
Shearing: — This process is used to cut off surface fibers on fabrics. It makes uniform the surface of the napped fibers. The plush or terry loops are subjected to shearing to get the velvet like product. A fabric shear, the high Speed machine which performs this operation has cutting action similar to a lawn mower. The blades are stationary and the fabric moves to the cutting blades.
Napping or raising — It is a mechanical finish in which woven or knitted fabrics are passed against rotating, bristled wire covered brushes. This action results in fibers actually being raised from the fabric. The overall effect is a fabric with raised fiber surface — also called rising.
KNIITING HALL
Two types of knitting processes are prevalent:
1. WARP KNITTING — Knitting takes place along the length of the fabric i.e. threads
Lengthwise
2. WEFT KNITTING - Knitting is width wise i.e. done on fiat and circular knitting machine. Mainly are extended used in hosiery fabric.
Ruth was further strengthened by placing regular ads in media outlets
CHALLENGES AHEAD
Our main task will be to maintain our lead in this highly competitive segment by continuously upgrading our products.
SOCIAL RESPONSIBILTY
At Neva the customer rules NEVA also feel that each personnel in the factory are an extension of the society and it is our duty to make him/her happy. Towards this we devise special programmers to upgrade the existing knowledge of the Workers. Besides, the HRD department is very active in the organization. It has been our endeavor to take up social issues and for this we participated in the of Say no to Shahtoosh with Thermal campaign.
QUALITY OF NEVA
The quality policy of the company shall lie toConsistently provide products and services that meet the requirement of the customers and tentatively advance the state — of —the —art of product and systems that meet the emerging expectations of the customers in the growing competitive environment.
Creativity through zero non-zero perfonnance and customer oriented education to the internal customers to load in the global maintenance
Business philosiphy of NEVA
1) Firm faith in customer delightedness through best quality product and services at affordable prices.
2) Steady business growth3) Believe in “Total Quality Management”
MEANING OF FINANCIAL ANALYSIS
Financial statement refers to such statement which contains financial information about an
enterprise. It report profitability and the financial position of the business at the end of the
Accounting period. The term financial statement includes at least two statements which the
accountant prepares at the end of accounting period. The two statements are:
The Balance Sheet
Profit And Loss Account
They provide some extremely useful information to the extent that balance Sheet mirrors the
financial position on a particular date in terms structure of assets, liabilities and owner equity,
and so on and the Profit and Loss account shows the result of operations during a certain
period of time in terms of revenues obtained and the cost incurred during the year. Thus the
financial statement provides a summarized view of financial position and operations of a
firm.
The first task of financial analysis is to select the information relevant to the decision under
consideration to total information contained in the financial statement. The second step is to
arrange the information in a way to highlight significant relationship. The final step is
interpretation and drawing of the interface and conclusions. Financial Statement is the
process of selection, relation and evaluation.
FEATURES OF FINANCIAL ANALYSIS
To present a complex data contained in the financial statement in simple and
understandable form.
To classify the items contained in the financial statement inconvenient and rational
groups.
To make comparison between various groups to draw various conclusions.
PURPOSE OF ANALYSIS OF FINANCIAL STATEMENTS
To know the earning capacity or profitability.
To know the solvency.
To know the financial strengths.
To know the capability of payment of interest and dividends.
To make comparative study with other firm.
To know the trend of the business.
To know the efficiency of the management.
To provide useful information to the management.
PROCEDURE OF FINANCIAL STATEMENT ANALYSIS
The following procedure is adopted for the analysis and interpretation of financial
Statements:-
The analyst should know the plans and policies of the managements that he may be
able to find out whether these plans are properly executed or not.
The extent of analysis should determine so that the sphere of work may be decided. If
the aim is find out, Earning capacity of the enterprise then analysis of income
statement will be undertaken. On the other hand, if financial position is to be studied
then balance sheet analysis will be necessary.
The financial data be given in statement should be recognized and rearranged. It will
involve grouping the similar data under some heads. Breaking down of individual
components of the statement according to nature. A relationship is established among
financial statements with the help of tools and techniques of analysis such as ratios,
trends, common size, and fund flow, etc.
The information is interpreted in a simple and understandable way. The significance
and utility of financial data is explained which help in decision making.
The conclusion drawn from the interpretation is presented to the management in the
form of the report.
Analyzing financial statement involves evaluating three characteristics of the company:
Its liquidity
Its profitability
Its insolvency.
A short-term creditor, such as a bank, is primarily interested in the liquidity. A long-term
creditor, such as a bondholder, however, looks to profitability and solvency measures that
indicate the company’s ability to survive over a long period of time
TOOLS OF FINANCIAL ANALYSIS
Various tools are used to evaluate the significance of financial statement data. Three
commonly used tools are these
Ratio Analysis
Fund Flow Analysis
Cash Flow Analysis
RATIO ANALYSIS
Meaning and Definition
The term 'ratio' refers to the mathematical relationship between any two inter-related
variables. In other words, it establishes relationship between two items expressed in
quantitative form.
According J. Batty, Ratio can be defined as "the term accounting ratio is used to
describe significant relationships which exist between figures shown in a balance sheet and
profit and loss account in a budgetary control system or any other part of the accounting
management."
Ratio can be used in the form of (1) percentage (20%) (2) Quotient (say 10) and (3)
Rates. In other words, it can be expressed as a to b; a: b (a is to b) or as a simple fraction,
integer and decimal. A ratio is calculated by dividing one item or figure by another item or
figure.
ADVANTAGES OF RATIO ANALYSIS
Ratio analysis is necessary to establish the relationship between two accounting
figures to highlight the significant information to the management or users who can analyse
the business situation and to monitor their performance in a meaningful way. The following
are the advantages of ratio analysis:
(1) It facilitates the accounting information to be summarized and simplified in a required
form.
(2) It highlights the inter-relationship between the facts and figures of various segments
of business.
(3) Ratio analysis helps to remove all type of wastages and inefficiencies.
(4) It provides necessary information to the management to take prompt decision relating
to business.
(5) It helps to the management for effectively discharge its functions such as planning,
organizing, controlling, directing and forecasting.
(6) Ratio analysis reveals profitable and unprofitable activities. Thus, the management is
able to concentrate on unprofitable activities and consider to improve the efficiency.
(7) Ratio analysis is used as a measuring rod for effective control of performance of
business activities.
(8) Ratios are an effective means of communication and informing about financial
soundness made by the business concern to the proprietors, investors, creditors and
other parties.
(9) Ratio analysis is an effective tool which is used for measuring the operating results of
the enterprises.
(10) It facilitates control over the operation as well as resources of the business.
(11) Effective co-operation can be achieved through ratio analysis.
(12) Ratio analysis provides all assistance to the management to fix responsibilities.
(13) Ratio analysis helps to determine the performance of liquidity, profitability and
solvency position of the business concern.
The term ―Ratio refers to the numerical and quantitative relationship between two
items or variables. This relationship can be exposed as
Percentages
Fractions
Proportion of numbers
Ratio analysis is defined as the systematic use of the ratio to interpret the financial
statements. So that the strengths and weaknesses of a firm, as well as its historical
performance and current financial condition can be determined Ratio reflects a quantitative
relationship helps to form a quantitative judgment.
STEPS IN RATIO ANALYSIS
The first task of the financial analysis is to select the information relevant to the
decision under consideration from the statements and calculates appropriate ratios.
To compare the calculated ratios with the ratios of the same firm relating to the past or
with the industry ratios. It facilitates in assessing success or failure of the firm.
Third step is to interpretation, drawing of inferences and report writing conclusions
are drawn after comparison in the shape of report or recommended courses of action.
BASIS OR STANDARDS OF COMPARISON
Ratios are relative figures reflecting the relation between variables. They enable
analyst to draw conclusions regarding financial operations. They use of ratios as a tool of
financial analysis involves the comparison with related facts. This is the basis of ratio
analysis. The basis of ratio analysis is of four types.
Past ratios, calculated from past financial statements of the firm.
Competitor’s ratio, of the sum most progressive and successful competitor firm at the
same point of time.
Industry ratio, the industry ratios to which the firm belongs to Projected ratios, ratios
of the future developed from the projected or pro forma financial statements.
NATURE OF RATIO ANALYSIS
Ratio analysis is a technique of analysis and interpretation of financial statements. It is
the process of establishing and interpreting various ratios for helping in making certain
decisions. It is only a means of understanding of financial strengths and weaknesses of a firm.
There are a number of ratios which can be calculated from the information given in the
financial statements, but the analyst has to select the appropriate data and calculate only a few
appropriate ratios. The following are the four steps involved in the ratio analysis.
Selection of relevant data from the financial statements depending upon the objective
of the analysis.
Calculation of appropriate ratios from the above data.
Comparison of the calculated ratios with the ratios of the same firm in the past, or the
ratios developed from projected financial statements or the ratios of some other firms
or the comparison with ratios of the industry to which the firm belongs.
INTERPRETATION OF THE RATIOS
The interpretation of ratios is an important factor. The inherent limitations of ratio
analysis should be kept in mind while interpreting them. The impact of factors such as price
level changes, change in accounting policies, window dressing etc., should also be kept in
mind when attempting to interpret ratios. The interpretation of ratios can be made in the
following ways.
Single absolute ratio
Group of ratios
Historical comparison
Projected ratios
Inter-firm comparison
GUIDELINES OR PRECAUTIONS FOR USE OF RATIOS
The calculation of ratios may not be a difficult task but their use is not easy.
Following guidelines or factors may be kept in mind while interpreting various ratios is
Accuracy of financial statements
Objective or purpose of analysis
Selection of ratios
Use of standards
Caliber of the analysis
IMPORTANCE OF RATIO ANALYSIS
Aid to measure general efficiency
Aid to measure financial solvency
Aid in forecasting and planning
Facilitate decision making
Aid in corrective action
Aid in intra-firm comparison
Act as a good communication
Evaluation of efficiency
Effective tool
LIMITATIONS OF RATIO ANALYSIS
Differences in definitions
Limitations of accounting records
Lack of proper standards
No allowances for price level changes
Changes in accounting procedures
Quantitative factors are ignored
Limited use of single ratio
Background is over looked
Limited use
Personal bias
CLASSIFICATIONS OF RATIOS
The use of ratio analysis is not confined to financial manager only. There are different
parties interested in the ratio analysis for knowing the financial position of a firm for different
purposes. Various accounting ratios can be classified as follows:
1. Traditional Classification
2. Functional Classification
3. Significance ratios
1. Traditional Classification
It includes the following.
Balance sheet (or) position statement ratio: They deal with the relationship
between two balance sheet items, e.g. the ratio of current assets to current liabilities
etc., both the items must, however, pertain to the same balance sheet.
Profit & loss account (or) revenue statement ratios: These ratios deal with the
relationship between two profit & loss account items, e.g. the ratio of gross profit to
sales etc.,
Composite (or) inter statement ratios: These ratios exhibit the relation between a
profit & loss account or income statement item and a balance sheet items, e.g. stock
turnover ratio, or the ratio of total assets to sales.
2. Functional Classification
These include liquidity ratios, long term solvency and leverage ratios, activity ratios
and profitability ratios.
3. Significance ratios
Some ratios are important than others and the firm may classify them as primary and
secondary ratios. The primary ratio is one, which is of the prime importance to a concern.
The other ratios that support the primary ratio are called secondary ratios.
IN THE VIEW OF FUNCTIONAL CLASSIFICATION THE RATIOS
ANALYSES ARE:
Liquidity ratio
Leverage ratio
Activity ratio
Profitability ratio
1. LIQUIDITY RATIOS
Liquidity refers to the ability of a concern to meet its current obligations as & when
there becomes due. The short term obligations of a firm can be met only when there are
sufficient liquid assets. The short term obligations are met by realizing amounts from current,
floating (or) circulating assets The current assets should either be calculated liquid (or) near
liquidity. They should be convertible into cash for paying obligations of short term nature.
The sufficiency (or) insufficiency of current assets should be assessed by comparing them
with short-term current liabilities. If current assets can pay off current liabilities, then
liquidity position will be satisfactory.
To measure the liquidity of a firm the following ratios can be calculated
Current ratio
Quick (or) Acid-test (or) Liquid ratio
Absolute liquid ratio (or) Cash position ratio
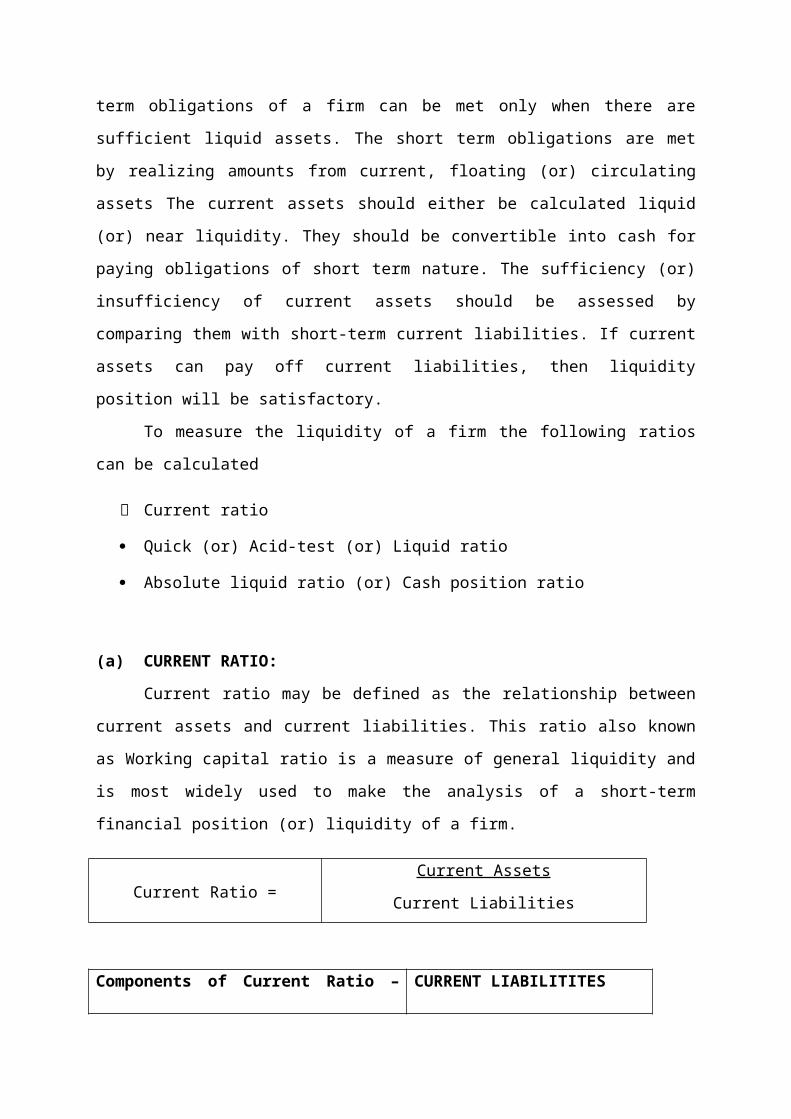
(a) CURRENT RATIO:
Current ratio may be defined as the relationship between current assets and current
liabilities. This ratio also known as Working capital ratio is a measure of general liquidity and
is most widely used to make the analysis of a short-term financial position (or) liquidity of a
firm.
Current Ratio =Current Assets
Current Liabilities
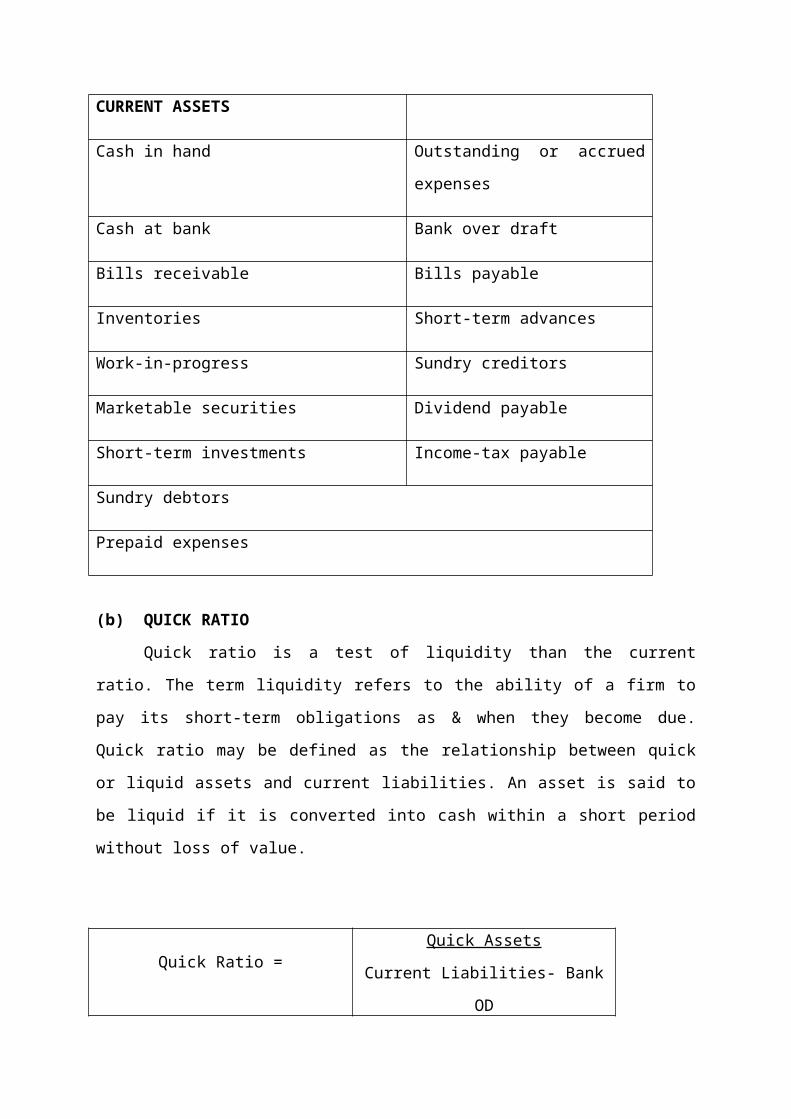
Components of Current Ratio – CURRENT
ASSETS
CURRENT LIABILITITES
Cash in hand Outstanding or accrued expenses
Cash at bank Bank over draft
Bills receivable Bills payable
Inventories Short-term advances
Work-in-progress Sundry creditors
Marketable securities Dividend payable
Short-term investments Income-tax payable
Sundry debtors
Prepaid expenses
(b) QUICK RATIO
Quick ratio is a test of liquidity than the current ratio. The term liquidity refers to the
ability of a firm to pay its short-term obligations as & when they become due. Quick ratio
may be defined as the relationship between quick or liquid assets and current liabilities. An
asset is said to be liquid if it is converted into cash within a short period without loss of value.
Quick Ratio =Quick Assets
Current Liabilities- Bank OD
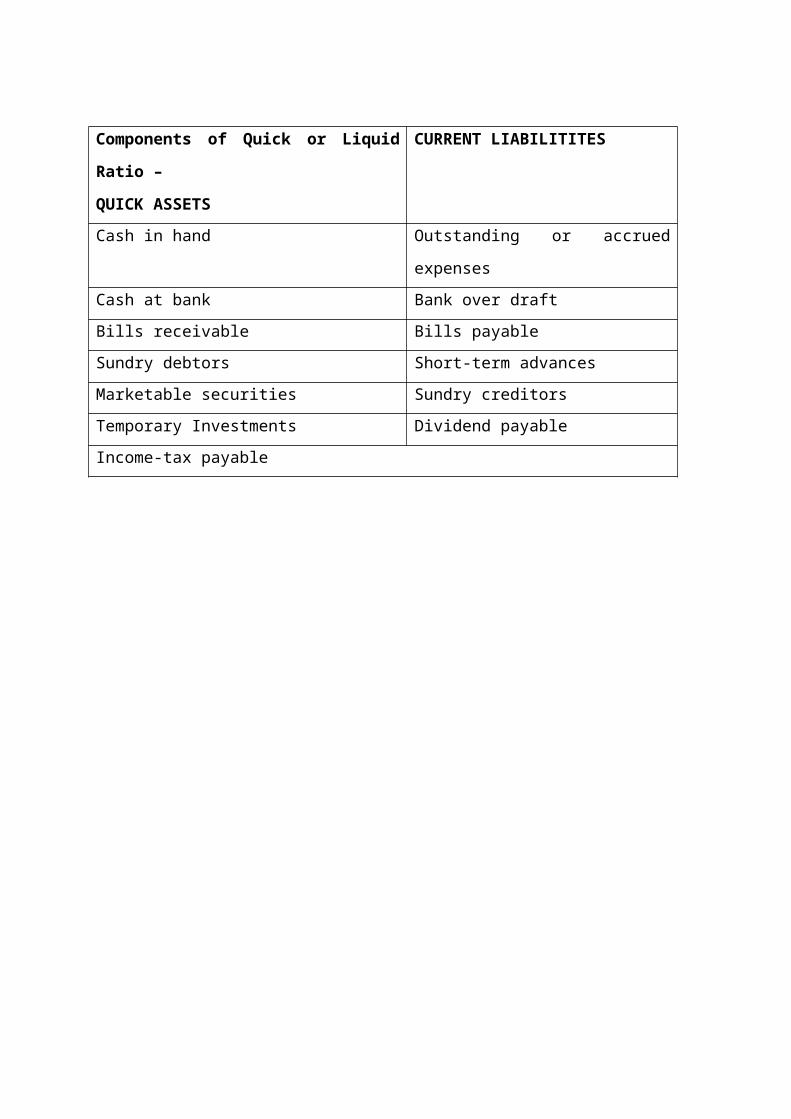
Components of Quick or Liquid Ratio –
QUICK ASSETS
CURRENT LIABILITITES
Cash in hand Outstanding or accrued expenses
Cash at bank Bank over draft
Bills receivable Bills payable
Sundry debtors Short-term advances
Marketable securities Sundry creditors
Temporary Investments Dividend payable
Income-tax payable

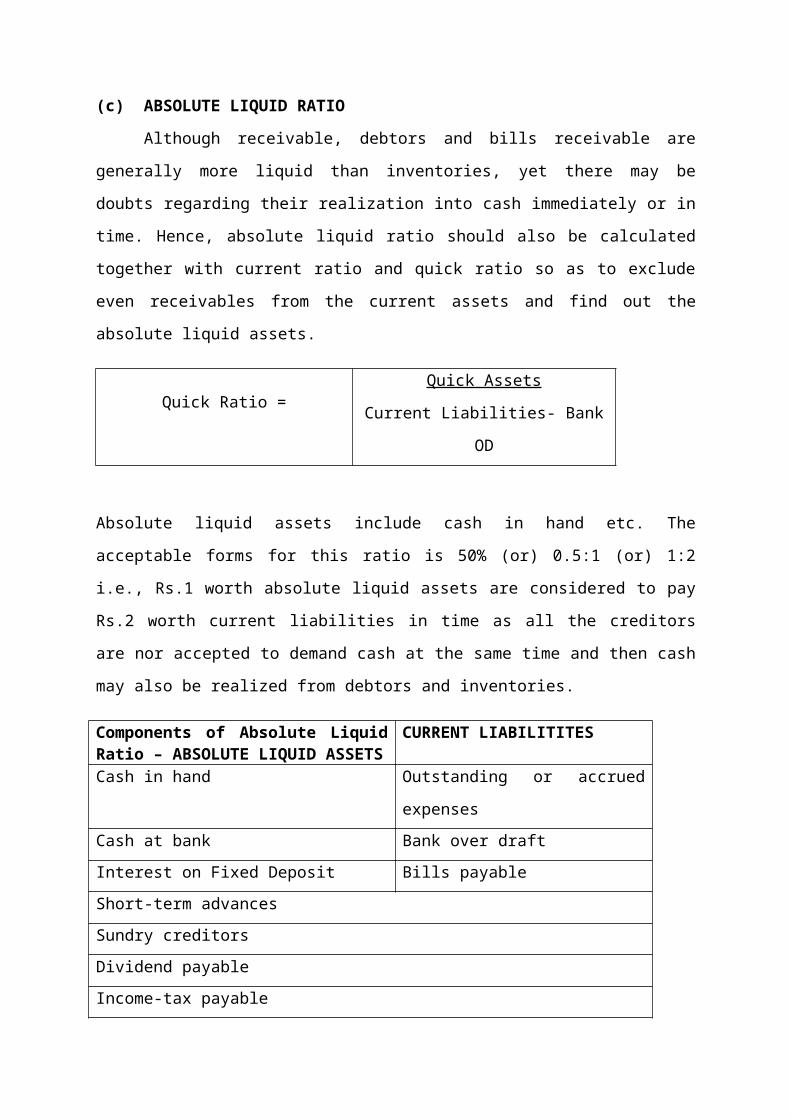
(c) ABSOLUTE LIQUID RATIO
Although receivable, debtors and bills receivable are generally more liquid than
inventories, yet there may be doubts regarding their realization into cash immediately or in
time. Hence, absolute liquid ratio should also be calculated together with current ratio and
quick ratio so as to exclude even receivables from the current assets and find out the absolute
liquid assets.
Quick Ratio =Quick Assets
Current Liabilities- Bank OD
Absolute liquid assets include cash in hand etc. The acceptable forms for this ratio is 50%
(or) 0.5:1 (or) 1:2 i.e., Rs.1 worth absolute liquid assets are considered to pay Rs.2 worth
current liabilities in time as all the creditors are nor accepted to demand cash at the same time
and then cash may also be realized from debtors and inventories.
Components of Absolute Liquid Ratio – ABSOLUTE LIQUID ASSETS
CURRENT LIABILITITES
Cash in hand Outstanding or accrued expenses
Cash at bank Bank over draft
Interest on Fixed Deposit Bills payable
Short-term advances
Sundry creditors
Dividend payable
Income-tax payable
2. LEVERAGE RATIOS
The leverage or solvency ratio refers to the ability of a concern to meet its long term
obligations. Accordingly, long term solvency ratios indicate firm’s ability to meet the fixed
interest and costs and repayment schedules associated with its long term borrowings.
The following ratio serves the purpose of determining the solvency of the concern.
(a) PROPRIETORY RATIO
A variant to the debt-equity ratio is the proprietary ratio which is also known as equity
ratio. This ratio establishes relationship between share holder’s funds to total assets of the
firm.
Proprietary ratio= Shareholders fundTotal Assets
Components of Proprietary Ratio – SHARE HOLDERS FUND
TOTAL ASSETS
Share Capital Fixed Assets
Reserves & Surplus Current Assets -
Cash in hand & at bank
Bills receivable
Inventories
Marketable securities
Short-term investments
Sundry debtors
Prepaid Expenses
3. ACTIVITY RATIOS
Funds are invested in various assets in business to make sales and earn profits. The
efficiency with which assets are managed directly affect the volume of sales. Activity ratios
measure the efficiency (or) effectiveness with which a firm manages its resources (or) assets.
These ratios are also called ―Turn over ratios’ because they indicate the speed with which
assets are converted or turned over into sales.
Working capital turnover ratio
Fixed assets turnover ratio
Capital turnover ratio
Current assets to fixed assets ratio
(a) WORKING CAPITAL TURNOVER RATIO
Working capital of a concern is directly related to sales.
Working capital = Current assets - Current liabilities
It indicates the velocity of the utilization of net working capital. This indicates the no.
of times the working capital is turned over in the course of a year. A higher ratio indicates
efficient utilization of working capital and a lower ratio indicates inefficient utilization.
Working capital turnover ratio=cost of goods sold/working Capital.
Components of Working Capital Ratio –
CURRENT ASSETS
CURRENT LIABILITITES
Cash in hand Outstanding or accrued expenses
Cash at bank Bank over draft
Bills receivable Bills payable
Inventories Short-term advances
Work-in-progress Sundry creditors
Marketable securities Dividend payable
Short-term investments Income-tax payable
Sundry debtors
Prepaid expenses
(b) FIXED ASSETS TURNOVER RATIO
It is also known as sales to fixed assets ratio. This ratio measures the efficiency and
profit earning capacity of the firm. Higher the ratio, greater is the intensive utilization of
fixed assets. Lower ratio means under-utilization of fixed assets.
Fixed assets turnover ratio =Cost of Sales
Net fixed assets
Cost of Sales = Income from Services
Net Fixed Assets = Fixed Assets – Depreciation
(c) CAPITAL TURNOVER RATIO -
Sometimes the efficiency and effectiveness of the operations are judged by comparing
the cost of sales or sales with amount of capital invested in the business and not with assets
held in the business, though in both cases the same result is expected. Capital invested in the
business may be classified as long-term and short-term capital or as fixed capital and working
capital or Owned Capital and Loaned Capital. All Capital Turnovers are calculated to study
the uses of various types of capital.
Capital turnover ratio =Cost of goods sold
Capital employed
(d) CURRENT ASSETS TO FIXED ASSETS RATIO -
This ratio differs from industry to industry. The increase in the ratio means that
trading is slack or mechanization has been used. A decline in the ratio means that debtors and
stocks are increased too much or fixed assets are more intensively used. If current assets
increase with the corresponding increase in profit, it will show that the business is expanding.
Current Assets to Fixed Assets Ratio =Current Assets
Fixed Assets
Component of Current Assets to Fixed Assets Ratio –
CURRENT ASSETS
FIXED ASSETS
Cash in hand Machinery
Cash at bank Buildings
Bills receivable Plant
Inventories Vehicles
Work-in-progress
Marketable securities
Short-term investments
Sundry debtors
Prepaid expenses

4. PROFITABILITY RATIOS -
The primary objectives of business undertaking are to earn profits. Because profit is
the engine, that drives the business enterprise.
Net profit ratio
Return on total assets
Reserves and surplus to capital ratio
Earnings per share
Operating profit ratio
Price – earnings ratio
(a) NET PROFIT RATIO -
Net profit ratio establishes a relationship between net profit (after tax) and sales and
indicates the efficiency of the management in manufacturing, selling administrative and other
activities of the firm.
Net profit ratio=Net profit after tax
Net sales
Net Profit after Tax = Net Profit (–) Depreciation (–) Interest (–) Income Tax
Net Sales = Income from Services
It also indicates the firm’s capacity to face adverse economic conditions such as price
competitors, low demand etc. Obviously higher the ratio, the better is the profitability.
(b) RETURN ON TOTAL ASSETS -
Profitability can be measured in terms of relationship between net profit and assets.
This ratio is also known as profit-to-assets ratio. It measures the profitability of investments.
The overall profitability can be known.
Return on assets =Net profit
Total assets
Net Profit = Earnings before Interest and Tax
Total Assets = Fixed Assets + Current Assets
(c) RESERVES AND SURPLUS TO CAPITAL RATIO -
It reveals the policy pursued by the company with regard to growth shares. A very
high ratio indicates a conservative dividend policy and increased ploughing back to profit.
Higher the ratio better will be the position.
Reserves & surplus to capital =Reserves & surplus
Capital
(d) EARNINGS PER SHARE -
Earnings per share is a small verification of return of equity and is calculated by
dividing the net profits earned by the company and those profits after taxes and preference
dividend by total no. of equity shares.
Earnings per share =Net profit after tax
Number of Equity shares
The Earnings per share is a good measure of profitability when compared with EPS of
similar other components (or) companies, it gives a view of the comparative earnings of a
firm.
(e) OPERATING PROFIT RATIO -
Operating ratio establishes the relationship between cost of goods sold and other
operating expenses on the one hand and the sales on the other.
Operating ratio =Operating cost
Net sales
However 75 to 85% may be considered to be a good ratio in case of a manufacturing
under taking. Operating profit ratio is calculated by dividing operating profit by sales.
Operating profit = Net sales - Operating cost
Operating Profit ratio =Operating Profit
Sales
(f) PRICE - EARNING RATIO
Price earnings ratio is the ratio between market price per equity share and earnings per
share. The ratio is calculated to make an estimate of appreciation in the value of a share of a
company and is widely used by investors to decide whether (or) not to buy shares in a
particular company. Generally, higher the price-earnings ratio, the better it is. If the price
earnings ratio falls, the management should look into the causes that have resulted into the
fall of the ratio.
Price – Earnings Ratio =Market Price per Share
Earnings per Share
Market Price per Share =Capital + Reserves & Surplus
Number of Equity Shares
Earnings per Share =Earnings before Interest and Tax
Number of Equity Shares
(g) RETURN ON INVESTMENTS
Return on share holder’s investment, popularly known as Return on investments (or)
return on share holders or proprietor’s funds is the relationship between net profit (after
interest and tax) and the proprietor’s funds.
Return on shareholder’s investment =Net profit (after interest and tax)
Shareholder’s funds
The ratio is generally calculated as percentages by multiplying the above with 100.
1. CURRENT RATIO
FORMULA:- CURRENT ASSETS /CURRENT LIABILITIES
YEAR 2011-2012 2012-2013 2013-2014
CURRENT ASSETS 51,61,96,211
59,56,74,362 66,62,31,469
CURRENT LIABILTIES 15,95,05,043
17,30,13,134 14,61,36,761
CURRENT RATIO 3.24 3.34 4.56
1. QUICK RATIO :
FORMULA :- QUICK ASSETS/CURRENT LIABILITIES
YEAR 2011-2012 2012-2013 2013-2014QUICK ASSETS 209924145 220257078 347317622
CURRENT LIABILTIES
15,95,05,043 17,30,13,134 14,61,36,761
QUICK RATIO 1.32 1.27 2.38
year 2011-12 year 2012-13 year 2013-140
0.5
1
1.5
2
2.5
Column1Column2Quick ratio
2. PROPRIETORY RATIOS :
FORMULA: - PROPRIETOR’S FUND/TOTAL ASSETS
OR
SHAREHOLDER’S FUND/FIXED ASSETS+CURENT ASSETS
YEAR 2011-2012 2012-2013 2013-2014PROPRIETORY FUND
202273115
TOTAL ASSETSPROPRIETORY RATIO