Subjective and objective quality assessment of audio ... · Subjective and objective quality...
30
HAL Id: inria-00485729 https://hal.inria.fr/inria-00485729v1 Submitted on 21 May 2010 (v1), last revised 23 Feb 2011 (v4) HAL is a multi-disciplinary open access archive for the deposit and dissemination of sci- entific research documents, whether they are pub- lished or not. The documents may come from teaching and research institutions in France or abroad, or from public or private research centers. L’archive ouverte pluridisciplinaire HAL, est destinée au dépôt et à la diffusion de documents scientifiques de niveau recherche, publiés ou non, émanant des établissements d’enseignement et de recherche français ou étrangers, des laboratoires publics ou privés. Subjective and objective quality assessment of audio source separation Valentin Emiya, Emmanuel Vincent, Niklas Harlander, Volker Hohmann To cite this version: Valentin Emiya, Emmanuel Vincent, Niklas Harlander, Volker Hohmann. Subjective and objective quality assessment of audio source separation. [Research Report] RR-7297, 2010, pp.29. inria- 00485729v1
Transcript of Subjective and objective quality assessment of audio ... · Subjective and objective quality...

HAL Id: inria-00485729https://hal.inria.fr/inria-00485729v1
Submitted on 21 May 2010 (v1), last revised 23 Feb 2011 (v4)
HAL is a multi-disciplinary open accessarchive for the deposit and dissemination of sci-entific research documents, whether they are pub-lished or not. The documents may come fromteaching and research institutions in France orabroad, or from public or private research centers.
L’archive ouverte pluridisciplinaire HAL, estdestinée au dépôt et à la diffusion de documentsscientifiques de niveau recherche, publiés ou non,émanant des établissements d’enseignement et derecherche français ou étrangers, des laboratoirespublics ou privés.
Subjective and objective quality assessment of audiosource separation
Valentin Emiya, Emmanuel Vincent, Niklas Harlander, Volker Hohmann
To cite this version:Valentin Emiya, Emmanuel Vincent, Niklas Harlander, Volker Hohmann. Subjective and objectivequality assessment of audio source separation. [Research Report] RR-7297, 2010, pp.29. �inria-00485729v1�

appor t
de r ech er ch e
ISS
N0
24
9-6
39
9IS
RN
INR
IA/R
R--
72
97
--F
R+
EN
G
Domaine Audio, Speech, and Language Processing
INSTITUT NATIONAL DE RECHERCHE EN INFORMATIQUE ET EN AUTOMATIQUE
Subjective and objective quality assessment of audio
source separation
Valentin Emiya — Emmanuel Vincent — Niklas Harlander — Volker Hohmann
N° 7297
May 21, 2010


Centre de recherche INRIA Rennes – Bretagne AtlantiqueIRISA, Campus universitaire de Beaulieu, 35042 Rennes Cedex
Téléphone : +33 2 99 84 71 00 — Télécopie : +33 2 99 84 71 71
Subje tive and obje tive quality assessment ofaudio sour e separationValentin Emiya , Emmanuel Vin ent , Niklas Harlander , VolkerHohmannDomaine :Équipe-Projet MetissRapport de re her he n° 7297 � May 21, 2010 � 26 pagesAbstra t: We aim to assess the per eived quality of estimated sour e signalsin the ontext of audio sour e separation. These signals may involve one ormore kinds of distortions, in luding distortion of the target sour e, interferen efrom the other sour es or musi al noise artifa ts. We propose a subje tive testproto ol to assess the per eived quality with respe t to ea h kind of distortionand olle t the s ores of 20 subje ts over 80 sounds. We then propose a familyof obje tive measures aiming to predi t these subje tive s ores based on thede omposition of the estimation error into several distortion omponents and onthe use of the PEMO-Q per eptual salien e measure. These measures in rease orrelation with subje tive s ores up to 0.5 ompared to nonlinear mapping ofindividual state-of-the-art sour e separation measures.Key-words: Sour e separation, audio, quality assessment, obje tive measure,subje tive test proto olV. Emiya and E. Vin ent are with INRIA, Centre Inria Rennes - Bretagne Atlantique,35042 Rennes Cedex, Fran e (e-mail: valentin.emiya�inria.fr; emmanuel.vin ent�inria.fr).N. Harlander and V. Hohmann are with Medizinis he Physik, Carl von Ossietzky-Universität Oldenburg, Oldenburg, Germany (e-mail: niklas.harlander�uni-oldenburg.de;volker.hohmann�uni-oldenburg.de).This work was supported by the Fren h Ministry of Foreign and European A�airs andthe German A ademi Ex hange Servi e under proje t Pro ope 20140NH, as well as by theGerman Federal Ministry of Edu ation and Resear h under proje t number 01EZ0741 �Model-based hearing systems�.

Evaluation subje tive et obje tive de la qualitépour la séparation de sour es audioRésumé : Cette étude porte sur la qualité per eptive des signaux des sour esestimés dans le adre de la séparation de sour es audio. Ces signaux peuventprésenter plusieurs types de distortions, notamment la distortion de la sour e ible, les interféren es liées aux autres sour es et les artefa ts de type bruitmusi al. Nous proposons un proto ole de test subje tif pour établir la qualitéliée à la per eption de haque type de distortion. L'évaluation de 80 sons par20 sujets a ainsi été réalisée. Nous proposons ensuite un ensemble de mesuresobje tives permettant de prédire es ritères de qualité via une dé omposition del'erreur d'estimation en plusieurs omposantes de distortion et via l'utilisationde la mesure de qualité per eptive PEMO-Q. Par rapport aux mesures de l'étatde l'art, la orrélation entre es mesures et les notes subje tives est meilleure,ave un gain pouvant atteindre 0, 5.Mots- lés : Séparation de sour es, audio, evaluation de la qualité, mesureobje tive, proto ole de test subje tif

Subje tive and obje tive quality assessment of audio sour e separation 31 Introdu tion and state of the artAudio sour e separation is the task of extra ting the signal of ea h sound sour efrom a mixture of on urrent sour es [1; 2℄. It underlies a wide range of appli a-tions from sour e enhan ement to ontent des ription and manipulation [3℄. Inthis arti le, we onsider appli ations where the estimated sour e signals are tobe listened to, su h as spee h or musi enhan ement for hearing aids, restorationof old musi re ordings, and voi e muting for karaoke. Separation performan ethen amounts to the subje tive judgment of listeners. We fo us on measuringand predi ting the audio quality per eived by normal-hearing listeners for anyinput data and do not assess spee h intelligibility or spee h trans ription, forwhi h spe i� metri s were proposed in [4; 5℄. One or more kinds of distortionsmay be per eived depending on the separation algorithm, in luding distortionof the target sour e, interferen e from the other sour es, and musi al noise orother artifa ts [6℄. Multi- riteria evaluation is therefore ne essary.A few studies have been performed to assess the subje tive quality of ertainsour e separation s hemes [7�14℄. Their impa t is however limited by the la k ofa dedi ated multi- riteria test proto ol. Firstly, most studies onsider either asingle riterion, su h as overall quality [7; 11; 12℄, preferen e [10, p. 138℄ or musi- al noise salien e [9℄, or a a set of riteria restri ted to spee h. Three su h riteria alled intelligibility, �delity and suppression were proposed in [8, p. 95℄, while[13℄ employs the standard ITU riteria for noise suppression [15℄, namely spee hsignal distortion, ba kground noise intrusiveness and overall quality. Se ondly,most studies onsider a single lass of algorithms produ ing spe i� kinds andlevels of distortion, e.g. Independent Component Analysis (ICA) in [10℄, time-frequen y masking in [7℄ or simulated separation in [13℄, and a narrow range ofsound material, e.g. male spee h in [11; 14℄ or isolated notes from a single mu-si al instrument in [12℄. The resulting s ores an hen e not be ompared due tothe la k of a ommon absolute referen e. Finally, some test proto ols are inap-propriate or insu� iently do umented. Pairwise omparison tests are employedin [12℄, while joint presentation is known to be preferable with large degrada-tions [16℄ su h as those en ountered in sour e separation. Also, the proto olsin [7�9℄ are not fully des ribed, e.g. in terms of sound normalization, soundpresentation or subje t training, so that they are not exa tly reprodu ible.In parallel to these subje tive studies, the obje tive evaluation of sour eseparation algorithms has also re eived some attention. The basi approa hto evaluating the quality of an estimated sour e signal is to ompute the Sig-nal to Distortion Ratio (SDR) between the energy of the referen e, i.e. the lean target signal, and that of the distortion [6℄. Two dire tions have beeninvestigated to derive additional obje tive measures. The �rst one onsists ofde omposing the distortion signal into several omponents [6℄, related to e.g.target distortion, interferen e, sensor noise and artifa ts, and deriving a spe- i� energy ratio from ea h of the distortion omponents [6; 17℄. These energyratios may further be ombined using linear or nonlinear mapping to in rease orrelation with subje tive ratings [12; 13℄. However, the distortion de ompo-sition algorithms proposed so far do not always yield the expe ted omponentsand one may question the ability of energy ratios to �t subje tive ratings sin eauditory phenomena su h as loudness weighting and spe tral masking are nottaken into a ount. A se ond dire tion is to use auditory-motivated metri s to ompare the target and the estimated sour e. Existing metri s designed for au-RR n° 7297

Subje tive and obje tive quality assessment of audio sour e separation 4dio oding or spee h enhan ement remain however limited to the assessment ofoverall quality [18�20℄ and appear to perform poorer than de omposition-basedmeasures in the ontext of sour e separation [12℄.This arti le provides the following ontributions for subje tive and obje tivequality assessment of audio sour e separation: a prin ipled multi- riteria sub-je tive test proto ol dedi ated to the evaluation of sour e separation (Se tion 2),a large database of 6400 subje tive s ores for a wide range of mixture signalsand sour e separation s hemes (Se tion 3), a family of auditory-motivated ob-je tive measures based on improved distortion de omposition (Se tion 4) and avalidation of the ability of these obje tive measures to predi t these subje tives ores (Se tion 5). The sound material, the subje tive data and the obje tivemeasures are released as a toolkit named PEASS (Se tion 6). We on lude inSe tion 7.2 Multi- riteria subje tive test proto olThe proposed subje tive test proto ol relies on the prin iple of multi- riteriaevaluation in a similar way as the ITU standard for the evaluation of noisesuppression algorithms [15℄. Based on previous work on the obje tive evaluationof sour e separation [6℄, we propose a set of three spe i� riteria besides overallquality whi h are dedi ated to sour e separation: preservation of the targetsour e, suppression of other sour es and absen e of additional arti� ial noise.We formulated these riteria for naive listeners so as to avoid referen e to expertterms su h as interferen e and artifa ts.2.1 Proto olWe propose four separate listening tests, in whi h the subje ts are asked toaddress the following four tasks respe tively:1. rate the global quality ompared to the referen e for ea h test signal;2. rate the quality in terms of preservation of the target sour e in ea h testsignal;3. rate the quality in terms of suppression of other sour es in ea h test signal;4. rate the quality in terms of absen e of additional arti� ial noise in ea htest signal.The tests are performed in the above order, with a break at the end of ea h test.Global quality is assessed �rst so as to redu e the in�uen e of the latter spe i� riteria and allow global quality ratings to possibly involve other subje tivefa tors.The MUltiple Stimuli with Hidden Referen e and An hor (MUSHRA) [16℄proto ol is employed for ea h test. This proto ol is appropriate here sin emedium and large impairments are en ountered [11℄. For a given mixture anda given target sour e within that mixture, the subje t is jointly presented withseveral test sounds in a random order, in luding the results of the sour e sepa-ration algorithms under test, the referen e lean target sour e and some an horsounds introdu ed below. The referen e and the mixture are also available forRR n° 7297

Subje tive and obje tive quality assessment of audio sour e separation 5
(a) Training interfa e
(b) Grading interfa eFigure 1: S reenshots of the subje tive test interfa es for the training and grad-ing phases of task 1. The referen e is not in luded in the test sounds of thetraining phase. omparison. The loudness of the referen e is assumed to be �xed for all mix-tures. The other test sounds may be normalized to the same loudness or not,depending on whether erroneous s aling is onsidered as a distortion or not [6℄.A training phase is �rst ondu ted where the subje t listens to all soundsof all mixtures (see Fig. 1(a)). This aims to train the subje t to address therequired task, to learn the range of observed quality a ording to that task andto �x the volume of the headphones to a omfortable level. A grading phaseis then performed for ea h mixture and target sour e where the subje t ratesthe quality of ea h test sound ompared to the referen e on a s ale from 0 to100, where higher ratings indi ate better quality (see Fig. 1(b)). Sounds maybe listened to as many times as desired. The subje t should make sure that theratings are onsistent a ross mixtures (i.e. if one sound has better quality thanRR n° 7297

Subje tive and obje tive quality assessment of audio sour e separation 6another, it should be rated higher) and that the whole rating s ale is used (i.e.sounds with perfe t quality should be rated 100 and the worst test sound overall mixtures should be rated 0).The guidelines of the test are presented as a unique written do ument forall subje ts in order to avoid any in�uen e from the supervisor of the test.2.2 An hor soundsAn essential aspe t of the MUSHRA proto ol is the use of an hor sounds, i.e.arti� ial sounds presenting large impairments of the same kind as those gener-ated by a tual systems [16℄. Pre isely de�ned an hors a t as absolute qualitylevels and allow the omparison of ratings obtained in di�erent listening ondi-tions or for di�erent test sounds. In the ontext of audio oding, several an horsreprodu ing the distortions generated by audio oders were proposed in [16; 21℄.An hors for the evaluation of sour e separation were also introdu ed in [11℄. Wepropose a new set of an hors inspired from [11℄ whi h better �t the target distor-tions and the artifa ts produ ed by a tual systems. Ea h an hor is asso iatedwith one of the three aforementioned kinds of distortion.• The distorted target an hor is reated by low-pass �ltering the targetsour e signal to a 3.5 kHz ut-o� frequen y and by randomly setting 20% ofthe remaining time-frequen y oe� ients to zero.• The interferen e an hor is de�ned as the sum of the target sour e signaland an interfering signal. The latter is obtained by summing all interferingsour es and by adjusting the loudness of the resulting signal to that of thetarget.• The artifa ts an hor is de�ned as the sum of the target sour e signaland an artifa t signal. The latter is reated by randomly setting 99% ofthe time-frequen y oe� ients of the target to zero and by adjusting theloudness of the resulting signal to that of the target.Fixed hoi e of the time-frequen y transform and the loudness measure is neededfor reprodu ibility. We onsider the short time Fourier transform (STFT) withhalf-overlapping 46 ms sine windows (i.e. the square root of a Hann window)and the ISO 532B loudness measure [22℄ be ause of its availability as free Matlabsoftware1.3 Database of subje tive s oresWe olle ted a set of 6400 subje tive s ores by implementing the above proto olvia a dedi ated interfa e. This interfa e is available together with the testsounds, the an hor sounds and the resulting s ores within the PEASS toolkit(see Se tion 6).1http://www.auditory.org/mhonar /2000/zip00001.zip
RR n° 7297

Subje tive and obje tive quality assessment of audio sour e separation 73.1 Test material and subje ts3.1.1 Test materialWe sele ted 8 stereo mixtures and 2 4- hannel mixtures of 5 s duration from var-ious datasets of the 2008 Signal Separation Evaluation Campaign (SiSEC) [23℄.The target to be estimated was either the stereo spatial image of one sour e inthe former ase or one original single- hannel sour e in the latter ase [23℄. Thesemixtures were hosen so as to over a wide range of sour e separation settingsas shown in Table 1: two or more sour es; instantaneous, ane hoi , onvolutiveor professionally-produ ed mixtures; male spee h, female spee h, singing voi e,pit hed musi al instrument or drums as the target sour e. For ea h mixture,the 8 test sounds onsisted of four sounds generated by a tual sour e separa-tion algorithms, the referen e and the three an hor sounds. All referen es wereset to the same loudness using the ISO 532B standard. The sounds from a tualsour e separation s hemes were obtained by 13 di�erent algorithms as des ribedin [23℄. From one mixture to another, di�erent algorithms were hosen in orderto favor a wide range of distortions and state-of-the-art separation methods.3.1.2 Subje ts23 normal-hearing subje ts (ex luding the authors) parti ipated in the test, in- luding 13 in Rennes, Fran e, and 10 in Oldenburg, Germany. All subje tswere experts in general audio appli ations. They used the same AKG 271 head-phones and performed the test in di�erent o� es, in a quiet environment. Theguidelines were written in English.# Mixture Type Target Interferen es1 Convolutive Spee h Male Male, female2 Convolutive Spee h Female Male3 Ane hoi Spee h 2 males Male & femalesu essively su essivelyProfessional Musi Male 2 guitars,4 mix (ro k) singer 2 keyboards,bass, drums5 Instantaneous Musi Piano Male singer,(pop) bass6 Instantaneous Musi Ele tri A ousti (pop) guitar guitar, bass7 Convolutive Spee h Male Female8 Professional Musi Female A ousti mix (bossa nova) singer guitar9 Convolutive Spee h Male 2 males10 Convolutive Musi Drums Female singer,(ro k) ele tri guitarTable 1: Mixing onditions, type of sounds and nature of the target and inter-fering sour es for ea h of the ten test mixtures.RR n° 7297

Subje tive and obje tive quality assessment of audio sour e separation 83.2 Statisti al analysis of the results3.2.1 Dete tion of outlier subje tsA post-s reening was applied so as to dis ard outlier subje ts that may havemisunderstood the guidelines. This post-s reening was performed on the s oresrelated to the hidden referen e and the an hor sounds for all mixtures only.Indeed, a onsensus among subje ts is expe ted over these sounds sin e theyinvolve either no distortion or a single kind of distortion. By ontrast, sub-je ts may have individual rating strategies over the remaining sounds involvingmultiple distortions due their individual per eptual weighting of ea h kind ofdistortion.We used the multivariate Mahalanobis distan e-based outlier dete tion te h-nique in [24℄. The set of subje tive s ores of subje t m is onsidered as a ve torym. Let us denote by d2
m = (ym−µy)Σ−1
y(ym−µ
y)T the squared Mahalanobisdistan e between ym and the empiri al data mean µ
y, Σy being the empiri aldata ovarian e. The distan es dm are assumed to be distributed a ording toa χ2 law [24℄. Hen e, by mat hing the empiri al and theoreti al umulativedistributions, outliers are obtained as points of the empiri al distribution abovethe 0.975 quantile of the theoreti al χ2 distribution [24℄. In the urrent ase,
3 outliers were dete ted among the 23 subje ts and removed for subsequent useof the subje tive s ores.3.2.2 E�e t of lo ationTo substantiate on�den e in the results, an analysis of varian e (ANOVA) wasperformed regarding the subje t lo ation (Oldenburg vs. Rennes). We usedSPSS Statisti s 12.02 with a signi� an e level of α = 0.05. The two lo ationswere a �between� fa tor while the four tasks and the 10 mixtures were �within�fa tors. We obtained highly signi� ant e�e ts of tasks (η2 = 0.837) and mixtures(η2 = 0.567), with all p < 0.05 and orre ted F-values from 92.3 to 23.6. Nosigni� ant e�e t of lo ations was dete ted (F (1, 18) < 1, p = 0.597, η2 = 0.01).As a result, lo ation did not have a signi� ant in�uen e on the subje tive s ores.3.2.3 Statisti al analysis for hidden referen es and an horsA separate statisti al analysis of the subje tive ratings is provided for the setof hidden referen es and an hors and for the set of sounds from a tual sour eseparation s hemes. The statisti al analysis related to the hidden referen es andan hor sounds is presented in Fig. 2. It shows that for ea h task, the hiddenreferen es were s ored around 100, as expe ted, with a very narrow on�den einterval (less than 1). The on�den e intervals related to an hor sounds arewider, with half-widths from ±1.4 to ±12.6.The mean values in Fig. 2 indi ate that all an hors have low s ores for task1 (global quality), as expe ted. For tasks 2 to 4, the an hor related to the onsidered task has a low s ore while the other ones have high s ores, ex eptfor the distorted target an hor in task 4. Indeed, the distorted target an horpresents large distortions whi h do sound as arti� ial noise. Conversely, theartifa ts an hor does not have a low s ore in task 2 sin e artifa ts do not soundas target distortion. Thus, we see that the three an hors involve independent2http://www.spss. om/software/statisti s/advan ed-statisti s/RR n° 7297

Subje tive and obje tive quality assessment of audio sour e separation 9
Ref Target Interf. Artif.0
50
100
Subj. s
core
Task 1 − Global quality
Ref Target Interf. Artif.0
50
100
Subj. s
core
Task 2 − Target preservation
Ref Target Interf. Artif.0
50
100
Subj. s
core
Hidden Ref. and Anchors
Task 3 − Other source suppression
Ref Target Interf. Artif.0
50
100S
ubj. s
core
Hidden Ref. and Anchors
Task 4 − Additional artificial noise
Figure 2: Mean and 95% on�den e intervals of the subje tive s ores for thehidden referen es and the three an hor sounds (ab issa) for ea h of the fourtasks (sub�gures).distortions to some extent only. Future investigations may be needed to identifythe kinds of target distortions that are subje tively orrelated with the targetand design more independent an hors.3.2.4 Statisti al analysis for test sounds produ ed by separations hemesThe on�den e intervals related to the sounds from a tual sour e separationalgorithms are summarized in Table 2. All half-widths are lower than 15, whi his satisfying given the width of the grading s ale and of the same order as in [11�14℄. Note that narrower on�den e intervals were obtained for tasks 1 (globalquality) and 3 (suppression of other sour es), whi h indi ates a slightly higheragreement of the subje ts on these tasks than on tasks 2 and 4.4 Multi- riteria obje tive measuresWe now design a family of four obje tive measures aiming to predi t the sub-je tive s ores of the above test. The proposed approa h onsists of splitting thedistortion signal into a sum of omponents related to target distortion, inter-feren e and artifa ts, and in assessing their per eptual salien e using auditory-motivated metri s and nonlinear mappings. The distortion omponents are ex-RR n° 7297

Subje tive and obje tive quality assessment of audio sour e separation 10Tasks Min. Average MaxTask 1: Global s ore ±2.8 ±6.5 ±9.0Task 2: Target preservation ±2.9 ±8.1 ±12.9Task 3: Other sour e suppression ±2.4 ±6.5 ±9.7Task 4: Additional arti� ial noise ±5.0 ±9.5 ±13.3Table 2: Minimum, average and maximum width of the 95% on�den e intervals(in grading points) over the subje tive s ores of the sour es estimated by a tualsour e separation algorithms.tra ted using a new approa h des ribed in Se tion 4.1 and validated in Se tion4.2, while the derived measures are detailed in Se tion 4.3.In the following, we onsider a mixture with I hannels and J sour es indexedby i and j respe tively. The spatial image of sour e j sampled at time t, i.e. its ontribution to ea h mixture hannel i, is denoted by sij(t). We assume thatthe true spatial images of all sour es are known. For a given target sour e j, weevaluate the quality of sour e spatial image estimation [23℄ by omparing themulti hannel spatial image sij(t) estimated by some sour e separation algorithmto the target sij(t). The following derivations an be applied in a straightforwardway to the problem of sour e signal estimation [23℄ by repla ing these signals bythe estimated and target single- hannel sour e signals sj(t) and sj(t) instead.4.1 Distortion omponent model and estimationFollowing [17℄, we split the distortion between the estimate sij(t) and the targetsij(t) into the sum of a target distortion omponent etargetij (t), an interferen e omponent einterfij (t) and an artifa ts omponent eartifij (t) su h that3
sij(t) − sij(t) = etargetij (t) + einterfij (t) + eartifij (t). (1)In order to perform this de omposition, one must spe ify how the target dis-tortion and interferen e omponents relate to the true sour e signals. One ap-proa h [17℄ is to assume that these omponents are linearly distorted versionsof the true sour e signals, where distortion is modeled via multi hannel time-invariant Finite Impulse Response (FIR) �lters. The algorithm in [17℄ omputesthe oe� ients of these �lters by two nested least-square proje tions: �rst, thedistortion signal is proje ted onto the subspa e spanned by delayed versions ofall sour e signals skl(t− τ), 1 ≤ k ≤ I, 1 ≤ l ≤ J , 0 ≤ τ ≤ L−1, so as to obtainetargetij (t)+einterfij (t); then it is further proje ted on the smaller subspa e spannedby delayed versions of the target signal skj(t− τ), 1 ≤ k ≤ I, 0 ≤ τ ≤ L− 1, soas to obtain etargetij (t) alone; �nally, eartifij (t) is de�ned as the residual. The �lterlength L is typi ally set to 32 ms [17℄.Despite their use in several evaluation ampaigns [17; 23; 25℄, the resultingdistortion omponents do not always �t those per eived by human listeners.This an be he ked by listening to the audio examples a ompanying [6℄ orthe urrent arti le (see Se tion 6). For instan e, one an often hear the originalsour es when listening to the artifa ts omponent. This is due in parti ular3An additional residual noise omponent may be de�ned when onsidering noisy mix-tures [6℄.RR n° 7297

Subje tive and obje tive quality assessment of audio sour e separation 11to the time-invariant model whi h does not �t the time-varying nature of theen ountered distortions and to the onstant frequen y resolution of the FIR�lter whi h does not mat h that of the ear. A time-varying de omposition wasproposed in [6℄. However, due to its large omputational ost, it was restri ted inpra ti e to �lters with both low frequen y resolution and low time resolution [6℄and onsequently did not improve the results. Another issue is that the targetdistortion omponent may be nonzero even when the target is not distorted.Indeed, due to the nested proje tion algorithm, the target distortion omponentin ludes part of the target sour e signal sij(t) in addition to the interferingsour e signals sil(t), l 6= j, as soon as these signals are orrelated.The proposed de omposition algorithm aims to �x these issues and outputmore per eptually relevant distortion omponents by approximating the audi-tory time-frequen y resolution. As illustrated in Fig. 3, it involves three su es-sive steps: �rsly, all signals are partitioned into time- and frequen y-lo alizedsignals via a gammatone �lterbank [26℄ followed by downsampling and window-ing; se ondly, a time-invariant FIR-based de omposition is performed in ea hsubband and ea h time frame by joint least-squares proje tion; �nally, time-domain signals are re onstru ted via overlap-and-add (OLA) and �lterbankinversion. Besides its desirable auditory-motivated properties, the �lterbankmakes it possible to de rease the �lter length and hen e the omputational ostof ea h de omposition. We now des ribe the details of ea h step.
Figure 3: Blo k diagram of the proposed algorithm for the de omposition of anestimated sour e into the sum of the target sour e and three distortion ompo-nents orresponding to target distortion, interferen e and artifa ts.RR n° 7297
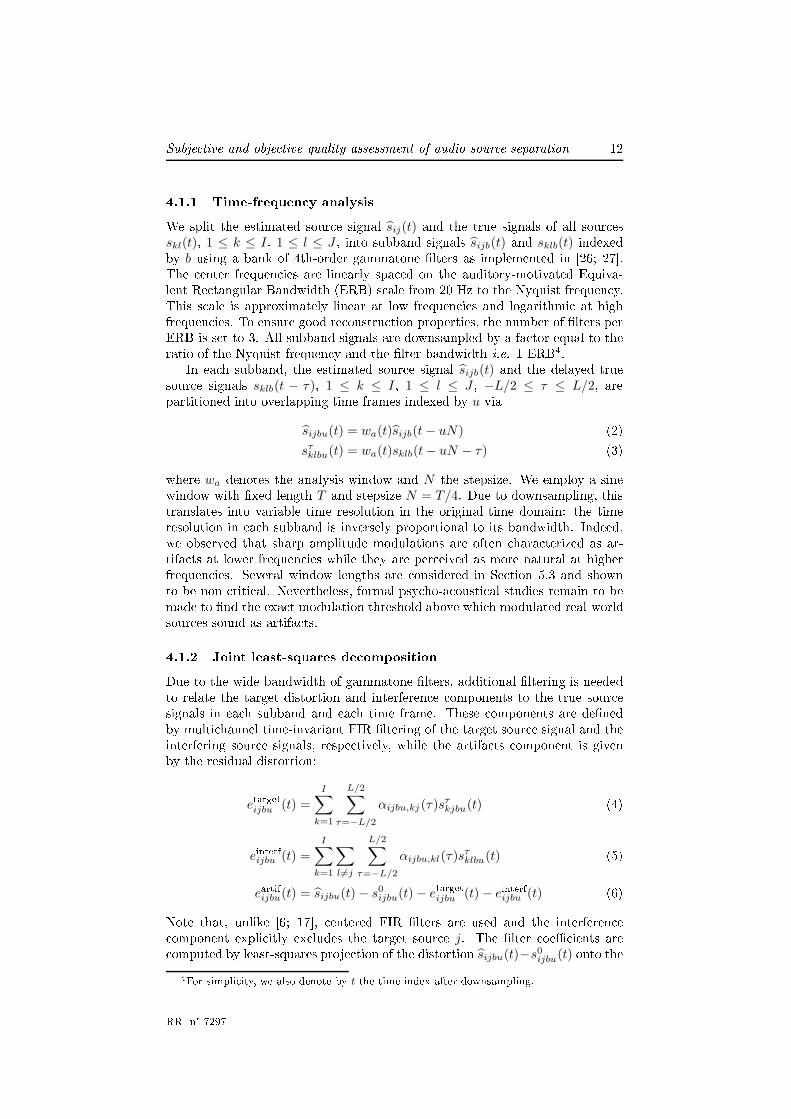
Subje tive and obje tive quality assessment of audio sour e separation 124.1.1 Time-frequen y analysisWe split the estimated sour e signal sij(t) and the true signals of all sour esskl(t), 1 ≤ k ≤ I, 1 ≤ l ≤ J , into subband signals sijb(t) and sklb(t) indexedby b using a bank of 4th-order gammatone �lters as implemented in [26; 27℄.The enter frequen ies are linearly spa ed on the auditory-motivated Equiva-lent Re tangular Bandwidth (ERB) s ale from 20 Hz to the Nyquist frequen y.This s ale is approximately linear at low frequen ies and logarithmi at highfrequen ies. To ensure good re onstru tion properties, the number of �lters perERB is set to 3. All subband signals are downsampled by a fa tor equal to theratio of the Nyquist frequen y and the �lter bandwidth i.e. 1 ERB4.In ea h subband, the estimated sour e signal sijb(t) and the delayed truesour e signals sklb(t − τ), 1 ≤ k ≤ I, 1 ≤ l ≤ J , −L/2 ≤ τ ≤ L/2, arepartitioned into overlapping time frames indexed by u via
sijbu(t) = wa(t)sijb(t − uN) (2)sτ
klbu(t) = wa(t)sklb(t − uN − τ) (3)where wa denotes the analysis window and N the stepsize. We employ a sinewindow with �xed length T and stepsize N = T/4. Due to downsampling, thistranslates into variable time resolution in the original time domain: the timeresolution in ea h subband is inversely proportional to its bandwidth. Indeed,we observed that sharp amplitude modulations are often hara terized as ar-tifa ts at lower frequen ies while they are per eived as more natural at higherfrequen ies. Several window lengths are onsidered in Se tion 5.3 and shownto be non riti al. Nevertheless, formal psy ho-a ousti al studies remain to bemade to �nd the exa t modulation threshold above whi h modulated real-worldsour es sound as artifa ts.4.1.2 Joint least-squares de ompositionDue to the wide bandwidth of gammatone �lters, additional �ltering is neededto relate the target distortion and interferen e omponents to the true sour esignals in ea h subband and ea h time frame. These omponents are de�nedby multi hannel time-invariant FIR �ltering of the target sour e signal and theinterfering sour e signals, respe tively, while the artifa ts omponent is givenby the residual distortion:etargetijbu (t) =
I∑
k=1
L/2∑
τ=−L/2
αijbu,kj(τ)sτkjbu(t) (4)
einterfijbu (t) =
I∑
k=1
∑
l 6=j
L/2∑
τ=−L/2
αijbu,kl(τ)sτklbu(t) (5)
eartifijbu(t) = sijbu(t) − s0ijbu(t) − etargetijbu (t) − einterfijbu (t) (6)Note that, unlike [6; 17℄, entered FIR �lters are used and the interferen e omponent expli itly ex ludes the target sour e j. The �lter oe� ients are omputed by least-squares proje tion of the distortion sijbu(t)−s0
ijbu(t) onto the4For simpli ity, we also denote by t the time index after downsampling.RR n° 7297

Subje tive and obje tive quality assessment of audio sour e separation 13subspa e spanned by the delayed sour e signals sτklbu(t), 1 ≤ k ≤ I, 1 ≤ l ≤ J ,
−L/2 ≤ τ ≤ L/2. Classi ally, the optimal (L + 1)IJ × 1 ve tor of oe� ientsis given by αijbu = S+bu(sijbu − sijbu) where sijbu and sijbu are respe tively theestimated and true T×1 ve tors of target sour e samples, Sbu is the T×(L+1)IJmatrix of delayed true sour e samples and + denotes matrix pseudo-inversion.The �lter length L is set to a onstant. Various lengths are onsidered inSe tion 5.3. Again, due to downsampling, this translates into variable auditory-motivated frequen y resolution in the original time domain.4.1.3 Time-domain resynthesisFull-duration distortion omponents are re onstru ted from the time-lo alized omponents in ea h subband using OLA
etargetijb (t) =∑
u
ws(t − uN)etargetijbu (t − uN) (7)einterfijb (t) =
∑
u
ws(t − uN)einterfijbu (t − uN) (8)eartifijb (t) =
∑
u
ws(t − uN)eartifijbu(t − uN) (9)where ws is a sine synthesis window of length T su h that ∑u ws(t−uN)wa(t−
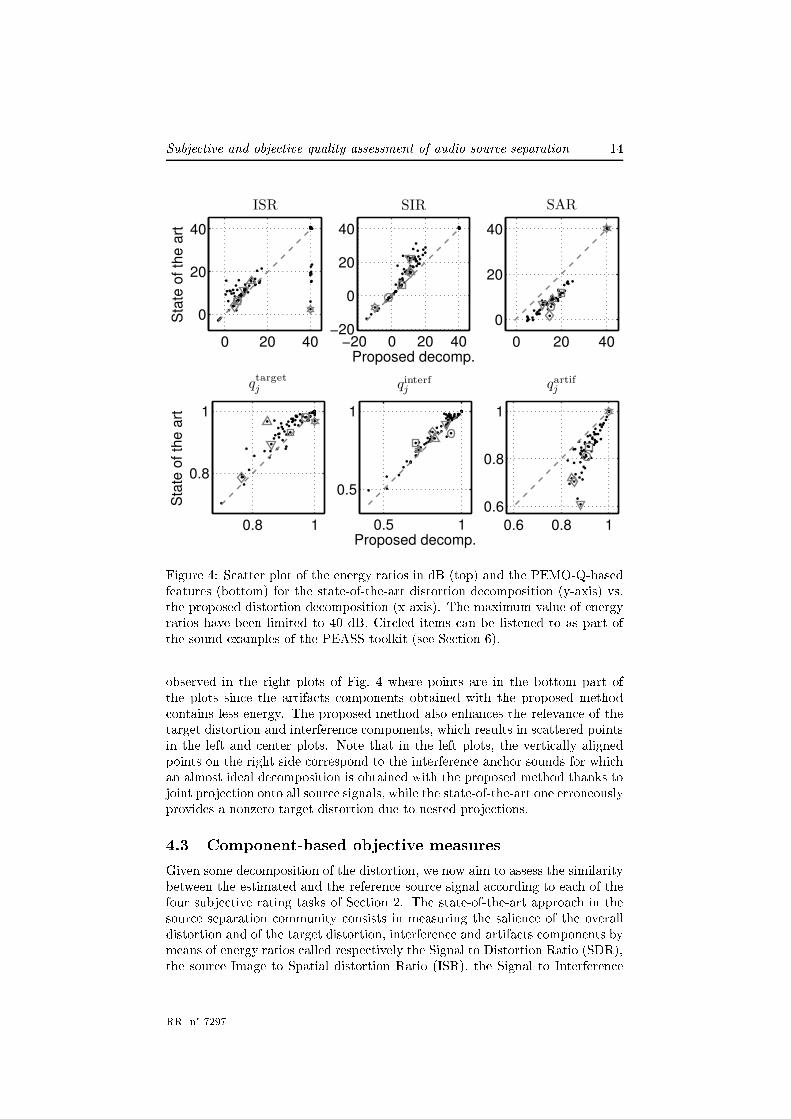
uN) = 1. Finally, the fullband distortion omponents etargetij (t), einterfij (t) andeartifij (t) are obtained using the synthesis �lters [26℄ asso iated with the gam-matone �lterbank. In order to a ount for inaudible but measurable distortiondue to �lterbank inversion, the fullband estimated and true target signals sij(t)and sij(t) are also re onstru ted from their subbands sijb(t) and sijb(t). Thesere onstru ted versions are used in pla e of the original signals from now on.4.2 Evaluation of the signal de ompositionAn obje tive evaluation of the distortion de omposition is not obvious to designsin e referen e signals for the distortion omponents are not available. Moreover,the reation of syntheti referen e signals is not possible sin e it would implysome redu tive a priori on the distortions, e.g. on the hoi e of time andfrequen y resolution or on the de�nition of artifa ts. In order to validate theproposed method, the salien e of the distortion omponents obtained via thestate-of-the-art [17℄ and the proposed de omposition are ompared in Fig. 4over the data of Se tion 3. Two series of s atter plots are shown depending onthe salien e riteria de�ned hereafter in Se tion 4.3: either the energy ratiosgiven by (11), (12) and (13) or the features qtargetj , qinterfj and qartifj obtainedfrom the auditory-based PEMO-Q metri [28℄ in (15), (16) and (17). Cir leditems an be listened to as part of the sound examples of the PEASS toolkit(see Se tion 6).Many points are far from the diagonal dashed line, showing that the proposedde omposition di�ers from the state of the art for many of the tested sounds.In general, salien e values are di�erently distributed for the PEMO-Q-based riteria and for the energy ratios. When listening to the artifa ts omponents,one an realize that the sour es are well removed with the proposed methodwhereas they an still be heard with the state-of-the-art one. This an beRR n° 7297
Subje tive and obje tive quality assessment of audio sour e separation 140 20 40
0
20
40
Sta
te o
f th
e a
rt
ISR
−20 0 20 40−20
0
20
40
Proposed decomp.
SIR
0 20 40
0
20
40
SAR
0.8 1
0.8
1
Sta
te o
f th
e a
rt
qtargetj
0.5 1
0.5
1
Proposed decomp.
qinterfj
0.6 0.8 1
0.6
0.8
1
qartifj
Figure 4: S atter plot of the energy ratios in dB (top) and the PEMO-Q-basedfeatures (bottom) for the state-of-the-art distortion de omposition (y-axis) vs.the proposed distortion de omposition (x-axis). The maximum value of energyratios have been limited to 40 dB. Cir led items an be listened to as part ofthe sound examples of the PEASS toolkit (see Se tion 6).observed in the right plots of Fig. 4 where points are in the bottom part ofthe plots sin e the artifa ts omponents obtained with the proposed method ontains less energy. The proposed method also enhan es the relevan e of thetarget distortion and interferen e omponents, whi h results in s attered pointsin the left and enter plots. Note that in the left plots, the verti ally alignedpoints on the right side orrespond to the interferen e an hor sounds for whi han almost ideal de omposition is obtained with the proposed method thanks tojoint proje tion onto all sour e signals, while the state-of-the-art one erroneouslyprovides a nonzero target distortion due to nested proje tions.4.3 Component-based obje tive measuresGiven some de omposition of the distortion, we now aim to assess the similaritybetween the estimated and the referen e sour e signal a ording to ea h of thefour subje tive rating tasks of Se tion 2. The state-of-the-art approa h in thesour e separation ommunity onsists in measuring the salien e of the overalldistortion and of the target distortion, interferen e and artifa ts omponents bymeans of energy ratios alled respe tively the Signal to Distortion Ratio (SDR),the sour e Image to Spatial distortion Ratio (ISR), the Signal to Interferen eRR n° 7297

Subje tive and obje tive quality assessment of audio sour e separation 15Ratio (SIR) and the Signal to Artifa ts Ratio (SAR) [17℄:SDRj = 10 log10
∑i
∑t |sij(t)|2∑
i
∑t |sij(t) − sij(t)|2
(10)ISRj = 10 log10
∑i
∑t |sij(t)|2∑
i
∑t |e
targetij (t)|2
(11)SIRj = 10 log10
∑i
∑t |sij(t) + etargetij (t)|2
∑i
∑t |einterfij (t)|2 (12)
SARj = 10 log10
∑i
∑t |sij(t) + etargetij (t) + einterfij (t)|2
∑i
∑t |eartifij (t)|2 . (13)These energy ratios do not always �t the per eptual salien e of ea h om-ponent within the estimated sour e. For instan e, low frequen y omponentsappear louder than they a tually sound. Also, the auditory masking of softdistortion omponents by the target signal or by louder distortion omponentsis not taken into a ount.In order to over ome these issues, we adopt the two-step approa h in Fig. 5.First, we assess the salien e of ea h distortion omponent using auditory model-based metri s. Note that this di�ers from the onventional use of su h met-ri s, whi h are applied to the overall distortion instead of individual ompo-nents [19; 20℄. Then, we ombine the resulting omponent-wise salien e featuresby nonlinear mapping, yielding a family of four obje tive measures:
• the Overall Per eptual S ore (OPS),• the Target-related Per eptual S ore (TPS),• the Interferen e-related Per eptual S ore (IPS),• the Artifa ts-related Per eptual S ore (APS).The details of ea h step are as follows.4.3.1 Component-wise salien e featuresWe employ the per eptual similarity measure (PSM) provided by the PEMO-Qauditory model5 [28℄. The per eptual salien e of the overall distortion and ofea h spe i� distortion omponent is assessed by omparing the estimated sour esignal with itself minus the onsidered distortion. This yields the following fourfeatures6:
qoverallj = PSM(sj , sj) (14)qtargetj = PSM(sj , sj − e
targetj ) (15)
qinterfj = PSM(sj , sj − einterfj ) (16)qartifj = PSM(sj , sj − eartifj ) (17)5When using the PEMO-Q software, the options delay ompensation, pause ut and levelalignment are disabled sin e the signals to be ompared are aligned and silen e segments orgain distortion must be evaluated.6Target signals and estimates are either one or two hannel (binaural). PEMO-Q integratesboth hannels into a single quality measure yielding s alar quality values, as in equations (10),(11), (12) and (13).RR n° 7297
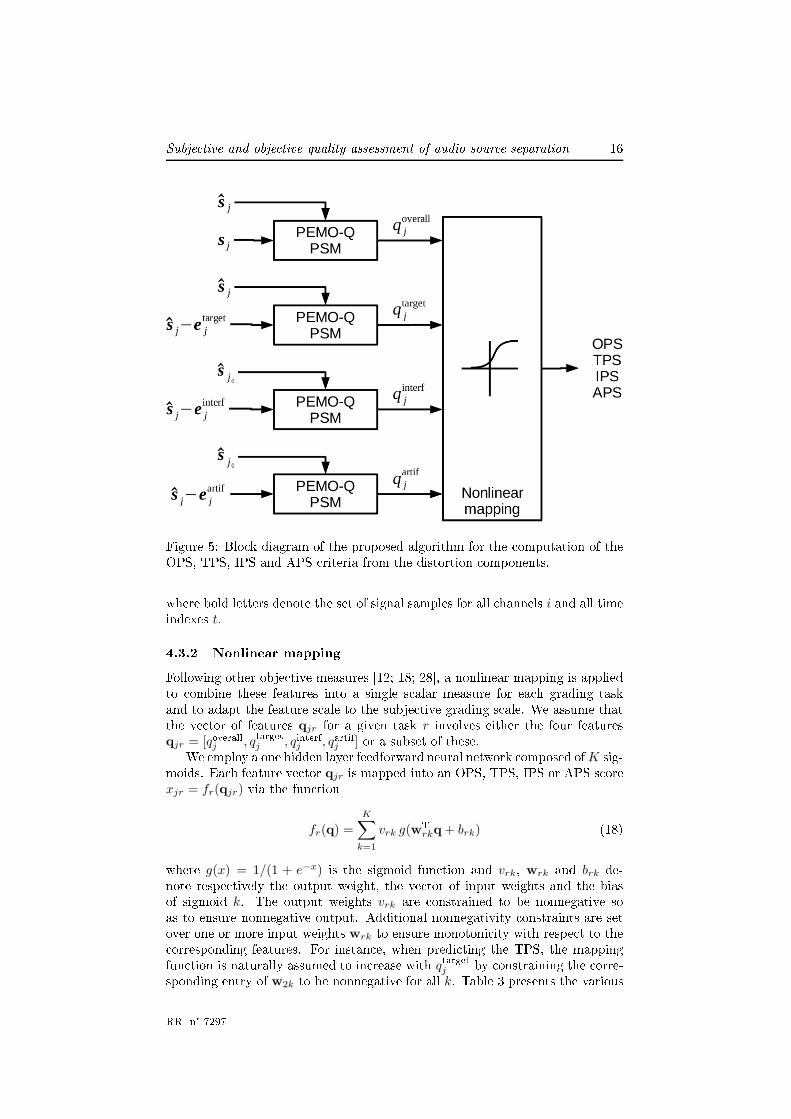
Subje tive and obje tive quality assessment of audio sour e separation 16
Figure 5: Blo k diagram of the proposed algorithm for the omputation of theOPS, TPS, IPS and APS riteria from the distortion omponents.where bold letters denote the set of signal samples for all hannels i and all timeindexes t.4.3.2 Nonlinear mappingFollowing other obje tive measures [12; 18; 28℄, a nonlinear mapping is appliedto ombine these features into a single s alar measure for ea h grading taskand to adapt the feature s ale to the subje tive grading s ale. We assume thatthe ve tor of features qjr for a given task r involves either the four featuresqjr = [qoverallj , qtargetj , qinterfj , qartifj ] or a subset of these.We employ a one hidden layer feedforward neural network omposed ofK sig-moids. Ea h feature ve tor qjr is mapped into an OPS, TPS, IPS or APS s orexjr = fr(qjr) via the fun tion
fr(q) =
K∑
k=1
vrk g(wTrkq + brk) (18)where g(x) = 1/(1 + e−x) is the sigmoid fun tion and vrk, wrk and brk de-note respe tively the output weight, the ve tor of input weights and the biasof sigmoid k. The output weights vrk are onstrained to be nonnegative soas to ensure nonnegative output. Additional nonnegativity onstraints are setover one or more input weights wrk to ensure monotoni ity with respe t to the orresponding features. For instan e, when predi ting the TPS, the mappingfun tion is naturally assumed to in rease with qtargetj by onstraining the orre-sponding entry of w2k to be nonnegative for all k. Table 3 presents the variousRR n° 7297

Subje tive and obje tive quality assessment of audio sour e separation 17Featureve torsize Task 1 Task 2 Task 3 Task 41 +qoverallj +qtargetj +qinterfj +qartifj2 - +qtargetj
qartifj
- qtargetj
+qartifj3 +qtargetj
+qinterfj
+qartifj
+qtargetj
qinterfj
qartifj
qtargetj
+qinterfj
qartifj
qtargetj
qinterfj
+qartifj4 qoverallj
qtargetj
qinterfj
qartifj
qoverallj
+qtargetj
qinterfj
qartifj
qoverallj
qtargetj
+qinterfj
qartifj
qoverallj
qtargetj
qinterfj
+qartifjTable 3: For ea h task ( olumn), several on�gurations of feature ve tors areinvestigated, depending on the number of features (rows). Monotoni ity on-straints are reported by a `+' sign. on�gurations of input ve tors and monotoni ity onstraints whi h are testedand dis ussed in Se tion 5.The neural network parameters are trained using Matlab's fmin on opti-mizer so as to minimize the mean square error between the predi ted s ore xjrand the subje tive s ores yjrm of all subje ts m. This is equivalent to minimizingthe mean square error between xjr and the mean subje tive s ore yjr .5 Evaluation of the obje tive measuresWe assessed the ability of the family of obje tive measures proposed in Se tion 4to predi t the subje tive s ores of Se tion 2. In parti ular, the following fa torswere investigated: the use of the proposed distortion de omposition as opposedto that in [17℄, the hoi e of the window and �lter lengths T and L, the useof PEMO-Q as opposed to energy ratios and the various on�gurations of thefeature ve tor. In order to ensure a fair omparison, a nonlinear mapping isused in all ases to mat h the obje tive s ores as well as possible. In the aseof energy ratios, the same on�gurations of the feature ve tor are employed asin Table 3 with qoverallj , qtargetj , qinterfj and qartifj being repla ed by SDRj , ISRj ,SIRj and SARj respe tively.5.1 Training and test data and evaluation metri sIn order to a ount for performan e bounds due to subje t disagreement, weassess predi tion performan e with respe t to the s ores of all subje ts insteadof their mean. For ea h task r, let us denote by {yjrm} the set of subje tives ores of all sounds j by all subje ts m and by yr its mean. For a given obje tivemeasure, we denote by xjrm the predi tion of yjrm, whi h does not depend onm, and by xr the mean of {xjrm}. Ea h obje tive measure is evaluated via thefollowing riteria, as de�ned in [29℄:RR n° 7297

Subje tive and obje tive quality assessment of audio sour e separation 18• the predi tion a ura y given by Pearson's linear orrelation oe� ient
P
jm(xjrm−xr)(yjrm−yr)√P
jm(xjrm−xr)2
√P
jm(yjrm−yr)2
,• the predi tionmonotoni ity given by Spearman's rank orrelation, i.e. thelinear orrelation oe� ient between nx
jrm and nyjrm where nx
jrm (resp. nyjrm)is the rank of xjrm (resp. yjrm) after sorting in as ending order,
• the predi tion onsisten y given by 1 − Ro, where the outlier ratio Ro isthe proportion of sounds j and subje ts m for whi h the predi tion error|xjrm − yjrm| is larger than twi e the standard deviation of the subje tives ores for that sound7.These riteria are expressed as real-valued �gures between -1 and 1 or between0 and 1.The subje tive s ores olle ted in Se tion 3 were used both to train the neuralnetwork parameters and to test the resulting obje tive measures. We onsideredthree ross-validation settings by splitting the data into a training set and a testset a ording to the 10 mixtures, to the 20 subje ts or both. These settings didnot signi� antly a�e t the trends of the results. In the following, we onsiderthe most hallenging setting aiming to predi t the quality of a novel sound foran unknown subje t. For ea h of 200 folds, the subje tive s ores of 19 subje tsover 9 mixtures are used for training while testing is performed on the s ores ofthe remaining subje t over the remaining mixture. The number of sigmoids Kwas adjusted for ea h task and ea h feature ve tor so as to maximize a ura y.The optimal number ranges from 2 to 8.Although the sounds from a tual separation algorithms and the hidden ref-eren es and an hors were both used for training, we report the results for theformer only. Considering an hor sounds and, most importantly, hidden refer-en es in addition to real-world sounds would in rease a ura y and monotoni ityby about 0.2 and 0.1 respe tively.5.2 Choi e of the de omposition parametersAs a preliminary experiment, we analyzed the performan e of the OPS measurefor the predi tion of global quality as a fun tion of the frame length T andthe �lter length L of the distortion de omposition algorithm. The results arereported in Table 4 for �ve di�erent settings of T and L expressed in ms at1 kHz. All performan e �gures exihibit very small variations on the order of
±0.02. Thus, these parameters do not have a ru ial in�uen e. The optimallengths orresponding to T = 500 ms and L = 40 ms at 1 kHz are used fromnow on.5.3 Predi tion of the global s ore with the OPSFig. 6 presents the main results regarding the assessment of global quality.Performan e is analyzed as a fun tion of the hosen distortion de ompositionalgorithm, distortion salien e metri s and feature ve tor on�guration. Theproposed OPS measure a hieves the best performan e in terms of a ura y,7Note that outliers in the urrent se tion and in se tion 3.2.1 refer to di�erent de�nitions.RR n° 7297

Subje tive and obje tive quality assessment of audio sour e separation 19T1kHz (ms) 300 300 500 500 1000
L1kHz (ms) 10 20 20 40 40A ura y 0.60 0.60 0.60 0.60 0.58Monotoni ity 0.57 0.56 0.56 0.57 0.55Consisten y 0.86 0.86 0.86 0.87 0.85Table 4: Performan e of the OPS measure as a fun tion of the frame length Tand the �lter length L of the distortion de omposition algorithm expressed inms at 1 kHz.monotoni ity and onsisten y and improves a ura y by more than 0.2 om-pared to nonlinear mapping of the SDR. The use of PEMO-Q instead of energyratios results in a dramati in rease of a ura y of more than 0.1. This de�-nitely validates the exploitation of auditory-based salien e metri s. A smallerimprovement on the order of 0.02 is observed when repla ing the state-of-the-artde omposition [17℄ by the proposed one. Finally, a ura y improves by about0.1 when using all four distortion salien e features instead of a single feature orresponding to the overall distortion signal. This on�rms that the de om-position of the distortion signal into several omponents is bene� ial even forglobal quality assessment, given that listeners may asso iate a di�erent weightto ea h kind of distortion. Nevertheless, the performan e of the OPS remainssomewhat below the upper performan e bound orresponding to perfe t predi -tion of the mean s ore of all subje ts, whi h suggests that room is left for futureimprovement.Table 5 further ompares the proposed OPS measure with a number of ob-je tive measures for the evaluation of denoising or oding [18; 30�32℄ and sour eseparation [12, p. 7℄ systems. These measures were s aled and shifted so asto ensure a fair evaluation of onsisten y. The OPS outperforms all on ur-rent measures. On average, onventional auditory-motivated measures do notperform better than energy ratio-based measures, while spe tral distan e-basedmeasures perform worse despite their appropriateness for spee h re ognition [5℄.The omposite measure in [32℄ provides similar a ura y and monotoni ity tothe OPS but lower onsisten y, whi h indi ates that the OPS generates feweroutlier values.5.4 Predi tion of spe i� s ores with the TPS, IPS andAPSThe results for the assessment of the preservation of the target sour e (task 2),the suppression of other sour es (task 3) and the absen e of additional arti� ialnoise (task 4), are reported in Fig. 7. Performan e is analyzed again as afun tion of the hosen distortion de omposition algorithm, distortion salien emetri s and feature ve tor on�guration.As a general trend, predi ting these spe i� s ores seems to be more di� ultthan predi ting the global s ore. In parti ular, the a ura y and monotoni ityappear omparable to those of Fig. 6 for task 3 but 0.1 to 0.2 below for tasks 2and 4. This is mostly due to the fa t that a larger onsensus between subje tswas observed for the assessment of interferen e suppression than for that oftarget preservation and arti� ial noise.RR n° 7297

Subje tive and obje tive quality assessment of audio sour e separation 20
Old+SxR New+SxR Old+PSM New+PSM
1 3 40
0.2
0.4
0.6
0.8
1Accuracy
1 3 40
0.2
0.4
0.6
0.8
1
Feature vector size
Monotonicity
1 3 40
0.2
0.4
0.6
0.8
1Consistency
Figure 6: Global s ore predi tion performan e as a fun tion of the size of thefeature ve tor, orresponding to di�erent feature ve tor on�gurations shown inthe �rst olumn of Table 3. The four urves orrespond to the use of the state-of-the-art [17℄ (Old) vs. the proposed (New) distortion de omposition algorithmand of energy ratio-based (SxR) vs. PEMO-Q-based (PSM) salien e features.The solid urves orresponds to the proposed OPS measure. The gray linesindi ates the upper performan e bound orresponding to perfe t predi tion ofthe mean s ore of all subje ts.The bene�t of the proposed measures appears most obvious for task 2. TheTPS using all four distortion salien e features in reases a ura y and monotoni -ity by 0.5 or more ompared to nonlinear mapping of the ISR in [17℄. Again,this is due both to the proposed distortion de omposition algorithm and to theuse of PEMO-Q. By ontrast, the best results for tasks 3 and 4 are obtainedwhen using a single feature orresponding to the interferen e omponent or tothe artifa ts omponent respe tively. The APS provides a smaller performan eimprovement on the order of 0.1 ompared to nonlinear mapping of the SAR in[17℄ while the IPS provides small performan e de rease ompared to nonlinearmapping of the SIR in [17℄. Note that the IPS remains nevertheless better thanthe SIR in [17℄ in the absen e of nonlinear mapping.RR n° 7297

Subje tive and obje tive quality assessment of audio sour e separation 21Obje tive measure A ura y Monotoni ity Consisten yEnergy ratio-based measuresSNR [32℄ 0.41 0.42 0.72Segmental SNR [32℄ 0.51 0.48 0.80Freq.-wei. seg. SNR [32℄ 0.59 0.52 0.84Spe tral distan e-based measuresItakura-Saito [32℄ 0.11 0.30 0.63LLR [32℄ 0.39 0.46 0.76Cepstrum dist. [32℄ 0.44 0.45 0.79WSS [32℄ 0.46 0.46 0.78Auditory-motivated measuresPEAQ [18℄ 0.45 0.54 0.75PESQ [30; 31℄ 0.54 0.48 0.83Composite measuresFox et al. [12, p. 7℄ 0.23 0.20 0.34Composite meas. [32℄ 0.61 0.56 0.83OPS 0.60 0.57 0.87Table 5: Global s ore predi tion performan e a hieved by various state-of-the-art audio quality measures ompared to the proposed OPS measure.Hen e, the major bene�t of the proposed measures on erns the assessmentof target distortion rather than that of interferen e suppression and arti� ialnoise. This an be explained by the fa t that the salien e of target distortionis badly assessed via an energy ratio due to the strong per eptual orrelationbetween the target signal and the target distortion omponent. By ontrast,interferen e and artifa ts omponents are relatively independent from the target,so that fewer auditory masking e�e ts arise.6 The PEASS toolkitWe released the 80 test sounds and the subje tive s ores of Se tion 3 as wellas Matlab software implementing the OPS, TPS, IPS and APS measures pro-posed in Se tion 4 as a toolkit alled PEASS, standing for Per eptual Evaluationmethods for Audio Sour e Separation8. The former are freely available underCreative Commons li enses, while the latter is freely available under the GNUPubli Li ense, ex ept for PEMO-Q whi h is free for a ademi use only. Amongall system on�gurations tested in Se . 5, we sele t the one leading to the besta ura y for ea h of the four measures. This toolkit an be used both for theevaluation of existing and future audio sour e separation algorithm and for thetraining of future performan e measures. This toolkit is also part of the eval-uation measures used within the 2010 Signal Separation Evaluation Campaign(SiSEC) [25℄.8http://bass-db.gforge.inria.fr/peass/RR n° 7297

Subje tive and obje tive quality assessment of audio sour e separation 22
Old+SxR New+SxR Old+PSM New+PSM
1 2 3 4
0
0.5
1Accuracy
Task 2
1 2 3 4
0
0.5
1Monotonicity
1 2 3 40
0.5
1Consistency
1 3 4
0
0.5
1
Task 3
1 3 4
0
0.5
1
1 3 40
0.5
1
1 2 3 4
0
0.5
1
Task 4
1 2 3 4
0
0.5
1
Feature vector size1 2 3 4
0
0.5
1
Figure 7: Predi tion performan e of spe i� s ores as a fun tion of the sizeof the feature ve tor, orresponding to di�erent feature ve tor on�gurationsshown in Table 3. The four urves orrespond to the use of the state-of-the-art[17℄ (Old) vs. the proposed (New) distortion de omposition algorithm and ofenergy ratio-based (SxR) vs. PEMO-Q-based (PSM) salien e features. Thesolid urves orrespond to the proposed TPS, IPS and APS measures. The grayline indi ates the upper performan e bound orresponding to perfe t predi tionof the mean s ore of all subje ts.RR n° 7297

Subje tive and obje tive quality assessment of audio sour e separation 237 Con lusionWe proposed a dedi ated multi- riteria proto ol for the subje tive evaluation ofaudio sour e separation and a family of obje tive measures aiming to predi tthe resulting subje tive s ores. Four quality riteria were onsidered, namelyglobal quality, preservation of the target sour e, suppression of other sour es andabsen e of additional arti� ial noise. We olle ted a dabatase of 6400 subje tives ores for a wide variety of mixtures and separation algorithms and showedthat the proposed OPS, TPS, IPS and APS measures in rease orrelation withsubje tive s ores up to 0.5 ompared to nonlinear mapping of the individualstate-of-the-art SDR, ISR, SIR and SAR sour e separation measures. Theseresults show the bene�t of auditory-based methods for the de omposition of thedistortion signal into multiple omponents and for the assessment of the salien eof ea h omponent, as well as the need of ombining multiple salien e featuresfor the assessment of global quality and target distortion.We hope that the proposed subje tive test proto ol ould be ome the basisfor a future improved standardized subje tive test proto ol. Also, we believethat the proposed obje tive measures ould be adapted to evaluate the per eivedquality in di�erent appli ation s enarios where the sour es are not dire tly lis-tened to, but subje t to remixing or simultaneous 3D rendering, enabling theevaluation of advan ed rendering attributes whi h annot be a urately om-puted from the mixture today. The target signal to be estimated would then bethe remix or the rendering of the true sour es and the proposed de ompositionpro edure ould be used to de ompose the distortion into inteferen e resultingin spatial spreading of the rendered sour es and artifa ts whi h may or may notbe heard depending on the presen e of maskers.Referen es[1℄ D. L. Wang and G. J. Brown, Eds., Computational Auditory S ene Analy-sis: Prin iples, Algorithms and Appli ations. Wiley/IEEE Press, 2006.[2℄ E. Vin ent, M. G. Jafari, S. A. Abdallah, M. D. Plumbley, and M. E.Davies, �Probabilisti modeling paradigms for audio sour e separation,�in Ma hine Audition: Prin iples, Algorithms and Systems, W. Wang, Ed.IGI Global, 2010.[3℄ E. Vin ent, C. Févotte, R. Gribonval, X. Rodet, É. Le Carpentier et al.,�A tentative typology of audio sour e separation tasks,� in Pro . 4th Int.Symp. on Independent Component Analysis and Blind Signal Separation(ICA), 2003, pp. 715�720.[4℄ D. P. W. Ellis, �Evaluating spee h separation systems,� in Spee h Separationby Humans and Ma hines. Kluwer, 2004, h. 20, pp. 295�304.[5℄ L. D. Persia, D. Milone, H. L. Ru�ner, and M. Yanagida, �Per eptualevaluation of blind sour e separation for robust spee h re ognition,� SignalPro essing, vol. 88, no. 10, pp. 2578 � 2583, 2008.[6℄ E. Vin ent, R. Gribonval, and C. Févotte, �Performan e measurement inblind audio sour e separation,� IEEE Trans. Audio, Spee h and Lang. Pro- es., vol. 14, no. 4, pp. 1462�1469, Jul. 2006.RR n° 7297

Subje tive and obje tive quality assessment of audio sour e separation 24[7℄ Ö. Y�lmaz and S. T. Ri kard, �Blind separation of spee h mixtures viatime-frequen y masking,� IEEE Trans. on Signal Pro essing, vol. 52, no. 7,pp. 1830�1847, 2004.[8℄ J. Joby, �Why only two ears? some indi ators from the study of sour eseparation using two sensors,� Ph.D. dissertation, Department of Ele tri alCommuni ation Engineering, Indian Institute of S ien e, Bangalore, 2004.[9℄ S. Araki, S. Makino, H. Sawada, and R. Mukai, �Redu ing musi al noise bya �ne-shift overlap-add method applied to sour e separation using a time-frequen y mask,� in Pro . 2005 IEEE Int. Conf. on A ousti s, Spee h, andSignal Pro essing (ICASSP), vol. 3, 2005, pp. 81�84.[10℄ R. Prasad, �Fixed-point ICA based spee h signal separation and enhan e-ment with generalized Gaussian model,� Ph.D. dissertation, Nara Insituteof S ien e and Te hnology, 2005.[11℄ E. Vin ent, M. G. Jafari, and M. D. Plumbley, �Preliminary guidelines forsubje tive evaluation of audio sour e separation algorithms,� in Pro . UKICA Resear h Network Workshop, 2006.[12℄ B. Fox, A. Sabin, B. Pardo, and A. Zopf, �Modeling per eptual similarityof audio signals for blind sour e separation evaluation,� in Pro . 7th Int.Conf. on Independent Component Analysis and Signal Separation (ICA),2007, pp. 454�461.[13℄ J. Korny ky, B. Gunel, and A. Kondoz, �Comparison of subje tive andobje tive evaluation methods for audio sour e separation,� Pro eedings ofMeetings on A ousti s, vol. 4, no. 1, pp. 050 001�050 001�10, 2008.[14℄ M. G. Jafari, E. Vin ent, S. A. Abdallah, M. D. Plumbley, and M. E.Davies, �An adaptive stereo basis method for onvolutive blind audiosour e separation,� Neuro omputing, vol. 71, no. 10-12, pp. 2087�2097,2008.[15℄ ITU, �ITU-T Re ommendation P.835: Subje tive test methodology forevaluating spee h ommuni ation systems that in lude noise suppressionalgorithm,� 2003.[16℄ ��, �ITU-R Re ommendation BS.1534-1: Method for the subje tive as-sessment of intermediate quality levels of oding systems,� 2003.[17℄ E. Vin ent, H. Sawada, P. Bo�ll, S. Makino, and J. P. Ros a, �First StereoAudio Sour e Separation Evaluation Campaign: Data, algorithms and re-sults,� in Pro . 7th Int. Conf. on Independent Component Analysis andSignal Separation (ICA), 2007, pp. 552�559.[18℄ ITU, �ITU-R Re ommendation BS.1387-1: Method for obje tive measure-ments of per eived audio quality,� 2001.[19℄ T. Rohdenburg, V. Hohmann, and B. Kollmeier, �Obje tive per eptualquality measures for the evaluation of noise redu tion s hemes,� in Pro .2005 Int. Workshop on A ousti E ho and Noise Control (IWAENC), 2005,pp. 169�172.RR n° 7297

Subje tive and obje tive quality assessment of audio sour e separation 25[20℄ Y. Hu and P. Loizou, �Evaluation of obje tive quality measures for spee henhan ement,� IEEE Trans. Audio, Spee h and Lang. Pro es., vol. 16, no. 1,pp. 229�238, Jan. 2008.[21℄ T. Etame Etame, R. Le Bouquin Jeannès, C. Quinquis, L. Gros, andG. Fau on, �Towards a new referen e system for subje tive evaluation of oding te hniques,� in Pro . 17th European Signal Pro essing Conf. (EU-SIPCO), 2009, pp. 914�918.[22℄ ISO, �ISO 532: A ousti s � method for al ulating loudness level,� 1975.[23℄ E. Vin ent, S. Araki, and P. Bo�ll, �The 2008 Signal Separation Evalua-tion Campaign: A ommunity-based approa h to large-s ale evaluation,�in Pro . 8th Int. Conf. on Independent Component Analysis and SignalSeparation (ICA), 2009, pp. 734�741.[24℄ P. J. Rousseeuw and B. C. van Zomeren, �Unmasking multivariate outliersand leverage points,� Journal of the Ameri an Statisti al Asso iation,vol. 85, no. 411, pp. 633�639, 1990.[25℄ S. Araki, A. Ozerov, V. Gowreesunker, H. Sawada, F. Theis et al., �The2010 Signal Separation Evaluation Campaign (SiSEC2010)� Part II�: Au-dio sour e separation hallenges,� in Pro . 9th Int. Conf. on IndependentComponent Analysis and Signal Separation (ICA), 2010.[26℄ V. Hohmann, �Frequen y analysis and synthesis using a Gammatone �lter-bank,� A ta A usti a, vol. 88, no. 3, pp. 433�442, 2002.[27℄ T. Herzke and V. Hohmann, �Improved numeri al methods for gammatone�lterbank analysis and synthesis,� A ta A usti a, vol. 93, no. 3, pp. 498�500, 2007.[28℄ R. Huber and B. Kollmeier, �PEMO-Q � A New Method for Obje tiveAudio Quality Assessment Using a Model of Auditory Per eption,� IEEETrans. Audio, Spee h and Lang. Pro es., vol. 14, no. 6, pp. 1902�1911, Nov.2006.[29℄ S. Winkler, Digital Video Quality: Vision Models and Metri s. Wiley,2005.[30℄ ITU, �ITU-T Re ommendation P.862: Per eptual evaluation of spee hquality (PESQ): An obje tive method for end-to-end spee h quality assess-ment of narrow-band telephone networks and spee h ode s,� Feb. 2001.[31℄ A. W. Rix, J. G. Beerends, M. P. Hollier, and A. P. Hekstra, �Per eptualevaluation of spee h quality (PESQ)-a new method for spee h quality as-sessment of telephone networks and ode s,� Pro . 2001 IEEE Int. Conf.on A ousti s, Spee h, and Signal Pro essing (ICASSP), vol. 2, pp. 749 �752, 2001.[32℄ P. Loizou, Spee h enhan ement: theory and pra ti e. CRC press, Bo aRaton, FL, USA, 2007.RR n° 7297

Subje tive and obje tive quality assessment of audio sour e separation 26Contents1 Introdu tion and state of the art 32 Multi- riteria subje tive test proto ol 42.1 Proto ol . . . . . . . . . . . . . . . . . . . . . . . . . . . . . . . . 42.2 An hor sounds . . . . . . . . . . . . . . . . . . . . . . . . . . . . 63 Database of subje tive s ores 63.1 Test material and subje ts . . . . . . . . . . . . . . . . . . . . . . 73.1.1 Test material . . . . . . . . . . . . . . . . . . . . . . . . . 73.1.2 Subje ts . . . . . . . . . . . . . . . . . . . . . . . . . . . . 73.2 Statisti al analysis of the results . . . . . . . . . . . . . . . . . . 83.2.1 Dete tion of outlier subje ts . . . . . . . . . . . . . . . . . 83.2.2 E�e t of lo ation . . . . . . . . . . . . . . . . . . . . . . . 83.2.3 Statisti al analysis for hidden referen es and an hors . . . 83.2.4 Statisti al analysis for test sounds produ ed by separation s hemes 94 Multi- riteria obje tive measures 94.1 Distortion omponent model and estimation . . . . . . . . . . . . 104.1.1 Time-frequen y analysis . . . . . . . . . . . . . . . . . . . 124.1.2 Joint least-squares de omposition . . . . . . . . . . . . . . 124.1.3 Time-domain resynthesis . . . . . . . . . . . . . . . . . . 134.2 Evaluation of the signal de omposition . . . . . . . . . . . . . . . 134.3 Component-based obje tive measures . . . . . . . . . . . . . . . . 144.3.1 Component-wise salien e features . . . . . . . . . . . . . . 154.3.2 Nonlinear mapping . . . . . . . . . . . . . . . . . . . . . . 165 Evaluation of the obje tive measures 175.1 Training and test data and evaluation metri s . . . . . . . . . . . 175.2 Choi e of the de omposition parameters . . . . . . . . . . . . . . 185.3 Predi tion of the global s ore with the OPS . . . . . . . . . . . . 185.4 Predi tion of spe i� s ores with the TPS, IPS and APS . . . . . 196 The PEASS toolkit 217 Con lusion 23
RR n° 7297

Centre de recherche INRIA Rennes – Bretagne AtlantiqueIRISA, Campus universitaire de Beaulieu - 35042 Rennes Cedex (France)
Centre de recherche INRIA Bordeaux – Sud Ouest : Domaine Universitaire - 351, cours de la Libération - 33405 Talence CedexCentre de recherche INRIA Grenoble – Rhône-Alpes : 655, avenue de l’Europe - 38334 Montbonnot Saint-Ismier
Centre de recherche INRIA Lille – Nord Europe : Parc Scientifique de la Haute Borne - 40, avenue Halley - 59650 Villeneuve d’AscqCentre de recherche INRIA Nancy – Grand Est : LORIA, Technopôle de Nancy-Brabois - Campus scientifique
615, rue du Jardin Botanique - BP 101 - 54602 Villers-lès-Nancy CedexCentre de recherche INRIA Paris – Rocquencourt : Domaine de Voluceau - Rocquencourt - BP 105 - 78153 Le Chesnay Cedex
Centre de recherche INRIA Saclay – Île-de-France : Parc Orsay Université - ZAC des Vignes : 4, rue Jacques Monod - 91893 Orsay CedexCentre de recherche INRIA Sophia Antipolis – Méditerranée : 2004, route des Lucioles - BP 93 - 06902 Sophia Antipolis Cedex
ÉditeurINRIA - Domaine de Voluceau - Rocquencourt, BP 105 - 78153 Le Chesnay Cedex (France)http://www.inria.fr
ISSN 0249-6399