Study on the Deployment of C-ITS in Europe: Final Report · Study on the Deployment of C-ITS in...
218
Study on the Deployment of C-ITS in Europe: Final Report Framework Contract on Impact Assessment and Evaluation Studies in the Field of Transport МOVE/А3/119-2013-Lot № 5 "Horizontal"
Transcript of Study on the Deployment of C-ITS in Europe: Final Report · Study on the Deployment of C-ITS in...

Study on the Deployment of
C-ITS in Europe: Final Report
Framework Contract on Impact Assessment and Evaluation Studies in the Field of Transport МOVE/А3/119-2013-Lot № 5 "Horizontal"

Study on the Deployment of C-ITS in Europe: Final Report
Ricardo Energy & Environment
Ricardo in Confidence Ref: Ricardo/ED60721/Issue Number 1
Study on the Deployment of C-ITS in Europe: Final Report Framework Contract on Impact Assessment and Evaluation Studies in the Field of Transport МOVE/А3/119-2013-Lot № 5 "Horizontal" ___________________________________________________
Report for DG MOVE MOVE/C.3./№ 2014-794
ED 60721 | Issue Number 1 | Date 05/02/2016 Ricardo in Confidence

Study on the Deployment of C-ITS in Europe: Final Report
Ricardo Energy & Environment
Ricardo in Confidence Ref: Ricardo/ED60721/Issue Number 1
Customer: Contact:
DG MOVE Nick Asselin-Miller Ricardo Energy & Environment 30 Eastbourne Terrace, London, W2 6LA United Kingdom
t: +44 (0) 1235 75 3292
Ricardo-AEA Ltd is certificated to ISO9001 and ISO14001
Customer reference:
MOVE/C.3/No. 2014-795
Confidentiality, copyright & reproduction:
This report is the Copyright of DG MOVE. It has been prepared by Ricardo Energy & Environment, a trading name of Ricardo-AEA Ltd, under contract to DG MOVE dated 01/04/2015. The contents of this report may not be reproduced in whole or in part, nor passed to any organisation or person without the specific prior written permission of DG MOVE. Ricardo Energy & Environment accepts no liability whatsoever to any third party for any loss or damage arising from any interpretation or use of the information contained in this report, or reliance on any views expressed therein.
Author:
Nick Asselin-Miller, Marius Biedka, Gena Gibson, Felix Kirsch, Nikolas Hill, Ben White, Kotub Uddin
Approved By:
Sujith Kollamthodi
Date:
05 February 2016
Ricardo Energy & Environment reference:
Ref: ED60721- Issue Number 1

Study on the Deployment of C-ITS in Europe: Final Report | 1
Ricardo in Confidence Ref: Ricardo/ED60721/Issue Number 1
Ricardo Energy & Environment
Executive Summary
The development of Cooperative Intelligent Transport Systems (C-ITS) has the potential to play a significant role in achieving the Commission’s goals to tackle the increasing problems of congestion, transport energy consumption and emissions in Europe. C-ITS typically involves communication between vehicles (V2V), between vehicles and infrastructure (V2I) and/or infrastructure-to-infrastructure (I2I). The benefits span a range of areas, including improving road safety, reducing congestion, optimising transport efficiency, enhancing mobility, increasing service reliability, reducing energy use and environmental impacts, and supporting economic development.
Over the past decade, there have been remarkable new developments in technologies that facilitate C-ITS. In recognition of the high potential of С-ITS, the Commission has set up a dedicated C-ITS Platform, bringing together representatives from a wide range of stakeholders. The aim of the Platform is to build a shared vision of options for supporting the deployment of C-ITS. Ricardo Energy and Environment, together with our subcontractors Trasporti e Territorio srl (TRT), were commissioned to deliver a study to support the development of this shared vision, principally by carrying out an analysis of the costs and benefits that different deployment scenarios for C-ITS services in Europe could deliver.
This involved a major desk research, consultation and data collection exercise, along with the definition of deployment scenarios in conjunction with members of the C-ITS Platform. This was then followed by a series of modelling steps using the ASTRA and TRUST European transport models in order to quantify the costs and benefits.
The baseline was defined as the scenario under which “no additional EU action" is taken beyond on-going activities. Five deployment scenarios were then designed based on defining uptake rates for a series of C-ITS service ‘bundles’ agreed with the C-ITS Platform. In turn, bundle uptake rates were defined by the uptake/penetration of the underlying technologies that enable them, split into four main categories as follows:
In-vehicle ITS sub-systems, which are fitted by the vehicle manufacturer and are attached to the vehicle communication buses – these were assumed to enable both V2V communications and V2I along suitably equipped roads/regions.
Personal ITS sub-systems such as mobile phones, tablets, personal navigation satnav-type devices, and other hand-held devices not attached to the vehicle’s information bus – these were assumed to enable V2I communications only, via cellular networks.
Roadside ITS sub-systems such as beacons on gantries, poles, smart traffic lights, etc. which allow V2I communications along specific stretches of roads.
Central ITS sub-systems, which may be part of a centralised traffic management system and help to manage roadside infrastructure.
The results of the analysis showed that the deployment of C-ITS is clearly beneficial at an EU level, with Benefit-Cost Ratios (BCRs) ranging from 2-8 achieved in 2030 for the full range of deployment scenarios and sensitivities. Whilst the scope of this study does not attempt to provide specific policy recommendations to the Commission, a number of clear conclusions and recommendations were drawn from the analysis, as summarised below:
A small number of cost/benefit categories dominate the overall cost-effectiveness:
o Two cost items make up over 96% of total costs estimated: the costs of the hardware required to support the deployment C-ITS services to vehicles make up c. 86% of total cumulative costs to 2030 in the central scenario, followed by aftermarket devices which make up c. 10% of total cumulative costs to 2030.
o Three elements make up c. 99% of total cumulative benefits estimated: the biggest contributor is reduced travel times/increased efficiency (66% of cumulative benefits to 2030 in the central scenario), followed by reduced accident rates (22%) and fuel consumption savings (11%).
There is a significant benefit from spreading initial investment costs across more services: In order to deploy even the most basic safety-related V2V and V2I C-ITS services, a significant investment is required in in-vehicle hardware/aftermarket devices and roadside infrastructure. The result is that when deploying a small number of services, costs ramp up

Study on the Deployment of C-ITS in Europe: Final Report | 2
Ricardo in Confidence Ref: Ricardo/ED60721/Issue Number 1
Ricardo Energy & Environment
rapidly but benefits remain relatively low. Adding additional services enables significant additional benefits to be accrued with minimal additional costs, and results in much improved overall economics and BCRs.
More rapid deployment results in faster break-even due to ‘network’ effects: Increasing the rollout rate of C-ITS services and supporting infrastructure results in higher initial costs, but a more rapid break-even and better overall benefits. This due to the ‘network’ effects of larger numbers of equipped vehicles and infrastructure resulting in a much more rapid accrual of benefits in early deployment years – clearly demonstrating the benefits of targeting a more rapid rollout.
Using cellular networks to provide V2I services can have immediate benefits: Using the cellular network to provide V2I services rather than dedicated roadside infrastructure allows a very high infrastructure penetration to be achieved across all roads from day 1. This results in a significantly faster ramp-up of benefits in the early years of deployment, with cashflow break-even occurring earlier and annual net benefits in 2030 increasing by over €5bn to €17.3bn, with the BCR increasing to 7.4 from 6.1 between the central and cellular scenarios. Whilst many uncertainties remain around the possibility of using cellular networks in this way (including latency times for safety-based services, lack of understanding of future business models or roaming issues, costs, effect on individual service impacts, etc.), there is a clear argument for carrying out further work on this topic with the aim of clarifying uncertainties and supporting accelerated deployment of C-ITS services in Europe, with the associated improved benefits that this could bring.
C-ITS deployment is highly beneficial at an EU level, but coordinated action is required: The CBA analysis estimates high BCRs for the deployment of C-ITS in Europe, for example a BCR of 6.2 annually for the central scenario by 2030. Whilst many of the benefits are relatively long-term societal benefits which may be felt by a range of stakeholders, the main investors in the deployment are likely to be the consumers who pay for the C-ITS hardware on-board new vehicles, or in aftermarket devices, as well as the highways agencies/urban transport authorities that invest in infrastructure. As such, it is unlikely that C-ITS deployments and associated investment decisions will be made at a European level. However, the success of C-ITS deployment relies on achieving significant ‘network’ effects through the rapid rollout of both vehicles and infrastructure across a large number of Member States. As such, strong coordination will be required to support a successful, widespread rollout across Europe, including between standards bodies, industry, consumer groups, highways agencies/urban transport authorities and national and European Governments.
Additional evidence is required in a number of fields to support the deployment of C-ITS: Whilst the data collection and stakeholder consultation exercise identified sufficient evidence to enable a full assessment of the costs and benefits of C-ITS services, evidence and data was significantly stronger in some areas than others. In particular, data on the impacts of safety-related services and motorway-focused services was quite strong, and cost data for in-vehicle and roadside sub-systems was widely available. However, additional detailed assessments in a number of fields would benefit any future analysis, including the impacts and costs of more urban-focused services (e.g. parking information, traffic light optimisation, smart routing, etc.), costs and business models for personal ITS sub-systems (e.g. mobile phone apps), local/regional-specific costs and business models to support the deployment of C-ITS services, impact and cost data for vehicles other than passenger cars, costs of central ITS sub-systems and the impact of overlap between similar C-ITS and non-C-ITS services.
Study on the Deployment of C-ITS in Europe: Final Report | 3
Ricardo in Confidence Ref: Ricardo/ED60721/Issue Number 1
Ricardo Energy & Environment
List of abbreviations
ACEA: European Automobile Manufacturers' Association
AFV: Alternative fuelled vehicle
AG: Amsterdam Group
ASECAP: European association of toll road operators
ASTRA: Strategic transport model developed by TRT
BCR: Benefit-cost ratio
C2C-CC: Car2Car Communication Consortium
CAM: Cooperative awareness message
CARE: Community database on Accidents on the Roads in Europe
CBA: Cost-benefit analysis
CCRW: Cooperative collision risk warning C-ITS service
CEDR: European organisation for national road administrations
CEF: Connecting Europe Facility
CEN: European Committee for Standardization
C-ITS: Cooperative Intelligent Transport Systems
CV: Connected vehicle
DENM: Decentralised Environmental Notification Message
DGITM: La Direction Générale des Infrastructures des Transports et de la Mer (The French Directorate General of Infrastructure, Transport and Maritime, part of the Ministry of Sustainable Development)
DG MOVE: Directorate General for Mobility and Transport
DSRC: Dedicated short range communication
EBL: Emergency electronic brake light C-ITS service
EVA: Emergency vehicle approaching C-ITS service
ETSI: European Telecommunications Standards Institute
FTE: Full time equivalent
GDP: Gross domestic product
GLOSA / TTG: Green Light Optimal Speed Advisory / Time To Green C-ITS service
GVA: Gross Value Added
HLN: Hazardous location notification C-ITS service
iFuel: Information on fuelling & charging stations for alternatively fuelled vehicles C-ITS service
ISO: International Organization for Standardization
ITS: Intelligent Transport System
ITS-G5: a European set of protocols and parameters for V2V and V2I communications based on the IEEE standard 802.11p on wireless access in vehicular environments
LoI: Letter of Intent
LZM: Loading zone management C-ITS service
MCA: Motorcycle approaching indication C-ITS service
MoU: Memorandum of Understanding

Study on the Deployment of C-ITS in Europe: Final Report | 4
Ricardo in Confidence Ref: Ricardo/ED60721/Issue Number 1
Ricardo Energy & Environment
MS: Member State
NHTSA: United States National Highway Traffic Safety Administration
OBU: Onboard unit
OEM: Original equipment manufacturer
P&Ride: Park & Ride information C-ITS service
PInfo: Off street parking information and management C-ITS service
PMang: On street parking management and information C-ITS service
PND: Personal Navigation Device
POLIS: European cities and regions network
PVD: Probe vehicle data C-ITS service
RSU: Roadside unit
RWW: Roadworks warning C-ITS service
SigV: Signal violation / Intersection safety warning C-ITS service
SmartR: Traffic information and smart routing C-ITS service
SME: Small and medium-sized enterprises
SSV: Slow or stationary vehicle(s) warning C-ITS service
SWD: Shockwave damping C-ITS service
TEN-T: Trans-European Transport Networks
TJW: Traffic jam ahead warning C-ITS service
TFP: Total Factor Productivity
TMC: Traffic management centre
TRT: Trasporti e Territorio srl
TSP: Traffic signal priority request by designated vehicles C-ITS service
TRUST: European Transport Network Model developed by TRT
UNECE Working Party 1: United Nations Economic Commission for Europe Working Party on Road Traffic Safety
US EPA: United States Environmental Protection Agency
V2I: Vehicle-to-infrastructure
V2V: Vehicle-to-vehicle
V2X: Vehicle-to-X (X represents any entity capable of receiving C-ITS communications)
VRU: Vulnerable Road User (may also refer to the Vulnerable road user protection C-ITS service)
VSGN: In-vehicle signage C-ITS service
VSPD: In-vehicle speed limits C-ITS service
WG1: European Commission DG MOVE C-ITS Platform Working Group 1 – Cost/Benefit Analysis
WTC: Weather conditions warning C-ITS service
WWD: Wrong way driving C-ITS service
ZAC: Zone access control C-ITS service

Study on the Deployment of C-ITS in Europe: Final Report | 5
Ricardo in Confidence Ref: Ricardo/ED60721/Issue Number 1
Ricardo Energy & Environment
Table of contents
1 Overview and context ................................................................................................ 7 1.1 Background ....................................................................................................................... 7 1.2 Purpose and scope of the study ........................................................................................ 7
2 Methodology and modelling environment ............................................................... 8 2.1 Overall project methodology and objectives ..................................................................... 8 2.2 Overview of modelling approach ....................................................................................... 8 2.3 Modelling inputs................................................................................................................. 9 2.4 Scenario and baseline definition ..................................................................................... 10
3 Problem definition ................................................................................................... 18 3.1 Introduction ...................................................................................................................... 18 3.2 Summary of preliminary outcomes .................................................................................. 18
4 Case studies ............................................................................................................. 20 4.1 Overview .......................................................................................................................... 20 4.2 High-level summary of outcomes .................................................................................... 20
5 Assessment of impacts ........................................................................................... 21 5.1 Modelling outputs ............................................................................................................ 21 5.2 Other impacts .................................................................................................................. 31 5.3 Comparison between scenarios ...................................................................................... 35
6 Conclusions and recommendations ....................................................................... 42
7 Annex A: C-ITS service list ..................................................................................... 47
8 Annex B: List of European Projects ....................................................................... 51
9 Annex C: Case studies ............................................................................................ 66 9.1 CASE STUDY: Car-to-Car Communication Consortium ................................................. 66 9.2 CASE STUDY: Amsterdam Group .................................................................................. 71 9.3 CASE STUDY: C-ITS Corridor ........................................................................................ 78 9.4 CASE STUDY: SCOOP@F ............................................................................................. 82 9.5 CASE STUDY: United Kingdom ...................................................................................... 86 9.6 CASE STUDY: Czech Republic ...................................................................................... 89 9.7 CASE STUDY: United States .......................................................................................... 91 9.8 CASE STUDY: Australia ............................................................................................... 103 9.9 CASE STUDY: ITS-G5 .................................................................................................. 110
10 Annex D: Matrix approach ..................................................................................... 114 10.1 Step 1: Service bundle definition ................................................................................... 114 10.2 Step 2: Defining a matrix of priority scenario building blocks ........................................ 115 10.3 Steps 3 and 4: Developing scenarios from the building blocks ..................................... 117
11 Annex E: C-ITS service and infrastructure uptake and penetration rates ......... 118 11.1 Introduction .................................................................................................................... 118 11.2 Uptake of C-ITS services in new vehicles ..................................................................... 118 11.3 Uptake of C-ITS services in aftermarket systems ......................................................... 123 11.4 Uptake of C-ITS services in infrastructure .................................................................... 127
12 Annex F: C-ITS service impact data ..................................................................... 130 12.1 Introduction .................................................................................................................... 130 12.2 Input data for services ................................................................................................... 133 12.3 Overlap between services ............................................................................................. 187
13 Annex G: C-ITS supporting technology and service costs ................................. 189 13.1 Introduction .................................................................................................................... 189 13.2 Central ITS sub-systems ............................................................................................... 191 13.3 Personal ITS sub-systems ............................................................................................ 193 13.4 In-vehicle ITS sub-systems ........................................................................................... 197

Study on the Deployment of C-ITS in Europe: Final Report | 6
Ricardo in Confidence Ref: Ricardo/ED60721/Issue Number 1
Ricardo Energy & Environment
13.5 Roadside ITS sub-systems ........................................................................................... 203
14 References ............................................................................................................. 207

Study on the Deployment of C-ITS in Europe: Final Report | 7
Ricardo in Confidence Ref: Ricardo/ED60721/Issue Number 1
Ricardo Energy & Environment
1 Overview and context
1.1 Background
As outlined in the Transport White Paper (2011), the increasing road transport volumes in the European Union are the primary cause of growing congestion and rising energy consumption, as well as a source of environmental and social problems. Coordinated action across a number of fronts is required to tackle these issues and prevent them from becoming major influences on the European population, economy, environment and climate.
The development of new technologies aimed at improving the efficiency, safety and environmental performance of road transport are playing a significant role in achieving the Commission’s goals in this area. One such emerging field is that of Cooperative Intelligent Transport Systems (C-ITS). In road transport, C-ITS typically involves communication between vehicles (vehicle-to-vehicle, V2V), between vehicles and infrastructure (vehicle-to-infrastructure, V2I) and/or infrastructure-to-infrastructure (I2I). The benefits span a range of areas, including improving road safety, reducing congestion, optimising transport efficiency, enhancing mobility, increasing service reliability, reducing energy use and environmental impacts, and supporting economic development.
Over the past decade, there have been remarkable new developments in technologies that facilitate C-ITS; however, these are far from being used at their full potential despite the benefits they could bring.
In recognition of the high potential of С-ITS, the Commission has taken the initiative to develop a strategy on the deployment of С-ITS. To support the shaping of this strategy the Commission has set up a dedicated C-ITS Platform bringing together representatives from a wide range of stakeholders. The aim of the Platform is to build a shared vision of options for overcoming issues which hamper the co-ordinated deployment of C-ITS across the EU and supporting their actual deployment.
This study supports the development of this shared vision and a common deployment strategy, principally by carrying out an analysis of the costs and benefits that different deployment scenarios could deliver.
1.2 Purpose and scope of the study
Ricardo Energy and Environment together with our subcontractors Trasporti e Territorio srl (TRT), were commissioned to deliver this study, entitled “Study on the Deployment of C-ITS in Europe”.
The aim of the study is to assess the benefits and costs that could be achieved through a series of potential European C-ITS deployment scenarios, to be developed as part of the study. A major desk research, consultation and data collection exercise fed into a full cost-benefit analysis (CBA) modelling phase. In addition to the modelling outputs, a series of international case studies were carried out to identify best practice and lessons learned elsewhere that may be relevant to the EU.
The outputs of the study will provide guidance to DG MOVE as to the relative impact of different bundles of C-ITS services and paces for deployment. It will contribute to the development by DG MOVE and the C-ITS Platform of a strategy in the form of a Commission Communication on the deployment of С-ITS in the EU.
This document constitutes the final report for the project and includes the following sections:
Section1: Overview and context of the study.
Section 2: An introduction to the outputs from the problem definition task carried out as part of the extensive literature review carried out.
Section 3: A high-level overview of the case studies carried out and key findings.
Section 4: An overview of the study methodology and modelling environment used.
Section 5: A detailed assessment of the impacts of the services evaluated in the cost-benefit-analysis.
Section 6: The main conclusions and recommendations made from the analysis.
Section 7 onwards: A series of Annexes containing detailed assumptions and methodologies.

Study on the Deployment of C-ITS in Europe: Final Report | 8
Ricardo in Confidence Ref: Ricardo/ED60721/Issue Number 1
Ricardo Energy & Environment
2 Methodology and modelling environment
2.1 Overall project methodology and objectives
This project was comprised of seven key tasks, as summarised below in Figure 2-1. The main tasks included:
Task 1: a detailed desk-based literature review of over 120 sources containing information on various aspects of C-ITS, from a range of countries.
Task 2: a series of nine case studies that were carried out to identify key issues and best practice from elsewhere that could be relevant to the deployment of C-ITS in Europe.
Task 3: an identification of the key issues and barriers that are currently preventing the deployment of C-ITS in Europe.
Task 4: development of a series of five deployment scenarios and the collection of all necessary modelling input data in consultation with the C-ITS Platform Working Group 1 (WG1).
Task 5: the evaluation of the scenarios in the ASTRA/TRUST modelling environment and subsequent cost-benefit-analysis (CBA) of the modelling outputs.
Task 6: assessment of the outputs from the CBA analysis.
Task 7: ongoing stakeholder engagement throughout the course of the project to gather and validate data with key industry stakeholders.
Further detail on the detailed methodology used in the modelling can be found in Annexes D – G.
Figure 2-1 – Overview of methodology
2.2 Overview of modelling approach
A series of steps were required to produce the outputs from the cost-benefit analysis (CBA). This involved an extensive data collection exercise (described in more detail in Section 2.3) and definition of a series of deployment scenarios (described in Section 2.4), followed by a series of modelling steps centred around the ASTRA and TRUST models, as shown in Figure 2-2.
Task 7: Cross-cutting stakeholder
engagement

Study on the Deployment of C-ITS in Europe: Final Report | 9
Ricardo in Confidence Ref: Ricardo/ED60721/Issue Number 1
Ricardo Energy & Environment
ASTRA is a strategic model based on the Systems Dynamics Modelling approach, which simulates the EU transport system in combination with the economy and the environment. It is calibrated to reproduce major indicators such as fuel consumption, CO2 emissions and GDP. On the other hand, TRUST is a European transport network model that can compute energy consumption, polluting emissions and accidents by road classification (TEN-T Corridors, Core TEN-T etc.). The outputs from these two models were processed and combined during the CBA to produce the final outputs discussed in Section 3.
Figure 2-2 - Key steps in producing CBA modelling outputs
2.3 Modelling inputs
2.3.1 Cost-benefit data input categories
Three main data inputs are required to carry out the modelling required for the CBA of the various C-ITS deployment scenarios developed, namely:
C-ITS service and infrastructure uptake and penetration rates:
o Vehicle penetration/uptake rates allow an estimation to the total number of vehicles within the vehicle fleet for each vehicle category (or amongst new vehicles) equipped with the technologies required to support C-ITS services.
o Separate penetration rates are also necessary to represent the extent of different road types equipped with C-ITS supporting infrastructure, allowing them to offer Vehicle-to-Infrastructure (V2I) services.
o Uptake and penetration rates were determined for the baseline and each scenario based on consultation with WG1 members. The full list of uptake/penetration assumptions are summarised in Annex E: C-ITS service and infrastructure uptake and penetration rates.
C-ITS service impact data:
o These are the impacts of C-ITS services on individual vehicles when installed across different vehicle and road types.
o Impacts can be in terms of reduced congestion/average journey speed, fuel consumption, CO2 emissions, polluting emissions, or accident rates.
o Individual impacts are combined with C-ITS deployment scenario service bundle uptake and penetration rates in the ASTRA/TRUST modelling environments to estimate the total EU-level impact of services for each deployment scenario.
o The EU-level impacts can be converted to monetised benefits through using typical values for the external cost of transport from the Handbook on External Costs of Transport (Ricardo-AEA et al., 2014).
o The full list of C-ITS service impact data inputs and assumptions are summarised in Annex F: C-ITS service impact data.
C-ITS supporting technology and service costs:
o Cost data makes up the final main input element for the CBA, allowing the uptake and penetration rates for different services to be translated into costs, in order to compare them directly to the estimated benefits from the various EU-level impacts calculated from the modelling.
o The full list of cost data inputs and assumptions are summarised in Annex G: C-ITS supporting technology and service costs.

Study on the Deployment of C-ITS in Europe: Final Report | 10
Ricardo in Confidence Ref: Ricardo/ED60721/Issue Number 1
Ricardo Energy & Environment
2.3.2 Methodology for data collection
2.3.2.1 Literature review
The impacts and cost data collection exercise built on our extensive literature review of over 130 documents covering various aspects of C-ITS services and related technologies. A list of the main sources which contributed to the analysis is included in Section14, with the key sources contributing to each of the data input categories described above listed in Annex F: C-ITS service impact data and Annex G: C-ITS supporting technology and service costs.
Where the modelling input data was not directly available from literature, a number of approaches were used to fill the data gaps, including:
Identifying costs or impacts from other non-C-ITS services or technologies which are expected to operate through a similar mechanism to specific C-ITS services.
Estimating costs or impacts from first principles based on, for example, using known accident data linked to specific accident types targeted by certain C-ITS services to estimate the impact of a specific C-ITS service on accident rates.
2.3.2.2 Expert input
Whilst the main source of input data for the costs and impacts data was the extensive literature review described above, the uptake and penetration rates used to define each scenario (discussed in more detail in Section 2.4) were defined through discussions with various WG1 members over the course of the project.
In addition to the desk-based data collection for the cost and impacts data points, many of these inputs were discussed with individual experts from within and outside of WG1 over the course of July-October 2015. For example, where data was inconsistent between studies or where gaps remained from the literature review, a number of industry experts (mainly from within WG1) were contacted either unilaterally or in groups (via email or by teleconference) as part of Task 8 (cross cutting stakeholder engagement task). Ricardo Energy & Environment invited industry experts to:
Comment on the data collected or suggested assumptions.
Suggest further sources of information or references.
Suggest changes to input data where sufficient evidence was not available in the literature.
This consultative approach resulted in a number of revisions to the data used in the modelling.
2.4 Scenario and baseline definition
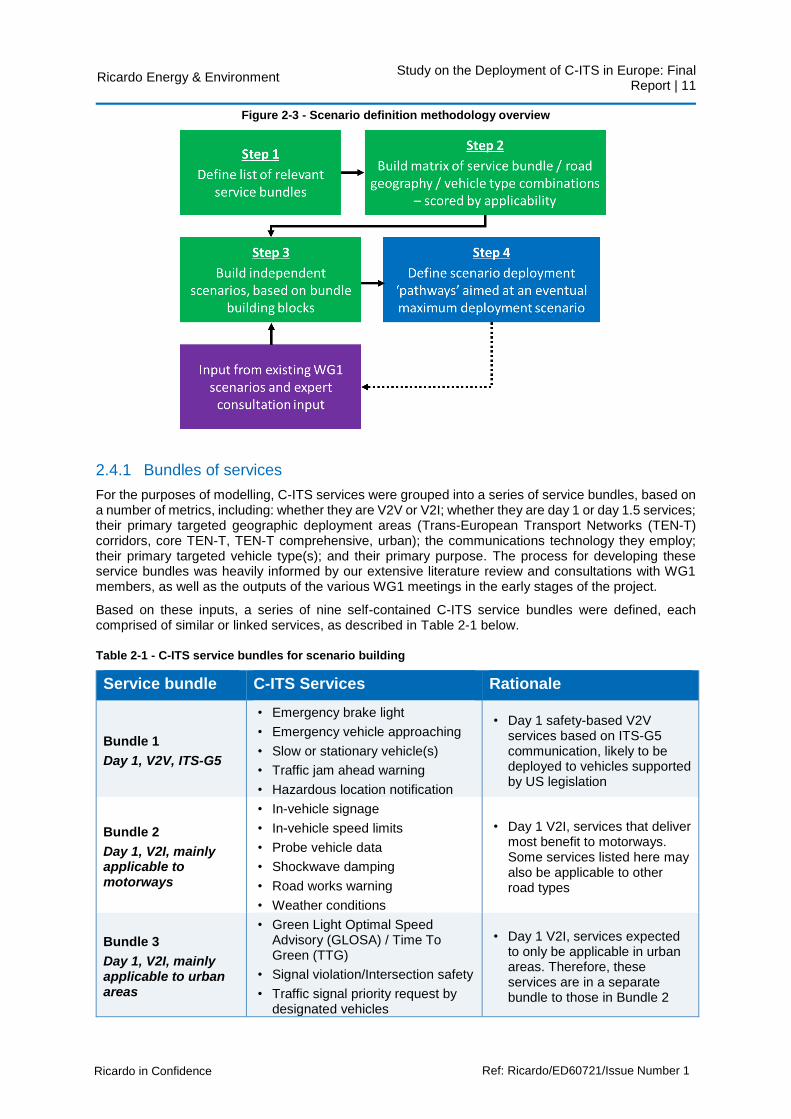
At the July 2015 meeting of the C-ITS Platform Working Group 1 (WG1), a matrix-based, ‘building block’ approach to developing deployment scenarios was agreed and implemented. The main steps of the approach are shown in Figure 2-3; further details are described in Annex D: Matrix approach. The baseline scenario was also developed in a similar way.
Study on the Deployment of C-ITS in Europe: Final Report | 11
Ricardo in Confidence Ref: Ricardo/ED60721/Issue Number 1
Ricardo Energy & Environment
Figure 2-3 - Scenario definition methodology overview
2.4.1 Bundles of services
For the purposes of modelling, C-ITS services were grouped into a series of service bundles, based on a number of metrics, including: whether they are V2V or V2I; whether they are day 1 or day 1.5 services; their primary targeted geographic deployment areas (Trans-European Transport Networks (TEN-T) corridors, core TEN-T, TEN-T comprehensive, urban); the communications technology they employ; their primary targeted vehicle type(s); and their primary purpose. The process for developing these service bundles was heavily informed by our extensive literature review and consultations with WG1 members, as well as the outputs of the various WG1 meetings in the early stages of the project.
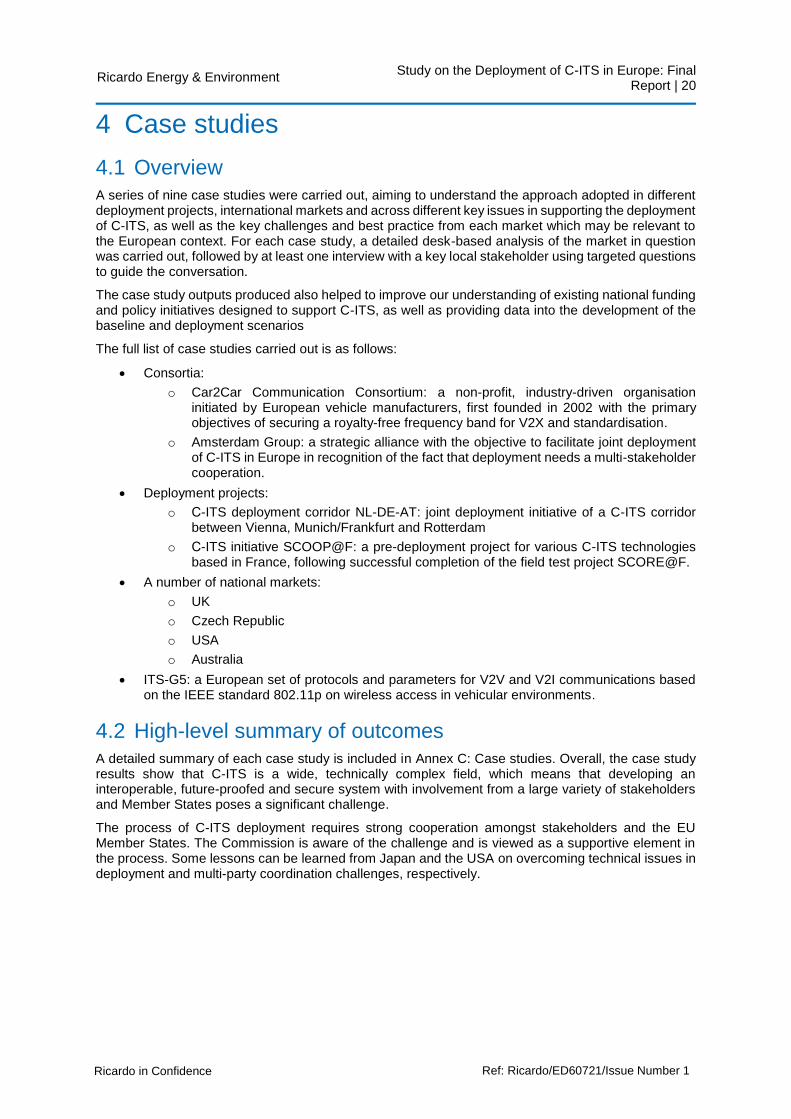
Based on these inputs, a series of nine self-contained C-ITS service bundles were defined, each comprised of similar or linked services, as described in Table 2-1 below.
Table 2-1 - C-ITS service bundles for scenario building
Service bundle C-ITS Services Rationale
Bundle 1
Day 1, V2V, ITS-G5
• Emergency brake light
• Emergency vehicle approaching
• Slow or stationary vehicle(s)
• Traffic jam ahead warning
• Hazardous location notification
• Day 1 safety-based V2V services based on ITS-G5 communication, likely to be deployed to vehicles supported by US legislation
Bundle 2
Day 1, V2I, mainly applicable to motorways
• In-vehicle signage
• In-vehicle speed limits
• Probe vehicle data
• Shockwave damping
• Road works warning
• Weather conditions
• Day 1 V2I, services that deliver most benefit to motorways. Some services listed here may also be applicable to other road types
Bundle 3
Day 1, V2I, mainly applicable to urban areas
• Green Light Optimal Speed Advisory (GLOSA) / Time To Green (TTG)
• Signal violation/Intersection safety
• Traffic signal priority request by designated vehicles
• Day 1 V2I, services expected to only be applicable in urban areas. Therefore, these services are in a separate bundle to those in Bundle 2

Study on the Deployment of C-ITS in Europe: Final Report | 12
Ricardo in Confidence Ref: Ricardo/ED60721/Issue Number 1
Ricardo Energy & Environment
Service bundle C-ITS Services Rationale
Bundle 4
Day 1.5, V2I, Parking Information
• Off street parking information
• On street parking management and information
• Park & Ride information
• Information on AFV fuelling & charging stations
• C-ITS services intended to provide information regarding parking (and refuelling) to drivers
Bundle 5
Day 1.5, V2I, Traffic and other information
• Traffic information and smart routing
• C-ITS services intended to provide traffic information to drivers
Bundle 6
Day 1.5, Freight specific services
• Loading zone management
• Zone access control management • Zone management services
Bundle 7
Day 1.5, V2X (mainly applicable to urban areas), likely to be ITS-G5
• Vulnerable road user protection (pedestrians and cyclists)
• V2X service expected to be post day 1. Communication method is likely to be ITS-G5. Main benefits are likely to be seen in urban areas.
Bundle 8
Day 1.5, V2V, likely to be ITS-G5
• Cooperative collision risk warning
• Motorcycle approaching indication
• Post day 1 V2V services that are likely to be based on ITS-G5. As for Day 1 services, V2V and V2I services are in separate service bundles.
Bundle 9
Day 1.5, V2I • Wrong way driving
• Post day 1 V2I service. As for Day 1 services, V2V and V2I services are in separate service bundles.
2.4.2 Baseline definition
The matrix methodology described above (and in Annex D: Matrix approach) was used to combine the individual bundles of services into a baseline and a series of scenarios. The baseline is defined as the scenario in which “no additional EU action" is taken beyond on-going activities. Expected developments already initiated by national or regional public authorities are included, as well as their continuation for the duration of the modelling period (to 2030). In order to define uptake and penetration rates in the baseline, two key elements were assessed:
A review of existing and forthcoming large scale С-ITS deployment initiatives (such as those supported by the Connecting Europe Facility and Horizon 2020) was carried out, allowing all EU Member States to be ranked into three ‘country groupings’ (‘Front Runner’, ‘Planned Adopter’, or ‘Follower’) corresponding to different levels of ambition in existing and planned deployments. Average infrastructure penetration rates were then estimated for each country grouping to calculate an overall average EU-level penetration rate for infrastructure in the baseline.
The uptake rate for hardware required to support C-ITS services in vehicles and in the aftermarket is based primarily on expectations that a bundle of safety-based C-ITS services would be mandated in the US from 2018. It is assumed that there will be a diffusion of these basic V2V safety services (mainly Bundle 1 services) from the US to the European market (as has been the case for other vehicle technologies), primarily in premium D and E segment vehicles, with some additional uptake of aftermarket devices offering a series of V2I services from Bundles 2, 4, 5 and 6.
A summary of the uptake/penetration rates used in the baseline is included in Table 2-2 and Table 2-3, and defined in further detail in Annex E: C-ITS service and infrastructure uptake and penetration rates.

Study on the Deployment of C-ITS in Europe: Final Report | 13
Ricardo in Confidence Ref: Ricardo/ED60721/Issue Number 1
Ricardo Energy & Environment
Table 2-2 - Summary of uptake/penetration rates in vehicles used in the baseline scenario
Service Bundle
Type of vehicle
Personal transport Public transport
Freight
1, 2, 3(b)
New vehicles
Uptake to reach all Upper Medium and Executive cars by 2027, starting 2020
No uptake
Only Bundle 1.
Same total uptake % as for personal transport, but over 9 years to reflect different model lifecycles
2
Aftermarket devices for existing vehicles
25% of all vehicles that can be fitted with an aftermarket device receive this service by 2030, starting 2020
No uptake
25% of all HGVs that can be fitted with an aftermarket device receive this service by 2030, starting 2020
Table 2-3 - Summary of uptake/penetration rates in infrastructure in ‘Front Runner’ countries
Road type Infrastructure penetration
TEN-T Corridor
Use actual data based on average deployment levels to-date in each country grouping to estimate penetration by 2020. Assume constant to 2030
TEN-T Core
TEN-T Comprehensive
Non-Urban Non-Motorway
Urban 8% x 25% per year from 2020
2.4.3 Scenario definitions
Using the matrix methodology to build on the baseline scenario, a series of independent and additional scenarios were developed, with each scenario building on the previous through the deployment of additional bundles and thereby representing an increased level of ambition. Figure 2-4 below shows the final scenario definitions within the scenario definition matrix.
Uptake assumptions for the individual scenarios are based on the hardware that supports the C-ITS services, rather than on the bundles of services themselves. In order to fully define the uptake rates for this hardware (and in order to fully understand the costs associated with the deployment of C-ITS services in the CBA analysis), it is necessary to divide the hardware/devices and associated software and services used to facilitate those C-ITS services into four main categories1:
1. In-vehicle ITS sub-system, which are either fitted by the vehicle manufacturer or retrofitted to the vehicle, and are attached to the vehicle communication buses – these can enable both V2V communications and V2I along suitably equipped roads/regions. Note that retrofitted vehicle ITS sub-systems are outside the scope of this study.
2. Personal ITS sub-systems such as mobile phones, tablets, personal navigation satnav-type devices, and other hand-held devices not attached to the vehicle’s information bus – these can enable V2I communications along suitably equipped roads/regions, or in the future, may be able to support V2V communications if equipped to use the correct communications protocols.
3. Roadside ITS sub-systems such as beacons on gantries, poles, smart traffic lights, etc. which allow V2I communications along specific stretches of roads.
4. Central ITS sub-systems, which may be part of a centralised traffic management system. One such sub-system is able to manage C-ITS services for an entire city, or road operator, or national highway system etc. Deployment of other ITS sub-systems, such as C-ITS infrastructure/roadside units will require a central system for management purposes.
The uptake/penetration rates for each of these categories is summarised below and defined in further detail in Annex E: C-ITS service and infrastructure uptake and penetration rates.
1 ERTICO, “Communication Technologies for future C-ITS service scenarios” (2015)

Study on the Deployment of C-ITS in Europe: Final Report | 14
Ricardo in Confidence Ref: Ricardo/ED60721/Issue Number 1
Ricardo Energy & Environment
Figure 2-4 – Scenario definition matrix
Legend
A: Scenario A B: Scenario B C: Scenario C D: Scenario D E: Scenario E
Colour coding
Highly applicable Applicable Applicable but limited benefits
Few benefits Not relevant
in this environment
2.4.3.1 In-vehicle ITS sub-systems
Uptake rates for in-vehicle ITS sub-systems are split by vehicle type and whether they are designed to deliver primarily V2V services (which are more likely to require a basic display/warning) or both V2V and V2I services (which are more likely to require a complex display such as an infotainment system to
TEN-T
Corridors
TEN-T
Core
TEN-T
Comprehensive
Non m-way non
urbanUrban Services
Personal transport A A A A A
Public transport C C C C C
Freight A A A A A
Personal transport B B C C/D C
Public transport
Freight B B C C/D C
Personal transport C/D C
Public transport C/D C
Freight C/D C
Personal transport D D E E C
Public transport
Freight E E E E C
Personal transport A A B C/D C
Public transport
Freight B B B C/D C
Personal transport D
Public transport
Freight D D D
Personal transport E E
Public transport E E
Freight E E
Personal transport E E E E E
Public transport E E E E E
Freight E E E E E
Personal transport E E E E
Public transport
Freight E E E E
V
Emergency brake light
Emergency vehicle approaching
Slow or stationary vehicle(s)
Traffic jam ahead warning
Hazardous location notification
I
Road works warning
Weather conditions
In-vehicle signage
In-vehicle speed limits
Probe vehicle data
Shockwave damping
I
GLOSA/TTG
Signal violation/intersection safety
Traffic signal priority request by
designated vehicles
I
Off street parking information
On street parking management and
information
Park & Ride information
Information on fuelling & charging
stations for AFVs
I Traffic information & smart routing
ILoading zone management
Urban zone access control
I Wrong way driving
X Vulnerable road user protection
VMotorcycle approaching indication
Cooperative collision risk warning

Study on the Deployment of C-ITS in Europe: Final Report | 15
Ricardo in Confidence Ref: Ricardo/ED60721/Issue Number 1
Ricardo Energy & Environment
display the richer information that they produce). Deployments start from 2018 in passenger cars2 and freight vehicles and 2020 in buses, except for the hardware that is required to support Day 1.5 services, which starts being deployed in 2025.
Table 2-4 - Deployment assumptions for in-vehicle ITS sub-systems
Bundles Passenger cars Buses Freight vehicles
1, 3
Safety-based and ITS-G5 (available in all vehicles), so assumed integrated into all vehicles and no need for a complicated in-vehicle display.
All new D and E segment cars equipped by 2021, from 2018, all C segment cars by 2022, from 2019, and all A and B segment cars by 2023, from 2020
All new vehicles equipped by 2027, starting 2020
All new vehicles equipped by 2021, starting 2018
2, 4, 5
Assumes more of a premium service that requires a built-in infotainment system to display the richer information that these services deliver.
All new segment D and E cars equipped by 2021 (assuming they all have infotainment systems), from 2018, 50% of C segment cars by 2022 (i.e. 50% of cars have infotainment), from 2019, 12.5% of A and B segment cars by 2023 (i.e. 12.5% of cars have infotainment), from 2020
No uptake
50% of new vehicles equipped by 2021, starting 2018 (Bundle 4 no uptake)
6 No uptake No uptake 50% of new vehicles equipped by 2021, starting 2018
7, 8, 9
All new segment D and E cars equipped by 2027, starting 2025, all C segment cars by 2028, starting 2026, and all A and B segment cars by 2029, starting 2027
All new vehicles equipped by 2028, from 2025
All new vehicles equipped by 2028, starting 2025
2.4.3.2 Personal ITS sub-systems
Personal ITS sub-systems (aftermarket devices) are divided into two main categories as follows:
Smartphones, which are equipped to deliver C-ITS services via a freely downloadable Application (but subject to additional data charges for using those services).
Personal navigation devices (PNDs), such as TomTom or Garmin satnav systems, which are equipped with C-ITS services via in-built software and a prepaid cellular network connection.
Deployment of personal ITS sub-systems begins in 2020 and follows a similar pattern to in-vehicle systems (as shown in Table 2-5), however the number of services offered is more limited. Key assumptions are as follows:
No aftermarket devices are able to offer ITS-G5 capability, due to the introduction of metalized glass in vehicles, and the need for many of these services to be connected to the CAN bus of the vehicle.
All aftermarket devices therefore rely on a cellular network connection, and are only able to offer the services which can be offered both via cellular (assumed V2I services only).
2 A recent announcement made on the 30th October 2015 by the Car2Car consortium suggests that initial rollout will begin in Europe from 2019 (CAR 2 CAR Communication Consortium, 2015). This announcement was not made in time to be included in the modelling inputs. As a result of this updated timeline, it could be expected that some of the costs and benefits determined by the modelling may be shifted by one year in time, however the overall magnitude of costs and benefits and their long-term trajectory would not be affected by this change.

Study on the Deployment of C-ITS in Europe: Final Report | 16
Ricardo in Confidence Ref: Ricardo/ED60721/Issue Number 1
Ricardo Energy & Environment
Aftermarket devices are likely to involve a combination of Personal Navigation Devices (PNDs) and smartphone-based apps.
A top-down approach is used to estimate penetration rates, calibrated using a bottom-up analysis of device uptake rates.
Buses receive only traffic signal prioritisation as an aftermarket device, as part of Bundle 3 (they are the only vehicle type to be offered a ITS-G5 based service through the aftermarket).
Table 2-5 - Deployment assumptions for personal (aftermarket) ITS sub-systems
Bundles Passenger cars Buses Freight vehicles
1, 3 No uptake, as requires ITS-G5
Bundle 3 only: 50% of all vehicles that can be fitted with an aftermarket device receive this service by 2026, starting 2020
No uptake, as requires ITS-G5
2, 4, 5
50% of all cars that can be fitted with an aftermarket device receive this service by 2026, starting 2020
No uptake
50% of all freight vehicles that can be fitted with an aftermarket device receive this service by 2026, starting 2020
6 No uptake No uptake
50% of all freight vehicles that can be fitted with an aftermarket device receive this service by 2026, starting 2020
7, 8, 9 No uptake, as requires ITS-G5
2.4.3.3 Roadside ITS sub-systems
Roadside ITS sub-systems (roadside infrastructure) are divided into two main categories as follows:
New roadside ITS sub-systems, which are assumed to be roadside base units with traffic monitoring sensors and are deployed to all equipped inter-urban roads at 1km intervals.
Upgrades to existing roadside infrastructure, which are assumed to be devices such as plug-in units situated on top of existing poles/gantries and are deployed to equipped urban areas, with one unit required per signalised intersection.
All roadside ITS sub-systems are assumed to contain an omnidirectional antenna, processor, security chip and be capable of 802.11p wireless communication. Their penetration rates are defined by road type only, with deployments beginning in 2020 for all road types and the rate of penetration varying by road type. For example, by 2026 100% deployment along TEN-T Corridors is assumed in ‘Front Runner’ countries, while penetration is limited to 20% on non-urban non-motorway roads. Table 2-6 summarises the main penetration assumptions for the deployment of roadside ITS sub-systems in ‘Front Runner’ countries. For ‘Planned Adopter’ and ‘Follower’ countries, infrastructure penetration levels were scaled based on the ratio of infrastructure penetration in the baseline compared to ‘Front Runner’ countries in 2020.
Other key assumptions for infrastructure penetration rates are as follows:
For all inter-urban roads, deployment extent is determined as percentage of total road length for each road type. One roadside ITS sub-system is included per km of road equipped.
For all urban roads, deployment extent is determined as a percentage of total signalised intersections. One roadside ITS sub-system upgrade is included per signalised intersection.
Table 2-6 - Deployment assumptions for roadside ITS sub-systems in ‘Front Runner’ countries
Road type Infrastructure penetration
TEN-T Corridor 100% by 2026, starting 2020

Study on the Deployment of C-ITS in Europe: Final Report | 17
Ricardo in Confidence Ref: Ricardo/ED60721/Issue Number 1
Ricardo Energy & Environment
TEN-T Core 100% by 2026, starting 2020
TEN-T Comprehensive
50% by 2026, starting 2020
Non-Urban Non-Motorway
20% by 2026, starting 2020
Urban 8% x 50% per year from 2020-23, then 8% per year from 2024-26
2.4.3.4 Central ITS sub-systems
Central ITS sub-systems are defined as the back-office systems and software required to link roadside infrastructure and individual user applications to centralised traffic management centre (TMC) and local controller interfaces. One such sub-system is able to manage C-ITS services for an entire city, or road operator, or national highway system etc.
Uptake of central ITS sub-systems is linked to the uptake of roadside ITS sub-systems, as follows:
Based on conversations with industry experts, it is assumed that each EU Member State operates with different road traffic standards/protocols and that each Member State is likely to have different urban traffic standards and inter-urban traffic standards, i.e. a total of two standards per Member State.
It is assumed that each roadside unit will be connected to a TMC once a certain threshold roadside infrastructure penetration is reached. A central ITS sub-system is assumed to be deployed in each Member State once roadside ITS sub-system penetration reaches 5% and 10% across inter-urban and urban areas respectively.

Study on the Deployment of C-ITS in Europe: Final Report | 18
Ricardo in Confidence Ref: Ricardo/ED60721/Issue Number 1
Ricardo Energy & Environment
3 Problem definition
3.1 Introduction
The modelling methodology approach followed the EC Impact Assessment guidelines, which include the development of problem definitions and a problem tree. These have been developed on the basis of the extensive literature review carried out for the study.
A long list of around 50 issues which have so far prevented the widespread deployment of C-ITS in Europe were extracted from various reports and documented. These issues were then categorised and grouped into a series of well-defined problems and the root causes and impacts of each problem problems defined. Subsequently the root-causes, problems and impacts were structured into a problem tree allowing clearly showing the links between these three elements. The main problems identified are described in detail in Figure 3-1.
Figure 3-1 – Problem definitions for C-ITS services in Europe
3.2 Summary of preliminary outcomes
Figure 3-2 identifies the underlying drivers (root causes) identified and the related impacts for each problem identified. Five underlying root causes were identified as follows:
Lack of adequate progress / scope of activities to ensure standardisation and interoperability at EU level: Standardisation of C-ITS systems is vitally important in order to ensure that the advantages of the internal market can be achieved. If C-ITS is to fully achieve its potential, it is necessary to obtain a sufficient market penetration so that the technologies can contribute to achieving transport policy objectives – indeed, a distinctive feature of C-ITS systems is that the benefits achieved are far higher when the rate of penetration is high (“network effects”). Where network externalities exist, reaching a critical mass of deployment is an important challenge. Standardisation for C-ITS systems has already been initiated by CEN, ETSI and ISO as well as within other international standards organisations; however, work is still ongoing.
Lack of common understanding of viable business models and associated responsibilities: Scalability and coordination are fundamentally important obstacles (leading to a “chicken and egg” situation”) that will slow down deployment. The decision to invest in C-ITS must be based on a sound business case – taking into account market needs and related business models. Successful implementation requires substantial investment and coordination between a large number of stakeholders, including governments, automotive industry, telecoms industry, road operators, road authorities, private and commercial vehicle users. In practice, the level of take-up in road transport has been slower than expected (European Commission, 2008), with deployment efforts remaining fragmented and uncoordinated.
Uncertainties due to gaps in the legal framework governing liability, data privacy and security: Deployment is also affected by a number of concerns around these issues. All of these factors make the financial risks of business cases higher, especially considering the high development costs combined with uncertain profit margins. Work is ongoing through the C-ITS

Study on the Deployment of C-ITS in Europe: Final Report | 19
Ricardo in Confidence Ref: Ricardo/ED60721/Issue Number 1
Ricardo Energy & Environment
Platform and by the UNECE Working Party 1 on Road Safety to evaluate the legal obstacles for new technologies and make recommendations on updates to or compatibility with existing legislation.
Further development of system reliability, quality, and durability is needed: There are a variety of technical issues that are being addressed – including frequencies, hybrid communication, decentralised congestion control and interfaces for access to services and vehicle resources. There has been significant progress in carrying out the necessary preparatory work, notably in relation to "ID management". However, there are still open issues related to “misbehaviour detection” (European Commission C-ITS Platform, 2015). On the side of public acceptability, communication and education is needed to inform the public about the technological possibilities, benefits, and contribution to societal goals in order to ensure acceptance and mitigate fears.
Stakeholders have other funding priorities and budget constraints: In the past, the Commission has given substantial support to the development of C-ITS via research and development funding. Ongoing funding is available through Horizon 2020 and infrastructure funds. There is now a need to focus on the commercialisation and market deployment of technologies, for which a different emphasis is required.
Figure 3-2 - Problem tree
The impacts at the EU level stem from the central issue that the deployment of C-ITS technologies is fragmented and delayed. The consequences are concerned with the loss or postponement of potential benefits that could be achieved with a more coordinated approach. These impacts represent the risks of inaction.
Study on the Deployment of C-ITS in Europe: Final Report | 20
Ricardo in Confidence Ref: Ricardo/ED60721/Issue Number 1
Ricardo Energy & Environment
4 Case studies
4.1 Overview
A series of nine case studies were carried out, aiming to understand the approach adopted in different deployment projects, international markets and across different key issues in supporting the deployment of C-ITS, as well as the key challenges and best practice from each market which may be relevant to the European context. For each case study, a detailed desk-based analysis of the market in question was carried out, followed by at least one interview with a key local stakeholder using targeted questions to guide the conversation.
The case study outputs produced also helped to improve our understanding of existing national funding and policy initiatives designed to support C-ITS, as well as providing data into the development of the baseline and deployment scenarios
The full list of case studies carried out is as follows:
Consortia:
o Car2Car Communication Consortium: a non-profit, industry-driven organisation initiated by European vehicle manufacturers, first founded in 2002 with the primary objectives of securing a royalty-free frequency band for V2X and standardisation.
o Amsterdam Group: a strategic alliance with the objective to facilitate joint deployment of C-ITS in Europe in recognition of the fact that deployment needs a multi-stakeholder cooperation.
Deployment projects:
o С-ITS deployment corridor NL-DE-AT: joint deployment initiative of a C-ITS corridor between Vienna, Munich/Frankfurt and Rotterdam
o С-ITS initiative SCOOP@F: a pre-deployment project for various C-ITS technologies based in France, following successful completion of the field test project SCORE@F.
A number of national markets:
o UK
o Czech Republic
o USA
o Australia
ITS-G5: a European set of protocols and parameters for V2V and V2I communications based on the IEEE standard 802.11p on wireless access in vehicular environments.
4.2 High-level summary of outcomes
A detailed summary of each case study is included in Annex C: Case studies. Overall, the case study results show that C-ITS is a wide, technically complex field, which means that developing an interoperable, future-proofed and secure system with involvement from a large variety of stakeholders and Member States poses a significant challenge.
The process of C-ITS deployment requires strong cooperation amongst stakeholders and the EU Member States. The Commission is aware of the challenge and is viewed as a supportive element in the process. Some lessons can be learned from Japan and the USA on overcoming technical issues in deployment and multi-party coordination challenges, respectively.

Study on the Deployment of C-ITS in Europe: Final Report | 21
Ricardo in Confidence Ref: Ricardo/ED60721/Issue Number 1
Ricardo Energy & Environment
5 Assessment of impacts
Three key categories of impact-related outputs have been produced by the cost-benefit-analysis (CBA):
Environmental impacts:
o Fuel consumption and CO2 emissions
o Air quality
Social impacts:
o Health and safety
o Jobs and employment market
o Privacy and personal data
Economic impacts:
o Direct economic impacts
o Secondary impacts such as changes in competitiveness, congestion, reliability and distributional impacts
o Impacts on GDP.
Note the sub-categories listed in italics represent outputs that are only discussed qualitatively, rather than as direct quantitative outputs from the modelling as for the other sub-categories. These qualitative impacts are discussed in Section 5.2.
5.1 Modelling outputs
The quantitative modelling outputs from the ASTRA/TRUST models and post-processing CBA model are discussed in this section, both in absolute terms (e.g. the total number of fatalities avoided) and in monetised terms (e.g. the equivalent societal benefit in € of the reduction in fatalities, based on the external cost of fatalities). All costs and benefits are quoted in 2015 prices, using a 4% social discount rate for future costs/benefits.
The majority of the systems deployed to support the rollout of C-ITS services are currently at a relatively early stage of maturity and costs are likely to improve through time. To account for this, an initial learning rate of 10% is applied to all up-front costs for personal, in-vehicle and roadside ITS sub-systems. That is, for every doubling in installed volume, up-front costs reduce by 10%. This learning rate is applied until costs have dropped by 20% (with a cap of a maximum 10% per year cost reductions), after which learning rates are reduced to 3% per doubling of installed capacity. These learning rates are based on an analysis of low CO2 technologies performed by the US EPA and NHTSA, which states that different learning rates apply depending on the level of maturity of the technology (US EPA, NHTSA, 2012).
It should be noted that the outputs discussed in this section are based on a modelling exercise that builds on a large consultation exercise and data collection from a variety of sources. As a result of this diversity, there is some uncertainty in the outputs produced – the key areas of uncertainty and their likely impact on overall outputs are discussed in each relevant results section, whilst a sensitivity analysis on uptake and penetration rates is discussed in Section 5.3.2.
5.1.1 Scenario overview
As discussed in Section 2.3, five main scenarios were developed for modelling purposes, each representing an increase in penetration of C-ITS services across Europe, compared to the previous scenario. The main distinctions between the five scenarios are described below:
Scenario A:
o Bundle 1 safety-based V2V services are deployed
o Bundle 5 (traffic information and smart routing) deployed to equipped TEN-T corridors and core roads in passenger cars
Scenario B:
o Roadside infrastructure extends to all specified motorways and inter-urban roads

Study on the Deployment of C-ITS in Europe: Final Report | 22
Ricardo in Confidence Ref: Ricardo/ED60721/Issue Number 1
Ricardo Energy & Environment
o V2I services from bundle 2 (mainly motorway-based services) are deployed to equipped roads
o Bundle 5 (Traffic information and smart routing) extends to equipped roads
Scenario C:
o Urban deployments begin for bundles 2, 3 (intersection-related services), 4 (parking information) and 5 (traffic information/smart routing)
o Buses equipped with bundle 1 safety-based V2V services
Scenario D: Bundle 6 (loading zone management) deployed to freight vehicles
Scenario E: Bundles 7-9 (day 1.5 V2X services) are deployed across all vehicle types.
Clearly, a wide range of input data and assumptions (as described in Section 2.4.3.4) feed into the modelling for each scenario. The inputs with the largest uncertainties and which have the biggest impact on the outputs produced are the penetration/uptake assumptions. In order to minimise the impact of variations in these assumptions, three sensitivities (‘low’, ‘medium’ and ‘high’) were developed for each of the five scenarios described above, with each showing a varying degree of ambition with respect to deployment levels.
In order to be able to easily compare the various impact categories from the CBA, the outputs included in this section are all presented for the ‘central’ sensitivity Scenario E. This ensures that all the benefits associated with the various bundles are discussed. A comparison between scenarios and between the various sensitivities is included in Section 5.3 below.
5.1.2 Economic impacts
In order to fully understand the costs associated with the deployment of C-ITS services, it is necessary to consider the cost of the hardware/devices and associated software and services used to facilitate those C-ITS services. These devices are broadly categorised into four types3 (as discussed in Section 2.4.3 above), i.e. central, personal, in-vehicle and roadside ITS sub-systems. The analysis of economic impacts in this Section is therefore divided into the four ITS sub-systems described above.
5.1.2.1 Overview
The economic impacts evaluated in the CBA are mainly driven by the equipment costs for the technologies required to support the deployment of C-ITS services. These include costs associated with in-vehicle, personal, roadside and central ITS sub-systems and were evaluated as part of the ASTRA/TRUST output post-processing.
Figure 5-1 shows the annual and cumulative deployment of C-ITS systems to 2030 over and above the baseline for Scenario E ‘central’. In comparison with the baseline, additional annual deployment increases rapidly ramping up to c. 30 million new vehicles (in-vehicle ITS sub-systems) and 15 million aftermarket devices (personal ITS sub-systems) equipped to offer C-ITS services by 2023. The sudden drop in aftermarket device sales from 2026 reflects the market saturating due to the growing stock of factory-equipped vehicles, as can be seen on the cumulative chart which shows total vehicles equipped by that point in time approaching the total stock of European vehicles. In reality this drop-off would occur more gradually, but the overall effect on the CBA of this modelling construct is minimal.
Infrastructure (roadside ITS sub-system) deployment ramps up rapidly beyond 2020 with c. 11,000 roadside units deployed in urban and inter-urban areas respectively up to 2026 when maximum penetration is achieved. Beyond this, a small turnover of replacement systems is seen as the older vintage installations reach the end of their lifetime.
3 ERTICO, “Communication Technologies for future C-ITS service scenarios” (2015)

Study on the Deployment of C-ITS in Europe: Final Report | 23
Ricardo in Confidence Ref: Ricardo/ED60721/Issue Number 1
Ricardo Energy & Environment
Figure 5-1 - Scenario E ‘central’ total additional annual and cumulative deployments relative to baseline
Total ongoing costs for Scenario E ‘central’ increase rapidly from 2018 onwards, in line with the first vehicle deployments, peaking around €3.2bn per year in 2023, after which costs drop to around €2.5bn per year from 2027, as shown in Figure 5-2 below.
Figure 5-2 - Scenario E ‘central’ total additional annual equipment costs relative to baseline
5.1.2.2 In-vehicle ITS sub-systems
As shown in Figure 5-2, by far the dominant cost item is the new vehicle (in-vehicle ITS sub-system) cost which makes up €2.6bn of the €3.2bn peak cost. Costs ramp up rapidly from 2018 onwards
0
5
10
15
20
25
0
5
10
15
20
25
30
35
2015 2020 2025 2030
An
nu
al
infr
astr
uctu
re (
tho
us
an
ds
)
An
nu
al
veh
icle
s (
mil
lio
ns
) Infrastructure -new
Infrastructure -upgrades
New vehicles
Total vehicles
Aftermarket
0
20
40
60
80
100
120
140
160
0
50
100
150
200
250
300
350
2015 2020 2025 2030
Cu
ula
tive in
frastr
uctu
re (
tho
us
an
ds
)
Cu
mu
lati
ve v
eh
icle
s (
mil
lio
ns
)
Infrastructure- new
Infrastructure- upgrades
New vehicles
Aftermarket
Total vehicles
€ 0.0
€ 0.5
€ 1.0
€ 1.5
€ 2.0
€ 2.5
€ 3.0
€ 3.5
2015 2017 2019 2021 2023 2025 2027 2029
Bil
lio
ns
New vehicles
Aftermarket
Infrastructure- upgrades
Infrastructure- new
Central ITSsub-systems
Total

Study on the Deployment of C-ITS in Europe: Final Report | 24
Ricardo in Confidence Ref: Ricardo/ED60721/Issue Number 1
Ricardo Energy & Environment
reflecting the rapid move towards all new vehicles being equipped with C-ITS service capability by 2025. Costs level off around €2.6bn per year after 2023, mainly due to the technology learning rates bringing down unit costs and discounting of future costs, despite a gradual increase in annual vehicle sales. Note that total costs appear lower than new vehicle costs from 2026 onwards due to the fact that aftermarket costs turn negative relative to the baseline from this point onwards, in view of the rapid drop-off described above. Again, this is a modelling construct and in reality the drop-off in aftermarket sales would be more gradual and would likely continue to be higher than the baseline scenario.
Total up-front costs in 2015 to the consumer to equip new vehicles with the technology required to deliver C-ITS services are estimated at c. €270-280 per passenger car and c. €300-315 per vehicle for freight vehicles and buses. Ongoing costs of c. €19-22 per passenger car per year, or €27-31 per vehicle for freight vehicles and buses are also applied. Technology learning rates result in up-front costs reducing to €170-190 per passenger car by 2030, and €200-210 for freight and buses. The numbers for passenger cars are broadly in line with estimates from a number of studies in the US and Europe, although costs for freight and buses are not readily available for comparison. All figures have been peer-reviewed by the WG1 Platform members over the course of this project.
Whilst we have attempted to include all in-vehicle equipment and installation costs based on an extensive literature review and estimated vehicle integration and software integration costs based on a consultation with WG1 experts, there remains some uncertainty around in-vehicle costs due to the nascent nature of the market. Additionally, there may some second-order impacts on vehicle running costs such as lower insurance costs due to a lower risk of accidents; however there is insufficient data available to support these assumptions so they have not been included in the modelling.
Whilst we have not performed a full sensitivity analysis on cost to account for this uncertainty (given that the main uncertainty in the modelling is linked to uptake/penetration numbers), the impact of a +/- 50% variation on in-vehicle costs can be estimated at around +/- €1.25bn per year in 2030. Although not an insignificant variation, the impact of this on the overall benefit-cost ratio (BCR – as discussed in Section 5.1.7) is likely to be limited due to the much larger magnitude of the benefits achieved.
5.1.2.3 Personal ITS sub-systems
Aftermarket devices (personal ITS sub-systems) make the second biggest contribution to overall costs, with 22:78% split of cumulative 2030 costs between smartphone-related data costs and personal navigation device (PNDs) up-front purchase costs respectively. There is a rapid ramp-up of costs from 2020 to c. €700mn per year when aftermarket devices begin to be deployed, followed by a gradual decline in expenditure as prices decline due to technology learning and discount rates take effect.
The sudden drop in expenditure from 2026 reflects the market saturating due to the growing stock of factory-equipped vehicles. In reality this drop-off would occur more gradually, but the overall effect on economic impacts would be minimal.
There is some uncertainty around what form aftermarket C-ITS devices will take (the assumption in this study is that they will be provided either through mobile smartphone applications or personal navigation devices (PNDs) – see Section 2.4.3.2), their costs, as well as the business model that might be used to deliver the services. This must be taken into account when interpreting results, however even a +/-50% variation in costs can be estimated to have a maximum impact of around +/- €350mn per year in the peak year 2021, which is unlikely to have a significant impact on the overall BCR due to the much larger magnitude of the benefits available.
5.1.2.4 Roadside ITS sub-systems
Roadside infrastructure (roadside ITS sub-systems) make up only a relatively small contribution to overall economic impact, dominated by new roadside infrastructure (on inter-urban roads) which contributes up to €110mn per year of cost during the infrastructure rollout phase (2020-2026), or 87% of total roadside infrastructure costs in the peak year 2021.
Roadside infrastructure upgrade costs in urban areas peak later due to the later ramp-up in the rollout of infrastructure in urban areas, with a peak cost of €35mn in 2025 (or 20% of overall infrastructure costs in that year). The lower contribution to overall infrastructure costs from upgrades is due the lower cost of these units despite similar annual installation numbers as for new roadside infrastructure.
Total up-front costs in 2015 for new and upgraded roadside infrastructure are estimated at c. €14,000 and €4,500 respectively, with c. €600 and €400 per year ongoing costs respectively also applied. Technology learning rates result in up-front costs reducing to c. €9,000 and €3,000 respectively by

Study on the Deployment of C-ITS in Europe: Final Report | 25
Ricardo in Confidence Ref: Ricardo/ED60721/Issue Number 1
Ricardo Energy & Environment
2030. These numbers are broadly in-line with estimates from a number of studies in the US and Europe and have been peer-reviewed by the WG1 Platform members over the course of this project.
However, some uncertainty remains about the real cost of roadside infrastructure deployment. In particular, there is little evidence to support an estimation of the specific savings or additional costs that may need to be taken account when preparing a local or regional business case for the deployment of roadside ITS sub-systems. These may include for example:
Deploying the roadside ITS sub-systems alongside other planned infrastructure upgrades, thereby reducing the costs associated with the C-ITS deployment (e.g. through spreading civil works costs more thinly).
The need to install power supplies in areas where this is not already present, thereby increasing costs in certain areas.
The need to keep existing traditional infrastructure and services in place and running in parallel with new C-ITS equipment and services, during a transitional period over which the gradual switch-over to C-ITS services occurs – thereby resulting in increased operational costs.
The cost of decommissioning roadside infrastructure that is made obsolete due to the advent of C-ITS services, which could add to the costs estimated above.
The cost of Internet Protocol enabled communications between road-side traffic signals and the central ITS sub-systems, where for some traffic signals it may be possible to reuse existing communications infrastructure, rather than install new systems, leading to a possible reduction in costs. Conversely, should Member States not already have IP enabled communications, the infrastructure could be reused for other ITS applications such as real time optimisation of traffic signals, or asset management, therefore increasing the business case for investment in infrastructure.
Given the relatively limited nature of the roadside ITS sub-system costs compared to in-vehicle and personal ITS sub-systems, it is unlikely that any of the above additional costs/benefits would have a major impact on the overall EU-level benefit-cost ratio (BCR) estimated from this study. Indeed a +/- 50% variation in costs would result in a +/- €77mn per year in the peak year 2021, a small fraction of overall costs which peak at €3.2bn per year in 2023.
However, whilst relatively insignificant at an EU-level, clearly the above areas of uncertainty will be very important to national highways agencies and urban transport authorities when making their local business case for investing in roadside infrastructure. Additional research may be required on a local/regional/national basis to evaluate these costs/benefits and these should be considered in any such local/regional/national analysis.
5.1.2.5 Central ITS sub-systems
The contribution to overall economic impact from central ITS sub-systems (i.e. integration costs to national traffic management centres, C-ITS app software development costs, etc.) is also relatively small, peaking during the infrastructure rollout at c. €45mn per year in 2021.
Total 2015 up-front costs for introducing central ITS sub-systems (i.e. integrating roadside ITS sub-systems into central management centres and existing infrastructure, developing software applications etc.) are estimated at c. €2.5mn, with c. €550,000 per year ongoing costs also applied. It is assumed that up to two central ITS sub-systems are required by Member States, introduced once infrastructure penetration reaches a certain level, as described in Section 2.4.3.4.
With limited data in the literature to support these assumptions, these numbers were estimated through consulting with WG1 Platform experts. Clearly this means there remains some uncertainty as to the exact cost of central ITS sub-systems.
Given the relatively limited nature of overall costs compared to in-vehicle and personal ITS sub-systems, it is unlikely that any of the above additional costs/benefits would have a major impact on the overall EU-level BCR estimated from this study. Indeed a +/- 50% variation in costs would result in a +/- €23mn per year in the peak year 2021, a small fraction of overall costs which peak at €3.2bn per year in 2023.
However, again the uncertainty in these numbers will be very important to national highways agencies and urban transport authorities when making their local business case for investing in central ITS sub-systems and further certainty will be required for any such local/regional/national analysis.

Study on the Deployment of C-ITS in Europe: Final Report | 26
Ricardo in Confidence Ref: Ricardo/ED60721/Issue Number 1
Ricardo Energy & Environment
5.1.3 Efficiency/time-related impacts
A number of C-ITS services (e.g. traffic signal priority, parking information, smart routing, etc.) lead to significant increases in average speed/reduced congestion by targeting some of the most important areas where delays occur. The impact on time spent driving was modelled in the ASTRA/TRUST modelling environment for passenger cars and buses in urban areas only, which is where these services are expected to have their biggest impact.
Overall, the impact of time saved in 2030 in Scenario E ‘central’ was estimated at approximately 2 billion hours per year, which equates to c. 3% of total time spent on roads, a significant reduction. The largest contribution (1.65 billion hours) comes from cars, due to the significantly larger amount of time spent in cars in the baseline (c. 55 billion hours for cars vs. 10 billion hours for buses), with the remainder coming from buses, as shown in Figure 5-3. The majority of these services come from bundles 3 (intersection-related services), 4 (parking information) and 5 (traffic information/smart routing).
Figure 5-3 - Scenario E ‘central’ total additional time savings relative to baseline
With the value of time assumed at €8.80 per hour in 2015 (Ricardo-AEA et al., 2014), the significant time savings above provide a large monetised benefit, equivalent to nearly €10bn per year in 2030. This benefits category provides the largest overall monetised contribution to the overall benefits achieved. It alone is equivalent to c. four times the total annual cost of the Scenario E ‘central’ deployment in 2030.
With such a large contribution (approximately 2/3) to total annual 2030 benefits, it is important to consider uncertainty in the modelling outputs for time-related impacts. Despite their significant beneficial potential, many of the urban-focused services such as ‘parking information’, ‘smart routing’ and ‘traffic signal priority’ which contribute strongly to the significant time-saving benefits observed from the modelling are relatively poorly-understood. In particular, limited or no data is available on the impacts of these services and as a result some of the impacts were estimated from first principles using data from non-C-ITS related literature and from consultation with industry experts.
Given the fact that a +/- 50% variation in impacts for these services could vary total benefits by +/- €5bn per year in 2030 (for Scenario E ‘central’) and could result in a the BCR swinging by up +/-2 around the 2030 estimate of c. 6, this points to a clear need to carry out further work to evaluate the impact of these services in more detail. Many of these services are urban-focused and whilst various field trials have been carried out on motorway-focused services, very few large-scale field trials have been carried out to assess the potential impacts of urban-focused services, pointing to the need for field trials in a number of European cities for relevant C-ITS services.
5.1.4 Safety impacts
Several C-ITS services (such as hazardous location warning, in-vehicle speed limits, intersection safety, etc.) specifically aim to improve road safety and to decrease both the number and the severity of accidents. These impacts were modelled in the ASTRA/TRUST modelling environment. Despite a
0.0
0.5
1.0
1.5
2.0
2.5
2015 2017 2019 2021 2023 2025 2027 2029
Tra
vel
tim
e (
bil
lio
n h
ou
rs)
Cars
Buses
Total

Study on the Deployment of C-ITS in Europe: Final Report | 27
Ricardo in Confidence Ref: Ricardo/ED60721/Issue Number 1
Ricardo Energy & Environment
significant reduction in accidents in the baseline (at a rate of c. 4.9% per year for fatalities and half this rate for other types of accidents4), significant further benefits are observed in all accident categories in Scenario E ‘central’, as shown in Figure 5-4. Compared to the baseline the impact on each accident category for the year 2030 was estimated at:
Fatalities: reduced by c. 600/year by 2030, representing a c. 7% reduction in estimated fatalities.
Serious injuries: reduced by c. 16,000/year by 2030, representing a c. 7% reduction in estimated serious injuries.
Minor injuries: reduced by c. 54,500/year by 2030, representing a c. 7% reduction in estimated minor injuries.
Material damages: reduced by c. 54,000/year by 2030, representing a c. 7% reduction in estimated material damages.
Figure 5-4 - Scenario E ‘central’ total additional accidents relative to baseline
Despite the relatively smaller reductions in serious injuries and fatalities compared to other accident types modelled, the societal costs of these types of serious accident are much higher than other accident categories. As such, the benefits for these two categories, alongside minor injuries, dominate the total monetised impacts of C-ITS services on safety.
The largest contributor to total monetised impacts are serious injuries with a c. €2.5bn monetised benefit per year in 2030, followed by minor injuries and fatalities at c. €750mn and €600mn respectively. Total monetised safety benefits are estimated at c. €4bn per year in 2030. On its own this benefit is sufficient to achieve a BCR of c. 1.6 in 2030 and this demonstrates the significant potential of C-ITS services to improve safety on European roads.
Accident-related benefits provide the second largest monetised benefit after time-related impacts and, whilst the impacts data that was collected to estimate the benefits from reduced accident rates was relatively robust (often being based on field trial data), any inaccuracies in this data could have a significant impact on the overall cost effectiveness estimates for C-ITS deployment in Europe. For example, a 50% over-estimation of safety-related impacts could result in benefits being over-estimated by up to €2bn in 2030, or 13% of total benefits in 2030 in Scenario E ‘central’ (resulting in the BCR reducing from c. 6 to 5.4). Conversely if the baseline assumption of a 4.9% annual reduction in accident rates proves overly-optimistic, accident-related benefits may be under-estimated.
4 This assumption is based on the CARE database and on projecting the latest (2013 and 2014) annual reductions in fatalities achieved into the future (CARE database, European Commission, 2015).
0
20
40
60
80
100
120
140
2015 2017 2019 2021 2023 2025 2027 2029
Th
ou
san
d a
ccid
en
ts
Fatalities
Seriousinjuries
Minor injuries
Materialdamages
Total

Study on the Deployment of C-ITS in Europe: Final Report | 28
Ricardo in Confidence Ref: Ricardo/ED60721/Issue Number 1
Ricardo Energy & Environment
Figure 5-5 - Scenario E ‘central’ total additional accident-related impacts relative to baseline
5.1.5 Fuel consumption and CO2 impacts
A number of C-ITS services are aimed at improving the smoothness of traffic flow (e.g. green light optimal speed advisory), or at reducing congestion and time spent travelling (e.g. smart routing, parking information, etc.). These services will in many cases contribute to improved fuel consumption and CO2 emissions, with these impacts captured by the ASTRA/TRUST modelling environment.
Outputs from the modelling estimate significant benefits in fuel consumption and CO2 emissions for C-ITS services, although these are not as large as those calculated for safety and time efficiency. As shown in Figure 5-6, a gradual improvement in fuel consumption and CO2 emissions is observed from 2021 onwards for Scenario E ‘central’:
Fuel consumption is reduced by c. 2.4 million toe/year by 2030, or c. 1.2% of baseline fuel consumption.
CO2 emissions are reduced by c. 7,500t/year by 2030, or c. 1.2% of baseline emissions.
Figure 5-6 - Scenario E ‘central’ total additional CO2 and fuel consumption relative to baseline
When the external costs of CO2 emissions and fuel consumption impacts are taken into account, fuel consumption benefits dominate due to the high value associated with fuel savings (c. €1mn per toe vs. €5 per tonne of CO2 in 2015). As a result total monetised fuel savings contribute c. €1.4bn of benefits
€ 0.0
€ 0.5
€ 1.0
€ 1.5
€ 2.0
€ 2.5
€ 3.0
€ 3.5
€ 4.0
€ 4.5
2015 2017 2019 2021 2023 2025 2027 2029
Bil
lio
ns
Fatalities
Seriousinjuries
Minor injuries
Materialdamages
Total
0
1,000
2,000
3,000
0
1
2
3
4
5
6
7
8
2015 2017 2019 2021 2023 2025 2027 2029
Fu
el co
ns
um
pti
on
(th
ou
san
d t
oe
)
CO
2 e
mis
sio
ns
(th
ou
san
d t
on
ne
s)
CO2 (tonnes)
Fuelconsumption(1,000's toe)

Study on the Deployment of C-ITS in Europe: Final Report | 29
Ricardo in Confidence Ref: Ricardo/ED60721/Issue Number 1
Ricardo Energy & Environment
per year by 2030, as shown in Figure 5-7, whilst as expected CO2 savings contribute only one tenth of this amount per year (€141mn).
Figure 5-7 - Scenario E ‘central’ total additional CO2 and fuel-related impacts relative to baseline
The benefits of fuel consumption and CO2 emission reductions are equivalent to over 50% of the total cost of the deployment in 2030 (i.e. they could achieve a BCR of 0.5 without any other benefits), which shows the importance of benefits in this impact category.
The above analysis assumes a relatively steady price of oil over the period 2015-2030 with only minor variations around the average of €1mn per 1,000 toe (E3MLab, 2014), as well as a low predicted CO2 prices which increase from c. €5/tonne in 2015 to c. €35/tonne in 2030. Clearly both of these elements are subject to market forces and predicting their value to 2030 can lead to a significant amount of uncertainty. For example:
A renewed oil shock could lead to a significant increase in the overall benefits achieved from fuel savings, whilst a sustained dip in oil prices as seen over the last 12 months could result in much reduced benefits.
A global agreement to introduce market-based climate change mechanisms could result in a significant increase in CO2 prices, significantly increasing the monetised benefits achieved from reduced emissions.
This strong variation must be taken into account in assessing the overall benefits of C-ITS services. However, even a +/-50% variation in the above estimates is unlikely to have a major impact on the overall EU-level BCR, given that the benefits are dominated by time- and accident-related benefits. Indeed a +/- 50% variation in benefits would result in a +/- €800mn per year variation in 2030, which is less than 6% of total expected benefits in that year.
5.1.6 Emissions impacts
The emissions impacts of individual C-ITS services are limited in percentage terms, with some services contributing an improvement and other services (e.g. those focused on achieving other impacts such as efficiency or safety impacts) even contributing to an increase in emissions. These impacts were modelled in the ASTRA/TRUST modelling environment.
Overall the impacts estimated were relatively small for Scenario E ‘central’ and were dominated by NOx and CO emissions savings, as described below:
NOx emissions are reduced by c. 4,500t/year by 2030, or c. 0.7% of baseline emissions in that year.
CO emissions are reduced by c. 4,300t/year by 2030, or c. 0.4% of baseline emissions.
VOC emissions are reduced by c. 700t/year by 2030, or c. 0.4% of baseline emissions.
PM emissions are reduced by c. 150t/year by 2030, or c. 0.5% of baseline emissions.
€ 0.0
€ 0.2
€ 0.4
€ 0.6
€ 0.8
€ 1.0
€ 1.2
€ 1.4
€ 1.6
€ 1.8
2015 2017 2019 2021 2023 2025 2027 2029
Bil
lio
ns
CO2
Fuelconsumption
Total

Study on the Deployment of C-ITS in Europe: Final Report | 30
Ricardo in Confidence Ref: Ricardo/ED60721/Issue Number 1
Ricardo Energy & Environment
Figure 5-8 - Scenario E ‘central’ total additional annual emission relative to baseline
Taking into account the monetised costs of emissions impacts, NOx and PM savings dominate due to the high value of each tonne saved for these emissions. Total emissions savings contribute c. €33mn of benefits per year by 2030, as shown in Figure 5-9. This is relatively insignificant in comparison to the total cost of the deployment, or benefits achieved from other impact categories.
Figure 5-9 - Scenario E ‘central’ total additional emissions-related impacts relative to baseline
Whilst the monetised emissions-related benefits of C-ITS services are estimated to be relatively minimal, a number of recent developments in Europe could contribute towards increasing the attractiveness of C-ITS services for their potential to tackle emissions, including:
With the emergence of the recent diesel NOx emissions scandal, there is strong evidence to suggest that actual engine emissions factors are being significantly underestimated, resulting in an overly-optimistic view of emissions caused by vehicles on European roads. Whilst the modelling takes into account ‘real life’ emissions factors, it does not account for any inaccurate emissions estimates from automotive OEMs. If baseline emissions were to be re-evaluated based on updated ‘real life’ emissions factors, the result could be significant increases in baseline emissions with a resulting significant increase in benefits achieved by eliminating those emissions using C-ITS services.
0
2
4
6
8
10
12
2015 2017 2019 2021 2023 2025 2027 2029
Th
ou
san
d t
on
ne
s
PM
NOx
VOC
CO
Total
€ 0
€ 5
€ 10
€ 15
€ 20
€ 25
€ 30
€ 35
2015 2017 2019 2021 2023 2025 2027 2029
Mil
lio
ns
PM
NOx
VOC
CO
Total

Study on the Deployment of C-ITS in Europe: Final Report | 31
Ricardo in Confidence Ref: Ricardo/ED60721/Issue Number 1
Ricardo Energy & Environment
At a more local level, a large number of cities in Europe are suffering from air quality problems, with emissions levels often far exceeding EU limit values in local areas. There is a growing group of cities that are planning to tackle these issues through a variety of ways, including introducing cleaner buses and taxis, introducing ultra-low emissions zones and supporting automotive technologies and services that can help to reduce overall emissions in problem areas. Should certain C-ITS services offer the opportunity to significantly reduce emissions from city centres, it is likely that their emissions benefits would be valued much higher than might otherwise be estimated using traditional external cost of transport conversion factors.
Whilst no concrete conclusions can be drawn today through these early developments in relation to C-ITS emissions-related benefits, these issues are likely to play a significant role in making the business case for deploying C-ITS services, particularly at a local city level.
5.1.7 Overall benefit-cost ratio
Based on the above analysis for scenario E ‘central’, it is clear that at an EU-level, overall benefits (at c. €15bn per year in 2030) far exceed total costs (at c. €2.5bn per year in 2030), with the overall BCR in 2030 achieved being in the region of 6:1. This illustrates that there is a strong argument for the deployment of C-ITS services in Europe.
Despite this number appearing very high, it is in line with other studies which have estimated BCRs in the range 1.5 to 6.8, as shown in the EasyWay and DRIVE C2X studies (Table 5-1). Whilst these numbers are slightly lower than the BCR estimated here, they cover a much smaller range of services than those covered by this study. An estimate of BCR from Scenarios A and B only (with a more limited range of services deployed) results in BCRs that are more in-line with the findings of these studies (2.7 and 3.1 respectively), as discussed in more detail in Section 5.3.1.
Table 5-1 - Benefit-cost ratio comparison with other EU C-ITS studies
Study Benefit-cost ratio
Comments
This study 5.4 – 7.4 Relatively high BCR is due to deployment of a wide range of C-ITS services which deliver benefits in a number of areas including safety, time savings and fuel consumption.
EasyWay 1.5 – 1.8
BCR varies depending on whether V2V focussed (1.5) or V2I focussed services (1.8) are deployed. Overall, a limited number of C-ITS services are assumed to be deployed in the EasyWay scenarios. The majority of benefits are attributed to reduction in time spent travelling.
DRIVE C2X 2.0 – 6.8
BCR varies depending on the level of penetration in cars in 2030. The low penetration scenario envisages 26% penetration, whereas the high scenario assumes 100% penetration. The majority of benefits are attributed to an increase in safety.
Sources: (TNO, 2014; EasyWay Cooperative Systems Task Force, 2012)
5.2 Other impacts
In addition to the quantified impacts assessed by the ASTRA/TRUST modelling environment and the subsequent CBA analysis, a number of additional impact categories were assessed either semi-quantitatively or qualitatively. These are discussed in this Section.
5.2.1 Distributional impacts
5.2.1.1 Assignment of costs and benefits
A full assessment of the business models, money transfers and assignment of the expenditure and benefits to the different key stakeholders involved in the deployment of C-ITS was not within the scope of this study. However, a number of important inferences can be drawn from the CBA outputs as to the distribution of benefits and expenditure amongst these stakeholders, as follows:

Study on the Deployment of C-ITS in Europe: Final Report | 32
Ricardo in Confidence Ref: Ricardo/ED60721/Issue Number 1
Ricardo Energy & Environment
Equipment providers and OEMs: Whilst significant investments will need to be made to develop the hardware, software and back-office systems required to deliver C-ITS services to various vehicles in Europe, the expectation is that all of these investments and the ongoing costs required to equip vehicles and infrastructure with C-ITS capability will be recovered from the end-users. Additionally, the development of new services has the potential to open up new business models for equipment providers and OEMs, for example through added value information or entertainment services – potentially providing a significant source of additional revenue for these stakeholders.
Highways agencies and urban transport authorities: It is likely that the majority of roadside and central ITS sub-system-related investments will be led by highways agencies and urban transport authorities, based on local business cases developed for each nation/region/city. Significant expenditure will be required to deploy all the roadside infrastructure required, back-office systems and applications, with no clear route for recovering this investment given that the majority of the benefits are societal. As such, new business models may need to be developed, or additional charges applied elsewhere (e.g. through road tolling, congestion charging, parking fees, etc.) to recover the investment costs in C-ITS. There is a clear need to develop a more detailed understanding of the local/regional/national business case and appropriate business models for these infrastructure deployments.
Vehicle operators and owners: Ultimately the increased cost of vehicles equipped to deliver C-ITS services, or the cost of aftermarket devices, or even the cost of roadside infrastructure is likely to be recovered from vehicle operators and owners, whether they be personal drivers or businesses. Whilst some of the benefits of C-ITS services may be felt directly (e.g. reduced time spent driving), others (e.g. reduced accidents or improved air quality) are societal benefits whose benefits may not be valued strongly by vehicle owners, thereby limiting their willingness to pay extra for these services. As such, other mechanisms may be required to encourage vehicle owners to adopt C-ITS services (e.g. through offering value-added or entertainment services), or to compensate them for any additional expenditure they must incur (e.g. through subsidies or incentives).
Local and national Governments: Given that the majority of the benefits of deploying C-ITS services are societal benefits, it is likely that Governments may benefit through e.g. improved tax revenue due to increased productivity in businesses, or reduced expenditure due to lower healthcare spending. It is not expected that Governments would bear any large portion of the deployment costs (assuming infrastructure deployment is private-sector led), although given the long investment time horizons needed to invest in C-ITS services, they may be asked to provide financing support to willing private sector investors.
Telecom operators: In the case of a cellular-led infrastructure rollout, it is likely that telecom operators would benefit significantly from increased data usage of their networks from vehicles accessing V2I services. This may be countered by a need to invest in upgrading networks to ensure strong coverage along major road networks, however any such expenditure would most likely be recovered from the vehicle operators/owners.
5.2.1.2 Transport expenditure by income group
The ASTRA model computes transport expenditure for different income segments. Since the relevance of transport expenditure and use of transport mode change across the segments, the variations of travel costs and times can affect such segments in different ways. The effects of the modelling scenarios are computed at a Member State level depending on inputs such as the different penetration of drivetrain technologies, the relevance of congestion, and the amount of emissions, before being aggregated at an EU level.
Overall the modelling estimates a small reduction (c. 1%) in transport expenditure across all income groups, with the impact being marginally higher in the ‘high’ income group, as shown in Table 5-2 below. No significant distributional impact on transport expenditure is therefore predicted.

Study on the Deployment of C-ITS in Europe: Final Report | 33
Ricardo in Confidence Ref: Ricardo/ED60721/Issue Number 1
Ricardo Energy & Environment
Table 5-2 - Impact on transport expenditure in 2030 – comparison of Scenario E ‘central’ with baseline
EU-27 transport expenditure in 2030
(€ per person/year) Low income Medium income High Income
Baseline 604.73 930.39 1317.05
Scenario E 'central' 599.90 921.53 1302.47
Reduction in transport expenditure 0.80% 0.95% 1.11%
5.2.2 Impacts on job creation
The deployment of C-ITS services could have an impact on job creation, as additional workers are likely to be required to support the manufacturing, installation, maintenance and operation of C-ITS systems. The impact on job creation is estimated using multipliers, since the use of general equilibrium models is not considered in the scope of this study. In general, the use of multipliers should be interpreted with caution because of the need to ensure additionality. Nevertheless, this analysis should give a guide to the potential magnitude of any employment impacts.
The impact on EU-28 employment in 2030 has been estimated to be an additional c. 25,000 jobs, taking into account employment effects for relevant industries based on the additional costs of deploying C-ITS services in Scenario E ‘central’ relative to the baseline. The steps used to estimate job-related impacts are as follows:
Additional annual cost of deploying C-ITS services in 2030 for Scenario E ‘central’: €2.4bn
Multiply this by the average employment effect for relevant industries (estimated to be 12.21 FTE change per €1.2mn of output)5 = (€2.42bn / €1.2mn) x 10.47 = c. 25,000 jobs
This is equivalent to approximately 0.012% of total EU-28 jobs (Eurostat, 2010), or c. 0.2% of total EU automotive employment (ACEA, 2014).
The number indirect jobs created can also be estimated via the use of employment multipliers, as shown in Table 5-3. Assuming an employment multiplier of 2.5 for the manufacture of motor vehicles results, an estimated 62,500 indirect jobs created due to the deployment of C-ITS services. The total direct and indirect jobs created represents c. 0.035% of total EU employment, or 0.5% of automotive employment.
Table 5-3 - Type I employment multipliers
Industry Employment multiplier (Type I)
Notes on scope
Manufacture of motor vehicles
2.0 – 3.1
A range of employment multipliers were found for the automotive industry. Many of the sources suggested an average employment multiplier of 2.5.
ICT 1.4 - 1.8 Recently estimated in a report published by DG CONNECT.
Sources: ICT sector multipliers from (DG CONNECT, 2012); Manufacture of motor vehicles multipliers from (Hungarian Ministry of Foreign Affairs and Trade, 2015; European Commission, 2014; ONS, 2014; The Conference Board, 2014)
5.2.3 Impacts on GDP and fuel duty revenue
When transport conditions are improved, Total Factor Productivity (TFP) is increased and this has a positive effect on potential GDP. C-ITS services can therefore influence TFP and GDP through reducing congestion and the cost of transport.
5 Source for employment effects: UK Office for National Statistics (ONS, 2014). Employment effect in 2010, in terms of FTE change per £1mn of output for the manufacture of electrical equipment = 11.21, for the manufacture of motor vehicles = 9.73. Average of the two industries is 10.47. Converting this to Euros gives an employment effect of 10.47 per €1.165mn (using an average GBP/EUR exchange rate of 1.1658 for the period 1 Jan 2010 – 31 Dec 2010).

Study on the Deployment of C-ITS in Europe: Final Report | 34
Ricardo in Confidence Ref: Ricardo/ED60721/Issue Number 1
Ricardo Energy & Environment
The ASTRA model includes transport as one determinant of TFP. Using the estimates of impacts on congestion and on costs, the input of ASTRA has been adapted to reflect the improvements of transport conditions. The model then provides a quantitative calculation of the impact on GDP growth.
A very small positive effect (0.01%) on GDP is seen in later years of the CBA, as deployment of C-ITS services increases. Table 5-4 shows the differences between the baseline scenario and Scenario E ‘central’, as computed by the ASTRA model. By 2030, the impact on GDP is estimated to be c. €1.8bn. A key factor contributing to this is likely to be the increased traffic efficiency, as highlighted in Section 5.1.3. Note that this does not include the GVA estimated from the deployment costs and benefits of C-ITS estimated from the CBA.
Table 5-4 - Impact on GDP – comparison of Scenario E ‘central’ with baseline
EU-27 GDP
(€mn per year) 2015 2020 2025 2030
Baseline 12,429,115 13,949,713 15,137,592 16,184,179
Scenario E ‘central’ 12,429,115 13,949,746 15,138,494 16,185,956
% change 0.00% 0.00% 0.01% 0.01%
Additionally, fuel duty revenues (a revenue for Governments, but a burden for motorists) are quantified in ASTRA, the results show a c. 1% reduction in fuel duty revenues by 2030 for Scenario E ‘central’, as shown in Table 5-5 below.
Table 5-5 - Impact on fuel duty revenues - comparison of Scenario E 'central' with baseline
EU-27 fuel duty revenues
(€mn per year) 2015 2020 2025 2030
Baseline 153048 146593 142557 146422
Scenario E 'central' 153048 146585 141794 145034
% reduction in fuel duty revenues 0.00% 0.01% 0.53% 0.95%
5.2.4 Modal shift
As discussed in Section 5.1.3, the deployment of C-ITS services was estimated to result in an improvement in traffic efficiency in Scenario E ‘central’. The ASTRA model is able to evaluate the impacts of changes in travel time and cost on modal split. Table 5-6 shows that time related benefits for both passenger cars and buses are likely to result in a slight modal shift (as computed by the ASTRA model) away from trains and air travel to these modes of transport due to the improved traffic efficiency.
Table 5-6 - Impact on modal shift – comparison of Scenario E ‘central’ with baseline
EU-27 Passenger mode split (%)
computed on passenger-km Car Bus Train Air Slow
Baseline 69.6862 7.0232 8.3823 9.4804 5.4279
Scenario E ‘central’ 69.7988 7.0245 8.2946 9.4504 5.4318
% change 0.16% 0.02% -1.05% -0.32% 0.07%
5.2.5 Other relevant impact categories
Impacts on job quality: This aspect is considered to be of particular importance to workers who spend a large part of their working hours in vehicles, such as truck drivers, taxi drivers, coach drivers etc. Impacts on job quality in the following areas are envisaged due to the deployment of C-ITS services:
o Working conditions: potential improvements in comfort of travel.
Study on the Deployment of C-ITS in Europe: Final Report | 35
Ricardo in Confidence Ref: Ricardo/ED60721/Issue Number 1
Ricardo Energy & Environment
o Working time: potential reductions in working time due to avoidance of congestion, easier location of parking areas and rest areas, more efficient routing etc.
o Protection of workers: due to uptake of safety-related C-ITS technologies.
o Impact on pay: potential increase in pay due to bonuses for reduced transit time, higher income due to less time spent in traffic (e.g. for taxi drivers).
The majority of the C-ITS services evaluated in this study can impact on the job quality issues discussed above.
Impacts on vulnerable road users: Many of the C-ITS services deployed in the scenarios aim to improve safety and reduce both the frequency and severity of accidents. A large percentage of road accidents currently affect vulnerable road users, therefore an overall improvement in road safety is likely to have a positive impact on the safety of vulnerable road users. Furthermore, a number of services described in this study specifically target vulnerable road users and these services directly impact the safety of vulnerable road users. For example, the vulnerable road user protection service aims to protect pedestrians and cyclists, whereas the motorcycle approaching indication aims to increase driver awareness of motorcyclists.
Impacts on privacy and personal data: The impacts on privacy and personal data can be considered in the context of the types of C-ITS services being deployed in each scenario, and the assumed policy framework to protect fundamental rights at the EU level as assessed in the previous tasks. The following aspects of C-ITS services should typically be assessed when planning C-ITS service deployments:
o Whether and how C-ITS deployment could augment existing – or create additional – paths of cyber-attack.
o Availability and appropriateness of measures to mitigate cyber-attack risks specific to C-ITS technologies.
o Access to tracking data on speed and location.
o Whether the system collects financial information, personal communications, or other information linked to individuals.
Impacts on privacy and personal data are extensively discussed in the literature and are the subject of discussions in the various standards bodies developing standards for the communications protocols needed to support C-ITS services. As such, privacy and personal data issues are not discussed in detail here.
Impacts on SMEs: Deployment of C-ITS services is likely to have an impact on SMEs. In particular, on the supply side it is envisaged that SMEs will have a role to play in the installation and maintenance of the technologies that support C-ITS deployment. Where transport plays a key role in the business, SMEs may also benefit from time efficiencies delivered by C-ITS services. On the other hand, it is also possible that SMEs may experience delayed access to C-ITS services, since SMEs typically have smaller resources compared to larger companies (and typically purchase second-hand commercial vehicles rather than new). However, access will still be possible via aftermarket devices.
5.3 Comparison between scenarios
5.3.1 Scenario comparison
As discussed in Sections 2.3 and 5.1.1, five main scenarios were developed in conjunction with the C-ITS Platform WG1 for modelling purposes, each representing an increase in penetration of C-ITS services across Europe compared to the previous scenario. Each scenario was designed to be independent and additional in order to allow easy comparison between scenarios.
Whilst the previous section evaluated the detailed costs and benefits for Scenario E, this section compares the overall costs and benefits estimated for Scenarios A-E in the ‘central’ sensitivity. The following Section 5.3.2 makes a comparison between the three sensitivities.
5.3.1.1 Scenario costs
As can be seen from Figure 5-10 the variation in costs between scenarios is only a fraction of overall costs, for example Scenario E total annual costs in 2030 are only 1.8% higher than Scenario A costs in 2030. The main reason for this is that in order to deliver the services in Scenario A (mainly Bundle 1

Study on the Deployment of C-ITS in Europe: Final Report | 36
Ricardo in Confidence Ref: Ricardo/ED60721/Issue Number 1
Ricardo Energy & Environment
V2V services, with some Bundle 5 V2I), all of the in-vehicle ITS sub-systems and personal ITS sub-systems needed to support V2V and V2I communications are required in the targeted vehicles (passenger cars and freight vehicles in Scenario A). Once these in-vehicle and personal ITS sub-systems are deployed, all additional V2V and V2I services can be rolled out to these vehicles in subsequent scenarios, but without the need for additional in-vehicle equipment costs.
Figure 5-10 - Total annual additional equipment costs relative to baseline
As such, the main differences between Scenario A and subsequent scenarios in terms of economic impact are the additional costs of rolling out personal and roadside ITS sub-systems as these systems begin to be deployed through Scenarios B and C, as well as the cost of equipping buses with in-vehicle ITS sub-systems in Scenario C. These additional costs can be seen in particular in the slightly higher peak costs observed from one Scenario to the next in 2023.
However, as discussed in Section 5.1.2, the dominant cost category for the rollout of C-ITS services is that of in-vehicle ITS sub-systems (making up 95% of total annual costs in 2030 and 82% of cumulative costs to 2030 in Scenario E ‘central’), followed by personal, roadside and central ITS sub-systems. Given this sequence and the fact that most in-vehicle ITS sub-systems are deployed in Scenario A, it is not surprising that the difference in total costs between scenarios is so small. The small observed difference in costs between scenarios indicates the significant up-front investment that is required to deliver any number of C-ITS services and supports the idea of deploying as many C-ITS services as possible to generate increased benefits to support the initial investment.
However, it must be noted that the business model assumed for the deployment of different C-ITS service bundles is the ‘free’ model (see Sections 13.3.1.1 and 13.4.1.1 in Annex G). Additionally, it is assumed that all roadside infrastructure deployed is compatible with all C-ITS service bundles and that no additional costs are incurred for additional bundle deployments (see Sections 13.5.1.1 and 13.5.2.1 in Annex G). Clearly if these assumptions were changed, a larger discrepancy in costs between scenarios would be observed.
5.3.1.2 Scenario benefits
The variation in benefits between scenarios paints a very different picture to the variation in costs, with significant variation in benefits between scenarios. As additional services are rolled out, we see a sequence as follows (also shown in Figure 5-11):
Scenario A: total annual benefits achieved in 2030 are estimated at c. €6.6bn per year, due mainly to safety and time-related benefits associated with the deployment of Bundle 1 (V2V safety services) in passenger and freight vehicles and Bundle 5 (traffic information and smart routing) to equipped TEN-T corridors/ core roads in passenger cars.
Scenario B: an increase in total annual benefits achieved in 2030 to c. €7.9bn per year due to improved safety, time and fuel efficiency benefits, as roadside infrastructure extends to all
0.0 €
0.5 €
1.0 €
1.5 €
2.0 €
2.5 €
3.0 €
3.5 €
2015 2017 2019 2021 2023 2025 2027 2029
Co
st
(Bil
lio
ns
)
Scenario A
Scenario B
Scenario C
Scenario D
Scenario E

Study on the Deployment of C-ITS in Europe: Final Report | 37
Ricardo in Confidence Ref: Ricardo/ED60721/Issue Number 1
Ricardo Energy & Environment
specified motorways and inter-urban roads and V2I services from Bundle 2 and 5 (motorway-based services and traffic information/smart routing) are deployed to equipped roads.
Scenario C: an almost doubling in total annual benefits achieved in 2030, estimated at c. €15.4bn per year as urban deployments begin for Bundles 3 (intersection-related services), 4 (parking information) and 5 (traffic information/smart routing), with the significant time- and fuel-saving benefits that they bring and additional safety benefits from the increased extent of Bundle 2 (motorway services).
Scenario D: a relatively small increase in total annual benefits achieved in 2030, estimated at c. €15.45bn per year as Bundle 6 (loading zone management) with associated time and fuel efficiency benefits is deployed to freight vehicles
Scenario E: another relatively small increase in total annual benefits achieved in 2030, estimated at €15.5bn as Bundles 7-9 (day 1.5 V2X services) with associated safety benefits are deployed across all vehicle types, but only from 2025 – resulting in minimal ‘network’ effects by 2030 due to the small stock of vehicles equipped in that 5 year period.
Figure 5-11 - Total annual additional benefits relative to baseline
The significant difference in benefits between scenarios reflects the growing impact of new services deployed from one scenario to the next, as well as their effectiveness increasing due to increasing infrastructure coverage. As discussed above, costs do not show much variation between scenarios, whilst benefits grow rapidly, which suggests that there is a significant advantage to deploying as many services as possible once the initial up-front investment has been made in ITS sub-systems.
Another interesting observation from the benefits analysis is the size of the difference between Scenarios B and C, with an almost doubling in benefits achieved by 2030 when C-ITS services are deployed in urban areas. This illustrates the importance of deploying services and their supporting infrastructure in cities in order to access the full range of benefits available from C-ITS. However, despite the clear advantages that these urban services could offer, the data available to support the analysis of urban services was considerably less robust than that for inter-urban services. Particularly for services such as parking information and smart routing, very little data was available in the literature to support the analysis. Given the significant benefits available from urban services, this points to a clear need for additional research and field trials to prove out the impacts of these services.
5.3.1.3 Net benefits and benefit-cost ratio (BCR)
The overall BCR for the various scenarios varies as shown in Figure 5-12 and summarised below:
Scenario A: BCR = 2.9 based on annual costs and benefits in 2030 or 1.0 based on cumulative costs and benefits to 2030
€ 0
€ 2
€ 4
€ 6
€ 8
€ 10
€ 12
€ 14
€ 16
2015 2017 2019 2021 2023 2025 2027 2029
To
tal
be
nefi
ts (
Bil
lio
ns
) Scenario A
Scenario B
Scenario C
Scenario D
Scenario E

Study on the Deployment of C-ITS in Europe: Final Report | 38
Ricardo in Confidence Ref: Ricardo/ED60721/Issue Number 1
Ricardo Energy & Environment
Scenario B: BCR = 3.2 based on annual costs and benefits in 2030 or 1.3 based on cumulative costs and benefits to 2030
Scenarios C-E: BCR = 6.1-6.2 based on annual costs and benefits in 2030 or 2.9 based on cumulative costs and benefits to 2030
Based on the above, clearly the deployment of C-ITS systems is cost-effective when viewed over a long-term (c. 10-15 years) time horizon.
Figure 5-12 - Benefit-cost ratio relative to baseline
As shown in Figure 5-13 however, net benefits turn negative in the first year after deployments begin in 2018, with the various Scenarios breaking even (on a cashflow basis) at different points between 2023 and 2027. Whilst all scenarios become strongly net beneficial by 2030, there is a varying degree of time spent in the investment ‘valley of death’, whereby significant investments are required early to access significant long-term benefits. Clearly this requires investors to have a long-term investment time horizon.
However, the bulk of the costs (in-vehicle costs, as discussed above) are likely to be borne by consumers, who typically do not have a long-term investment time horizon and do not always make investment decisions based on a rational analysis of the business case. Additionally, many of the benefits achieved are societal benefits (such as reduced accidents, reduced congestion, improved emissions performance, etc.), which different consumers will place a varying degree of value on. There may therefore be a need to encourage consumers to invest in higher up-front and running costs for their vehicles in order to access some of these benefits, e.g. through the provision of value-added services, or through highlighting the safety and health benefits of C-ITS services.
0.0
1.0
2.0
3.0
4.0
5.0
6.0
7.0
2015 2017 2019 2021 2023 2025 2027 2029
BC
R
Scenario A -annual
Scenario A -cumulative
Scenario B -annual
Scenario B -cumulative
Scenario E -annual
Scenario E -cumulative

Study on the Deployment of C-ITS in Europe: Final Report | 39
Ricardo in Confidence Ref: Ricardo/ED60721/Issue Number 1
Ricardo Energy & Environment
Figure 5-13 - Net benefits relative to baseline
5.3.2 Sensitivity analysis
As discussed in Section 5.1.1, in addition to the five main scenarios, three sensitivities were introduced to account for the uncertainty in uptake numbers assumed in the scenario definition, as well as to evaluate the impact of cellular networks in providing the infrastructure for V2I services, as follows:
‘Central’ sensitivity: uptake and penetration rates for this sensitivity are summarised in Section 2.4.3 and are used as the basis of the analysis in the rest of this document.
‘Low’ sensitivity: this sensitivity was designed to represent a lower ambition for rollout of C-ITS services – changes made to all five scenarios include:
o In-vehicle and personal ITS sub-systems: Final penetration levels were kept constant relative to the ‘central’ sensitivity, but the deployment rates were spread out through time, i.e. for any penetration which takes 6 years to achieve in the ‘central’ scenario, this takes 10 years in the ‘low scenario’.
o Roadside ITS sub-systems: The same transformation in time was carried out for roadside ITS sub-systems, whilst the absolute final penetration rates across different road types were also lowered (see Annex E: C-ITS service and infrastructure uptake and penetration rates for a breakdown of uptake assumptions under all sensitivities).
‘High’ sensitivity: this sensitivity was designed to represent the impact of using the cellular network (with very high penetration from Day 1) to provide V2I services – changes made to all five scenarios include:
o In-vehicle and personal ITS sub-systems: These remained unchanged from the ‘central’ sensitivity.
o Roadside ITS sub-systems: Roadside infrastructure penetration for all inter-urban roads was set equal to cellular internet penetration in Europe, i.e. 97%, whilst urban infrastructure penetration was also increased to account for the use of cellular networks (see Annex E: C-ITS service and infrastructure uptake and penetration rates for a breakdown of uptake assumptions under all sensitivities).
This section compares the overall costs and benefit from the three sensitivities, for Scenario C, as shown in Figure 5-14 below.
5.3.2.1 ‘Low’ vs. ‘Central’ sensitivity
The more rapid and extensive deployment in the ‘central’ sensitivity results in a more rapid cost ramp-up than the ‘low’ sensitivity. However, given the ‘network’ effects of deploying larger numbers of vehicles and infrastructure, the impacts of C-ITS services are felt earlier and benefits accrue at a much faster rate. As a result, cashflow break-even is achieved in 2022 in the ‘central’ sensitivity, compared to 2026 for the ‘low’ sensitivity, with 2030 net benefits c. €1.5bn per year higher and a BCR of 6.1 vs. 5.4.
-€ 4
-€ 2
€ 0
€ 2
€ 4
€ 6
€ 8
€ 10
€ 12
€ 14
2015 2017 2019 2021 2023 2025 2027 2029
Net
be
nefi
ts (
Bil
lio
ns
)
Scenario A
Scenario B
Scenario C
Scenario D
Scenario E

Study on the Deployment of C-ITS in Europe: Final Report | 40
Ricardo in Confidence Ref: Ricardo/ED60721/Issue Number 1
Ricardo Energy & Environment
This clearly illustrates the advantages of a more rapid rollout, which allows the ‘network’ effects of C-ITS services to be felt earlier and achieves a more rapid break-even point.
Figure 5-14 - Net benefits for Scenario C relative to baseline
5.3.2.2 ‘High’ cellular-led C-ITS deployment
The impact of facilitating C-ITS services via the cellular network, rather than through dedicated roadside ITS sub-systems is that vehicles equipped with the capability to access V2I services will immediately be able to access these services across 97% of all road types. In reality it may be that certain smaller rural roads are not actually covered by cellular networks however, given the very low traffic flows on these roads, it is not expected that this would have a significant impact on modelling outputs, provided that all major roads are indeed covered.
Whilst savings are achieved from costs no-longer being incurred for inter-urban roadside ITS sub-systems, additional costs are incurred from vehicles accessing data on the cellular network. Somewhat surprisingly, the cost of the additional data exceeds the savings achieved through reduced infrastructure costs, as shown in Figure 5-15.
Figure 5-15 - Scenario C 'central' and 'high' cumulative costs comparison for roadside infrastructure vs. cellular data costs
However, the result of the significant additional coverage achieved through using the cellular network is that benefits from V2I services begin to accrue at a much faster rate than with a gradual roadside ITS sub-system rollout. These benefits significantly outweigh the additional costs incurred for data and cashflow break-even is achieved one year earlier than for the ‘central’ sensitivity and only three years after the initial vehicle deployments, making the investment a much more attractive proposition than in
-€ 5
€ 0
€ 5
€ 10
€ 15
€ 20
2015 2017 2019 2021 2023 2025 2027 2029
Net
be
nefi
ts (
Bil
lio
ns
) Scenario C'low'
Scenario C'central'
Scenario C'high'
0.0 €
0.2 €
0.4 €
0.6 €
0.8 €
1.0 €
1.2 €
1.4 €
1.6 €
2020 2020 2025 2025 2030 2030
Ccu
mu
lati
ve c
os
ts t
o 2
030 Bil
lio
ns
Central - total infrastructure High - total infrastructure High - in-vehicle data

Study on the Deployment of C-ITS in Europe: Final Report | 41
Ricardo in Confidence Ref: Ricardo/ED60721/Issue Number 1
Ricardo Energy & Environment
the ‘low’ and ‘central’ sensitivities. Annual net benefits in 2030 increase by over €5bn to €17.3bn, with the BCR increasing to 7.4 from 6.1.
The ‘high’ sensitivity illustrates the strong potential for cellular networks to improve the payback period and total benefits achieved from the deployment of C-ITS services through enabling much wider coverage of V2I services from day 1. Whilst many uncertainties remain around the possibility of using cellular networks in this way (including latency times for safety-based services, lack of understanding of future business models or roaming issues, costs, effect on individual service impacts, etc.), there is a clear argument for carrying out additional research and early deployment efforts in this area with the aim of clarifying uncertainties and supporting accelerated deployment of C-ITS services in Europe, with the associated improved benefits that this could bring.
Study on the Deployment of C-ITS in Europe: Final Report | 42
Ricardo in Confidence Ref: Ricardo/ED60721/Issue Number 1
Ricardo Energy & Environment
6 Conclusions and recommendations
Alongside an extensive literature review, case study assessment and problem definition, a detailed data collection and modelling exercise has provided a series of insights into the costs and benefits of deploying C-ITS services in Europe. Clearly the deployment of C-ITS services is beneficial at a European level, with benefit-cost-ratios (BCRs) in the rage of 2-8 achieved in 2030 across the full range of scenarios and sensitivities modelled. As such, C-ITS services can contribute significantly to the Europe 2020 goals and the strategic priorities of the Commission that have been published in its new work plan.
Whilst the scope of this study does not attempt to provide specific policy recommendations to the Commission, a number of clear conclusions and recommendations can be drawn from the outputs of the cost-benefit-analysis in particular, as well as from the case studies developed.
The main conclusions and recommendations from the study are summarised in the boxes below and can be used by DG MOVE and the C-ITS Platform to support the development of a shared vision and a common deployment strategy for C-ITS in Europe, as well as by DG MOVE in preparing a Commission Communication on the deployment of С-ITS.
A small number of cost and benefit categories dominate overall cost-effectiveness of C-ITS
The CBA analysis clearly illustrates the dominance of a small number of cost and benefit items to the overall cost-effectiveness of C-ITS services in Europe. In particular:
Dominant costs: the in-vehicle ITS sub-system costs, i.e. the costs of the hardware required to support the deployment C-ITS services to vehicles, make up by far the greatest portion of total costs of the C-ITS rollout (c. 86% of total cumulative costs to 2030 in Scenario E ‘central’), followed by personal ITS sub-systems, i.e. aftermarket devices, which make up c. 10% of total cumulative costs to 2030. Together these cost items make up over 96% of total cumulative costs in Scenario E ‘central’.
Dominant benefits: the biggest contributor to monetised benefits are benefits from reduced travel times/increased efficiency, totalling 66% of cumulative benefits to 2030 in Scenario E ‘central’, followed by reduced accident rates (22%) and fuel consumption savings (11%). Together these three elements make up c. 99% of total cumulative benefits in Scenario E ‘central’, with monetised benefits from emissions and CO2 savings being minimal.
There is a significant benefit from spreading initial investment costs across more services
In order to deploy even the most basic safety-related V2V and V2I C-ITS services, a significant investment is required in in-vehicle hardware/aftermarket devices and roadside infrastructure. The result is that when deploying a small number of services (as in Scenario A), costs ramp up rapidly, but benefits remain relatively low.
Whilst overall cost-effectiveness is still achieved (with an annual/cumulative BCR of 2.9 and 1.0 respectively for Scenario A ‘central’), adding additional services enables significant additional benefits to be accrued with minimal additional investment costs (e.g. Scenario E ‘central’ has an annual/cumulative BCR of 6.2 and 2.9 respectively with total cumulative costs only c. 4% higher).
More rapid deployment results in faster break-even due to ‘network’ effects
Through evaluating a number of sensitivities for the rollout rates of C-ITS in Europe, it has been established that increasing the rollout rate of C-ITS services and supporting infrastructure results in higher initial costs, but a more rapid break-even and better overall benefits. This due to the ‘network’ effects of larger numbers of equipped vehicles and infrastructure resulting in a much more rapid accrual of benefits in early deployment years.
For example, in Scenario C, cashflow break-even is achieved in 2022 in the ‘central’ sensitivity, compared to 2026 for the ‘low’ sensitivity, with 2030 net benefits c. €1.5bn per year higher and a

Study on the Deployment of C-ITS in Europe: Final Report | 43
Ricardo in Confidence Ref: Ricardo/ED60721/Issue Number 1
Ricardo Energy & Environment
higher BCR of 6.1 vs. 5.4 in the ‘central’ sensitivity – clearly demonstrating the benefits of targeting a more rapid rollout, to enable quicker payback periods and higher overall benefits.
Using cellular networks to provide V2I services can have immediate benefits
The ‘high’ sensitivity considered in the CBA analysis evaluated the impact of using the cellular network to provide V2I services, rather than dedicated roadside infrastructure – thereby achieving a very high infrastructure penetration across all roads from day 1. The results for Scenario C indicate a significantly faster ramp-up of benefits in the early years of deployment, with cashflow break-even occurring earlier and annual net benefits in 2030 increasing by over €5bn to €17.3bn, with the BCR increasing to 7.4 from 6.1.
Whilst many uncertainties remain around the possibility of using cellular networks in this way (including latency times for safety-based services, lack of understanding of future business models or roaming issues, costs, effect on individual service impacts, etc.), there is a clear argument for carrying out further work on this topic with the aim of clarifying uncertainties and supporting accelerated deployment of C-ITS services in Europe, with the associated improved benefits that this could bring.
C-ITS deployment is highly beneficial at an EU level, but coordinated action is required
The CBA analysis estimates very high BCRs for the deployment of C-ITS in Europe, for example a BCR of 6.2 annually or 2.9 cumulatively for Scenario E ‘central’ by 2030.
However, whilst many of the benefits are relatively long-term societal benefits which may be felt by a range of stakeholders, the main investors in the deployment are likely to be the consumers who pay for the C-ITS hardware on-board new vehicles, or in aftermarket devices, as well as the highways agencies/urban transport authorities that invest in infrastructure. As such, it is unlikely that C-ITS deployments and associated investment decisions will be made at a European level.
However, the success of C-ITS deployment relies on achieving significant ‘network’ effects through the rapid rollout of both vehicles and infrastructure across a large number of Member States. As such, strong coordination will be required to support a successful, widespread rollout across Europe, including:
Standards: Ensuring interoperability of services between regions within and between Member States will be essential for a successful rollout of C-ITS in Europe.
Industry: A wide range of industry players are preparing to enter the market for C-ITS services, many through already-established public-private partnerships aimed at removing the ‘chicken and egg’ situation of infrastructure and vehicle rollout, as well as ensuring a coordinated approach to deployment. Continued cooperation through these channels will be essential in ensuring a widespread and rapid rollout of C-ITS services aimed at maximising the benefits achievable.
Consumers: Consumers tend to have a relatively short-term time horizon when considering investment decisions, whilst many of the benefits accrued through the deployment of C-ITS services are longer-term and may not be felt by the consumer directly. As such, efforts must be made to provide services that provide added value to consumers, as well as to engage with consumers to highlight the less tangible benefits of investing in C-ITS, e.g. improved safety, health and travel times.
Highway agencies and urban transport authorities: Despite the fact that roadside ITS sub-system and associated traffic management system integration and software development costs make up only a small proportion of overall C-ITS deployment costs, at a local or regional level these investments may still make up a significant portion of investment budgets. Given the uncertainty in the cost data available for estimating these costs and the wide range of local factors that could impact individual business plans, there is a need for further work to evaluate the true costs and benefits of C-ITS deployments at a more local and regional level.

Study on the Deployment of C-ITS in Europe: Final Report | 44
Ricardo in Confidence Ref: Ricardo/ED60721/Issue Number 1
Ricardo Energy & Environment
National and European Government: the benefits of C-ITS deployment should be highlighted to key policymakers across Europe and any support required to facilitate the deployment of C-ITS (e.g. through standards, regulations, financial support, coordination support, etc.) should be requested in a timely manner and in a coordinated fashion.
Additional evidence is required in a number of fields to support the deployment of C-ITS
Whilst the data collection and stakeholder consultation exercise identified sufficient evidence to enable a full assessment of the costs and benefits of C-ITS services, evidence and data was significantly stronger in some areas than others. In particular data on the impacts of safety-related services was quite strong, whilst cost data for in-vehicle and roadside sub-systems was widely available. However, additional detailed assessments in a number of fields would benefit any future analysis, including:
Urban-related services: Despite urban-related services contributing c. 50% of total benefits achievable from the rollout of C-ITS (as measured in Scenario E ‘central’), the data behind the services which enable many of these benefits is very limited – particularly services such as ‘parking information’, ‘smart routing’, ‘traffic light optimisation’. etc. In order to confirm the benefits available from these services and support local investment decisions into the hardware and infrastructure required to support them, additional work is required, ideally in the form of field operational trials (FOTs) to prove the benefits in the real world.
Personal ITS sub-system (aftermarket device) costs: Whilst it is generally accepted that aftermarket devices will make up a significant portion of future sales, there is very little evidence to show what form these devices will take, nor what the likely costs or business models will be for these systems. The analysis in this study was based on simple business models and assumptions around adapting known devices (e.g. personal navigation devices and smartphones) to deliver C-ITS services, however additional work in this field, particularly around the likely services that could be offered via these devices, the business models associated with them, their likely market penetration and costs would be beneficial to any future analysis or real-life business planning.
Central ITS sub-system costs: Central ITS sub-systems refer to the back-office systems that would be required to link roadside units, vehicles and national/regional traffic management centres. There is a clear requirement for these systems to be developed for a successful rollout of C-ITS services, yet only limited information exists on their capabilities and costs. Additional research in this field, ideally based on planned/existing large-scale deployment trials would be beneficial.
Local and national costs and impacts: The analysis in this study assumes uniform impacts of services across all Member States and uniform costs for all hardware and infrastructure deployed. It is unlikely that this would be the case in practice due to the different driving practices, regulations and standards in place and the different business models and existing infrastructure in place across different Member States. As investors move towards developing business cases at a national/regional/local level for the deployment of C-ITS services, it is therefore essential that more localised data becomes available on both the costs and impacts of deploying C-ITS services. Ideally this data would come from additional FOT projects in a range of representative Member States.
Impact and cost data for vehicles other than passenger cars: Collection of input data for the cost-benefit analysis in this study highlighted the shortage of publically available data for freight vehicles and public transport, despite several European projects trialling C-ITS services in these types of vehicles. In the majority of cases, the analysis in this project assumed costs and impacts (safety, fuel consumption, emissions, and time related impacts) would be similar for all types of vehicles. Ideally, vehicle specific data collected from a range of FOT projects would be used for improved estimation of the potential costs and benefits of C-ITS services.
Overlap between services: The CBA analysis included a simple representation of service overlap to ensure that overall benefits estimated from multiple services with similar impact mechanisms being deployed concurrently were not over-estimated. However, the complex interactions between similar C-ITS services, or even non-C-ITS services with similar impact mechanisms are not well understood. Additional efforts should be made to more fully

Study on the Deployment of C-ITS in Europe: Final Report | 45
Ricardo in Confidence Ref: Ricardo/ED60721/Issue Number 1
Ricardo Energy & Environment
understand these issues, ideally through incorporating service overlap assessments into planned or future FOT projects. This will help to support the development of national or regional business cases for the widespread deployment of C-ITS services in Europe.

Study on the Deployment of C-ITS in Europe: Final Report | 46
Ricardo in Confidence Ref: Ricardo/ED60721/Issue Number 1
Ricardo Energy & Environment
Annexes:
Annex A: C-ITS service list
Annex B: List of European Projects
Annex C: Case studies
Annex D: Matrix approach
Annex E: C-ITS service and infrastructure uptake and penetration rates
Annex F: C-ITS service impact data
Annex G: C-ITS supporting technology and service costs
References

Study on the Deployment of C-ITS in Europe: Final Report | 47
Ricardo in Confidence Ref: Ricardo/ED60721/Issue Number 1
Ricardo Energy & Environment
7 Annex A: C-ITS service list
Safety EfficiencyVehicle
Operation
Environ
ment
Network
Type
C-ITS
Message
Basis
EBL
Emergency
electronic
brake light
1
The emergency electronic brake light is a service aimed at
preventing rear end collisions by informing drivers of hard braking
by vehicles ahead. Using this information, drivers will be better
prepared for slow traffic ahead and will be able to adjust their
speed accordingly.
Day 1 V2V X ITS-G5 DENM
Existing:
ETSI TS 101 539-1 Road Hazard Signaling (RHS)
clause 6.3.4
EVA
Emergency
vehicle
approaching
1
This service aims to give an early warning of approaching
emergency vehicles, prior to the siren or light bar being audible or
visible. This should allow vehicles extra time to clear the road for
emergency vehicles and help to reduce the number of unsafe
manoeuvres.
Day 1 V2V X ITS-G5DENM /
CAM
Existing:
ETSI TS 101 539-1 Road Hazard Signaling (RHS)
clause 6.3.1
HLN
Hazardous
location
notification
1
This service gives drivers an advance warning of upcoming
hazardous locations in the road. Examples of these hazards
include a sharp bend in the road, steep hill, pothole, obstacle, or
slippery road service. Using this information, drivers will be better
prepared for upcoming hazards and will be able to adjust their
speed accordingly.
Day 1 V2V X ITS-G5 DENM
Existing:
ETSI TS 101 539-1 Road Hazard Signaling (RHS)
clause 6.3.7
SSV
Slow or
stationary
vehicle(s)
1
Slow or stationary vehicle(s) warning is intended to deliver safety
benefits by warning approaching drivers about slow or
stationary/broken down vehicle(s) ahead, which may be acting as
obstacles in the road. The warning helps to prevent dangerous
manoeuvres as drivers will have more time to prepare for the
hazard. This service can also be referred to as car breakdown
warning.
Day 1 V2V X X ITS-G5DENM /
CAM
Existing:
ETSI TS 101 539-1 Road Hazard Signaling (RHS)
clauses 6.3.2 and 6.3.3
TJW
Traffic jam
ahead
warning
1
The Traffic Jam Ahead Warning (TJW) provides an alert to the
driver on approaching the tail end of a traffic jam at speed - for
example if it is hidden behind a hilltop or curve. This allows the
driver time to react safety to traffic jams before they might
otherwise have noticed them themselves. The primary objective is
to avoid rear end collisions that are caused by traffic jams on
highways.
Day 1 V2V X X ITS-G5 DENM
Existing:
ETSI TS 101 539-1 Road Hazard Signaling (RHS)
clause 6.3.8
VSGNIn-vehicle
signage 2
In-vehicle signage is a vehicle-to-infrastructure (V2I) service that
informs drivers of relevant road signs in the vehicle’s vicinity,
alerting drivers to signs that they may have missed, or may not be
able to see. The main purpose of this service is to provide
information, give advance warning of upcoming hazards and
increase driver awareness.
Day 1 V2I XITS-G5 /
CellularCAM
Under development:
CEN TS 17425 In-Vehicle signage
CEN TS 19321 Dictionary of in-vehicle information (IVI) data
structures
Category
V2V
/V2I
Service
Time-
frame
Service Bundle Standards and technical specificationsDescription
Communication
Method
Acronym
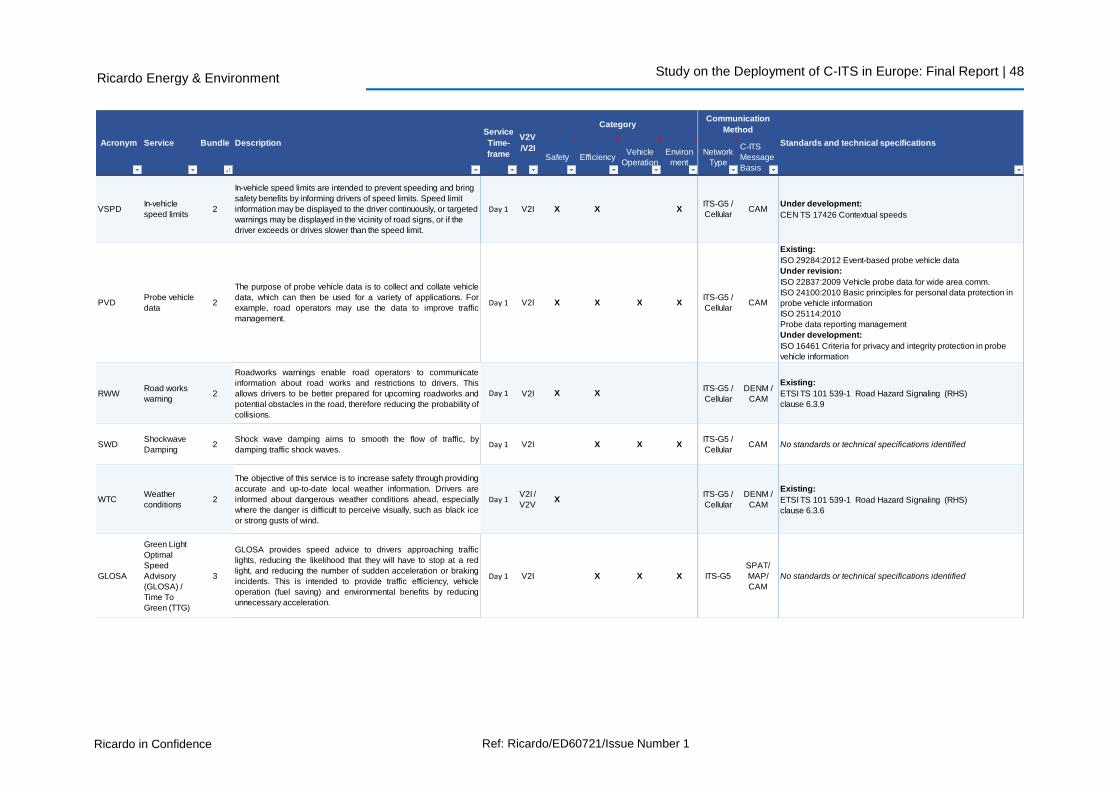
Study on the Deployment of C-ITS in Europe: Final Report | 48
Ricardo in Confidence Ref: Ricardo/ED60721/Issue Number 1
Ricardo Energy & Environment
Safety EfficiencyVehicle
Operation
Environ
ment
Network
Type
C-ITS
Message
Basis
VSPDIn-vehicle
speed limits 2
In-vehicle speed limits are intended to prevent speeding and bring
safety benefits by informing drivers of speed limits. Speed limit
information may be displayed to the driver continuously, or targeted
warnings may be displayed in the vicinity of road signs, or if the
driver exceeds or drives slower than the speed limit.
Day 1 V2I X X XITS-G5 /
CellularCAM
Under development:
CEN TS 17426 Contextual speeds
PVDProbe vehicle
data2
The purpose of probe vehicle data is to collect and collate vehicle
data, which can then be used for a variety of applications. For
example, road operators may use the data to improve traffic
management.
Day 1 V2I X X X XITS-G5 /
CellularCAM
Existing:
ISO 29284:2012 Event-based probe vehicle data
Under revision:
ISO 22837:2009 Vehicle probe data for wide area comm.
ISO 24100:2010 Basic principles for personal data protection in
probe vehicle information
ISO 25114:2010
Probe data reporting management
Under development:
ISO 16461 Criteria for privacy and integrity protection in probe
vehicle information
RWWRoad works
warning2
Roadworks warnings enable road operators to communicate
information about road works and restrictions to drivers. This
allows drivers to be better prepared for upcoming roadworks and
potential obstacles in the road, therefore reducing the probability of
collisions.
Day 1 V2I X XITS-G5 /
Cellular
DENM /
CAM
Existing:
ETSI TS 101 539-1 Road Hazard Signaling (RHS)
clause 6.3.9
SWDShockwave
Damping 2
Shock wave damping aims to smooth the flow of traffic, by
damping traffic shock waves.Day 1 V2I X X X
ITS-G5 /
CellularCAM No standards or technical specifications identified
WTCWeather
conditions 2
The objective of this service is to increase safety through providing
accurate and up-to-date local weather information. Drivers are
informed about dangerous weather conditions ahead, especially
where the danger is difficult to perceive visually, such as black ice
or strong gusts of wind.
Day 1V2I /
V2VX
ITS-G5 /
Cellular
DENM /
CAM
Existing:
ETSI TS 101 539-1 Road Hazard Signaling (RHS)
clause 6.3.6
GLOSA
Green Light
Optimal
Speed
Advisory
(GLOSA) /
Time To
Green (TTG)
3
GLOSA provides speed advice to drivers approaching traffic
lights, reducing the likelihood that they will have to stop at a red
light, and reducing the number of sudden acceleration or braking
incidents. This is intended to provide traffic efficiency, vehicle
operation (fuel saving) and environmental benefits by reducing
unnecessary acceleration.
Day 1 V2I X X X ITS-G5
SPAT/
MAP/
CAM
No standards or technical specifications identified
Category
V2V
/V2I
Service
Time-
frame
Service Bundle Standards and technical specificationsDescription
Communication
Method
Acronym

Study on the Deployment of C-ITS in Europe: Final Report | 49
Ricardo in Confidence Ref: Ricardo/ED60721/Issue Number 1
Ricardo Energy & Environment
Safety EfficiencyVehicle
Operation
Environ
ment
Network
Type
C-ITS
Message
Basis
SigV
Signal
violation /
Intersection
Safety
3The primary objective of this service is to reduce the number and
severity of collisions at signalised intersections.Day 1 V2I X ITS-G5
SPAT/
MAP/
DENM
Under development:
ISO 26684 Intersection Signal Information and Violation Warning
Systems
ETSI TS 101 539-2 Intersection Collision Risk Warning
TSP
Traffic signal
priority
request by
designated
vehicles
3
The traffic signal priority request by designated vehicles allows
drivers of priority vehicles (for example emergency vehicles, public
transport, HGVs) to be given priority at signalised junctions.
Day 1 V2I X X ITS-G5 DENM No standards or technical specifications identified
iFuel
Information on
fuelling &
charging
stations for
alternative
fuel vehicles
4
The objective of this service is to broadcast electric vehicle
charging point availability and AFV fuelling point information to
relevant vehicles.
Day 1 V2I XITS G5 /
CellularCAM
Existing:
TS 101 556-1 Electrical Vehicle charging spot notific.
Under development:
TS 101 556-3 Reservation of EV Energy supply
Pinfo
Off street
parking
information
4
The provision of on-street parking information is intended to bring
efficiency benefits to drivers and help to reduce emissions in urban
areas by reducing the time spent ‘cruising’ at low speeds.
Day 1 V2I X XITS G5 /
CellularCAM No standards or technical specifications identified
PMang
On street
parking
management
and
information
4
The provision of on-street parking information is intended to bring
efficiency benefits to drivers and help to reduce emissions in urban
areas by reducing the time spent ‘cruising’ at low speeds.
Day 1 V2I X XITS G5 /
CellularCAM No standards or technical specifications identified
P&RidePark & Ride
information4
The provision of Park & Ride information is intended to reduce
congestion in urban areas and also shift travel from cars to public
transport.
Day 1 V2I X XITS G5 /
CellularCAM No standards or technical specifications identified
SmartR
Traffic
information &
Smart routing
5
The provision of traffic information and smart routing services to
vehicles is intended to improve traffic efficiency and aid traffic flow
management.
Day 1V2I /
V2VX X X
ITS G5 /
CellularCAM No standards or technical specifications identified
LZMLoading zone
management6
This service is intended to support the driver, fleet manager and
road operator in the booking, monitoring and management of
urban parking zones specific to freight vehicles.
Day 1 V2I XITS G5 /
CellularCAM No standards or technical specifications identified
Category
V2V
/V2I
Service
Time-
frame
Service Bundle Standards and technical specificationsDescription
Communication
Method
Acronym

Study on the Deployment of C-ITS in Europe: Final Report | 50
Ricardo in Confidence Ref: Ricardo/ED60721/Issue Number 1
Ricardo Energy & Environment
Safety EfficiencyVehicle
Operation
Environ
ment
Network
Type
C-ITS
Message
Basis
ZAC
Zone access
control for
urban areas
6
The zone access control service is intended to manage access to
specified zones. Using this information, drivers will be better
informed and will be able to select the most appropriate route for
their journey.
Day 1 V2I XITS G5 /
CellularCAM
Existing:
Listed in standards CEN/TC 278/WG1 and ISO/TC 204/WG18,
which principally cover electronic fee collection
VRU
Vulnerable
Road user
protection
7
This is a safety focussed service, which is intended to protect
vulnerable road users. In this vase vulnerable road users are
considered to be pedestrians and cyclists only.
Day 1.5 V2X X ITS-G5 DENM
Existing:
ETSI TS 101 539-1 Road Hazard Signaling (RHS)
clause 6.3.10
CCRW
Cooperative
Collision Risk
Warning
8
The cooperative collision risk warning is intended to minimise the
risk of collisions between vehicles, for example when overtaking, or
when merging with traffic.
Day 1.5 V2V X ITS-G5 DENM
Existing:
ISO 15623:2013 Forward Vehicle Collision Warning Systems
Under development:
ISO 22839 Forward Vehicle Collision Mitigation Systems
TS 101 539-3 Longitudinal Collision Risk Warning
MCA
Motorcycle
Approaching
Indication
8This service is intended to increase safety and prevent collisions
between motorcycles and other vehicles.Day 1.5 V2V X ITS-G5 DENM No standards or technical specifications identified
WWDWrong way
driving9
The wrong way driving service is a Day 1.5 V2I safety focussed
application intended to prevent accidents caused by wrong way
driving. Incidents of wrong way driving can lead to serious
accidents on high speed roads as approaching drivers perform
swerving manoeuvres to avoid the oncoming vehicle. Advance
warning of wrong way driving has two main functions: firstly, to alert
the driver that they are driving in the wrong direction, and secondly,
to warn surrounding vehicles of the danger.
Day 1.5 V2I X ITS-G5 DENM
Existing:
ETSI TS 101 539-1 Road Hazard Signaling (RHS)
clause 6.3.5
Category
V2V
/V2I
Service
Time-
frame
Service Bundle Standards and technical specificationsDescription
Communication
Method
Acronym

Study on the Deployment of C-ITS in Europe: Final Report | 51
Ricardo in Confidence Ref: Ricardo/ED60721/Issue Number 1
Ricardo Energy & Environment
8 Annex B: List of European Projects
Project End Dates Status Description Lead country Partner Countries
A2 M2 Connected Vehicle Corridor2018 2015-2018 Planned
The Department for Transport (DfT), Transport for London (TfL) and Kent Country Council could potentially receive funding the
the Connected Europe Facility Fund to introduce a C-ITS link between London and the Channel Tunnel crossing. CEF
Funding application rejected, intending to re-bid in November 2015. Graham Hanson of DfT has been suggested as a source
who may have information on progress.
Progress update 04/08/2015 from Graham Hanson:
The Department for Transport (DfT), Highways England, Transport for London (TfL) and Kent County Council are developing
a connected corridor to prove a test bed for services and technologies. The Corridor starts in the centre of London (Blackwall
Tunnel) and provides a unique mix of operating environments to the Port of Dover. Detailed feasibility studies are in progress
which will identify the services and infrastructure. These feasibility studies will form the basis of a bid to the next CEF bid Call
in November.
United Kingdom
[Unnamed] [TBC] [TBC]-[TBC] Mentioned
Highways England has mentioned it's desire to remove the need for expensive VMS signs and to introduce C-ITS in-vehicle
signage capabilities on the M25. This has not yet been planned or even formally proposed, - Jo White at Highways England
would know further.
United Kingdom
[Unnamed] [TBC] 2015-[TBC] Funded
3 autonomous vehicle trials commenced in spring 2015 in the UK, each with connectivity abilities. These were funded, in part,
by the UK government via the Transport Systems Catapult. John McKartly of Atkins is the project manager for the vehicle in
Bristol; Nick Reed of TRL for the Greenwich vehicle and an unknown person for an MK/Coventry vehicle.
United Kingdom
[Unnamed] 2014- Funded
Ricardo, Ricardo-AEA, TRL and Transport & Travel Research researched the feasibility of HGV platooning, looking at the
issues for legislators, haulage companies, drivers, network operators and other road users. This work shall inform a real world
demonstration beyond the project.
United Kingdom
AdaptIVe 2017 2014-2017 Funded
AdaptIVe stands for "Automated Driving Applications and Technologies for Intelligent Vehicles". AdaptIVe targets an ideal
interaction between drivers and automated systems by using advanced sensors, cooperative vehicle technologies and
integrated strategies. The level of automation dynamically adapts to the situation and driver status.
Germany
Germany, Italy,
France, Sweden,
United Kingdom
Aktiv 2010 2006-2010 Funded
Aktiv stands for "Adaptive and Cooperative Technologies for the Intelligent Traffic“. This German research initiative brings
together 29 partners - automobile manufacturers and suppliers, electronic, telecommunication and software companies as
well as research institutions. With the goal of improving both traffic safety and traffic flow in the future, the partners are working
together to design, develop, and evaluate novel driver assistance systems, knowledge and information technologies, solutions
for efficient traffic management and C2C and C2I communication for future cooperative vehicle applications. The initiative
Aktiv consists of 3 projects: Traffic Management, Active Safety and Cooperative Cars (+CoCarX).
Germany
Automatic Crash
Notification (ACN)
systems for road safety
in Germany
2008 2007-2008 Funded
The objective of this survey is to analyze the specific conditions under which an eCall System could be introduced in Germany,
and thereon aligned develop a recommendation for implementation. Methodology: On the basis of a descriptive analysis, the
specific conditions in Germany with reference to traffic accidents as well as the structures of and service provided by Rescue
Services are investigated. Moreover, the specifications of an Automatic Crash Notification system are outlined and existing
systems solutions are examined. Subsequent to the classification of possible system variants, two selected variants are
analyzed by means of applying the health economic evaluation methodology (cost-effectiveness analysis) from a societal
perspective.
Germany
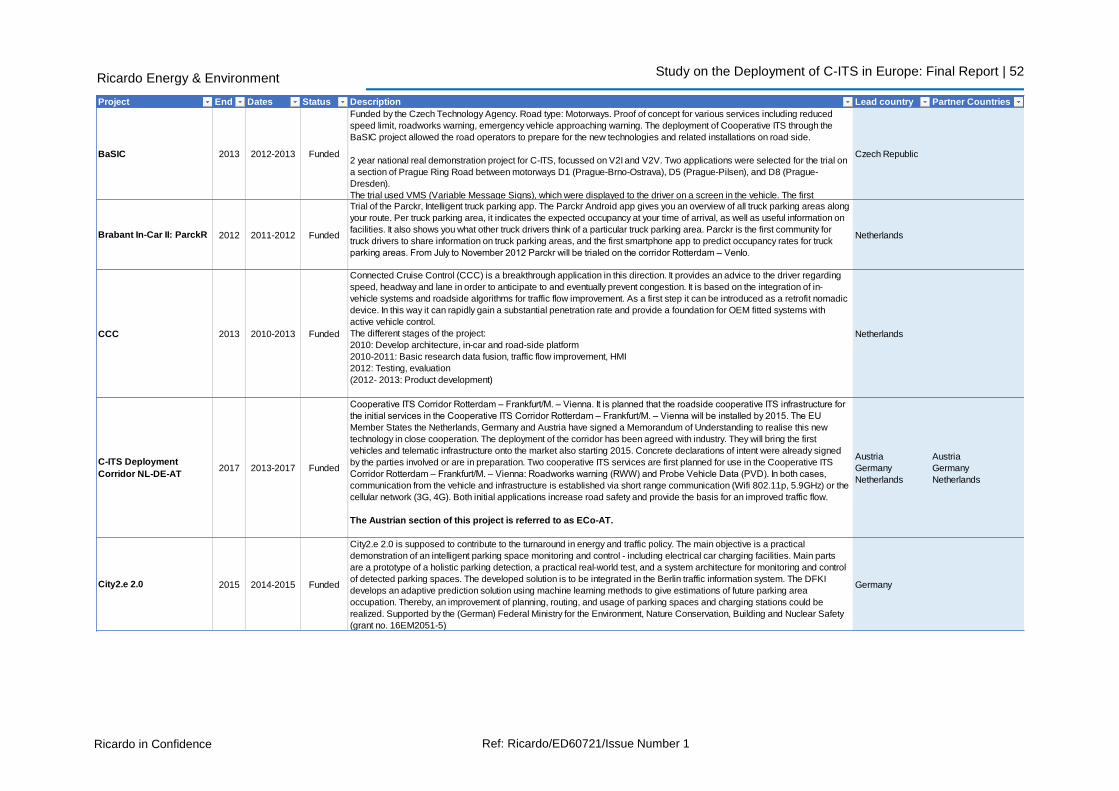
Study on the Deployment of C-ITS in Europe: Final Report | 52
Ricardo in Confidence Ref: Ricardo/ED60721/Issue Number 1
Ricardo Energy & Environment
Project End Dates Status Description Lead country Partner Countries
BaSIC 2013 2012-2013 Funded
Funded by the Czech Technology Agency. Road type: Motorways. Proof of concept for various services including reduced
speed limit, roadworks warning, emergency vehicle approaching warning. The deployment of Cooperative ITS through the
BaSIC project allowed the road operators to prepare for the new technologies and related installations on road side.
2 year national real demonstration project for C-ITS, focussed on V2I and V2V. Two applications were selected for the trial on
a section of Prague Ring Road between motorways D1 (Prague-Brno-Ostrava), D5 (Prague-Pilsen), and D8 (Prague-
Dresden).
The trial used VMS (Variable Message Signs), which were displayed to the driver on a screen in the vehicle. The first
Czech Republic
Brabant In-Car II: ParckR 2012 2011-2012 Funded
Trial of the Parckr, Intelligent truck parking app. The Parckr Android app gives you an overview of all truck parking areas along
your route. Per truck parking area, it indicates the expected occupancy at your time of arrival, as well as useful information on
facilities. It also shows you what other truck drivers think of a particular truck parking area. Parckr is the first community for
truck drivers to share information on truck parking areas, and the first smartphone app to predict occupancy rates for truck
parking areas. From July to November 2012 Parckr will be trialed on the corridor Rotterdam – Venlo.
Netherlands
CCC 2013 2010-2013 Funded
Connected Cruise Control (CCC) is a breakthrough application in this direction. It provides an advice to the driver regarding
speed, headway and lane in order to anticipate to and eventually prevent congestion. It is based on the integration of in-
vehicle systems and roadside algorithms for traffic flow improvement. As a first step it can be introduced as a retrofit nomadic
device. In this way it can rapidly gain a substantial penetration rate and provide a foundation for OEM fitted systems with
active vehicle control.
The different stages of the project:
2010: Develop architecture, in-car and road-side platform
2010-2011: Basic research data fusion, traffic flow improvement, HMI
2012: Testing, evaluation
(2012- 2013: Product development)
Netherlands
C-ITS Deployment
Corridor NL-DE-AT2017 2013-2017 Funded
Cooperative ITS Corridor Rotterdam – Frankfurt/M. – Vienna. It is planned that the roadside cooperative ITS infrastructure for
the initial services in the Cooperative ITS Corridor Rotterdam – Frankfurt/M. – Vienna will be installed by 2015. The EU
Member States the Netherlands, Germany and Austria have signed a Memorandum of Understanding to realise this new
technology in close cooperation. The deployment of the corridor has been agreed with industry. They will bring the first
vehicles and telematic infrastructure onto the market also starting 2015. Concrete declarations of intent were already signed
by the parties involved or are in preparation. Two cooperative ITS services are first planned for use in the Cooperative ITS
Corridor Rotterdam – Frankfurt/M. – Vienna: Roadworks warning (RWW) and Probe Vehicle Data (PVD). In both cases,
communication from the vehicle and infrastructure is established via short range communication (Wifi 802.11p, 5.9GHz) or the
cellular network (3G, 4G). Both initial applications increase road safety and provide the basis for an improved traffic flow.
The Austrian section of this project is referred to as ECo-AT.
Austria
Germany
Netherlands
Austria
Germany
Netherlands
City2.e 2.0 2015 2014-2015 Funded
City2.e 2.0 is supposed to contribute to the turnaround in energy and traffic policy. The main objective is a practical
demonstration of an intelligent parking space monitoring and control - including electrical car charging facilities. Main parts
are a prototype of a holistic parking detection, a practical real-world test, and a system architecture for monitoring and control
of detected parking spaces. The developed solution is to be integrated in the Berlin traffic information system. The DFKI
develops an adaptive prediction solution using machine learning methods to give estimations of future parking area
occupation. Thereby, an improvement of planning, routing, and usage of parking spaces and charging stations could be
realized. Supported by the (German) Federal Ministry for the Environment, Nature Conservation, Building and Nuclear Safety
(grant no. 16EM2051-5)
Germany

Study on the Deployment of C-ITS in Europe: Final Report | 53
Ricardo in Confidence Ref: Ricardo/ED60721/Issue Number 1
Ricardo Energy & Environment
Project End Dates Status Description Lead country Partner Countries
COBRA 2013 2011-2013 Funded
COoperative Benefits for Road Authorities a research project of the cross-border funded joint research programme
“ENR2011 MOBILITY – Getting the most out of Intelligent Infrastructure”. The Project aimed to aid road authorities in optimally
benefiting from changes in the field of cooperative systems (CS). This was done by providing an insight on the costs and
benefits of possible investments, both from a societal and business case perspective. The main outcome was a decision
support tool, which enables the costs and benefits of the three bundles of cooperative services to be compared in various
contexts, to support road administrations on investment decisions under different deployment scenarios.
Netherlands
Austria
Belgium
Norway
Switzerland
United Kingdom
CoCAR 2009 2006-2009 Funded
Part of the Aktiv project, the CoCar project is aiming at basic research for C2C and C2I communication for future cooperative
vehicle applications using cellular mobile communication technologies. Five partners out of the telecommunications- and
automotive industry develop platform independent communication protocols and innovative system components. They will be
prototyped, implemented and validated in selected applications. Innovation perspectives and potential future network
enhancements of cellular systems for supporting cooperative, intelligent vehicles will be identified and demonstrated. Funded
by BMBF
Germany
CoCarX 2011 2009-2011 Funded
CoCarX is the extension to the CoCar project as part of the Aktiv initiative. It is formed of partners Bundesanstalt fur
Stra•••ßenwesen, Ericsson, Ford Forschungszentrum Aachen, Vodafone D2 and Vodafone Group R&D who examine the next
generation of mobile technologies for the C2X communication goal. This includes a real world trial of C-ITS services using
4G LTE technology at 2.6GHz and extends to direct wireless (using 802.11p, named pWLAN by the team), creating a more
complex system than in CoCAR. The differences between CoCAR and CoCarX include: LTE further improvements (car-to-car
delay times below 100ms), further network capacity and broadband coverage, heterogeneous communication system with
pWLAN and LTE, multi-service capabilities and differentiated billing (priority messages, etc) and enhanced data and service
management. Funded by BMBF.
Germany
CO-cities 2013 2012-2013 Funded
Co-Cities is a pilot project to introduce and validate cooperative mobility services in cities and urban areas. It will develop a
dynamic 'feedback loop' from mobile users and travelers to the cities' traffic management centres, and add elements of
cooperative mobility to traffic information services.
These software extensions are based on the In-Time Commonly Agreed Interface (CAI), and the pilots will be run in the cities
of Bilbao, Florence, Munich, Prague, Reading, and Vienna.
Spain
Italy
Germany
Czech Republic
United Kingdom
Austria
CODIA 2008 2007-2008 Funded
CODIA (Co-Operative Systems Deployment Impact Assessment) aimed to provide an independent assessment of direct and
indirect impacts, costs and benefits of five co-operative systems: Speed adaptation due to weather conditions, obstacles or
congestion (V2I and I2Vcommunication), Reversible lanes due to traffic flow (V2I and I2V), Local danger / hazard warning
(V2V), Post crash warning (V2V), Cooperative intersection collision warning (V2V and V2I).
The vehicle fleets and annual kilometres driven were forecasted up to 2030. The new vehicle penetration rates as well as
retrofit system penetrations were transferred to forecasted penetrations of whole vehicle fleet and kilometres travelled in EU25
in 2020 and 2030. The infrastructure equipment rates were forecasted for the three systems requiring infrastructure
components. The effects of the systems were assessed with state of the art methodologies used in recent European projects.
The results were validated in a specific workshop.
Finland
CO-GISTICS 2016 2014-2016 Funded
CO-GISTICS is the first European project fully dedicated to the deployment of cooperative intelligent transport systems (C-
ITS) applied to logistics.
CO-GISTICS services will be deployed in 7 logistics hubs, Arad (Romania), Bordeaux (France), Bilbao (Spain), Frankfurt
(Germany), Thessaloniki (Greece), Trieste (Italy) and Vigo (Spain). With 33 partners including public authorities, fleet
operators, trucks, freight forwarders, terminal operators and logistics providers, the CO-GISTICS consortium will install the
services on at least 325 vehicles (trucks and vans) and will run for 3 years (until January 2016).
Romania
France
Spain
Germany
Greece
Italy
COLOMBO 2015 2012-2015 Funded
Cooperative Self-Organizing System for low Carbon Mobility at low Penetration Rates. In detail, two key objectives are
considered. The first is the determination of the traffic state by collecting information obtained from V2X-heartbeat messages,
as well as on-board and personal devices, such as PDAs which are fused for obtaining local and global network states. The
second one is to use this information for making traffic lights adaptive to the current traffic state.
Germany

Study on the Deployment of C-ITS in Europe: Final Report | 54
Ricardo in Confidence Ref: Ricardo/ED60721/Issue Number 1
Ricardo Energy & Environment
Project End Dates Status Description Lead country Partner Countries
COMeSafety2 2013 2011-2013 Funded
The overall goal of COMeSafety2 is to support the realisation and possible deployment of cooperative, communication based
active safety systems. The project provides information to the European Commission about relevant technical and
organisational matters. It is dedicated to foster wide agreement on technical issues on the one hand, but also wide
agreements on deployment strategies on the other.
Germany
Belgium
Denmark
France
Italy
Sweden
COMOSEF 2015 2011-2015 Funded
Based on the work carried out in the previous Celtic projects (Carlink - Wireless Traffic Service Platform for Linking Cars,
WiSafeCar – Wireless Safety Network between Cars) the CoMoSeF project aims to define advanced co-operative mobility
use cases, based on user requirements and to produce targeted services for each pilot application to increase traffic safety,
traffic fluency and to decrease the amount of accidents and incidents. The applications to be used both by commercial
vehicles (taxis, trucks, buses) and private cars will be developed, implemented, tested and ultimately deployed in the various
participating countries. The common CoMoSeF architecture and applications, which are based on the latest co-operative
mobility standards, will be defined and specified so that they may be used as a starting point, when developing the pilots.
Finland
France
Luxembourg
Romania
Spain
South Korea
COMPASS4D 2015 2013-2015 Funded
The European project Compass4D focuses on three services (The Red Light Violation Warning RLVW, The Road Hazard
Warning RHW, The Energy Efficient Intersection EEI) which will increase drivers' safety and comfort by reducing the number
and severity of road accidents as well as avoiding queues and traffic jams. Compass4D will also have a positive impact on
the local environment by reducing vehicles' CO2 emissions and fuel consumption. Seven European cities: Bordeaux,
Copenhagen, Helmond, Newcastle, Thessaloniki, Verona and Vigo.
France
Denmark
Netherlands
United Kingdom
Greece
Italy
Spain
Connekt Platform - N/A
Conneckt is a public-private cooperation of 125 authorities, companies and knowledge institutions whose goal is to improve
mobility in the Netherlands by sharing knowledge, know-how and initiatives and connecting members. Under ITS, they have
conducted projects DAVI, WEpods, the Netherlands C-ITS platform (for the EC), Praktijkproef Amsterdam, National ITS
reports and EasyWay Development Guidelines.
Netherlands
CONVERGE 2015 2012-2015 Funded
COmmunication Network VEhicle Road Global Extension. The stated goal of CONVERGE is the definition of an architecture
and interfaces for an open, distributed, transregional/international connecting, provider-independent, scalable, flexible, secure
and hybrid communicating Car2X Systems Network.
For this purpose the basic network architecture (central, P2P, hierarchical) has to be defined. Furthermore, concepts must be
developed, which comprises the IT security and privacy as well as data management.
CONVERGE is important as DENM messages are commuicated not only using ITS-G5 but over 3G and LTE. Materially, this
means smartphones can receive I2V messages.
Germany
COOPERS 2010 2006-2010 Funded
Project Mission: To define, develop and test new safety related services, equipment and applications using two way
communications between road infrastructure and vehicles from a traffic management perspective. COOPERS aimed to build
upon existing equipment and infrastructure as far as possible to incorporate bidirectional infrastructure-vehicle links as an
open standardised wireless communication technology. The role of motorway-operators in offering and retrieving safety
relevant and traffic management information for specific road segments on European motorways based on infrastructure and
in-vehicle data was a subject to be investigated.
COSMO 2013 2010-2013 Funded
COSMO aims to install and run practical demonstrations of a range of these new services in realistic conditions, in order to
produce
- quantified results of the impact of given cooperative systems on the environment with regards to fuel consumption and CO2
emissions
- detailed specifications covering technical, legal and organisational issues involved in deployment of those systems,
including indications on their procurement, installation, operation and maintenance
Business Plans for the various systems are another crucial output of the project. These will be linked to a further important
legacy, which is the set of pilot sites that will remain operational after COSMO has closed.
Italy
Austria
Belgium
Spain
Sweden
CVIS 2010 2006-2010 Funded Co-operative Vehicle-Infrastructure Systems.

Study on the Deployment of C-ITS in Europe: Final Report | 55
Ricardo in Confidence Ref: Ricardo/ED60721/Issue Number 1
Ricardo Energy & Environment
Project End Dates Status Description Lead country Partner Countries
Czech Extension to C-
ITS Deployment Corridor
NL-DE-AT
2016- Planned
Planned extension for the European C-ITS Joint Deployment Corridor. A proposal for financing from the European
Commission: Connecting Europe Facility is being submitted.
Road type: Motorway + Railway crossing
Czech Republic
Austria
Germany
Netherlands
DIAMANT 2013 2008-2013 Funded
DIAMANT stands for Dynamische Informationen und Anwendungen zur Mobilitätssicherung mit Adaptiven Netzwerken und
Telematikanwendungen or Dynamic Information and Applications for assured Mobility with Adaptive Networks and Telematics
infrastructure. DIAMANT is a regional project under the form of a Public-Private Partnership. The aim of the DIAMANT project
is to create the prerequisites for a sustained increase in efficiency and safety in road traffic by means of vehicle-vehicle and
vehicle-infrastructure communication (C2X-communication). Rapid deployment of applications to improve road safety and
harmonise the traffic flow by means of a Public Private Partnership (PPP) that covers the complete range of expertise
required. To prepare existing research results for regular operation. To implement the following applications:
Information for drivers
Warnings for drivers
Virtual influence on traffic
Germany
DRIVE C2X 2014 2011-2014 Funded
With 34 partners, 13 support partners and a 18.5 million Euro budget, DRIVE C2X lays the foundation for rolling out
cooperative systems in Europe, leading to safer, more economical and more ecological driving. Funded with 12.4 million
Euro by the European Commission, DRIVE C2X will carry out a comprehensive assessment of cooperative systems through
Field Operational Tests
Germany
Austria
Belgium
Spain
Finland
France
Italy
Netherlands
Romania
Sweden
United Kingdom
Drive ME 2018 2014-2018 Funded
TEST probes in real traffic. Testing of 100 highly automated Volvo cars in real traffic with real customers around 50 km of
roads in Gothenburg during 2017-2018. The main objective of this trail is to examine the effect of the highly automated cars on
the Swedish Transport Administration service qualities namely,: Energy efficiency, Safety, Traffic flow. Moreover, study the
potential benefits when self-driving cars are introduced on a larger scale in road transportation system.
The test probes (rebuilt vehicles) are to be considered as measuring equipment in a real traffic environment to collect data for
analysis, modelling and quantification in order to among others developing a set of suitable effect catalogue for addressing
different areas within traffic technique, when highly automated vehicles are introduced.
Sweden

Study on the Deployment of C-ITS in Europe: Final Report | 56
Ricardo in Confidence Ref: Ricardo/ED60721/Issue Number 1
Ricardo Energy & Environment
Project End Dates Status Description Lead country Partner Countries
EasyWay 2012 2007-2012 Funded
The EasyWay Projects phase I (2007-2009 ) and phase II (2010-2012) have been co-funded by the European Commission
and are part of the EasyWay Global Programme 2007-2020. EasyWay I and II are Projects for deployment of Europe ‐wide
ITS systems and services on TEN‐T road network and its interfaces with urban areas and other modes of transport. The main
objectives of EasyWay I and II were to improve safety, to reduce congestion and to reduce environmental impacts through the
coordinated deployment of real‐time information and traffic management services, supporting the creation of a seamless
European transport system through coordinated ITS deployment.
EasyWay incorporates eight Euro-Regions (CENTRICO, STREETWISE, ITHACA, SERTI, ARTS, CORVETTE, CONNECT,
VIKING) facilitating the integration of all new Member States. It reinforces the co-operation between the existing participating
countries by providing a new integrated framework with clear objectives and reporting methods. The eight Euro Regions will
retain the management structure for EasyWay. More than 21 member states involved.
C-ITS was dealt with the Cooperative SystemsTask Force, producing as its most valuable results the road operators' priority
services (7 services), stakeholder analysis, benefit-cost assessment of priority system deployment in six countries (AT, DE,
FR, NL, SE, UK) as well as EU-27, and finally a vision and road map for C-ITS deployment from the road operator
perspective.
Austria
(Cooperative
Systems Task
Force)
Austria
Belgium
Cyprus
Czech Republic
Denmark
Finland
France
Germany
Greece
Hungary
Ireland
Italy
Lithuania
Netherlands
Portugal
Romania
Slovakia
Slovenia
Spain
Sweden
United Kingdom
eCall.at 2017 2015-2017 Funded
eCall.at focusses on the implementation of eCall in Austria. The key element of the proposed Action is the piloting and
subsequent implementation and certification phase of 9 Public Safety Answering Points (PSAPs), in line with the
requirements defined by the EU regulations and specifications on eCall. Additionally, a set of training measures for PSAP
operators will be defined and prepared to ensure the correct handling of eCalls. Dissemination activities will be defined and
conducted to ensure close cooperation with rescue services as well as road operators and OEMs (Original Equipment
Manufacturers) in Austria. eCall.at will also pilot cross-border cooperation to enable proper handling of eCalls in the border
regions, via contacts and agreements with neighbouring Member States.
Austria
ECo-AT 2017 2013-2017 Funded
ECo-AT (European Corridor – Austrian Testbed for Cooperative Systems) is the Austrian project to create harmonised and
standardised cooperative ITS applications jointly with partners in Germany and the Netherlands. The project is led by the
Austrian motorway operator ASFiNAG and the consortium consists of Kapsch TrafficCom AG, Siemens AG Österreich, IPTE
– Schalk & Schalk OG, SWARCO AG, High Tech Marketing, Volvo Technology AB, FTW, ITS Vienna Region, and BASt
(Bundesanstalt für Straßenwesen).
The main objective of the project ECo-AT is to close the gap between resarch and development and the deployment of
cooperative ITS services, namely by:
- definition of all elements necessary for "Day One" in cooperation with industry partners
- adaption of the industry partners ITS products and ASFiNAG procedures
- system testing within the framework of a "Living Lab“
- deployment of "Day One" services within the framework of an Austrian corridor as part of the C-ITS corridor Rotterdam-
Frankfurt-Wien
Use cases and specifications will be reused in Holland and Germany by other members of the Amsterdam group, the Nordic
Traffic Authorities and the upcoming NordicWay project.
AustriaGermany
Netherlands

Study on the Deployment of C-ITS in Europe: Final Report | 57
Ricardo in Confidence Ref: Ricardo/ED60721/Issue Number 1
Ricardo Energy & Environment
Project End Dates Status Description Lead country Partner Countries
eCO-FEV 2015 2012-2015 Funded
This project will be carried out within the FP7 Work Programme 2011 COOPERATION of the European Commission
addressing the objective GC-ICT-2011.6.8 ICT for fully electric vehicles. In particular, the project aims at fulfilling the specific
targeted outcome f): Integration of the FEV in the cooperative transport infrastructure. It proposes will develop an integrated IT
platform that enables the connection and information exchanges between multiple infrastructure systems that are relevant to
the FEV such as road IT infrastructure, EV backend infrastructure and EV charging infrastructure. Over this platform, multiple
advanced electric mobility services are able to be provided to FEV users to improve the energy management efficiency and
usability of the FEV.
United Kingdom
France
Italy
Germany
EcoGem 2013 2010-2013 Funded
EcoGem will base its approach on rendering the FEV:(i) capable of reaching the desired destinations through the most
energy efficient routes possible;(ii) fully aware of surrounding recharging points/stations while on move.To achieve its goals,
EcoGem will develop and employ novel techniques:(i) on-going learning-based traffic prediction;(ii) optimised route
planning;(iii) interactive and inter-operative traffic, fleet and recharging management via V2V and V2I interfaces and
communication.EcoGem's key-objective is to infuse intelligence and learning functionalities to on-board systems, enabling
autonomous as well as interactive learning through V2X interfacing.
Turkey
Germany
Spain
Greece
Italy
Netherlands
Poland
United Kingdom
EcoMove 2014 2010-2014 Funded
eCoMove is a 3-year integrated project (April 2010 - January 2014), funded by the European Commission under the 7th
Framework Programme of Research and Technological Development.
This project has created an integrated solution for road transport energy efficiency to help drivers, freight and road operators:
- Save unnecessary kilometres driven (optimised routing)
- Save fuel (eco-driving support)
- Manage traffic more efficiently (optimised network management)
The project’s core concept is that there is a theoretical minimum energy consumption achievable with the “perfect eco-driver”
travelling through the “perfectly eco-managed” road network.
Belgium
Austria
Germany
Spain
France
Netherlands
Sweden
United Kingdom
Poland
eIMPACT 2008 -2008 Funded
eIMPACT assesses the socio-economic effects of Intelligent Vehicle Safety Systems (IVSS), their impact on traffic safety and
efficiency. It addresses policy options and the views of the different stakeholders involved: users, OEMs, insurance
companies, and society. With determining these effects, eIMPACT also provides an indication of the prospects for introducing
IVSS. eIMPACT is part of the EU's Sixth Framework Programme for Information Society Technologies and Media and will run
for two and a half years until July 2008. eIMPACT is short for "Socio-economic Impact Assessment of Stand-alone and Co-
operative Intelligent Vehicle Safety Systems (IVSS) in Europe"; the consortium is led by TNO and comprises 13 partners that
represent OEMs, research institutes and universities, encompassing many EU states.
Netherlands
Czech Republic
Germany
Finland
Italy
Sweden
EURIDICE 2012 2009-2012 Funded
Supported by EUR 8.25 million in funding from the European Commission, the team behind the EURIDICE* project
implemented their system in eight different pilot studies involving transport and logistics operators across Europe.
EURIDICE aimed to use 'cooperative systems' - systems (or objects) that communicate with each other and their
surroundings - to provide the right information in the right place at the right time at low cost, using modern communication
networks.
Italy
Austria
Germany
Finland
Greece
Netherlands
Poland
Romania
Slovenia

Study on the Deployment of C-ITS in Europe: Final Report | 58
Ricardo in Confidence Ref: Ricardo/ED60721/Issue Number 1
Ricardo Energy & Environment
Project End Dates Status Description Lead country Partner Countries
euroFOT 2011 2008-2011 Funded
8 functionalities, 28 partners, 1000 vehicles... One Field Test. euroFOT has brought together a comprehensive array of
organisations to test intelligent vehicle systems across Europe. Car manufacturers, suppliers, universities, research institutes
and others stakeholders – in all 28 organisations are involved. The aim: to make road transport safer, more efficient and more
pleasant! euroFOT establishes a comprehensive, technical, and socio/economic assessment programme for evaluating the
impact of intelligent vehicle systems on safety, the environment, driver efficiency. The project assesses several technically
mature systems using vehicles that include both passenger cars and trucks across Europe. A variety of intelligent vehicle
systems (IVS) are being tested on a large scale in real driving conditions. About 1000 IVS-equipped vehicles will be driven
over the course of one year, tested on roads across Europe. The objectives of the testing are to:
- Assess various aspects of in-vehicle systems, such as their capabilities and performance, and the driver’s behaviour and
interactions with those systems
- Gain a better understanding of the short- and long-term socio-economic impact of such systems on safety, efficiency and
driver comfort
- Provide early publicity of the systems to the consumer and create wider acceptance of them
Germany
Italy
France
Sweden
Belgium
Spain
Austria
Greece
Netherlands
United Kingdom
FOT-Net Data 2016 2014-2016 Funded
FOT-Net Data, Field Operational Test Networking and Data Sharing Support, is a 3-year support action project to support the
efficient sharing and re-use of available FOT (Field Operational Tests) datasets, develop and promote a framework for data
sharing, build a detailed catalogue of available data and tools and operate an international networking platform for FOT
activities. FOT-Net Data is a continuation of FOT-Net 1 and 2 and is funded under the 7th Framework Programme for
Research and Technological Development.
Finland
Belgium
Germany
Spain
France
Sweden
United Kingdom
FOT-Net1 2010 2008-2010 Funded See FOT-Net 2
FOT-Net2 2013 2011-2013 Funded
The FOT-Net project has been in place for six years (2008-2013) as the networking platform for stakeholders involved or
interested in Field Operational Tests (FOTs).
The FOT-Net project aims to gather European and international stakeholders in a strategic networking platform to present
results of Field Operational Tests (FOTs), identify and discuss common working items and promote a common approach for
FOTs – the FESTA methodology. FOT-Net is a Specific Support Action funded by the European Commission DG Information
Society and Media under the Seventh Framework Programme.
Belgium
Germany
Spain
France
Italy
Netherlands
Sweden
United Kingdom
FOTsis 2014 2011-2014 Funded
FOTsis (European Field Operational Test on Safe, Intelligent and Sustainable Road Operation) is a largescale field testing of
the road infrastructure management systems needed for the operation of seven close-to-market cooperative I2V, V2I & I2I
technologies (the FOTsis Services), in order to assess in detail both 1) their effectiveness and 2) their potential for a full-scale
deployment in European roads. Specifically, FOtsis will test the road infrastructure’s capability to incorporate the latest
cooperative systems technology at 9 Test-Sites in four European Test-Communities (Spain, Portugal, Germany and Greece),
providing the following services: S1: Emergency Management, S2: Safety Incident Management, S3: Intelligent Congestion
Control, S4: Dynamic Route Planning, S5: Special Vehicle Tracking, S6: Advanced Enforcement, S7: Infrastructure Safety
Assessment
Spain
Austria
Belgium
Germany
Finland
France
Greece
Portugal
FREILOT 2011 2009-2011 Funded
FREILOT - Urban Freight Energy Efficiency Pilot. FREILOT is an EC-funded Pilot that started in April 2009 for a duration of
2.5 years. The FREILOT services aim to increase energy efficiency in road goods transport in urban areas:
Energy efficiency optimised intersection control
Adaptive acceleration and speed limiters
Enhanced “green driving” support
Real-time loading/delivery space booking
The general idea is that cities will implement priority for trucks at certain intersections (on certain roads and/or certain times of
day) and provide this priority as incentive to the truck fleets which implement acceleration, speed limiters and provide eco-
driving support to their drivers. In addition, cities will also provide possibilities to dynamically book and re-schedule delivery
spaces.
The services will be piloted in four European implementations: Lyon-France, Helmond-Netherlands, Krakow-Poland and
Bilbao-Spain, to demonstrate up to 25% reduction of fuel consumption.
Belgium
Spain
France
Greece
Italy
Netherlands
Sweden

Study on the Deployment of C-ITS in Europe: Final Report | 59
Ricardo in Confidence Ref: Ricardo/ED60721/Issue Number 1
Ricardo Energy & Environment
Project End Dates Status Description Lead country Partner Countries
HeERO 2013 2011-2013 Funded
HeERO addresses the pan-European in-vehicle emergency call service "eCall" based on 112, the common European
Emergency number. For three years (January 2011 to December 2013), the nine European countries forming the HeERO 1
consortium (Croatia, Czech Republic, Finland, Germany, Greece, Italy, The Netherlands, Romania and Sweden) carried out
the start-up of an interoperable and harmonised in-vehicle emergency call system.
Belgium
Czech Republic
Germany
Finland
Greece
Croatia
Italy
Netherlands
Romania
Sweden
HeERO2 2015 2013-2015 Funded
The overall objective of HeERO 2 is “To extend HeERO to new Member States or associated countries to demonstrate the
scalability of the HeERO solution and to widen the acceptance of eCall.” To support this objective there are three aims:
- to prepare the necessary infrastructure to realize interoperability of "eCall" at European level,
- to boost Member States investment in the PSAP infrastructure and interoperability of the service within the roadmap (end of
2014),
- to encourage a wider adoption across more Member States.
6 new countries (namely Belgium, Bulgaria, Denmark, Luxembourg, Spain and Turkey) have joined the other 9 pilot sites of
HeERO 1. Belgium
Belgium
Bulgaria
Denmark
Luxembourg
Spain
Turkey
Czech Republic
Germany
Finland
Greece
Croatia
Italy
Netherlands
Romania
Sweden
I_HeERO 2017 2014-2017 Funded
eCall (based on the European emergency number 112) is the emergency call system that automatically alerts rescue services
in case of vehicle crashes. The
device will have to be fitted into all new models of cars and light vans by 31 March 2018. Similarly, EU Member States must
put in place by 1 October 2017 the necessary Public Safety Answering Points (PSAP) infrastructure to process eCalls.
I_HeERO is addressing the need for Member States to upgrade their PSAPs in compliance with the ITS Directive
(2010/40/EU), thus enabling eCall to be correctly implemented across all EU Member States. The Action will also undertake
studies on the extension of eCall to other types of vehicles not included in the EU legislation on eCall, i.e.: powered two
wheelers, trucks and dangerous goods carriers. Furthermore, it will also examine the requirement for data integration and
define conformity assessment for all PSAPs as required by the legislation
17 EU Member
States
iCOMPOSE 2016 2013-2016 Funded
Integrated Control of Multiple-Motor and Multiple-Storage Fully Electric Vehicles. A key objective is: Integration of the unified
controller with cloud-sourced information for the enhanced estimation and prediction of the vehicle states within a cooperative
vehicle-road infrastructure, Austria
Belgium
Czech Republic
Germany
France
United Kingdom
ICSI 2015 2012-2015 Funded
Intelligent cooperative sensing for improved traffic efficiency. The goal of the project is to define a new architecture to enable
cooperative sensing in intelligent transportation systems and to develop a reference end-to-end implementation. The project
results will enable advanced traffic and travel management strategies, based on reliable and real-time input data. The
effectiveness of such new strategies, together with the proposed system, will be assessed in two field trials. [ITS]
Italy
Spain
Greece
Croatia
Portugal
United Kingdom
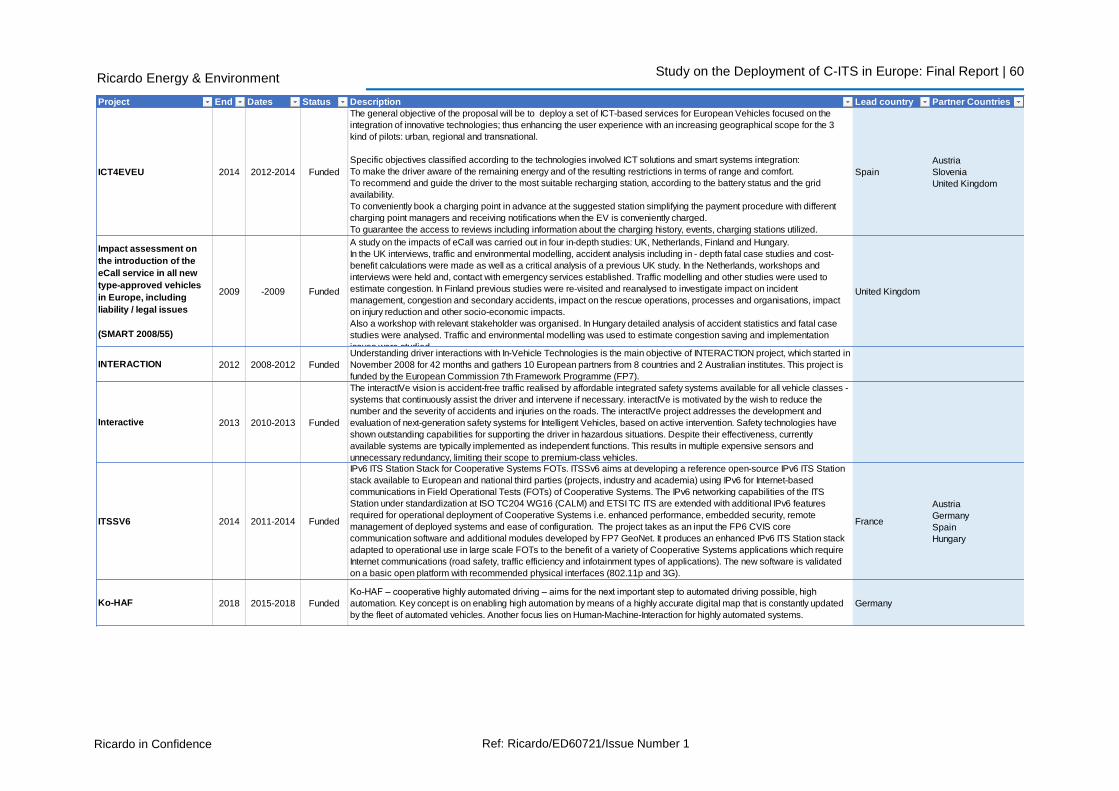
Study on the Deployment of C-ITS in Europe: Final Report | 60
Ricardo in Confidence Ref: Ricardo/ED60721/Issue Number 1
Ricardo Energy & Environment
Project End Dates Status Description Lead country Partner Countries
ICT4EVEU 2014 2012-2014 Funded
The general objective of the proposal will be to deploy a set of ICT-based services for European Vehicles focused on the
integration of innovative technologies; thus enhancing the user experience with an increasing geographical scope for the 3
kind of pilots: urban, regional and transnational.
Specific objectives classified according to the technologies involved ICT solutions and smart systems integration:
To make the driver aware of the remaining energy and of the resulting restrictions in terms of range and comfort.
To recommend and guide the driver to the most suitable recharging station, according to the battery status and the grid
availability.
To conveniently book a charging point in advance at the suggested station simplifying the payment procedure with different
charging point managers and receiving notifications when the EV is conveniently charged.
To guarantee the access to reviews including information about the charging history, events, charging stations utilized.
Spain
Austria
Slovenia
United Kingdom
Impact assessment on
the introduction of the
eCall service in all new
type-approved vehicles
in Europe, including
liability / legal issues
(SMART 2008/55)
2009 -2009 Funded
A study on the impacts of eCall was carried out in four in-depth studies: UK, Netherlands, Finland and Hungary.
In the UK interviews, traffic and environmental modelling, accident analysis including in - depth fatal case studies and cost-
benefit calculations were made as well as a critical analysis of a previous UK study. In the Netherlands, workshops and
interviews were held and, contact with emergency services established. Traffic modelling and other studies were used to
estimate congestion. In Finland previous studies were re-visited and reanalysed to investigate impact on incident
management, congestion and secondary accidents, impact on the rescue operations, processes and organisations, impact
on injury reduction and other socio-economic impacts.
Also a workshop with relevant stakeholder was organised. In Hungary detailed analysis of accident statistics and fatal case
studies were analysed. Traffic and environmental modelling was used to estimate congestion saving and implementation
issues were studied.
United Kingdom
INTERACTION 2012 2008-2012 Funded
Understanding driver interactions with In-Vehicle Technologies is the main objective of INTERACTION project, which started in
November 2008 for 42 months and gathers 10 European partners from 8 countries and 2 Australian institutes. This project is
funded by the European Commission 7th Framework Programme (FP7).
Interactive 2013 2010-2013 Funded
The interactIVe vision is accident-free traffic realised by affordable integrated safety systems available for all vehicle classes -
systems that continuously assist the driver and intervene if necessary. interactIVe is motivated by the wish to reduce the
number and the severity of accidents and injuries on the roads. The interactIVe project addresses the development and
evaluation of next-generation safety systems for Intelligent Vehicles, based on active intervention. Safety technologies have
shown outstanding capabilities for supporting the driver in hazardous situations. Despite their effectiveness, currently
available systems are typically implemented as independent functions. This results in multiple expensive sensors and
unnecessary redundancy, limiting their scope to premium-class vehicles.
ITSSV6 2014 2011-2014 Funded
IPv6 ITS Station Stack for Cooperative Systems FOTs. ITSSv6 aims at developing a reference open-source IPv6 ITS Station
stack available to European and national third parties (projects, industry and academia) using IPv6 for Internet-based
communications in Field Operational Tests (FOTs) of Cooperative Systems. The IPv6 networking capabilities of the ITS
Station under standardization at ISO TC204 WG16 (CALM) and ETSI TC ITS are extended with additional IPv6 features
required for operational deployment of Cooperative Systems i.e. enhanced performance, embedded security, remote
management of deployed systems and ease of configuration. The project takes as an input the FP6 CVIS core
communication software and additional modules developed by FP7 GeoNet. It produces an enhanced IPv6 ITS Station stack
adapted to operational use in large scale FOTs to the benefit of a variety of Cooperative Systems applications which require
Internet communications (road safety, traffic efficiency and infotainment types of applications). The new software is validated
on a basic open platform with recommended physical interfaces (802.11p and 3G).
France
Austria
Germany
Spain
Hungary
Ko-HAF 2018 2015-2018 Funded
Ko-HAF – cooperative highly automated driving – aims for the next important step to automated driving possible, high
automation. Key concept is on enabling high automation by means of a highly accurate digital map that is constantly updated
by the fleet of automated vehicles. Another focus lies on Human-Machine-Interaction for highly automated systems.
Germany
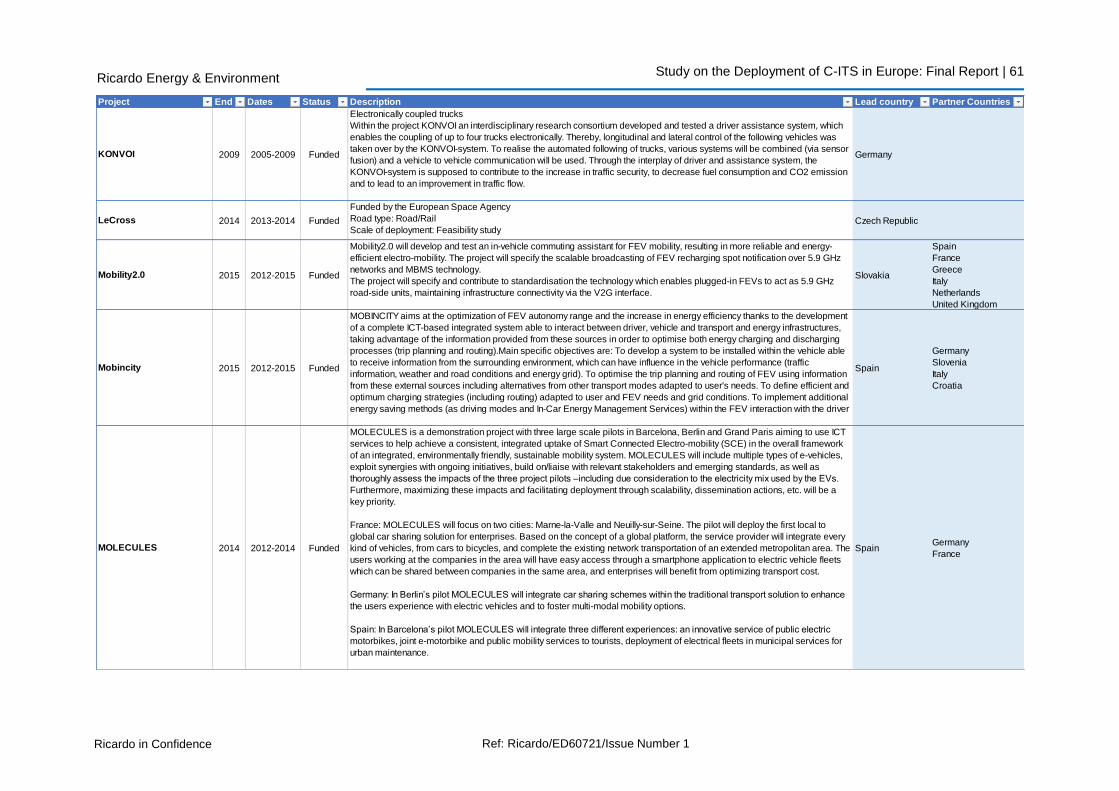
Study on the Deployment of C-ITS in Europe: Final Report | 61
Ricardo in Confidence Ref: Ricardo/ED60721/Issue Number 1
Ricardo Energy & Environment
Project End Dates Status Description Lead country Partner Countries
KONVOI 2009 2005-2009 Funded
Electronically coupled trucks
Within the project KONVOI an interdisciplinary research consortium developed and tested a driver assistance system, which
enables the coupling of up to four trucks electronically. Thereby, longitudinal and lateral control of the following vehicles was
taken over by the KONVOI-system. To realise the automated following of trucks, various systems will be combined (via sensor
fusion) and a vehicle to vehicle communication will be used. Through the interplay of driver and assistance system, the
KONVOI-system is supposed to contribute to the increase in traffic security, to decrease fuel consumption and CO2 emission
and to lead to an improvement in traffic flow.
Germany
LeCross 2014 2013-2014 Funded
Funded by the European Space Agency
Road type: Road/Rail
Scale of deployment: Feasibility studyCzech Republic
Mobility2.0 2015 2012-2015 Funded
Mobility2.0 will develop and test an in-vehicle commuting assistant for FEV mobility, resulting in more reliable and energy-
efficient electro-mobility. The project will specify the scalable broadcasting of FEV recharging spot notification over 5.9 GHz
networks and MBMS technology.
The project will specify and contribute to standardisation the technology which enables plugged-in FEVs to act as 5.9 GHz
road-side units, maintaining infrastructure connectivity via the V2G interface.
Slovakia
Spain
France
Greece
Italy
Netherlands
United Kingdom
Mobincity 2015 2012-2015 Funded
MOBINCITY aims at the optimization of FEV autonomy range and the increase in energy efficiency thanks to the development
of a complete ICT-based integrated system able to interact between driver, vehicle and transport and energy infrastructures,
taking advantage of the information provided from these sources in order to optimise both energy charging and discharging
processes (trip planning and routing).Main specific objectives are: To develop a system to be installed within the vehicle able
to receive information from the surrounding environment, which can have influence in the vehicle performance (traffic
information, weather and road conditions and energy grid). To optimise the trip planning and routing of FEV using information
from these external sources including alternatives from other transport modes adapted to user's needs. To define efficient and
optimum charging strategies (including routing) adapted to user and FEV needs and grid conditions. To implement additional
energy saving methods (as driving modes and In-Car Energy Management Services) within the FEV interaction with the driver
Spain
Germany
Slovenia
Italy
Croatia
MOLECULES 2014 2012-2014 Funded
MOLECULES is a demonstration project with three large scale pilots in Barcelona, Berlin and Grand Paris aiming to use ICT
services to help achieve a consistent, integrated uptake of Smart Connected Electro-mobility (SCE) in the overall framework
of an integrated, environmentally friendly, sustainable mobility system. MOLECULES will include multiple types of e-vehicles,
exploit synergies with ongoing initiatives, build on/liaise with relevant stakeholders and emerging standards, as well as
thoroughly assess the impacts of the three project pilots –including due consideration to the electricity mix used by the EVs.
Furthermore, maximizing these impacts and facilitating deployment through scalability, dissemination actions, etc. will be a
key priority.
France: MOLECULES will focus on two cities: Marne-la-Valle and Neuilly-sur-Seine. The pilot will deploy the first local to
global car sharing solution for enterprises. Based on the concept of a global platform, the service provider will integrate every
kind of vehicles, from cars to bicycles, and complete the existing network transportation of an extended metropolitan area. The
users working at the companies in the area will have easy access through a smartphone application to electric vehicle fleets
which can be shared between companies in the same area, and enterprises will benefit from optimizing transport cost.
Germany: In Berlin’s pilot MOLECULES will integrate car sharing schemes within the traditional transport solution to enhance
the users experience with electric vehicles and to foster multi-modal mobility options.
Spain: In Barcelona’s pilot MOLECULES will integrate three different experiences: an innovative service of public electric
motorbikes, joint e-motorbike and public mobility services to tourists, deployment of electrical fleets in municipal services for
urban maintenance.
SpainGermany
France

Study on the Deployment of C-ITS in Europe: Final Report | 62
Ricardo in Confidence Ref: Ricardo/ED60721/Issue Number 1
Ricardo Energy & Environment
Project End Dates Status Description Lead country Partner Countries
NordicWay 2017 2015-2017 Funded
NordicWay is a pre-deployment pilot of Cooperative ITS (C-ITS) cellular network based C-ITS services in four countries
(Finland, Sweden, Norway and Denmark) with the purpose of demosntrating the technical performance, impacts, costs and
acceptance of C-ITS. The primary goal is to prepare for a decision on large-scale deployment of C-ITS on the road networks
of the Nordic countries. NordicWay will be followed by wide-scale deployment and potentially to be scaled up to Europe.
NordicWay has the potential to improve safety, efficiency and comfort of mobility and connect road transport with other
modes. NordicWay is the first large-scale pilot using cellular communication (3G and LTE/4G) for C-ITS. It offers continuous
interoperable services to the users with roaming between different mobile networks and cross-border, offering C-ITS services
across all participating countries. NordicWay puts emphasis on building a sustainable business model on the large
investment of the public sector on the priority services of the ITS Directive. NordicWay is fully based on European standards
and will act as the last mile between C-ITS research and development and wide-scale deployment. 50% of the funding is
provided by the CEF.
Finland
Sweden
Norway
Denmark
OVERSEE 2012 2010-2012 Funded
OVERSEE is a European research project funded within the 7th Framework Programme of the European Commission. The
overall goal of OVERSEE is to contribute to the efficiency and safety of road transport by developing the OVERSEE platform,
which will provide a secure, standardized and generic communication and application platform for vehicles. OVERSEE is the
acronym for Open VEhiculaR SEcurE platform.
Germany
Austria
France
Spain
P4ITS 2016 2013-2016 Funded
P4ITS is a thematic network gathering contracting authorities experienced or planning to shortly embark on deploying
Cooperative ITS (C-ITS), and willing to improve the market roll-out of innovative transport systems and services through Public
Procurement of Innovation (PPI). The network will enable exploring common issues and themes with counterparts from
different countries, with a view to developing a more concerted approach for deploying C-ITS in Europe.
Platform Beter Benutten - 2014-- Funded
Beter Benutten: Countering phantom traffic jams and shock wave traffic on the A58 motorway. Funding was received from
national, regional and local authorities. Uses cooperative communication along a 17km stretch of motorway to stop 'phantom
traffic jams', or shockwave damping. At first, this project will use cellular V2V communication to the driver's phones but later in
2015 will move to Wi-Fi V2I communication for real-time advice. The information is displayed as a recommended speed to
the driver. Beter Benutten may include the 'SPITS-live' project.
Netherlands
PRE-DRIVE C2X 2010 2008-2010 Funded
PRE-DRIVE C2X’ main goal was twofold: The first goal was to specify and prototype a common European C2X
communication system. The other goal was to develop the necessary tools for operating a field operational trial with
cooperative systems on a European level and comprehensive assessment of the impacts.
PRESERVE 2014 2011-2014 Funded
The mission of PRESERVE is, to design, implement, and test a secure and scalable V2X Security Subsystem for realistic
deployment scenarios. Preserve Objectives:
- Create an integrated V2X Security Architecture (VSA) and design, implement, and test a close-to-market implementation
termed V2X Security Subsystem (VSS).
- Prove that the performance and cost requirements for the VSS arising in current FOTs and future product deployments can
be met by the VSS, especially by building a security ASIC for V2X.
- Provide a ready-to-use VSS implementation and support to FOTs and interested parties so that a close-to-market security
solution can be deployed as part of such activities.
- Solve open deployment and technical issues hindering standardization and product pre-development.
PReVENT 2008 2004-2008 Funded
The Integrated Project PReVENT was a European automotive industry activity co-funded by the European Commission to
contribute to road safety by developing and demonstrating preventive safety applications and technologies. The goal of
Integrated Project PReVENT was to contribute to the:
- road safety goal of 50% fewer accidents by 2010 - as specified in the key action 2.3.1.1 eSafety for Road and Air Transport
from the European Union;
- competitiveness of the European automotive industry;
- European scientific knowledge community on road transport safety;
- congregation and cooperation of European and national organisations and their road transport safety initiatives PReVENT
envisions the early availability of advanced, next generation preventive and active
- safety applications and enabling technologies and an accelerated deployment on European roads.

Study on the Deployment of C-ITS in Europe: Final Report | 63
Ricardo in Confidence Ref: Ricardo/ED60721/Issue Number 1
Ricardo Energy & Environment
Project End Dates Status Description Lead country Partner Countries
REGIOCROSS 2011 2008-2011 FundedFunded by the Czech Ministry of Transport.
Road type: Railway crossing.
Scale of deployment: Field testing on level-crossing in Brezhrad (nearby the town of Hradec Kralove) in the Czech Republic
Czech Republic
SAFESPOT 2010 2006-2010 Funded
The SAFESPOT (2006 – 2010)project has demonstrated and tested the applications and use cases developed in different
project activities through the scheduled tests that were realised at 6 different Test Sites. The Test Sites involving six European
countries have used existing infrastructures equipped with new SAFESPOT systems and have tested interoperability among
different countries. Four Test Sites were shared with the CVIS Integrated Project.
Objective:
The key to avoiding road accidents is to extend drivers' time/space horizon in their perception of safety-relevant information,
and to improve the precision, reliability and quality of this information. The extent of 'perception' of autonomous vehicle-based
systems cannot obviously go beyond the operative range of the sensors. Although effective real time awareness of the
vehicle's "surrounding environment" can be achieved, this clearly has limits.
SAFESPOT aims to:
- Use the infrastructure and the vehicles as sources and destinations of safety-related information and develop an open,
flexible and modular architecture and communication platform.
- Develop the key enabling technologies: ad-hoc dynamic network, accurate relative localisation, dynamic local traffic maps.
- Develop and test scenario-based applications to evaluate the impacts on road safety.
- Define a sustainable deployment strategy for cooperative systems for road safety, evaluating also related liability,
regulations and standardisation aspects.
Italy
Hungary
Germany
Netherlands
France
Spain
Greece
Belgium
United Kingdom
Sweden
Poland
Norway
Finland
SCOOP@F 2018 2014-2018 Funded
The SCOOP@F (Système Coopératif Pilote @ France) Project aims at deploying C-ITS from 2014 onwards in France. Its
main objective is to improve the safety of road transport and of road operating staff during road works or maintenance. It
consists of 5 specific sites with different types of roads: Ile-de-France, "East Corridor" between Paris and Strasbourg,
Brittany, Bordeaux and Isère. SCOOP@F is composed of SCOOP@F Part 1 from 2014 to 2015 (ongoing) and SCOOP@F
Part 2 from 2016 to 2018. It will equip 3000 vehicles and 2000 km of streets, intercity roads and highways.
Part 1 of SCOOP@F deals with the study and pre-deployment phase. Five test sites will be created on intercity roads in Ile-de-
France and Bretagne, the Paris-Strasbourg highway, Bordeaux and its bypass and county roads in the Isère. For each test
site, roads and vehicles will communicate through wireless networks, i.e. using both wi-fi routers (along the road and
embedded receptors in the vehicles) and public GSM networks. Part 1 of SCOOP@F will run from 2014 - 2015.
SCOOP@F Part 2 will run from January 2016 to December 2018 and includes the validations of C-ITS services in open
roads, cross border tests with other EU Member States and development of a hybrid communication solution (3G-4G/ITS G5).
SCOOP@F Part 2 will cooperate with ongoing European pilot projects and the EU C-ITS platform. The project aims at
reaching a critical mass in the number of tested vehicles, roads and services, in order to provide a representative evaluation
of C-ITS. SCOOP@F Part 2 will cost EUR 20,036,598, of which EUR 10,018,299 will be provided by the EU CEF.
France
Austria
Spain
Portugal

Study on the Deployment of C-ITS in Europe: Final Report | 64
Ricardo in Confidence Ref: Ricardo/ED60721/Issue Number 1
Ricardo Energy & Environment
Project End Dates Status Description Lead country Partner Countries
SCORE@F 2013 2010-2013 Funded
SCORE @ F (Cooperative System Experimental Road @ France) is a collaborative C-ITS research project, which included
FOTs. A French Field Operationnal Test for Road Cooperative Systems, in collaboration with DRIVE C2X and CO-DRIVE
projects. The purpose of the project is to test a first set of thirteen use cases, in order to prepare a large-scale FOT before
deployment. A hundred of naive drivers have been recruited and three test sites were opened in order to cover a diversity of
driving situations. Most use cases were related to road-safety.
France
SIMPLI-CITY 2015 2012-2015 Funded
SIMPLI-CITY will provide a holistic framework, which structures and bundles potential services that could deliver data from the
various sources to road user information systems as well as allow road users to make use of the data and to integrate it into
their driving experience. The main components of the SIMPLI-CITY system are:
Mobility Service Framework: A next-generation Europe-wide service platform allowing the creation of mobility-related
services as well as the creation of corresponding Apps. This will enable third party providers to produce a wide range of
interoperable, value-added services, and Apps for road users.
Mobility-related Data as a Service: A framework for the integration of various different data sources like sensors, cooperative
systems, telematics, open data repositories, people-centric sensing, and media data streams, so that these data can be
accessed and utilised in a unified way.
Personal Mobility Assistant: An end user assistant that allows road users to make easy use of the information provided by
Apps and to interact with them based on a speech recognition approach.
Austria
Germany
Spain
Ireland
Italy
Netherlands
Sweden
simTD 2013 2008-2013 Funded
The simTD research project is shaping tomorrow’s safe and intelligent mobility through researching and testing car-to-x
communication and its applications. simTD will put the results of previous research projects into practice. For this purpose
realistic traffic scenarios will be addressed in a large-scale test field infrastructure around the Hessian city of Frankfurt am
Main. The project will also pave the way for the political, economic and technological framework to successfully set up car-to-
car and car-to-infrastructure networking. Germany
SISCOGA 2011 2009-2011 Funded
A FOT for C2X applications will take place in Spain during 2010 and 2011 (SISCOGA, SIStemas COoperativos GAlicia). It
will be based on an intelligent corridor, which is located in Galicia and will make use of the existing road network. CTAG
(Galician Automotive Technology Centre) and DGT (Traffic Management in Spain), through the Northwest Management Traffic
Centre, will use existing infrastructure (beacons, road posts…) of a road stretch to carry out the tests, equipping both in-
roadside and more than 100 vehicles with the necessary hardware and software. The Traffic Management Centre of DGT in
Spain controls the field equipment installed on the roads. This equipment communicates by a fibreoptic LAN network with
SDH nodes finishing. Also, these stations communicate via 3G, which makes it possible to monitor their status continuously.
Some of these stations are also connected to a weather station.
he additional equipment included in this intelligent corridor comprehends more than 30 Road Side Units working at 5,9 GHz.
Some of these Road Side units are placed just at the entrance of Vigo city, being capable to work with traffic lights
information.
The vehicles are divided in the following groups: - 20 fully equipped (Class I) passenger vehicles, with 5.9 GHz on board
Communication units, GPS, specific HMI and CAN logging. - 5 emergency vehicles also with Class I equipment - 2 buses and
2 trucks with Class I equipment - 80 Class II equipped vehicles, with GPS and UMTS.
Permanent corridor of more than 100 km to carry out field operational tests and pilots to test in real roads cooperative safety
and efficiency applications. The cooperative corridor includes interurban (AP9, A52 and A55) and urban scenarios (Vigo City)
with more than 50 cooperative road side units connected to the DGT and Vigo Council Traffic Management Centres.
Spain
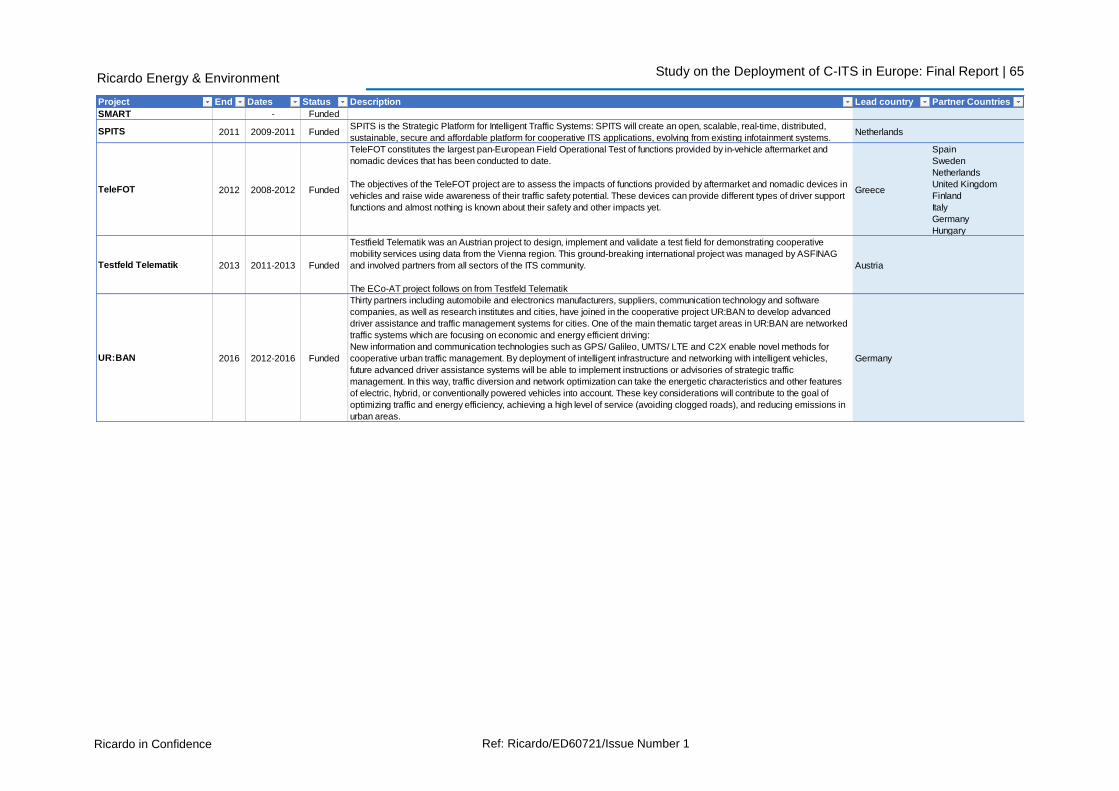
Study on the Deployment of C-ITS in Europe: Final Report | 65
Ricardo in Confidence Ref: Ricardo/ED60721/Issue Number 1
Ricardo Energy & Environment
Project End Dates Status Description Lead country Partner Countries
SMART - Funded
SPITS 2011 2009-2011 FundedSPITS is the Strategic Platform for Intelligent Traffic Systems: SPITS will create an open, scalable, real-time, distributed,
sustainable, secure and affordable platform for cooperative ITS applications, evolving from existing infotainment systems.Netherlands
TeleFOT 2012 2008-2012 Funded
TeleFOT constitutes the largest pan-European Field Operational Test of functions provided by in-vehicle aftermarket and
nomadic devices that has been conducted to date.
The objectives of the TeleFOT project are to assess the impacts of functions provided by aftermarket and nomadic devices in
vehicles and raise wide awareness of their traffic safety potential. These devices can provide different types of driver support
functions and almost nothing is known about their safety and other impacts yet.
Greece
Spain
Sweden
Netherlands
United Kingdom
Finland
Italy
Germany
Hungary
Testfeld Telematik 2013 2011-2013 Funded
Testfield Telematik was an Austrian project to design, implement and validate a test field for demonstrating cooperative
mobility services using data from the Vienna region. This ground-breaking international project was managed by ASFINAG
and involved partners from all sectors of the ITS community.
The ECo-AT project follows on from Testfeld Telematik
Austria
UR:BAN 2016 2012-2016 Funded
Thirty partners including automobile and electronics manufacturers, suppliers, communication technology and software
companies, as well as research institutes and cities, have joined in the cooperative project UR:BAN to develop advanced
driver assistance and traffic management systems for cities. One of the main thematic target areas in UR:BAN are networked
traffic systems which are focusing on economic and energy efficient driving:
New information and communication technologies such as GPS/ Galileo, UMTS/ LTE and C2X enable novel methods for
cooperative urban traffic management. By deployment of intelligent infrastructure and networking with intelligent vehicles,
future advanced driver assistance systems will be able to implement instructions or advisories of strategic traffic
management. In this way, traffic diversion and network optimization can take the energetic characteristics and other features
of electric, hybrid, or conventionally powered vehicles into account. These key considerations will contribute to the goal of
optimizing traffic and energy efficiency, achieving a high level of service (avoiding clogged roads), and reducing emissions in
urban areas.
Germany

Study on the Deployment of C-ITS in Europe: Final Report | 66
Ricardo in Confidence Ref: Ricardo/ED60721/Issue Number 1
Ricardo Energy & Environment
9 Annex C: Case studies
9.1 CASE STUDY: Car-to-Car Communication Consortium
9.1.1 Overview
The Car2Car Communication Consortium (C2C-CC) is a non-profit, industry-driven organisation initiated by European vehicle manufacturers, founded in 2002. It is also supported by and open to equipment suppliers, research organisations and other partners.
The primary objectives of the C2C-CC have been to secure a royalty-free frequency band for V2X6 (established at 5.9GHz for Europe in 2008), and standardisation (ITS International, 2012a). In order to ensure interoperable products, a significant part of specifications (protocols, testing etc.) must be guided by standards. As such, the C2C-CC has a very tight link to the ETSI TC ITS Standardisation, and many C2C-CC members have a strong commitment to the standards’ Working Groups. C2C-CC has focused on the initial use cases for V2X technologies, telecommunications standards and the technologies which are critical to provide reliable and secure communications both between vehicles and between cars and the roadside infrastructure. The working assumption of C2C-CC is that the deployment of V2X will begin in cars (although this view is not universally supported by stakeholders in partner initiatives) (ITS International, 2012a).
C2C-CC has a self-imposed target of starting roll-out of V2X systems in 2015, set by a memorandum of understanding (MoU) signed by the 12 major vehicle manufacturers, pledging a common approach to deployment and to standards being drawn up in Europe. The MoU was developed in recognition of the fact that mass deployment is needed for manufacturers to benefit, and therefore no single manufacturer can develop the necessary systems alone (ITS International, 2012a).
To ensure that the roadside infrastructure is ready for the availability of in-car systems the C2C-CC recognises the need for, and seeks to establish, cooperative agreements with public and private road operators across Europe. As for how specifically the services and applications are developed in the cars, the details (e.g. whether audio, visual or haptic alerts are used) are left to each manufacturer in order to allow for competition (ITS International, 2012a).
9.1.2 Objectives
As an umbrella organisation for European vehicle manufacturers and equipment suppliers, C2C-CC set out to establish system specifications and common standards to ensure interoperability between vehicles. Its stated objectives are outlined in Box 9-1.
Box 9-1: Stated objectives of C2C-CC
• to develop
...an open European standard for C-ITS
...an associated validation process focusing on V2V Systems
...realistic deployment strategies and business models to speed-up the market penetration
...a roadmap for deployment of C-ITS (for V2V and V2I)
• to contribute
...to the development of European standards for V2I Communication being interoperable with the specified V2V standard
...to an associated validation process
...its specifications to the standardisation organisations, in particular ETSI TC ITS, in order to achieve common European standards for ITS
6 Vehicle 2 Vehicle (V2V) and Vehicle 2 Infrastructure (V2I communications (collectively “V2X Communications”).

Study on the Deployment of C-ITS in Europe: Final Report | 67
Ricardo in Confidence Ref: Ricardo/ED60721/Issue Number 1
Ricardo Energy & Environment
• to push
...the harmonisation of C2C Communication Standards world-wide
• to promote
...the allocation of a royalty free European wide frequency band for V2V applications
...joint deployment of C-ITS by all stakeholders
• to demonstrate
...the C2C-System as proof of technical and commercial feasibility
As part of the Amsterdam Group (see separate case study in Section 9.2), C2C-CC is leading the work on several of the open issues identified by the Group, including system specifications, security and privacy frameworks, agreement on compliance assessment processes and development of life cycle management (Amsterdam Group, 2013). C2C-CC members have been closely involved with the drafting of the ‘release 1’ set of standards on ITS-G5 via the ETSI TC ITS.
Another key activity for C2C-CC in 2014/2015 is around the frequency spectrum allocated to C-ITS applications. The current frequency bands allocated to C-ITS applications ITS-G5A and ITS G5B are seen as too narrow for applications beyond Day 1 and are very close to the 5.8 GHz toll road band (Skov Andersen, C-ITS Acticities in Europe, ICT for Next Generation ITS, 6 March 2015, 2015). To avoid interference with the 5.8 GHz system, very high spectrum mask requirements (necessitating expensive spectrum filters on ITS stations to filter out signals on adjacent frequencies) have been set. To allow ‘reasonable G5 implementation’ (Skov Andersen, 2014), these are currently under revision. One route for widening the C-ITS frequency spectrum is to share the 5.4 GHz to 5.7 GHz frequency band with Wi-Fi (ITS-G5C). The details of the co-existence within this spectrum are a further current focal area of C2C-CC work (Skov Andersen, 2014).
9.1.3 Stakeholders Involved
C2C-CC was founded in 2002 by four vehicle manufacturers and has since grown to include most major European car manufacturers, various equipment suppliers and research institutions (ITS Niedersachsen, 2012).
There are three categories of “Active Membership” for organisations who want to contribute to the subject matter of the C2C-CC:
1. Partner- restricted to vehicle manufacturers only
2. Associate Member- all other companies
3. Development Member- Universities and research organisations
In addition, any person, company or organisation that is interested in the topic and results released by the Consortium may have ‘Basic Membership’ of the consortium.
Over time, the number of members in the consortium has grown.7
7 http://icapeople.epfl.ch/panos/SVCWCR/presentations/20080220_Presentation_SeVeComWorkshop_C2C-CC-Sec-WG_bw.pdf

Study on the Deployment of C-ITS in Europe: Final Report | 68
Ricardo in Confidence Ref: Ricardo/ED60721/Issue Number 1
Ricardo Energy & Environment
Table 9-1 : List of members and partners of C2C-CC
Partners Associate Members Development
Members
Audi Atmel LG BASt
BMW Group Autotalks Marben CSIC
Daimler Bosch NEC DLR
Ford Cetecom Nordsys EURECOM
Honda Cohda Wireless NXP Fraunhofer AISEC, ESK, FOKUS, Heinrich
Hertz Institute, SIT Hyundai Commsignia Renesas HTW- University of
applied sciences Jaguar Land Rover Continental Rohde & Schwarz IFAK
MAN Delphi Security Innovation IHP- Innovators for high performance
Opel Denso Siemens IKA
PSA Peugeot Citroen
dSPACE Spirent Communication
IMDEA Networks
Renault EICT Swarco IMST
Volkswagen Escrypt Tass International INRIA
Volvo Hessen TE connectivity ISMB- Instituto Superiore Mario Boella
Yamaha Hitachi Ublox KIT- Karlsruhe Institute
of Technology
IAV- Automotive
Engineering Vector KTH- Electrical
Engineering KOSTAL Visteon Electronics Technische
Hochschule Ingolstadt
Lesswire TNO
Technische Universitat Braunschweig
Technische Universitat
Chemnitz Technische Universitat
Dortmund
TUM
Leibniz Universitat Hannover
University of Twente
UULM
Source: C2C-CC website (accessed May 2015)
9.1.4 Timings and progress
Table 9-2 summarises the timings of milestones around C2C-CC. Table 9-2: Time line of activities
Planned date
Actual date Activity
- 2002 Founding of C2C-CC
- 2007 Launch of C2C-CC manifesto (C2C-CC, 2007)
2008 2008-2012 Demonstration events

Study on the Deployment of C-ITS in Europe: Final Report | 69
Ricardo in Confidence Ref: Ricardo/ED60721/Issue Number 1
Ricardo Energy & Environment
Planned date
Actual date Activity
2011 - Deployment co-ordination with infrastructure organisations and national road authorities
2011-2013 2013-2014 Field Operational Tests (simTD, SCORE@F, DRIVE C2X)
July 2012
Release 1 in November 2013, further
amendments/corrections ongoing
Finalisation of standardisation within both ETSI TC ITS and CEN TC 278
2015 Unlikely to be launched in 2015 given several
open issues on standards and architecture
Launch C-ITS systems on the marketplace
Sources: C2C-CC (2011),
At present, there is continued progress on advancing communication protocols and standards. However, BSI (the German Federal Office for Information Security) are demanding a more stringent security concept than the industry consortia had foreseen, which may mean some changes to the ETSI security standard (Skov Andersen, 2014; 2015) .
C2C-CC work will start extending beyond ‘day one’ applications, with a forthcoming roadmap setting out timelines for deployment of advanced C-ITS applications.
Figure 9-1: Focus of upcoming C2C-CC roadmap
Source: Skov Andersen (2014)

Study on the Deployment of C-ITS in Europe: Final Report | 70
Ricardo in Confidence Ref: Ricardo/ED60721/Issue Number 1
Ricardo Energy & Environment
9.1.5 Targeted C-ITS applications
A set of applications were identified in the MoU as so called “Day-1 applications” from the vehicle manufacturer perspective based on standards developed within ETSI and CEN, but also other standards organisations such as SAE, IEEE and ISO.
Emergency Vehicle Warning
Emergency Brake Light
Stationary Vehicle Warning
V2X Rescue Signal
Traffic Jam Ahead Warning
In Vehicle signage
Hazardous Location Warning
Contextual Speed Limit
Road Work Warning (stationary and moving)
Signal Violation Warning
Green Light Optimal Speed Advisory
The MoU clearly recognised the need for support from infrastructure and road administrations, and subsequently the scenarios were refined and elaborated in the Amsterdam Group. The applications listed by C2C-CC as Day 1 in their original proposals are mostly consistent with those currently indicated by the Amsterdam Group (COMeSafety2, 2014). Functional specifications and roadmaps towards full deployment for each of the services are going to be finalised in close cooperation between AG and C2C-CC. The deployment scenarios foresee that most car makers introduce these applications on a competitive basis. Applications are based on the ITS-G5 technology and gradually infrastructures will be populated with devices supporting the applications (COMeSafety2, 2014).
9.1.6 Relevance to European context and best practices / lessons learned
C2C-CC has been a key organisation for advancing C-ITS in Europe, its core purpose being the development of standards in order to get C-ITS technologies on the road. With the publication of ‘release 1’, C2C-CC has largely fulfilled its initial purpose, although work remains to refine, correct and extend standards with the experiences gained in first deployment projects, as well as developing strategies for ‘day 2’ applications. According to a stakeholder interview, C2C-CC generally have open, technical discussions without many clashes of interests. Members generally find agreement on most topics. Finding agreement with the US on CAM and DENM message standards were amongst the most challenging activities, and took 3 years. As the core standards for ITS-G5 technologies are now in place, car manufacturers are trialling C-ITS V2V services and will be incorporating these into forthcoming vehicle generations (which take around 7 years to develop). While the technology will not reach the market in 2015, as envisioned in the C2C-CC MoU, the interviewed stakeholder emphasised that when ‘release 1’ was finalised, it got the attention of the top-level management at OEMs and everyone is now working on it. Deployment, especially of V2V technologies will therefore be a largely industry-driven effort. Details on the timescales and applications to be deployed therefore need not be defined by governments or European Commission legislation.

Study on the Deployment of C-ITS in Europe: Final Report | 71
Ricardo in Confidence Ref: Ricardo/ED60721/Issue Number 1
Ricardo Energy & Environment
9.2 CASE STUDY: Amsterdam Group
9.2.1 Overview
The Amsterdam Group (AG) is a strategic alliance with the objective to facilitate joint deployment of C-ITS in Europe in recognition of the fact that deployment of C-ITS needs a multi-stakeholder cooperation.
It was formed in 2011 and includes CEDR (European organisation for national road administrations), ASECAP (European association of toll road operators), POLIS (European cities and regions network) and C2C-CC (Car2Car Consortium of vehicle and equipment manufacturers). Each of these operates as an umbrella organisation for a larger number of members.
The Group therefore represents a close cooperation between the automotive industry and road authorities/operators. This composition means that the Group can represent the broad spectrum of C-ITS stakeholders, including those who have to take investment decisions. (ITS International, 2013).
Involvement of members of umbrella organisations depends on (Geißler, 2013):
Their experience and state of play in the application of ITS,
Their contributions to the related activities in C-ITS,
Their readiness to take the risk for day 1 implementation,
Their business model view (economic and/or social/image) in the domain,
Their framework in terms of contractual obligations.
The Group was established in order to build further upon previous successful work carried out elsewhere, to ensure that developments were fully taken advantage of. These included EC projects (such as CVIS, COOPERS, SAFESPOT, COMeSAFETY, DRIVE C2X and FOTSIS), work within CEN, ETSI, EasyWay CoSy TF, the C2C-CC Working Groups, large-scale field European operational tests (FP7) and national projects like Testfeld Telematik, simTD, SCORE@F, Converge, Spit, etc. (Amsterdam Group, 2013).
One of the AG’s key activities is to provide strategic support to European deployment projects (Amsterdam Group, 2013). This role is important for ensuring the use of common standards and technical procedures across projects. For example, the NL-DE-AT Deployment Corridor and SCOOP@F were initially going down separate paths before AG brought them together to better coordinate deployment activities. When agreement on a technical procedure is reached within the AG, it produces a “White Paper” on proposed standard recommendations, which are forwarded to the standardisation groups, mostly CEN and ETSI.
The approach of the Amsterdam Group is different to many other EU level initiatives in that it is driven by market forces and “setting out to achieve results” (ITS International, 2013). This is in contrast to the more top-down and supporting role that is often provided at EU level.
The Group has developed an influential ‘Roadmap’ document with other stakeholders and interested organisations, which sets out a four-stage ramp up towards the full deployment of C-ITS technologies in Europe (Amsterdam Group, 2013). The aim of the Roadmap is to provide practical recommendations for Group members and act as a guide to deployment of C-ITS in corridors (Hess, 2013). It provides a list of Day 1 services and the necessary elements needed to start deployment by 2015. As part of this process, the Netherlands, Germany and Austria decided to commit to the NL-DE-AT Deployment Corridor initiative and set more specific targets. The NL-DE-AT Deployment Corridor therefore arose out of the AG’s Roadmap activities.
9.2.2 Objectives
The initial objective of the Group was to address the “chicken-and-egg” situation in terms of who invests in C-ITS first – i.e. the automotive industry or the infrastructure owners and operators (ITS International, 2013). It aims ‘to facilitate information exchange, discussion and creation of solutions between the involved stakeholders in the context of C-ITS’ with the objective of ensuring ‘interoperability and lifecycle management both technically and operationally’ (Amsterdam Group, 2013).
A second objective was to develop the Roadmap, based on an evaluation of the barriers to deployment and the options for overcoming the barriers through joint efforts of car manufacturers and road authorities.

Study on the Deployment of C-ITS in Europe: Final Report | 72
Ricardo in Confidence Ref: Ricardo/ED60721/Issue Number 1
Ricardo Energy & Environment
As part of the Roadmap, in the short term, AG is prioritising ‘Day 1 Applications’ to be implemented in major European regions. The timeline of the AG Roadmap foresees that this deployment should start from 2015 onwards. In the longer term the members of AG aim to facilitate roll out of mature and realistic market oriented applications with increasingly wider geographical and market scope.
9.2.3 Stakeholders Involved
The Amsterdam Group includes the key members and organisations who have the means to jointly develop and deploy C-ITS in Europe.
The umbrella organisations signed a Letter of Intent (LoI) in 2012 to show their support towards C-ITS deployment.
Table 9-3: Umbrella organisations part of the Amsterdam Group
Umbrella Organisation Type of Organisation Members
ASECAP
European professional
association of operators of toll
road infrastructures
16 Members; 5 Associate
members
CEDR European organisation for the
national road administrations
27 European Road Authorities
POLIS Network of European cities and
regions 58 Cities and Regions
Car 2 Car Communication
Consortium (C2C-CC)
European vehicle
manufacturers, equipment
suppliers and research
organisations.
13 OEMs; 24 Global Suppliers
The organisations that form part of the group have different levels of involvement. In the Roadmap document it was foreseen that initial deployment of ‘Day 1’ services from 2015 would be led by industry, with road authorities and cities becoming more involved at a later stage (Amsterdam Group, 2013). However, according to interviewees, the car industry has not been successful so far in setting up a V2V business model. Therefore, the emphasis has recently shifted to more policy-driven V2I deployment with significant involvement from road authorities and industry. Cities (via the POLIS network) have been slightly less involved in AG activities, as initial deployment plans were highways-focussed. However, this is changing as NL and AT are including urban applications into their C-ITS Deployment Corridor initiatives.
Representatives from each of the four members meet quarterly in plenary meetings. These are steered by a management group formed of one representative of each of the members. The chairperson rotates between the members. Guests from projects, the European Commission or other stakeholders may be invited to the meetings as relevant to seek input or exchange views.
The AG Roadmap identifies certain open issues which need to be addressed to allow deployment of C-ITS technology by 2015, and lead organisations have been assigned to each issue. The Group is taking the lead only where needed, and contributing mainly via its members to solve open issues. This reflects their emphasis on providing strategic guidance rather than detailed technical support.
The Day 1 services have a range of technical, operational and strategic activities which need to be carried out through cooperation among the members.

Study on the Deployment of C-ITS in Europe: Final Report | 73
Ricardo in Confidence Ref: Ricardo/ED60721/Issue Number 1
Ricardo Energy & Environment
Table 9-4 : Open issues and Partner responsible for leading development
Open Issues Details Lead
Day 1 Applications
Developing a shortlist of Day 1 services;
Identification of gaps in V2V and V2I services
that have been field tested in Europe
AG
Technical Standardisation Support and analyse technical standards set by
CEN, ETSI, etc.; Coordination and
harmonisation activities to fast track Release 1
of C-ITS standards; Support on Release 2
standards
ETSI/CEN
System Specification
Creation of a minimum system specification in
order to integrate component development and
individual OEM to achieve a reliable, consistent
and complete service chain
C2C-CC
Decentralised Congestion
Control
Managing signal congestion due to
incoming/outgoing messages especially when
there is a higher vehicle penetration
ETSI
Co-existence- 5.8/5.9
GHz Applications
A harmonised standard to be adopted and
tested by all member states ETSI/CEPT
International
Harmonisation
Implementation of C-ITS is international and
OEMs target different markets, information
exchange is important to understand if other
partners have already addressed any open
issues
EC (DG
CONNECT)
Specify Backend services Yet to be decided Front Runners
Roles & Responsibilities A general standard has been developed within
CEN TC 278; Any new use case should
specifically described roles & responsibilities
which may vary based on location or road
authority
Front Runners
Agree on Security &
Privacy framework
A detailed security and privacy framework has
been developed and standardized within ETSI
TC ITS; A common security public key
infrastructure (PKI) is needed and the related
policy framework needs to be developed
C2C-CC
Agree on Compliance
Assessment Processes
Compliance and Assessment needs to be
developed for vehicle as well as infrastructure;
This includes common test procedures for
general and specific test cases
C2C-CC
Develop Life Cycle
management
Life cycle management is important to ensure
technical implementation of C-ITS technology for
day 1 services is also applied for day two
services
C2C-CC

Study on the Deployment of C-ITS in Europe: Final Report | 74
Ricardo in Confidence Ref: Ricardo/ED60721/Issue Number 1
Ricardo Energy & Environment
Open Issues Details Lead
Quality Management A stringent quality management is important to
enhance reliability and improve consistency
along the entire value chain
Not identified yet
Hybrid Communication
Concept
Cooperative services require different
technologies to work together, some are one-
way communication while others are two way,
some involve short range communication (ITS
G5) while backend services require 3G or 4G,
thus a common agreement on communication
architecture is required
AG
Coordinated Marketing
Activities
Efficient marketing and PR of C-ITS is required
catered to end users, countries, OEMs and road
operators
AG
Retrofit Devices Higher availability of nomadic devices for
retrofitting will lead to higher penetration rate Not identified yet
Implementation and
Operation
An organisational structure is required to
conduct implementation and organisational
activities
Front Runners
Source: (Amsterdam Group, 2013)
9.2.4 Targeted C-ITS applications
The AG has agreed upon a ‘phased deployment approach’ with initial deployment of simple (‘Day 1’) services achieving clear user benefits even with limited penetration and limited infrastructure technology implementation. The complexity will increase in the later phases and incorporate technologies such as ‘crash avoidance’ and ‘hard safety services’. The final objective is to have service environment where there is a complete integration of road infrastructure and cooperative capabilities of the vehicle resulting in an optimum rage of cooperative services.

Study on the Deployment of C-ITS in Europe: Final Report | 75
Ricardo in Confidence Ref: Ricardo/ED60721/Issue Number 1
Ricardo Energy & Environment
Figure 9-2 : Phases of C-ITS deployment
Source: (Amsterdam Group, 2013)
The scope of applications considered includes those relevant to safety, efficiency and reliability, reflecting the cooperation between road authorities and operators, city authorities, industry and the European Commission.
The AG targets deployment both on the road and in the vehicle, inclusive of all vehicle brands, classes (passenger cars, commercial vehicles, buses and municipal vehicles) and road types (motorways, rural roads and roads in urban areas).
9.2.4.1 Day 1 Services
There is already an agreed list of Day 1 applications which is central to the initial deployment of C-ITS. The use cases are both inter-urban and well as focused on the urban environment. The characteristics of the use cases shortlisted by AG are:
a) Services with clear user benefits and supported by a business model
b) Blend of services that support all environments of C-ITS (rural, urban, inter-urban) and across technologies (V2V, V2I)
c) Services that are feasible and low risk
d) Services that provide credibility to C-ITS
e) Services that support faster penetration
As such, the list represents technologies that are simple and will achieve benefits even with limited penetration and limited hot-spot implementation. A key priority in the selection of services was the need to support the uptake of C-ITS by ensuring that services were not introduced too soon, before they are ready, so that risks of creating a bad image during the early phases of introduction (thereby hampering further user acceptance) are mitigated.
This list has been highly influential in the discussions of the CBA Working Group when establishing the list of Day-one services to include in the current project. The services have also been taken up by the DE/NL/AT Deployment Corridor project.
Table 9-5 : Shortlisted Day 1 services
V2V Services I2V Services
Hazardous location warning Road works warning
Slow vehicle warning In-Vehicle signage
Traffic jam ahead warning Signal phase and time

Study on the Deployment of C-ITS in Europe: Final Report | 76
Ricardo in Confidence Ref: Ricardo/ED60721/Issue Number 1
Ricardo Energy & Environment
V2V Services I2V Services
Stationary vehicle warning Probe vehicle data
Emergency brake light
Emergency vehicle warning
Motorcycle approaching indication
9.2.4.2 Beyond Day 1
In terms of timings for applications beyond day 1, the AG has wider service list to be gradually
implemented, and discussions for steps beyond day 1 applications are ongoing. The forthcoming Dutch
EU Council presidency from next year will be used to raise the profile of ITS and raise the profile of
post-day-1 applications.
9.2.5 Timings
As part of the Roadmap document, the AG has put together timeline for addressing all strategic activities that are critical for deployment of C-ITS technology by 2015 (Figure 9-3).
Figure 9-3: Timeline of Group activities
Source: (Hess, 2013)
The actual implementation has been delayed due to two issues:
Security: the German Government agency for IT security found the proposed protocol for V2V and V2I communication, as developed by the car manufacturers, to not be sufficiently secure. After intensive discussions, the concept for a solution has been developed, and it is hoped that it can be finalised by the end of 2015. The proposed solution entails starting off with the original security protocol and implementing the required changes once an improved protocol is operational. It is ensured that the equipment is compatible with the planned security upgrade.
Frequency issues: finding a solution to the issue of interference between 5.8 GHz toll collection systems and 5.9 GHz C-ITS systems interference has also led to delays in implementation. A key point of contention was determining who pays for what. The solution entails the following:

Study on the Deployment of C-ITS in Europe: Final Report | 77
Ricardo in Confidence Ref: Ricardo/ED60721/Issue Number 1
Ricardo Energy & Environment
o For existing toll road plazas, locations are saved on vehicle’s navigation system.
When a vehicle approaches the toll road plaza it reduces signal strength of its ITS
device to avoid interference.
o For new toll road plazas, roadside devices will alert vehicles to reduce signal strength
when approaching the plaza.
Due to these delays, the first real demonstration application is now starting April 2016, with first real
deployment on the Corridor in early 2017.
9.2.6 Policy approach
The Amsterdam Group is an informal organisation where members have open discussions. This makes
it powerful, capable of overcoming barriers and advancing the ITS deployment process. AG members
share a common target, namely the deployment of C-ITS, but have different objectives: the automotive
industry is interested in business-led deployment of V2V (and V2I) to provide consumer services,
including safer cars. Road operators are more interested in policy-led deployment in order to increase
safety, efficiency and better traffic management.
It is a process that requires constant management, and needs to be updated with experience from
projects and deployments. It is very much a back office process, where AG representatives negotiate
amongst themselves and then go back to their member organisations and negotiate with them. Also,
AG members are assigned to monitor implementation of agreements, projects and policies, and follow
up with different stakeholders when progress is lagging.
At the European policy level, coordination and agreement amongst stakeholders (Member States,
European Commission and industry) is essential in order to successfully deploy C-ITS, so that followers
will work with same standards as front-runners. AG accomplishes this coordinating function through its
work with the key stakeholders. The Commission’s C-ITS Platform is complementing this process in a
helpful way, as it involves a wider number of stakeholders.
9.2.7 Relevance to European context and best practices / lessons learned
Overall, the Amsterdam Group has been very important to the European policy context. The fact that it brings together key stakeholders in an informal setting has helped define common interests and overcome obstacles. It has been instrumental in setting up the NL-DE-AT Deployment Corridor as a means for implementing the roadmap strategy. AG also helps coordination across European deployment projects and advances the standardisation of the technologies and procedures through its White Papers. However, forums with wider stakeholder involvement from all Member States are also necessary, for example to develop common legislation.

Study on the Deployment of C-ITS in Europe: Final Report | 78
Ricardo in Confidence Ref: Ricardo/ED60721/Issue Number 1
Ricardo Energy & Environment
9.3 CASE STUDY: C-ITS Corridor
9.3.1 Overview
Following discussions in the Amsterdam Group on advancing C-ITS deployment, a MoU for the development of a C-ITS corridor between Vienna in Austria, Munich and Frankfurt in Germany and Rotterdam in the Netherlands (see Figure 9-4) was signed in 2013 by the national transport ministries of the three countries involved. The resulting Joint Deployment initiative provides a basis for closer cooperation between different national projects and activities aimed at advancing the deployment of C-ITS. In Germany, activities are not undertaken as part of a project over a fixed time period with fixed funding but as an initiative, whereas in Austria the ECo-AT project forms the contribution to the C-ITS corridor. In the Netherlands, the C-ITS Corridor is part of a broader transition programme. Other European countries have indicated interest in similar deployment projects and pilots connecting the NL-AT-DE corridor (COMeSafety2, 2013).
The corridor is the first real deployment of C-ITS over three countries in the world (IEEE Spectrum, 2014).
Figure 9-4: C-ITS deployment corridor
Source: (C-ITS Corridor, 2013)
Fundamentally, C-ITS deployment has to be based on standards that specify technical features of the components needed for their application. However, standards can only specify generic capabilities, whereas real world deployment needs additional specification. Furthermore, standards are not yet available for all components and functions required for Day 1 applications (Jandrisits, 2014). As such, the day-to-day work of the corridor project has helped to identify the “open issues” being worked on at the Amsterdam Group, and further development is based on the mutual agreement of sharing the work among the Amsterdam Group and corridors (Jandrisits, 2014). Third parties (companies that are not involved in the project) will have access to the system specifications as they are published.
C-ITS testing projects had already been implemented in the Netherlands (Dutch Integrated Testsite for Cooperative Mobility DITCM)), Austria (Testfeld Telematik) and Germany (simTD), making a joint implementation of C-ITS more attractive.
9.3.2 Objectives
Ultimately, the cross-governmental commitment intends to incentivise stakeholders, including both automotive industry and infrastructure organisations to further advance the deployment of C-ITS.
The objective is to roll out ‘day one’ C-ITS services, namely roadwork warnings and probe vehicle data on motorways as a common denominator across the three countries. This will help to bridge the gap between R&D and implementation, and define all elements in the C-ITS value chain in cooperation with industry partners. The specifications of the C-ITS systems within the Corridor follow CEN/ETSI standards, or the Amsterdam Group’s White Papers, which form the basis of forthcoming standards. At

Study on the Deployment of C-ITS in Europe: Final Report | 79
Ricardo in Confidence Ref: Ricardo/ED60721/Issue Number 1
Ricardo Energy & Environment
the same time, the Corridor activities help identify open issues and develop standardised solutions. These will then feed into new White Papers and be used in other deployment activities.
Within the Corridor, each country funds its own activities and has slightly different specific objectives. In Germany, the priority is to simply set up the services, while the Netherlands aim to completely change their traffic management and information policy. The Dutch C-ITS activities undertaken as part of the Deployment Corridor are embedded in this process.
A structure is in place where every country has its own R&D activities under which it develops prototypes which will eventually be integrated into the common system (Eurotransport, 2013). This pre-development and proof-of-concept includes:
• road works safety trailers in Hesse around Frankfurt
• the Austrian project ECo-AT
• the extension of Dutch test-site DITCM
The first phase is intended to accomplish the adaptation of components and products of industry partners so that they are fully specified in a “living laboratory”. This will enable the functional specifications for all components of C-ITS systems to be finalised and harmonised in the corridor.
After successful testing on the corridor, the services can be rolled out across the three countries while successively more advanced technologies are deployed on the corridor (Lotz, 2013). In this way, the corridor is intended to become a “carrier” for deployment of further services.
9.3.3 Stakeholders Involved
A MoU for the establishment of cooperation between BMVBS (German Federal Transport Ministry), Building and Urban Development), Rijkswaterstaat (Dutch Transport Ministry) and BMVIT (Austrian Federal Transport Ministry) was signed on 10 June 2013 alongside the Council of Transport Ministers in Luxemburg. Automotive manufacturers and suppliers, as well as the Amsterdam Group and affected regional and national government authorities have also become involved (C-ITS Corridor website, 2015).
A news article on the project (IEEE Spectrum, 2014) suggests that the Corridor was initiated by the Dutch transport ministry which approached its German and Austrian counterparts while the website suggests that the initiative was taken by the German transport ministry (C-ITS Corridor website, 2015). Stakeholder interviews suggest that the initiative arose from within the Amsterdam Group, in order to support the Roadmap with concrete steps.
Aside from the three transport ministries, the Dutch and Austrian road operators, as well as several German State governments are also involved. Industry partners involved include BMW AG, Daimler AG, Ford Deutschland GmbH, Adam Opel AG and Volkswagen AG as well as the Car2Car Consortium and the German Association of the Automotive Industry (VDA). Further participants in the project include suppliers and the Amsterdam Group (C-ITS Corridor website, 2015; Eurotransport, 2013).
Project work is done at a national level but coordinated and harmonised between the three MS. Most of the work therefore takes place at a national level, although some aspects require more of a focus at the international level. For example, according to stakeholder interviews, the work done on security is 80-90% international while back-office activities and standardisation are only around 20% international.
The international work is managed by two international working groups; one for strategic coordination and the other for operational coordination (see Figure 9-5).

Study on the Deployment of C-ITS in Europe: Final Report | 80
Ricardo in Confidence Ref: Ricardo/ED60721/Issue Number 1
Ricardo Energy & Environment
Figure 9-5: Organisational chart of the C-ITS Corridor structure (C-ITS Corridor website, 2015)
Within each country, there is a steering group and a set of project groups. For the international cooperation, there are two teams (Figure 9-5):
The International Strategic Coordination Team (ISCT) sets the strategic direction and comes together 4 times per year – if can’t solve issues, it can take them to the international steering committee (supervisory board). Thus far, this has not yet been the case.
The International Operational Coordination Team (IOCT) coordinates the technical implementation, covering issues such as standards, planning, testing, or ad-hoc problem solving. Different IOCT working groups come together regularly based on need; this can be around 2 to 20 times per year. For example, the security working group has come together frequently in recent times to discuss the issues around the need for a more stringent security protocol.
The supervisory board only meets when required. As the teams have thus far been able to reach agreement amongst themselves, the Supervisory Board has not yet convened.
9.3.4 Timings
In an initial time plan from 2013, first results from the R&D projects were expected for late 2014. From 2015 onwards the corridor is to be equipped with the technology, in partnership with industry. From 2016 onwards, the system components should available for use both on the vehicle and the infrastructure side (Eurotransport, 2013). Whether these timings are in fact being met is not certain.
The timings of ECo-AT (European Corridor – Austrian Testbed for Cooperative Systems), the Austrian contribution to the corridors project, foresee that the final release of system specifications is scheduled for November 2015. Only after these have been tested in the ‘Living Lab’ by industry, cities and road operators will actual deployment start on the corridor (ECo-AT, 2015).
There are ongoing discussions about extending the Corridor to other countries (such as the Czech Republic).
9.3.5 Targeted C-ITS applications
The planned focus is to roll out ITS-G5 standard technology for two applications throughout the corridor:
Roadworks warnings
Probe vehicle data
These applications were chosen as fairly simple ‘Day 1’ services which can be deployed across the length of the corridor in order to prove functionality before developing more complex services. This is consistent with the Amsterdam Group’s philosophy of a ‘phased roll-out’. National projects within the
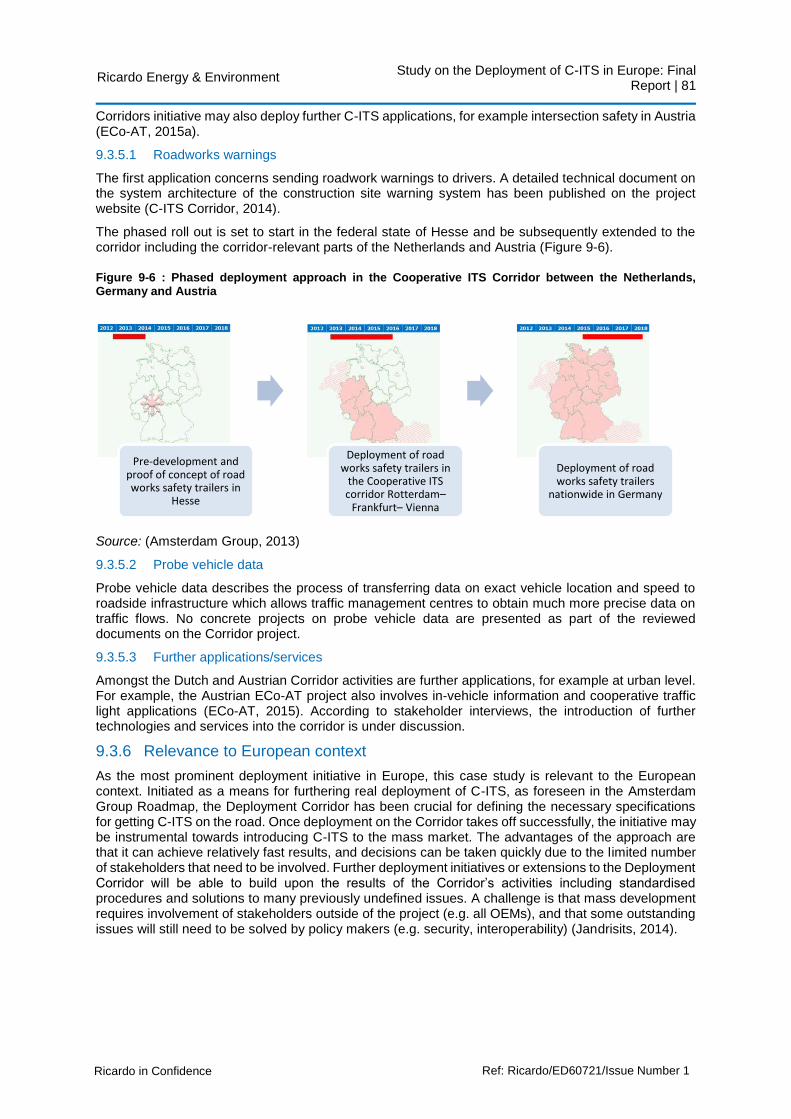
Study on the Deployment of C-ITS in Europe: Final Report | 81
Ricardo in Confidence Ref: Ricardo/ED60721/Issue Number 1
Ricardo Energy & Environment
Corridors initiative may also deploy further C-ITS applications, for example intersection safety in Austria (ECo-AT, 2015a).
9.3.5.1 Roadworks warnings
The first application concerns sending roadwork warnings to drivers. A detailed technical document on the system architecture of the construction site warning system has been published on the project website (C-ITS Corridor, 2014).
The phased roll out is set to start in the federal state of Hesse and be subsequently extended to the corridor including the corridor-relevant parts of the Netherlands and Austria (Figure 9-6).
Figure 9-6 : Phased deployment approach in the Cooperative ITS Corridor between the Netherlands, Germany and Austria
Source: (Amsterdam Group, 2013)
9.3.5.2 Probe vehicle data
Probe vehicle data describes the process of transferring data on exact vehicle location and speed to roadside infrastructure which allows traffic management centres to obtain much more precise data on traffic flows. No concrete projects on probe vehicle data are presented as part of the reviewed documents on the Corridor project.
9.3.5.3 Further applications/services
Amongst the Dutch and Austrian Corridor activities are further applications, for example at urban level. For example, the Austrian ECo-AT project also involves in-vehicle information and cooperative traffic light applications (ECo-AT, 2015). According to stakeholder interviews, the introduction of further technologies and services into the corridor is under discussion.
9.3.6 Relevance to European context
As the most prominent deployment initiative in Europe, this case study is relevant to the European context. Initiated as a means for furthering real deployment of C-ITS, as foreseen in the Amsterdam Group Roadmap, the Deployment Corridor has been crucial for defining the necessary specifications for getting C-ITS on the road. Once deployment on the Corridor takes off successfully, the initiative may be instrumental towards introducing C-ITS to the mass market. The advantages of the approach are that it can achieve relatively fast results, and decisions can be taken quickly due to the limited number of stakeholders that need to be involved. Further deployment initiatives or extensions to the Deployment Corridor will be able to build upon the results of the Corridor’s activities including standardised procedures and solutions to many previously undefined issues. A challenge is that mass development requires involvement of stakeholders outside of the project (e.g. all OEMs), and that some outstanding issues will still need to be solved by policy makers (e.g. security, interoperability) (Jandrisits, 2014).
Pre-development and proof of concept of road works safety trailers in
Hesse
Deployment of road works safety trailers in
the Cooperative ITS corridor Rotterdam–
Frankfurt– Vienna
Deployment of road works safety trailers
nationwide in Germany
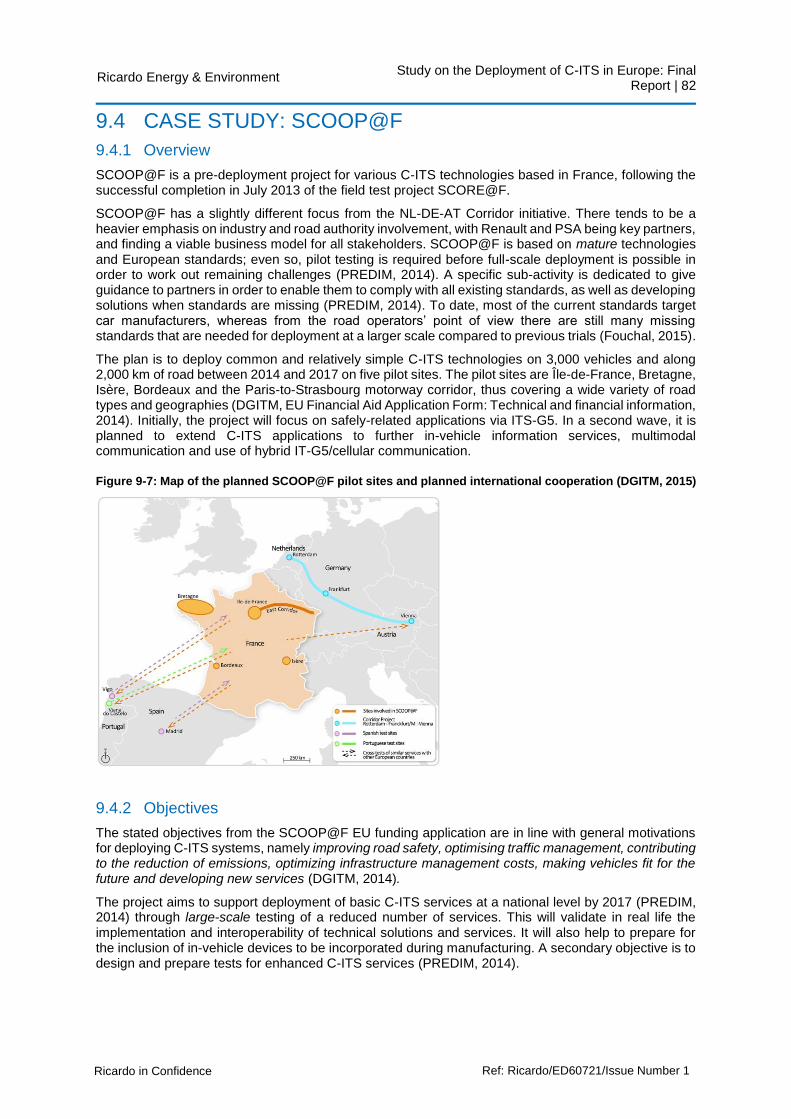
Study on the Deployment of C-ITS in Europe: Final Report | 82
Ricardo in Confidence Ref: Ricardo/ED60721/Issue Number 1
Ricardo Energy & Environment
9.4 CASE STUDY: SCOOP@F
9.4.1 Overview
SCOOP@F is a pre-deployment project for various C-ITS technologies based in France, following the successful completion in July 2013 of the field test project SCORE@F.
SCOOP@F has a slightly different focus from the NL-DE-AT Corridor initiative. There tends to be a heavier emphasis on industry and road authority involvement, with Renault and PSA being key partners, and finding a viable business model for all stakeholders. SCOOP@F is based on mature technologies and European standards; even so, pilot testing is required before full-scale deployment is possible in order to work out remaining challenges (PREDIM, 2014). A specific sub-activity is dedicated to give guidance to partners in order to enable them to comply with all existing standards, as well as developing solutions when standards are missing (PREDIM, 2014). To date, most of the current standards target car manufacturers, whereas from the road operators’ point of view there are still many missing standards that are needed for deployment at a larger scale compared to previous trials (Fouchal, 2015).
The plan is to deploy common and relatively simple C-ITS technologies on 3,000 vehicles and along 2,000 km of road between 2014 and 2017 on five pilot sites. The pilot sites are Île-de-France, Bretagne, Isère, Bordeaux and the Paris-to-Strasbourg motorway corridor, thus covering a wide variety of road types and geographies (DGITM, EU Financial Aid Application Form: Technical and financial information, 2014). Initially, the project will focus on safely-related applications via ITS-G5. In a second wave, it is planned to extend C-ITS applications to further in-vehicle information services, multimodal communication and use of hybrid IT-G5/cellular communication.
Figure 9-7: Map of the planned SCOOP@F pilot sites and planned international cooperation (DGITM, 2015)
9.4.2 Objectives
The stated objectives from the SCOOP@F EU funding application are in line with general motivations for deploying C-ITS systems, namely improving road safety, optimising traffic management, contributing to the reduction of emissions, optimizing infrastructure management costs, making vehicles fit for the future and developing new services (DGITM, 2014).
The project aims to support deployment of basic C-ITS services at a national level by 2017 (PREDIM, 2014) through large-scale testing of a reduced number of services. This will validate in real life the implementation and interoperability of technical solutions and services. It will also help to prepare for the inclusion of in-vehicle devices to be incorporated during manufacturing. A secondary objective is to design and prepare tests for enhanced C-ITS services (PREDIM, 2014).

Study on the Deployment of C-ITS in Europe: Final Report | 83
Ricardo in Confidence Ref: Ricardo/ED60721/Issue Number 1
Ricardo Energy & Environment
9.4.3 Stakeholders Involved
The following stakeholders are involved (IFSTTAR, 2015):
French Ministry of Sustainable Development, Directorate General of Infrastructure, Transport and the Sea (DGTIM) (Project coordinator)
Local authorities in the affected regions
o City of St Brieuc
o Conseils généraux des Côtes d’Armor, du Finistère, d’Ille et Vilaine, de l’Isère,
o Conseil régional de Bretagne
Public road operators (3 Directions Interdépartementales des Routes)
Private road operator (Sanef)
Automotive manufacturers (PSA, Renault)
Universities and research centres (Cerema, IFSTTAR, GIE RE PSA-Renault, Université de Reims Champagne Ardenne, Institut Mines-Télécom)
DGTIM (2014) states that automotive and road equipment suppliers are also involved in elaborating SCOOP@F.
The overall cost of the project is expected to be €20mn (MEDDE, 2014). Up to the end of 2015, a budget of €13.2mn has been set, half of which is funded by the Commission’s TEN-T programme (European Commission, 2014). The project has recently applied for further EU funding (referred to as 2nd phase) under the Connecting Europe Facility. As a project partner, DGITM contributes to the project funding but also benefits from EU funding. Its contribution to the project is around €2.1m and it receives an equivalent amount in EU funding.
The management teams within each of the pilot sites which are headed by the road authority in charge. Also, each feature a representative from the automotive industry (Renault or PSA), from CEREMA and IFSTTAR (two public research bodies), and in the case of the East Corridor, from the Université de Reims Champagne-Ardenne. The national steering committee comprises a central project manager from DGITM plus the managers of the pilots and the project manager of the studies’ activities. As pointed out by a stakeholder, separate from the national steering committee there is also a studies committee, responsible for studies and much more technical than the national steering committee.
According to a stakeholder interview, motivations for the project partners to be involved were quite different individually but a common motivation is to get feedback on pilot deployment. Renault and PSA will be selling cars equipped with SCOOP and are interested in the feedback on what could become a business model later. Similarly, road operators want to see how new technology can improve the way they manage traffic. The vision of all stakeholders is to create a big testing area for deployment under real conditions in order to get feedback on what will happen once vehicles are sold. This includes testing whether any network congestion issues arise with many vehicles in the same area (preliminary calculations suggest this shouldn’t be a problem), testing for driver distractions and for public acceptance of the technologies.
9.4.4 Timings
A revised time schedule which pushes first deployment back by one year has been necessary as the project was originally based on the hypothesis that the technologies are mature and easy to specify which, according to a stakeholder interview, turned out not to be the case. When analysing standards it was found that many applications had not been covered yet, including traffic information and park-and-ride (P&R). Other applications required a much more precise definition, i.e. standards were incomplete.
Based on these issues deployment was is divided into 2 waves. Wave 1 will concentrate on the better specified technologies, i.e. road works warning (more simple approach than on Corridor, but interoperability is ensured), in-vehicle signage (focus on hazardous locations rather than variable message signs which aren’t mature yet) and data collection. Traffic information and P&R will be the focus of Wave 2.
Wave 1 started in 2014 and is due to end in 2017. A very thorough validation phase from autumn 2015 until summer 2016 is scheduled, consisting of three steps:

Study on the Deployment of C-ITS in Europe: Final Report | 84
Ricardo in Confidence Ref: Ricardo/ED60721/Issue Number 1
Ricardo Energy & Environment
Laboratory tests
Testing on lanes
Testing on roads with initial equipment
Driving in the 1st wave is set to start from the end of 2016, with evaluation until the end of 2017. Wave 2 is scheduled to start in 2016 and end in 2018.
As of April 2015, the applications to be deployed have been defined and the exact architecture and technical specifications of the required equipment are close to being finalised. These are being defined in close cooperation with the Corridor project to ensure interoperability. Calls for tender to supply the C-ITS equipment were expected for spring 2015. Also, new project partners from Spain and Portugal are set to join over the coming months. This will allow for testing of the French vehicles in Spanish, Portuguese and Austrian test fields and vice-versa (DGITM, 2015). It was confirmed during a stakeholder interview that tendering is now currently underway for much of the RSU equipment (OBU equipment is purchased directly by the OEMs.
9.4.5 Targeted C-ITS applications
For each test site, roads and vehicles will communicate through wireless devices, based on ITS-G5. The components are roadside units, on-board units for regular vehicles, on-board units for road operator’s vehicles (functioning also as mobile roadside units), and the central SCOOP platform in the road operator’s traffic centres, to which all roadside units are connected (DGITM, 2015).
As also addressed under Section 9.4.4, the following services are targeted for deployment (DGITM, 2014):
Data collection (Vehicle probe data)
In-vehicle signage (human or animal presence alerts, disabled or cross-driving vehicle alerts, stopping or emergency braking, or unprotected accident alerts, and weather alerts, for instance weak visibility)
Roadworks warning
Traffic information
Park-and-Ride (e.g. number of available parking spaces and next bus/train departure)
The aim, as agreed between the French Ministry of Transport and the OEMs was to test not only technical deployment, but also business models. Therefore, more user-oriented services such as the latter two have been included. The quality and acceptance of those consumer services is monitored throughout the project (DGITM, 2014). However, as outlined in Section 9.4.4, the lack of standards on the latter two applications led to the approach of prioritising data collection, in-vehicle signage and roadworks warning (1st wave) and introducing traffic information and P&R later (see also IDRRIM (2015)). At a later stage, the project also aims to expand the communication technology from ITS-G5 to a hybrid G5/cellular system (DGITM, 2015).
Ownership of data has, according to a stakeholder interview, not been a contentious issue among the stakeholders. However, who will be in charge of administering the data and how it will be done still needs to be finalised with the privacy agency CNIL. The proposed plan is to collect and store the transmitted CAM and DENM message data in the traffic management centres of the road operators. Evaluation data will be analysed by the project partners tasked with the evaluation who will then share the results of analysis with all partners.
9.4.6 Relevance to European context and best practices / lessons learned
Alongside the NL-DE-AT Deployment Corridor, SCOOP@F is a key European C-ITS deployment project and thus plays an important role in getting C-ITS technologies using the ITS-G5 standard on the road. The significant industry involvement from Renault and PSA as well as the wide variety of road environments in which the services are deployed are distinguishing features.
A stakeholder interview has confirmed that finding agreement on the details of the project has been very difficult, especially around the functional and technical architecture of the system. Much work and many working groups were needed. Setting these specifications requires being very precise, e.g. on what must be given in every container of the DENM message. Road operators had different ideas from car manufacturers who were drawing on unpublished C2C-CC documents which had only been agreed

Study on the Deployment of C-ITS in Europe: Final Report | 85
Ricardo in Confidence Ref: Ricardo/ED60721/Issue Number 1
Ricardo Energy & Environment
among the car manufacturers. Vehicle-to-vehicle (V2V) standards in general tend to be more advanced, so in many cases V2V standards had to be modified for vehicle-to-infrastructure applications.
As discussed in Section 9.4.4, a particular issue within the project has been delays due to incomplete standards. According to a stakeholder interview (see also Fouchal (2015)), there is an issue with ETSI having up-to-date draft standards circulating while published standards have become obsolete. A security standard (on public key infrastructure) posed a particular problem for the project team who had the draft standard but were not allowed to use it for procurement tender specifications. The problem was solved when the standard in question was finally published. In parallel, a non-disclosure agreement was negotiated with ETSI which now no longer is needed; yet this is likely to become a helpful approach when similar situations arise in future.

Study on the Deployment of C-ITS in Europe: Final Report | 86
Ricardo in Confidence Ref: Ricardo/ED60721/Issue Number 1
Ricardo Energy & Environment
9.5 CASE STUDY: United Kingdom
9.5.1 Overview
Overall, C-ITS-related activity in the UK has been limited thus far. The European-wide CVIS project which ran from 2006-2010 had UK involvement, and so has the current Compass4D project which is testing V2I applications in Newcastle.8 The most significant UK-based C-ITS project to date, a planned C-ITS deployment corridor between London and Dover, is currently still in the pipeline. The UK has not been successful in securing EU funding under the Connecting Europe Facility 2014 call but plans to re-apply for the upcoming 2015 annual call.
In July 2015, a competition for a €28m (£20m) fund for ‘connected and autonomous vehicles’ was announced, as part of €140m (£100m) funding set aside for research into intelligent mobility over 5 years announced in the 2015 spring budget. A newly-founded joint policy unit between the Department for Transport (DfT) and the Department for Business, Innovation and Skills (BIS), the Centre for Connected and Autonomous Vehicles (C-CAV), will be in charge of accompanying the projects.9 The emphasis of the funded projects, however, is likely to be on autonomous vehicles, with several on-going UK trials and a recently published DfT strategy document on driverless cars (DfT, The Pathway to Driverless Cars: detailed review of regulations for automated vehicle technologies. UK Department for Transport., 2015).
9.5.2 Objectives
According to stakeholder interviews, the UK has a particular interest in the maximisation of road capacity using ITS, including cooperative systems, since this is a key issue for the UK.
According to DfT’s 5 year plan on ITS (as required under the European ITS Directive), priorities for national policies are to minimise regulatory and administrative burden, devolve decisions on development and deployment to regional and local authorities and work with industry to ‘incentivise and remove potential barriers’. Future ITS deployment should be ‘backed by rigorous cost-benefit analysis and sound business cases’. Further emphasis is put on avoiding duplication of effort across the EU, prevent standards from imposing unnecessary burdens and preventing further EU frameworks on ITS beyond the ITS Directive, Action Plan and the EasyWay project (DfT, 2012).
9.5.3 Stakeholders involved
The principal government authority responsible for the strategic development of ITS services in the UK is DfT. Highways England is also involved in technology testing and deployment activities, including the planned London-to-Dover corridor. Transport for London (TfL) is particularly involved in various projects for urban ITS deployment, for example trials for improved traffic flow monitoring in central London combining GPS and mobile phone networks (DfT, 2014).
ITS UK, an association of 160 public and private ITS stakeholders, has recently created the ‘Surface Transport Technology Forum’, designed to enhance dialogue and cooperation between government and industry around ITS and strengthen the UK’s competitive position in the field of ITS (Schofield, 2015). Within ITS UK, there is also an ‘Interest Group’ on connected vehicles (ITS UK, n.d.). Another outfit for ITS development in the UK, set up by government, is the ‘Transport Systems Catapult’ one of seven technology and innovation centres supported through the £200mn Catapult initiative. It is currently part of a consortium called UK Autodrive which is trialling on-road and on-pavement driverless technology in Milton Keynes and Coventry with a budget of £19.2mn. Currently, the Catapult does not appear to be undertaking any specific C-ITS-related activities.
Various UK universities are involved with ITS related research. For example, Newcastle University is leading the UK part of the Compass4D C-ITS deployment project.
9.5.4 Timings
There are no policy strategies that set out a timeline that is specific to C-ITS. Project-specific timings are provided under Section 9.5.5 below.
8 Its project head at Newcastle University, Phil Blythe was nominated Chief Scientific Adviser to DfT in 2015 (Transport Network, 2015) 9 https://www.gov.uk/government/news/uk-to-lead-the-way-in-testing-driverless-cars

Study on the Deployment of C-ITS in Europe: Final Report | 87
Ricardo in Confidence Ref: Ricardo/ED60721/Issue Number 1
Ricardo Energy & Environment
9.5.5 Targeted C-ITS applications
9.5.5.1 Pilot Cooperative ITS Corridor – London to Dover
This planned deployment project for C-ITS technology is set to run along the London to Dover road corridor following the roads A102, A2 and M2.
The following parties would be involved:
DfT, responsible for overall project coordination,
TfL, highway authority within the London boundary
Highways England, responsible highway authority outside London, corridor is part of Strategic Road Network
Further involvement from Kent County Council and vehicle industry partners
The project would have an overall size of €32mn, of which half would be provided by the Connecting Europe Facility (CEF). Most of the other half would be provided by Highways England, with TfL and Kent County Council also providing small amounts. The project would start by setting out the precise services and applications to be targeted. These would include the warning messages, agreed by the Amsterdam Group as ‘Day 1’ services, but ultimately aim to provide an open platform for testing and development of ‘any service capable of delivering benefits to the network and the user’.
Figure 9-8: The Corridor from Blackwall to Dover Port and adjacent towns and roads
It is suggested that, should the programme not be successful in securing EU funding, the UK match funding would still be available to support Wi-Fi Corridors for C-ITS applications in the UK.
9.5.5.2 Cooperative Mobility Pilot on Safety and Sustainability Services for Deployment
9.5.5.3 (Compass4D) in Newcastle (1st January 2013 - 31st December 2015)
The Compass4D project focuses on deployment of certain C-ITS services, such as Red Light Violation Warning (RLVW), Road Hazard Warning (RHW) and Energy Efficient Intersection (EEI), in seven European cities including Newcastle. Compass4D targets the actual deployment of these services and aims to identify methods to overcome barriers and create a viable business model for these C-ITS services. Energy efficient junctions are tested in Newcastle, using 2 electric cars and 12 non-emergency ambulances. In the pilot, priority on lights (as requested by the vehicle), speed advice and idling support are being tested. The aim of this service is to decrease vehicle braking and acceleration and thus reduce

Study on the Deployment of C-ITS in Europe: Final Report | 88
Ricardo in Confidence Ref: Ricardo/ED60721/Issue Number 1
Ricardo Energy & Environment
fuel consumption and vehicle emissions. Data from early analysis of the project show that both travel time and energy consumption are reduced by up to around 15% (Blythe, 2015).
9.5.6 Policy approach
In 2011, DfT released a report summarising UK projects on Intelligent Transport Systems (ITS) as required by the European ITS Directive (DfT, 2011). None of the projects summarised involved C-ITS, and no further programmes or strategies on C-ITS have been released by DfT. Its 5 year action plan published in 2012 addresses cooperative systems in the context of linking vehicles to transport infrastructure, mentioning UK involvement in EasyWay, CEDR and CVIS and announcing that the Highways Agency (HA, now Highways England) will further monitor developments in the field and explore further ‘no-cost opportunities’ (DfT, 2012). It is mentioned that the HA had consulted with industry stakeholders to assess whether there was ‘immediate appetite’ for installing private-sector-funded C-ITS roadside equipment, which there wasn’t. Therefore, no further immediate activities by the HA on C-ITS were undertaken up to 2012. The 2014 progress report contains a section on cooperative systems and autonomous vehicles. The projects in this section included several driverless vehicle trials and some trials for improved traffic flow monitoring in central London combining GPS and mobile phone networks, but no projects relating to deployment of ITS-G5 or similar systems. A DfT strategy on driverless cars published in early 2015 heavily emphasises the favourable regulatory environment for testing of driverless vehicle technology on public roads in the UK, seeking to encourage private initiatives, rather than committing new funds for testing or deployment projects.
Compared to the Netherlands, Germany or France, less C-ITS testing and deployment has been undertaken in the UK to date. However, as projects elsewhere in Europe progress, the UK can build on much of the experience gained in those undertakings. In close cooperation with existing corridors, e.g. via the Amsterdam Group, systems which are widely compatible and likely to remain useful beyond the trial period could be introduced, as proposed in the London-Dover corridor plan. The appointment of Phil Blythe, an expert in C-ITS, as Chief Scientific Adviser to DfT may be illustrative of a renewed political interest in the field. According to stakeholder interviews, no major changes in policy will take place with the new government. The Road Investment Strategy (RIS) of 2014 remains the key policy document. As mentioned, the CEF funding application states that €16.2m have been provisionally set aside as part of the RIS for Wi-Fi installations along major roads and would be used for this purpose even if the project fails to secure CEF funding.
9.5.7 Relevance to European context
UK activity on C-ITS is generally linked to wider European activities. As a member of CEDR, Highways England is involved with the European road policy process and there has been UK involvement in several European C-ITS projects. However, in comparison the Netherlands, Germany or France there appears to have been less overall activity on C-ITS testing and deployment in the UK. It remains to be seen if the recently launched UK initiatives on driverless cars will provide further lessons for successful C-ITS deployment in Europe.

Study on the Deployment of C-ITS in Europe: Final Report | 89
Ricardo in Confidence Ref: Ricardo/ED60721/Issue Number 1
Ricardo Energy & Environment
9.6 CASE STUDY: Czech Republic
9.6.1 Overview
In their Second Progress Report of 2014, regarding the ITS Priority Areas as set out in the ITS Directive 2010/40/EU, the Government of the Czech Republic mentions two projects with regards to C-ITS. Of most relevance is BaSIC project, which was undertaken recently. The aim was a proof of concept where V2I and V2V communication were tested via portable devices on a stretch of motorway around Prague in 2012 and 2013. Secondly, the Project ViaZONE, which focuses on portable variable message signs to be deployed in roadworks areas on motorways with the aim of reducing congestion by influencing driving behaviour based on the traffic situation. Wireless technology is used for communication between the different elements of the system (traffic counters, signs, central IT module) to ensure portability (ViaZONE website, 2014). However, since the system does not contain any in-vehicle devices communicating with the infrastructure, it will not be interpreted as a C-ITS system and is not further focussed on.
INTENS, the Czech company that implemented the technical aspects of BaSIC is also a partner in the EU-funded CODECS platform launched in May 2015, which seeks to promote interoperability in C-ITS systems across Europe and to facilitate a consolidated C-ITS roll-out.
Moreover, the city of Prague participated in the Co-Cities trial of cooperative smartphone applications, which provide a dynamic 'feedback loop' from mobile users and travellers to the cities' traffic management centres (Co-Cities, n.d.). An earlier project, REGIOCROSS, which ran from 2008 to 2011 demonstrated a railway level-crossing red light warning application in order to improve traffic flow and safety. The driver was informed about the approaching train in advance via an in-car device.
Looking ahead, Czech authorities are interested in deployment of C-ITS as a means of improving road safety. Specifically, it is planned to join the NL-DE-AT Deployment Corridor from around 2016. These activities could be co-funded through CEF. Further international cooperation, for example with Poland or Slovakia is also conceivable.
9.6.2 Objectives
The Ministry has recently published an Action Plan for ITS deployment from 2020-2050, which includes plans for C-ITS implementation on the highway network (Ministerstvo dopravy, 2015). As part of the Action Plan, central government spending of around € 650mn in total by 2020 is foreseen for ITS activities, including C-ITS. This would be complemented by € 170mn from regional and local authorities. Overall, it is expected that the benefits from accident reduction outweigh the costs of implementing the ITS Action Plan.
9.6.2.1 BaSIC project
BaSIC was a proof of concept project to demonstrate that C-ITS can be made to work in a Czech environment using 802.11p and 802.11g networks and standardised protocols DENM, CAM and FSAP. According to INTENS, the IT company involved with BaSIC, the aim was to find applications and a design for successful implementation of C-ITS in the Czech Republic, as well as to practically verify the proposed system through the pilot operation on the Prague motorway ring (Intens, n.d.).
9.6.3 Stakeholders Involved
Aside from the Ministry of Transport, a key stakeholder for C-ITS in the Czech Republic is ITS Czech, an association dedicated to ITS in the country. ITS Czech has a dedicated working group on cooperative systems. It includes members from government agencies and industry from Czech Republic. Key activities include monitoring of European activities and C-ITS knowledge exchange. Skoda Auto is also active on C-ITS with their automotive electronics organisation E4T.
The preparation of the Action Plan for ITS included a wide range of stakeholders from public administration, infrastructure managers, transport companies, suppliers, universities and professional and civic associations. This allowed interested parties to propose recommendations for all modes (Ministerstvo dopravy, 2015).
9.6.3.1 BaSIC project
BaSIC was led by the Czech Ministry of Transport (ERTICO - ITS Europe, 2015). A tendering process was held, and a consortium of the transport telematics company INTENS and Czech Technical

Study on the Deployment of C-ITS in Europe: Final Report | 90
Ricardo in Confidence Ref: Ricardo/ED60721/Issue Number 1
Ricardo Energy & Environment
University (CTU) were awarded the project. The project cost has been CZK 2.2mn (EUR 80,000), funded by the Technology Agency of the Czech Republic (E15, 2013). INTENS was the project leader and responsible for the technology and application set up. The Czech Technical University (CTU) team was responsible for conducting a survey of drivers and users and independent evaluations.
9.6.4 Timings and progress
9.6.4.1 BaSIC project
The BaSIC project took place over two years and ended in December of 2013.
9.6.5 Targeted C-ITS applications
9.6.5.1 BaSIC project
Various applications were targeted. Two roadside units and three portable on-board units were used. The on-board units were capable of displaying a variety of message types, for example messages from variable message signs at the roadside (e.g. speed limit reduction, road works/slow maintenance vehicle ahead). An application informing the driver about approaching emergency vehicles was also tested. The pilot testing phase lasted a week and was completed successfully.
The selection of applications was based on consumer survey. An extensive questionnaire was created and surveys were conducted at petrol stations over 2-3 days; around 200 people participated. The results were used to arrive at applications. It was found that people were interested in safety and mobility applications.
9.6.6 Relevance to European context and best practices / lessons learned
With a very modest budget of €80,000, the BaSIC project appears to have boosted interest in C-ITS amongst the country’s industry (according to stakeholder interviews) as well as opening the door to cooperation with other EU partners. It may also facilitate the access to CEF funding for future deployment initiatives.

Study on the Deployment of C-ITS in Europe: Final Report | 91
Ricardo in Confidence Ref: Ricardo/ED60721/Issue Number 1
Ricardo Energy & Environment
9.7 CASE STUDY: United States
9.7.1 Overview
C-ITS research, development, demonstration, and deployment activities within the U.S. are being supported primarily by the Department of Transportation (DOT) and industry stakeholders, including vehicle OEMs and system developers. Safety benefits are the key drivers for implementing vehicle-to-vehicle (V2V) and vehicle-to-infrastructure (V2I) technologies. Other goals for implementing these systems include reduced congestion, improved efficiency, improved mobility, reduced environmental impacts, and improved freight movement (use of real time data). The DOT ITS Strategic Plan was designed to achieve a national, multi-modal surface transportation system that featured a connected transportation environment among vehicles, the infrastructure and passengers’ portable devices to maximize safety, mobility and environmental performance. In addition to V2V and V2I system development, the U.S. C-ITS research includes real-time data capture and management, dynamic mobility applications, road weather management, emissions reduction, human factors, traffic management, interoperability, and cost reduction.
U.S. DOT expects to issue a Notice of Proposed Rulemaking (NPRM) prior to the end of 2015 for a new safety standard relating to V2V technology, with a target date of 2020 as the first year of vehicle sales covered by the new standard. In addition, DOT will provide funding for Pilot Deployment Programs beginning at the end of 2020 and extending through 2020. Safety-related applications to be addressed by the new standard and the associated research programs relate to the use of Dedicated Short Range Communication (DSRC) and include: Intersection Movement Assist (IMA), Forward Collision Warning (FCW), Do Not Pass Warning (DNPW), Emergency Electronic Brake Lights (EEBL), Blind Spot Warning / Lane Change Warning (BSW/LCW), and Left Turn Assist (LTA). DOT projects that all vehicles will be equipped with C-ITS within the next 30 to 40 years. It is expected that the eventual move to fully automated vehicles will result the most significant improvements in safety and efficiency.
The National Highway Traffic Safety Administration (NHTSA) has given notice that it intends to create a new Federal Motor Vehicle Safety Standard (FMVSS) to require V2V communication capability for new light duty vehicles, based on the premise that no single manufacturer would have the incentive to build V2V-capable vehicles unilaterally. The new standard is expected to include V2V communications protocol, which would draw heavily on the standards that are already under development by industry and the standards development organizations. Compared to the EU standards for C-ITS, the US has adopted a smaller number of C-ITS standards, describing technology that is generally simpler and focused on safety-critical applications. Although other communications technologies, such as cellular and satellite have been suggested, DSRC will be specified by the safety standard because it is robust, cost effective, has a high band width with low latency, and is secure.
Key US DOT and Federal Highway Administration (FHWA) programs that support C-ITS research, development and deployment include FHSTA crash avoidance research ($8mn per year), FHWA Intelligent Transportation System Program ($100mn per year), University Transportation Systems ($72mn per year), and Highway R&D ($115mn per year). In addition, Federal Highway Program Apportionments to the states can be used for C-ITS deployments ($2.2 billion for Highway Safety Improvement and $2.3 billion for Congestion Mitigation and Air Quality Improvement).
Industry stakeholders are optimistic regarding opportunities for products and services related to I-CTS, including retrofits of existing vehicles, particularly if implementation of these systems is mandated. Consumer education is seen as a key driver for acceptance of these systems. Estimates of system costs range from $30 to $350/vehicle for V2V capability and $25,000 to $35,000 for each roadside infrastructure installation.
9.7.2 Objectives
“Realising connected vehicle implementation” is one of two primary strategic priorities identified by the United States Department of Transport (DoT) in its 2015-2019 ITS strategic plan (U.S. DoT, 2014a).10 This priority builds on the substantial progress made in recent years around design, testing, and planning for deployment of connected vehicles in the USA.
10 (The other primary strategic priority is “advancing automation”.)

Study on the Deployment of C-ITS in Europe: Final Report | 92
Ricardo in Confidence Ref: Ricardo/ED60721/Issue Number 1
Ricardo Energy & Environment
The strategic themes, like the priorities, are meant to focus on the intended outcomes. The strategic themes are: to enable safer vehicles and roads, enhance mobility, limit environmental impacts, promote innovation, and support transport system information sharing. These categories reflect stakeholder input about the areas where attention should be devoted. Individual programmes perform the work within the direction and the structure of the priorities and themes established by the ITS strategic plan.
Realisation of C-ITS is intended to contribute to each of those objectives (see the list of potential benefits in Table 9-9), although there is presently a clear emphasis on early action on safety. The DoT’s C-ITS activities are currently more focussed on adoption and deployment rather than research and testing, although the Department plans to continue investigating new technology and new functionality as it emerges, especially in response to issues arising from deployment projects (U.S. DoT, 2014a).
DoT’s programmes of support for research, development, and adoption of C-ITS can be divided into two categories; support for V2V communications based on dedicated short-range communications (DSRC) technology, and other C-ITS technologies and communications that may be enabled either by DSRC or by other networks such as cellular.
In August 2014 the DoT’s National Highway and Safety Administration (NHTSA) announced its intention to eventually introduce rules making DSRC V2V communications technology mandatory; these rules are expected to be proposed in 2015, and will be based in part on responses received to the Department’s Advance Notice of Proposed Rulemaking (ANPRM) and the accompanying research report (U.S. DoT, 2015a). Currently there are no similar rulemaking plans for other C-ITS technology, although DoT continues to support and consider the implications of this technology (U.S. DoT, 2014a).
9.7.2.1 Rationale for the government’s focus on safety and V2V
Safety benefits are key drivers for implementing V2V technologies. Other benefits that support regulation of V2V and V2I systems include: reduced congestion, improved efficiency (reduced fuel usage), improved freight movement, and reduced environmental impacts (e.g. emissions). DOT’s efforts related to these technologies are being led by NHTSA and the Intelligent Transportation Systems (ITS) Joint Program Office within DOT’s Research and Innovative Technology Administration (RITA). The Notice of Proposed Rulemaking (NPRM) was slated for release during 2016. However, U.S. Secretary of Transportation, Anthony Foxx has requested that the NPRM be released prior to 31 December 2015. Focus will be crash avoidance technologies. DOT will also work with the Federal Communications Commission (FCC) to determine whether the 5.9 GHz spectrum reserved for V2V communications can be “shared” with unlicensed users. The Department is committing to complete a preliminary test plan within 12 months after industry makes production-ready devices available for testing.
The proposed regulation will address two key components of the crash avoidance systems: 1) V2V regulation (NHTSA) and 2) infrastructure V2I and I2V (NHSTA and Federal Highway Administration-FHWA). Radio specifications and safety methods (e.g. intersection movement assist, left turn assist) have already been defined. At this time, no legislation beyond that described in the ANPRM is required or anticipated.
US DOT will continue to provide funds for research, development, and demonstration/pilot programs. Deployment is expected to be supported by FHWA funds delivered to each state (highway excise taxes enter the Federal Highway Trust Fund and are distributed to the states using legislatively established formulas, roughly based on vehicle miles travelled in each state). In most cases, the state department of transportation administers the funds. States have the freedom to apply the funds as required, based on guidance provided by FHWA and FHTSA (“guidance on how to spend the funds wisely”). Connected vehicle technologies and V2I are eligible for support using the FHWA funds. FHTSA often provide recommendations for use of the FHWA funds, such as solutions for intersections having high incidents of collisions. Implementing V2V in the area can reduce the number of collisions and NHSTA would provide assistance for implementing such as system.
9.7.2.2 Stakeholders involved
The ITS Strategic Plan was developed with significant stakeholder input, both within the DoT and externally, including industry groups, state and local government, academics, and automobile manufacturers. The stakeholders provided “technical, organisational, contextual, and policy needs specific to their environments”. All stakeholders indicated that they were happy with the current level of emphasis on C-ITS research, and a majority of indicated that they would be receptive to the Department’s plans to accelerate deployment of this technology, although a significant majority also

Study on the Deployment of C-ITS in Europe: Final Report | 93
Ricardo in Confidence Ref: Ricardo/ED60721/Issue Number 1
Ricardo Energy & Environment
expected that new capabilities not currently associated with “connected vehicles” will also ultimately impact the C-ITS environment (U.S. DoT, 2014a).
Deployment of C-ITS in the United States potentially involves a varied set of stakeholders, including:
The federal government – this principally means the U.S. Department of Transport, whose ITS Joint Program Office coordinates most ITS work on behalf of the various agencies for specific modes of transport. However, decisions of the Federal Communications Commission (the radio frequency spectrum regulator) also have the potential to affect C-ITS outcomes.
State and local government, transit authorities, and toll road authorities.
Standards development organisations – in the US, standards are being developed by SAE International, IEEE (the Institute of Electrical and Electronics Engineers), and the Joint Committee on the NTCIP (National Transportation Communications for ITS Protocol).
Academics and academic institutions – for example, the University of Michigan Transportation Research Institute took the lead role in running the country’s largest pilot of V2V technology
Manufacturers of vehicles and ITS stations or components (for example DSRC antennas)
Private companies interested in providing a security and communications system to support V2V
Representative associations, for example the Institute of Transport Engineers, the National Electrical Manufacturers Association, and ITS America
Non-US institutions shaping the development of ITS standards outside the US, including the European Commission, ISO (International Organisation for Standardisation) and CEN (European Committee for Standardisation)
From time to time the Department of Transport has sought to involve various sub-sets of these stakeholders in its decision making processes or encourage them to form their own partnerships.
The Department consulted vehicle manufacturers, state and local governments, representative associations, citizens, and others to identify policy and institutional issues that might hinder successful deployment of new and emerging C-ITS technologies (U.S. DoT, 2015d).
The Department supports the development and maintenance of standards promoted by SAE and IEEE (U.S. DoT, 2015e).
The Department’s Safety Pilot Model Deployment project was run by the University of Michigan, working in partnership with a consortium of nine OEMs (Original Equipment Manufacturers) called CAMP (Crash Avoidance Metrics Partnership, whose members include vehicle manufacturers such as GM and Ford); volunteer drivers; a transit agency; and commercial vehicle operators.
For the next wave of C-ITS pilot projects, the Department wants to encourage partnerships between State governments, transit agencies, commercial vehicle operators and other private companies (U.S. DoT, 2015b).
In order to create a secure DSRC V2V communication system for safety-critical applications, the Department believes it will be necessary to find an entity – possibly a private company – that would be willing to manage a security and communications sub-system (U.S. DoT, 2014b).
9.7.3 Timings
9.7.3.1 Development of DoT’s strategic plans
The 2005-2009 ITS research program included 9 research initiatives focussed on departmental goals for safety, reduced congestion and global connectivity. The research program culminated in the development of new, prototype, short-range wireless technologies and applications for safety that were successfully demonstrated in a highly mobile environment.
9.7.3.2 Introduction of technologies.
Based on these results, a connected transportation environment was envisioned through vehicle-to-vehicle (V2V) and vehicle-to-infrastructure (V2I) communications and applications which became the core of the ITS Strategic Research Plan, 2010-2014. With rapid evolution of commercial wireless

Study on the Deployment of C-ITS in Europe: Final Report | 94
Ricardo in Confidence Ref: Ricardo/ED60721/Issue Number 1
Ricardo Energy & Environment
technology, the department’s vision evolved to incorporate an inclusive concept of connected vehicles and infrastructure using both DSRC and other mobile data communications technologies. The plan was designed to achieve a vision of a national, multi-modal surface transportation system that featured a connected transportation environment among vehicles, the infrastructure and passengers’ portable devices to maximize safety, mobility and environmental performance. The research agenda focussed on a set of critical research needs, including:
The technological gaps and challenges associated with moving from research prototypes to deployment ready vehicle and infrastructure technologies;
Research was expanded to include a variety of topics, including environmental impacts, efficiency improvements, systems costs, weather effects, safety issues, mobility, and definition of other benefits and applications, as well as the safety pilot program.
The institutional and policy challenges associated with cooperative public-private implementation, particularly the establishment of security features to enable trustworthy yet anonymous transmission of safety-critical messages; and
The institutional complexities associated with scaling a research prototype to a nationwide system and issuing guidance to industry stakeholders.
Not all of the research defined in the 2010-2014 plans was completed, with a key gap being the definition of benefits to each state, so these were expanded and added to the 2015-2019 plan. The following multi-year research activities were outlined:
Vehicle-to-Vehicle (V2V) Communications for Safety: This research will investigate key questions such as are vehicle based safety applications using V2V communications effective and do they have benefits. Research is designed to determine whether regulatory action by the National Highway Transportation Safety Administration is warranted to speed the adoption of these safety capabilities.
Vehicle-to-Infrastructure (V2I) Communications for Safety: This research will investigate similar questions about V2I communications, with an initial focus on applications based on the relay of traffic signal phase and timing information to vehicles. The purpose is to accelerate the next generation of safety applications through widespread adoption of V2I communications.
Real-Time Data Capture and Management: This research will assess what traffic, transit and freight data are available today from various sources, and consider how to integrate data from vehicles acting as "probes" in the system. The goal is to accelerate the adoption of transportation management systems that can be operated in the safest, most efficient and most environmentally friendly way possible.
Dynamic Mobility Applications: This research will examine what technologies can help people and goods effortlessly transfer from one mode of travel (car, bus, truck, train, etc.) or route to another for the fastest and most environmentally friendly trip. The research seeks to make cross-modal travel truly possible for people and goods, and enable agencies and companies to manage their systems in light of the fact that people and goods will be changing modes often.
Road Weather Management: This research will consider how vehicle-based data on current weather conditions can be used by travellers and transportation agencies to enable decision-making that takes current weather conditions and future weather forecasts into account.
Applications for the Environment: Real-Time Information Synthesis (AERIS): This research will explore how anonymous data from tailpipe emissions can be combined with other environmental data. The goal is to enable transportation managers to manage the transportation network while accounting for environmental impact.
Human Factors: Additional technology in vehicles may have the potential to overload drivers and increase safety risks. This research will examine the extra burden that in-vehicle devices may put on drivers, with the goal of minimizing or eliminating distraction risks.
Mode-Specific Research: This research program includes active traffic management, international border crossing, roadside infrastructure, commercial vehicles, electronic payment and maritime applications.

Study on the Deployment of C-ITS in Europe: Final Report | 95
Ricardo in Confidence Ref: Ricardo/ED60721/Issue Number 1
Ricardo Energy & Environment
Exploratory Research: This research program includes safety research for rail, technology scanning, and a solicitation for new research ideas.
Cross-Cutting Activities: This program includes architecture, standards, professional capacity building, technology transfer, and evaluation as well as interoperability of connected vehicles with energy, water, communications, and urban dynamics systems.
Sources: (U.S. DoT, 2007a), (U.S. DoT, 2012a)
9.7.3.3 Timing of Safety Pilot Model Deployment
The Safety Pilot Model Deployment took place from August 2012 to August 2013, to allow for the data collected to help inform the NHTSA’s Advance Notice of Proposed Rulemaking the following year.
9.7.3.4 Timing of Federal Motor Vehicle Safety Standard for V2V communication
According to the NHTSA’s Advanced Notice of Proposed Rulemaking, imposition of a safety standard (rather than voluntary measures, for example) is the most likely route forward for the agency on V2V communication. Table 9-6 provides details of some of the assumed milestones associated with taking this route.
Table 9-6 Timing of Federal Motor Vehicle Safety Standard for V2V communication
Schedule item Date Notes
Advance Notice of Proposed Rulemaking (ANPRM)
August 20, 2014 The ANPRM was published on this date.
Deadline for comments on ANPRM
October 20, 2014
Notice of Proposed Rulemaking
2015 Previously 2016, this target date was brought forward
First year of sales covered by new standard
2020?
The NHTSA does not appear to have made an official decision or assumption so far as to the first year in which its new standard would apply, but the modelling work in its research paper used 2020 as the assumed start date.
Sources: (U.S. DoT, 2014c), (U.S. DoT, 2015a), (U.S. DoT, 2014b)
9.7.3.5 Timings of C-ITS Pilots Deployment Program
The DoT’s timetable for the C-ITS Pilots Deployment Program is set out in Table 9-7. The DoT issued a solicitation in January 2015 to invite bids for the concept development phase of the first wave of pilots. The deadline for these bids was in March 2015 (U.S. DoT, 2015f).
Table 9-7 Timing of U.S. DoT’s C-ITS Pilots Deployment Program
Schedule item Date
Request for Information (RFI) Issued March 12, 2014
CV Pilots Project Stakeholder Workshop April 30, 2014
Regional Pre-Deployment Workshop/Webinar Series
Summer-Autumn 2014
Solicitation for Wave 1 Pilot Deployment Concepts Early 2015
Wave 1 Pilot Deployments Award(s) September 2015
Solicitation for Wave 2 Pilot Deployment Concepts Early 2017
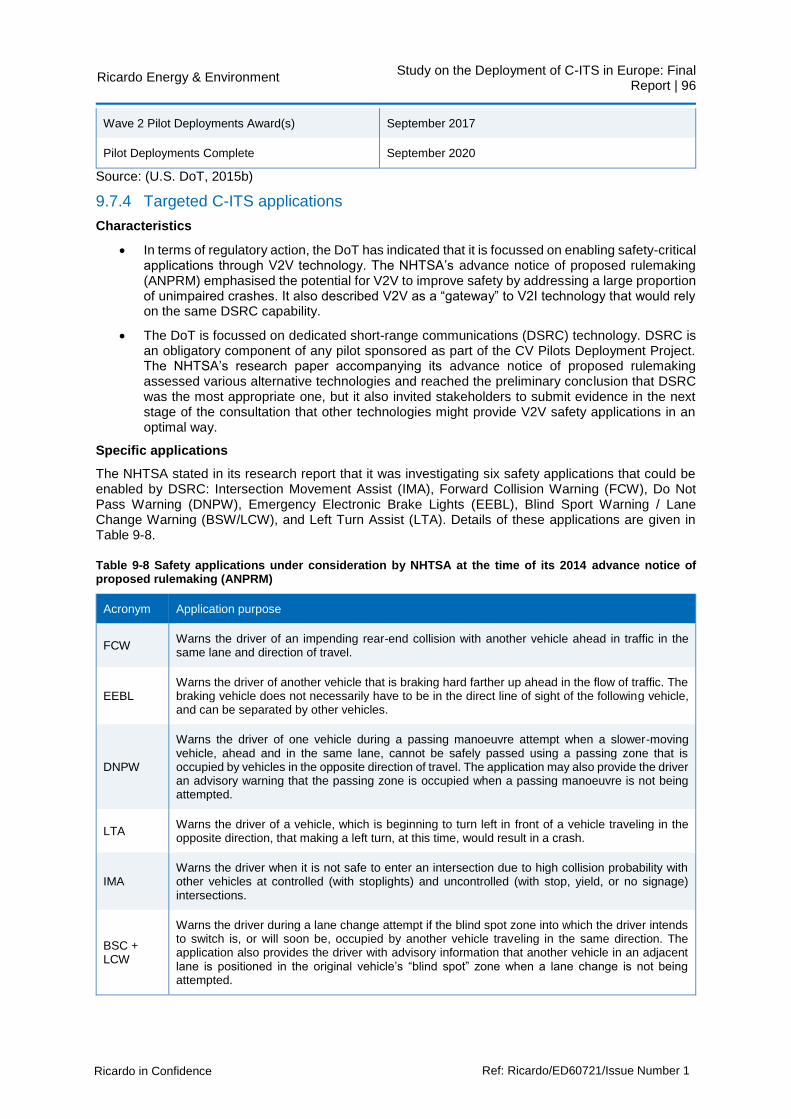
Study on the Deployment of C-ITS in Europe: Final Report | 96
Ricardo in Confidence Ref: Ricardo/ED60721/Issue Number 1
Ricardo Energy & Environment
Wave 2 Pilot Deployments Award(s) September 2017
Pilot Deployments Complete September 2020
Source: (U.S. DoT, 2015b)
9.7.4 Targeted C-ITS applications
Characteristics
In terms of regulatory action, the DoT has indicated that it is focussed on enabling safety-critical applications through V2V technology. The NHTSA’s advance notice of proposed rulemaking (ANPRM) emphasised the potential for V2V to improve safety by addressing a large proportion of unimpaired crashes. It also described V2V as a “gateway” to V2I technology that would rely on the same DSRC capability.
The DoT is focussed on dedicated short-range communications (DSRC) technology. DSRC is an obligatory component of any pilot sponsored as part of the CV Pilots Deployment Project. The NHTSA’s research paper accompanying its advance notice of proposed rulemaking assessed various alternative technologies and reached the preliminary conclusion that DSRC was the most appropriate one, but it also invited stakeholders to submit evidence in the next stage of the consultation that other technologies might provide V2V safety applications in an optimal way.
Specific applications
The NHTSA stated in its research report that it was investigating six safety applications that could be enabled by DSRC: Intersection Movement Assist (IMA), Forward Collision Warning (FCW), Do Not Pass Warning (DNPW), Emergency Electronic Brake Lights (EEBL), Blind Sport Warning / Lane Change Warning (BSW/LCW), and Left Turn Assist (LTA). Details of these applications are given in Table 9-8.
Table 9-8 Safety applications under consideration by NHTSA at the time of its 2014 advance notice of proposed rulemaking (ANPRM)
Acronym Application purpose
FCW Warns the driver of an impending rear-end collision with another vehicle ahead in traffic in the same lane and direction of travel.
EEBL Warns the driver of another vehicle that is braking hard farther up ahead in the flow of traffic. The braking vehicle does not necessarily have to be in the direct line of sight of the following vehicle, and can be separated by other vehicles.
DNPW
Warns the driver of one vehicle during a passing manoeuvre attempt when a slower-moving vehicle, ahead and in the same lane, cannot be safely passed using a passing zone that is occupied by vehicles in the opposite direction of travel. The application may also provide the driver an advisory warning that the passing zone is occupied when a passing manoeuvre is not being attempted.
LTA Warns the driver of a vehicle, which is beginning to turn left in front of a vehicle traveling in the opposite direction, that making a left turn, at this time, would result in a crash.
IMA Warns the driver when it is not safe to enter an intersection due to high collision probability with other vehicles at controlled (with stoplights) and uncontrolled (with stop, yield, or no signage) intersections.
BSC + LCW
Warns the driver during a lane change attempt if the blind spot zone into which the driver intends to switch is, or will soon be, occupied by another vehicle traveling in the same direction. The application also provides the driver with advisory information that another vehicle in an adjacent lane is positioned in the original vehicle’s “blind spot” zone when a lane change is not being attempted.

Study on the Deployment of C-ITS in Europe: Final Report | 97
Ricardo in Confidence Ref: Ricardo/ED60721/Issue Number 1
Ricardo Energy & Environment
The ITS Joint Program Office has described concepts of operations for a large set of applications (i.e. a set that includes many applications not primarily related to safety) which it may consider funding as part of the Connected Vehicles Pilots Deployment Project. These are listed in Figure 9-9. The pilot may also fund deployment of other applications, not listed in Figure 9-9, if these are put forward by winning bidders.
Figure 9-9 Applications with potential for inclusion in the CV Pilots Deployment Project
Source: (U.S. DoT, 2015b)
9.7.5 Policy approach
The DoT’s present approach to C-ITS policymaking has been informed by its historical experience with ITS research as well as consultation with stakeholders.
9.7.5.1 Mandating V2V communication
C-ITS research and implementation planning in the US Department of Transport began in the 1990s, and involved exploration of several alternative technologies.
One very significant, recent test of safety-critical V2V communication systems was The Safety Pilot Model Deployment, which launched in August 2012, and was originally budgeted at €25m (80% of which was provided by the DoT) (U.S. DoT, 2014d). This was a first-of-its kind pilot project to assess the potential safety benefits of the technology in real-world settings, and involved nearly 3,000 V2V-equipped vehicles being used for the everyday travel of individuals. Applications warned of vehicles ahead, vehicles in blind spots, and impending red light violations, and communicated using the standards that were under development by US Standards Developing Organisations. Interoperability of different devices (e.g. retrofitted ITS stations and purpose-built V2V enabled vehicles) was achieved, and the pilot was regarded as a successful demonstration of the potential safety benefits of the technology (U.S. DoT, 2015a).

Study on the Deployment of C-ITS in Europe: Final Report | 98
Ricardo in Confidence Ref: Ricardo/ED60721/Issue Number 1
Ricardo Energy & Environment
The NHTSA has now given notice that it intends to create a new Federal Motor Vehicle Safety Standard to require V2V communication capability for new light duty vehicles. This decision was the culmination of several years of work, and involved taking the following considerations into account: estimates of the ability of V2V technology to reduce crashes and fatalities; technology maturity, cost, reliability, and performance; and the availability of means for measuring the performance of V2V technology in an objective way. NHTSA states that it believes no single manufacturer would have the incentive to build V2V-capable vehicles unilaterally, and used this argument to justify its decision to impose obligatory standards. It is considering including in its proposed rule technical standards for how V2V communications should be performed, which would draw heavily on the standards that are already under development by industry and the Standards Developing Organisations with support from DoT programmes (U.S. DoT, 2014c).
Compared to the EU standards for C-ITS, the US has adopted a smaller number of C-ITS standards, describing technology that is generally simpler and focussed on safety-critical applications (Austroads, 2015). The relevant standards developing organisations in the US are SAE International, the IEEE (Institute of Electrical and Electronics Engineers), and the Joint Committee on the NTCIP (National Transportation Communications for ITS Protocol). A 2015 review by Austroads identified that these organisations had developed a set of 11 standards associated with deployment of safety-critical DSRC C-ITS applications (compared with the EU’s 157 C-ITS standards). US Department of Transport policy is to continue to support the development of C-ITS standards and update these in light of field testing and technological developments, but also to harmonise US standards with standards used by the EU and other regions where appropriate. A Harmonisation Action Plan was agreed with the EU in 2011. An illustration of the sets of standards in use in the US versus the EU is shown in Figure 9-10.
Figure 9-10: Sets of C-ITS standards in US versus EU
Source: (Austroads, 2015)
9.7.5.2 Grants for infrastructure (and infrastructure strategy in general)
Initial demonstrations and pilots are and will continue to be funded by DOT; full scale implementation of V2V and V2I systems is to be jointly supported using FHWA funds distributed to the states. NHTSA’s FY 2015 Budget is $851mn and includes $152mn for Vehicle Safety, $122mn for Behavioral Safety and $577mn for State Grants and High Visibility Enforcement Support. C-ITS and V2V research is

Study on the Deployment of C-ITS in Europe: Final Report | 99
Ricardo in Confidence Ref: Ricardo/ED60721/Issue Number 1
Ricardo Energy & Environment
categorized under Forward Collision Avoidance and Mitigation (FCAM). Research funds for FCAM originate within the Vehicle Safety Program administered by NHTSA ($38mn to vehicle safety research and analysis, of which $8mn will go to crash avoidance research) and Highway Traffic Safety Grants administered by the states (Reference: NHTSA Budget Fiscal Year 2015). It is projected that crash avoidance research will be funded at this level through 2017. In addition, states have the option to apply FHWA funds to V2V and V2I deployment. The FHWA Budget (Moving Ahead for Progress in the 21st Century – MAP 21) includes $100mn /year through 2017 for Intelligent Transportation Systems Programs, an additional $72mn per year for university transportation centres, and $115mn for highway research and development programs. States may also solicit funds for Transportation Infrastructure Finance and Innovation Programs ($1 billion/year). Federal Highway Program Apportionments to the states for 2015 include $2.2 billion for the Highway Safety Improvement Program and $2.3 billion for the Congestion Mitigation & Air Quality Improvement Program, both of which can be used to support C-ITS deployments.
9.7.5.3 Industry strategy
Industry equipment and service providers anticipate a wider market within ITS, including integration with automotive and infotainment telematics, freight and commercial applications, ITS communications (both DSRC and cell/satellite based systems), network management, public transportation, road safety, and security/crime reduction. Moving from vehicle based systems to wider areas of communications (e.g. portable systems) presents challenges and opportunities. One telecommunications company representative indicated over the air (OTA) services, such as those employed by Tesla for system updates, will drive connectivity. Using OTA for updates and to address electronic system recalls has the potential to reduce OEM costs by $100/vehicle/recall.
One industry spokesman suggested state and local agencies as well as NGOs should become involved in preparing the public for introduction of C-ITS technologies. It was stated “This is a consumer product, not a vehicle product”. Many stakeholders are participating in the University of Michigan’s Mobility Transformation Center (MTC) located in Ann Arbor, Michigan (see http://www.mtc.umich.edu/vision). Participants include government (US DOT, Michigan DOT, the City of Ann Arbor), Industry (auto manufacturers, telecommunications suppliers, traffic control systems suppliers, insurance companies, public transportation system stakeholders, payment system suppliers, and smart parking companies), and university researchers (Texas A&M, University of Michigan). MDOT is supporting development of the Southeast Michigan connected corridor, which includes 125 miles of expressways (US23, I696, I94, and I75). Roadside infrastructure is being installed that will support over 20,000 connected vehicles plus 2,000 connected and automated vehicles.
Application radio developers are working on a wide range of products. It is expected that these will initially be extensions of existing traffic alert products, such as WAZE. Like WAZE, they will provide live traffic updates. However, WAZE is based on provided by logged-in members and is related to Google Maps to determine the number of vehicles per section of road and how rapidly their locations are changing. Tying this into retrofitted DSRC equipment would improve the accuracy of the system and would provide a platform for safety-related applications. Other possibilities include parking space locators and notice of pedestrian in cross walk. These are all consumer-facing applications which reinforce the need to support consumer acceptance and adoption.
One OEM executive saw V2V as more than just safety, but also a future means to reduce the number of sensors required for ADAS systems and opportunity for overall vehicle cost reduction in the future. Industry representatives interviewed by Ricardo were optimistic that V2V and V2I will become prevalent on vehicles prior to 2020.
9.7.5.4 Other research and deployment activity
The DoT’s five year ITS strategy emphasises adoption and deployment of C-ITS more than research into new capabilities, although research will also be supported (U.S. DoT, 2014a). The DoT is investing in expanding the number of test beds available to the private sector, and is in the process of launching a set of real-world pilots of C-ITS applications. The DoT also funds human factors research, and research into certification of C-ITS system components (U.S. DoT, 2015c), as well as professional capacity building including free ITS training.
9.7.5.5 CV Pilots Deployment Project
The DoT plans on sponsoring a number of pilot projects to deploy C-ITS in real-world settings and measure the benefits of prototype applications. These pilots are intended to build upon previous

Study on the Deployment of C-ITS in Europe: Final Report | 100
Ricardo in Confidence Ref: Ricardo/ED60721/Issue Number 1
Ricardo Energy & Environment
research conducted by the DoT, and may span a large number of applications for which the DoT has developed concepts of operations (see Figure 9-9 for the list). The actual set of applications and pilot programmes will depend on which pilot projects are awarded funding in a competitive tender process run by the Federal Highway Administration.
The pilots are intended:
To encourage partnerships between States, transit agencies, commercial vehicle operators and other private companies
To deploy applications using data from vehicles, infrastructure, and mobile devices
To support improved system performance (U.S. DoT, 2015b).
9.7.5.6 Retrofits of existing fleet
DOT sees opportunity to accelerate applications and benefits through retrofit programs. Aftermarket applications were included in the Safety Pilot program.
Industry representatives have indicated the turnover of existing vehicles will limit adoption of C-ITS. Their suggested solution is to develop cost effective retrofit systems. Making the systems consumer based (enhanced features) would accelerate deployment. One drawback of retrofit systems is that they might not be fully integrated with the vehicle electronics (limited access to sensor data such as brake status) and the DSRC network, which could compromise the robustness of the data sent to other vehicles with resulting impact on preciseness of the warning messages. Thus, technical standards are required for these devices to ensure interoperability and effectiveness.
9.7.6 Deployment and key results
9.7.6.1 Expected impacts of C-ITS in general
The DoT’s Strategic Plan identifies a number of potential benefits arising from its C-ITS programme, listed in table Table 9-9.
Table 9-9 Potential benefits of DoT’s C-ITS programme
Increases in safety, mobility, system efficiency, and access to resources for disadvantaged groups, and decreases in negative environmental impacts such as vehicle emissions, the need for physical expansion, and noise
Decreases in undesirable transportation impacts to the environment and society
Increased opportunities to partner with non-government groups, such as private industry and universities
Real-time and real-world data to help with transportation planning and transportation system operations
Demonstrations of CV environments that fit into real-world environments of today
Reduction of fatalities through weather-related, safety, infrastructure-based, and other applications
Source: (U.S. DoT, 2014a)
The DoT states that V2V and V2I technology is expected to reduce unimpaired vehicle crashes by 80 percent (U.S. DoT, 2015a). Some specific applications of C-ITS have been given a preliminary cost-benefit assessment by the NHTSA. Some other potential benefits of C-ITS are yet to be quantified; one of the strategic goals of the DoT is to “develop comprehensive cost-benefit analytic tools that allow deployers to understand the financial and operational benefits of new technologies and systems” (U.S. DoT, 2014a).
To support costing of C-ITS pilots, DoT sponsored a project called CO-PILOT whose outputs include a tool for estimating at a high-level the likely costs of a C-ITS pilot project.
Industry studies have identified consumer acceptance as a key driver for adoption of C-ITS. One of the most frequently expressed consumer complaints is loss of ability to “go my own speed and change lanes when I want to”. Again, consumer education regarding reduced congestion (shorter trip times),

Study on the Deployment of C-ITS in Europe: Final Report | 101
Ricardo in Confidence Ref: Ricardo/ED60721/Issue Number 1
Ricardo Energy & Environment
reduced fuel use, and improved safety while offering ancillary benefits (integration with infotainment systems) is necessary to accelerate adoption. There has also been some concern among technology developers that the GPS systems used to determine relative vehicle positions may not be accurate enough; more research is needed in this area and DOT is currently sponsoring several investigations.
9.7.6.2 Expected impacts of NHTSA mandating DSRC V2V communication
Expected Costs
The NHTSA estimates that V2V equipment and supporting communications functions – including security management – would cost approximately $341 to $350 (€300 to €310) per vehicle in 2020, falling to $209 to $227 (€190 to €200) by 2058 if the industry finds efficiencies in the manufacturing of this technology. It is projected that the costs of roadside equipment will be in the range of $25,000 to $35,000 per installation. One OEM representative estimated a price increase of $30-$40 to include V2V to their vehicles. But this will be dependent on specific OEM electronic architectures.
Expected Benefits
The NHTSA has estimated the benefits of just two specific applications, IMA and LTA, in a scenario in which V2V technology has spread through the entire fleet. The NHTSA estimates that these applications would prevent 25,000 to 592,000 crashes per year, save 49 to 1,083 lives, prevent 11,000 to 270,000 non-fatal injuries, and prevent 31,000 to 728,000 property-damage-only crashes.
Additional DSRC V2V applications would bring additional benefits, with minimal additional costs, as the only additional costs would be attributable to new software.
9.7.6.3 Barriers to mass deployment of V2V systems
According to DOT, the key barrier to deployment of C-ITS is availability of funding. State participation in the deployment programs will be hampered if a long term funding bill is not passed soon by Congress.
DOT is also addressing privacy and security concerns related to C-ITS (e.g. transmission, collection, storage, and sharing of V2V data). Effective approaches related to privacy issues have been developed and must now be tested and verified. Individual protections offered by the EU and the U.S. tend to differ; the extent to which their approaches will converge is an open question [Singer, N., The New York Times, February 3, 2013]. DOT researchers are currently addressing security credential management systems. This includes misbehaviour detection and revocation lists (required if a trusted partner leaves system). Key security issues have been identified. On the topic of security credentials, DOT is working with auto industry through the Crash Avoidance Metrics Partnership (CAMP) Vehicle Safety Communications (VSC 3) Consortium) to demonstrate and test initial designs. This includes several approaches to implementing security certificates for both infrastructure and vehicle applications.
Issues related to negative public perceptions of C-ITS can be addressed by educational campaigns. One industry spokesman noted the key stakeholders of C-ITS are the end users. Thus, educating consumers regarding these systems is important and must include assurance regarding robustness and ease of use, safety benefits, and privacy). “The biggest gap is public perception and education”. A DOT spokesman suggests starting with safety-critical, limited scope systems, such as snow removal equipment and police vehicles to demonstrate value of these systems to both state DOTs and consumers.
Opposition to DSRC has been expressed by various other users of the electromagnetic spectrum. Cellular-based systems have emerged as a potential communications alternative. Another potential barrier is the size of the required V2V communications system is its unprecedented size. Establishing an effective development plan will pose challenges similar to those encountered with deployment of current cellular networks. Equipment suppliers indicate DSRC will be adequate for initial applications and can be readily integrated with other communication systems. A study conducted by the US DOT Volpe National Transportation Systems Center concluded the life cycle cost per vehicle for DSRC is up
to 3½ less than leased cellular and satellite-based systems.
There was a concern that initially there would not be enough vehicles on the road with V2V capability for there to be any benefit. An industry spokesman estimated that if only one major OEM offered V2V systems, it might take over two years before there were enough equipped vehicles to provide any benefit. If V2V is mandated however, it might take only one year. Hence OEMs are in favour of the NHSTA V2V mandate.

Study on the Deployment of C-ITS in Europe: Final Report | 102
Ricardo in Confidence Ref: Ricardo/ED60721/Issue Number 1
Ricardo Energy & Environment
Liability is not a key issue for current systems and systems to be deployed in the near future since they are primarily informational (e.g. knowledge of traffic conditions). The DOT-sponsored Safety Pilot Model Deployment (Safety Pilot in which DOT has partnered with the CAMP VSC 3 Consortium) was conducted by the University of Michigan Transportation Research Institute, UMTRE, and took place in Ann Arbor, Michigan, from August 2012 to February 2014. No liability issues were raised during the Pilot Deployment. However, when DSRC is employed for mobility applications (e.g. platooning, blind spot detection, left turn assist), liability can become a key issue for manufacturers, including system failures and cyber-crime. DOT is evaluating various approaches to system ownership and operation, including Federally-owned, joint public-private ownership, and fully-private ownership as well as operation and liability issues associated with each.
9.7.7 Relevance to European context
The NHTSA’s Advance Notice of Proposed Rulemaking sets out a logic for making certain V2V technology mandatory in light vehicles: the expected safety benefits of this technology are high, but the probability of any manufacturer deciding to invest in this technology unilaterally is low, and therefore without mandatory standards, market failure is likely (U.S. DoT, 2014c).
The NHTSA has also acknowledged that this approach may have its disadvantages – for example, it asked stakeholders as part of its Advance Notice of Proposed Rulemaking whether they believed the DoT’s regulatory endorsement of DSRC might “crowd out” other viable technologies, for example (U.S. DoT, 2014c).
The agency has also drawn attention to a number of outstanding or potential issues with its plans for deploying C-ITS which may have close parallels in any future EU deployment plan.
One such issue is consumer acceptance. For example, if C-ITS systems depend upon regular servicing to maintain their effectiveness, but some consumers decide they would rather leave their broken systems as they are than take their car in for servicing (for example updates to security certificates), the benefits of C-ITS will be compromised.
Consumers may also need to be convinced that their privacy will not be jeopardised, and so the NHTSA’s proposals are for a system in which it is not possible to identify individuals or track their movements over time using the C-ITS system.
Another issue is that the OEM industry has concerns about their liability increasing if they are deemed responsible for the products they create communicating effectively with products in vehicles they may not have created. However, the NHTSA argues that the liabilities manufacturers face would just be analogous to those they face already.
The possibility of V2V communications congestion has also been raised – so far, pilot studies have involved a limited spatial density of C-ITS vehicles. In dense urban environments, the NHTSA warns, spectrum congestion could conceivably become an issue. The NHTSA proposes further testing to gather evidence on this issue.
The American spectrum regulator, the Federal Communications Commission, is currently considering opening up the 5.9 GHz range currently reserved for C-ITS to unlicensed Wi-Fi devices (IEEE 802.11 media access control, MAC, and physical layer, PHY, specifications). A similar plan is also under consideration in the EU. The NHTSA states that the possibility of such devices interfering with C-ITS if they share the same part of the spectrum still needs to be investigated.
The type of V2V system envisaged by the NHTSA would also require a security and communications sub-system to be set up. The creation, funding and management of that system is an outstanding issue, although the NHTSA has stated that it believes a private company may be interested in operating such a system.
The NHTSA also has outstanding questions about how to set appropriate test procedures and performance requirements, and is still investigating driver-vehicle interface issues. The DoT funds programmes of research in each of these areas.

Study on the Deployment of C-ITS in Europe: Final Report | 103
Ricardo in Confidence Ref: Ricardo/ED60721/Issue Number 1
Ricardo Energy & Environment
9.8 CASE STUDY: Australia
9.8.1 Overview
“As Australia is positioning itself to be an early adopter of developments undertaken internationally in the C-ITS space, applications deployed in Australia would be based on those applications deployed internationally, at least in the initial deployment period. Following that, Australia could evolve into a position where it could influence the development of applications to be deployed on the standardised platform that address specific areas of interest to Australia and may also be relevant to other international regions.”
(Austroads, 2012)
As a country without a significant automotive industry, Australia has been closely following the development, deployment and standardisation activities in the US and the EU. Given its automotive standards and radio spectrum allocation resemble those in the EU, Australia seeks to follow European standards for C-ITS deployment as the default option. The association of Australian road operators, Austroads, has been designated by the central government to lead and coordinate C-ITS related activities.
9.8.2 Objectives
The Transport and Infrastructure Council is the Australian government entity with overall responsibility for developing Australia’s ITS strategy. Concerning C-ITS in particular, the Transport and Infrastructure Council chose to delegate responsibility for developing a C-ITS strategy to Austroads. The objectives that Austroads put forward in its C-ITS strategy are reproduced in Table 9-10.
Table 9-10 Objectives in Austroads’ C-ITS strategic plan
Objectives How the objectives of C-ITS would be achieved
Deploy C-ITS in Australia in line with international developments (i.e. between 2016 and 2020, most likely to follow Europe)
By keeping up-to-date with international developments in C-ITS and positioning Australia such that it is able to adopt and adapt the various requirements developed internationally that are needed to successfully deploy C-ITS and enable it to function such that the C-ITS applications and benefits can be rolled out to the Australian community.
Improve road safety By vastly improving risk detection and its notification to vehicles and drivers through advanced driver assistance information services and applications.
Enhance mobility and access By offering increased convenience, mode choice and access to services.
Improve transport efficiency, reliability and productivity and therefore improve the productivity of the nation through improving the productivity of its road network
By providing the efficient movement of people through enhanced public transport services, and goods through enhanced logistics and routing, and by improving the management of traffic through the use of enhanced transport network performance information.
Through more efficient use of transport infrastructure and optimising freight (logistics) and public movement, the productivity of the nation can be increased, as gains in the productivity of the road network will transfer to overall productivity gains.
Improve social and environment-related transport outcomes
By providing information, system interventions and services to aid road users to reduce their energy consumption and emissions.

Study on the Deployment of C-ITS in Europe: Final Report | 104
Ricardo in Confidence Ref: Ricardo/ED60721/Issue Number 1
Ricardo Energy & Environment
Improve transport network resilience
By providing systems to enable the road network to recover from a decline in traffic flow and have the road network operating at its full potential when it is required most.
Contribute to the international C-ITS arena
By being an active and valuable contributor to various international C-ITS related committees and by developing and undertaking trials, and testing of C-ITS applications and devices that are proposed to be deployed on to the global platform.
Source: (Austroads, 2012)
The C-ITS strategy is part of a wider national policy and strategy framework that have been developed to support a coordinated approach for the ITS industry. The key documents include:
Policy Framework for Intelligent Transport Systems in Australia: A policy document endorsed by all Australian Transport Ministers at the Standing Council on Transport and Infrastructure;
National ITS Industry Strategy: Prepared by ITS Australia with input from industry and government stakeholders to provide a strategic framework for the wider ITS industry. The inaugural industry strategy was first released in 2009 – given the rapidly evolving nature of ITS technology and policy implications, it was revised again in 2011.
The Industry Strategy promotes three core pillars of safety, mobility and the environment, in order to align with the national program of transport reform.
9.8.3 Stakeholders involved
Australia has a federal system of government and therefore there are at least two layers of government involved in C-ITS policy; the governments of Australia’s States and Territories, and the Commonwealth (national) government. A third layer, local government, may also play a role in deployment initiatives.
Australia’s geographic position, the size of its economy relative to the EU, the US and Japan, and its dependence on automotive imports mean that foreign stakeholders are likely to play an extremely significant role in the future development of C-ITS in Australia: experts anticipate that much of the work on developing ITS standards and technology will take place outside of the country. Australian government intends to focus on influencing this work to the benefit of Australia and later potentially adapting EU or US standards and technology to fit Australian needs (SCOTI, 2012). According to stakeholders, the EU approach is now being followed, at least as a default option.
To date, the private sector has been involved to the extent that it has been consulted by government on future C-ITS policy, and some private sector organisations such as commercial vehicle operators have been involved in government-funded C-ITS trials.
A list of major stakeholders is given below.
Government
The Department of Infrastructure and Regional Development is the commonwealth (i.e. national) government department responsible for transport in Australia.
The transport departments of the State and Territory governments have a significant role to play in development and implementation of transport policy in general, including C-ITS policy, as Australia has a federal system of government.
The Transport and Infrastructure Council11 brings together Commonwealth, State, Territory and New Zealand Ministers responsible for transport and infrastructure issues (as well as the Australian local government association) to help progress nationally significant reforms in transport policy.
Austroads (whose members include the Australian commonwealth government department responsible for transport, as well as the Australian state government departments for transport, the New Zealand Transport Agency, and the Australian local government association) provides expert technical input into national policy, and promotes best practice and harmonisation of practices of its road agency members. Austroads was designated the interim C-ITS management entity from 2012 to 2014/15 (Austroads, 2012).
11 Previously the Strategic Council On Transport Infrastructure (SCOTI)

Study on the Deployment of C-ITS in Europe: Final Report | 105
Ricardo in Confidence Ref: Ricardo/ED60721/Issue Number 1
Ricardo Energy & Environment
The National Transport Commission is an independent public body set up to help deliver transport policy objectives by delivering regulatory reforms across state and commonwealth government. It has previously investigated prospective regulatory policy barriers to deployment of C-ITS.
The Australian Communications and Media Authority (ACMA) is the radio spectrum regulator in Australia and has placed a block on new non-ITS uses of the 5.9 GHz range and recognised the potential future use of that part of the spectrum for DSRC C-ITS (National Transport Commission, 2013).
Other Australian stakeholders
Austroads organises biannual meetings with an Industry Reference Group on C-ITS involving over 30 senior representatives, e.g. from auto industry association, providers of traveller information services, mapping companies, suppliers, DSCR providers, satellite communication industry, Commonwealth Government etc. This is essentially a consultation forum to ‘throw ideas around’.
A key difference from US and Europe is that there is no significant auto industry which makes close contact with vehicle technology developers more challenging. As a consequence, in the Australian policy strategy there is little focus on technology development and more on following international developments to put appropriate framework in place. In 2011, 30% of Australian car imports came from Japan, 23% from the EU and 15% from North America (Hutchens, 2013). The share of the market accounted for by Australian-based plants has been in steady decline for many years and the last three auto manufacturers remaining in Australia are expected to cease production soon (Mellor, 2014) (Austroads, 2014a).
The Australian Logistics Council, the Truck Industry Council and ITS Australia are among the organisations that have been consulted by the public bodies developing ITS policy in Australia (National Transport Commission, 2013).
Non-government stakeholders have also been brought in to deliver deployment and trials of C-ITS systems, for example Transmax and ITS Australia worked with the Queensland Government to deliver a project to provide emergency vehicle priority at intersections (Transmax, 2015). A number of commercial vehicle operators are currently involved in a trial of V2V and V2I applications for heavy vehicles in New South Wales (Transport for NSW, 2015).
In future a large number of different types of stakeholders may be involved in C-ITS; Austroads has attempted to enumerate them all (see Figure 9-12).
Foreign stakeholders
The most relevant Standards Development Organisations (SDOs) for Australia are CEN, ISO and ETSI (whose standards are being adopted in the EU) and IEEE, and SAE (whose standards are being adopted in the US). According to Austroads, most involvement is with ISO TC204 where Australia follows international developments closely. There is not much direct contact with CEN, ETSI or IEEE/SAE. However, Austroads is also actively involved with EU-US Harmonisation Task Group 6 (security).
9.8.4 Timings
As yet, the Australian government does not seem to have adopted a firm deadline for widespread deployment of C-ITS applications. However, work has begun on establishing the foundations of that deployment, for example by beginning to consider what the national ITS architecture should be and what sets of C-ITS standards Australia should adopt. The Government is also undertaking a small pilot project to deploy C-ITS applications on a limited scale in New South Wales.
9.8.4.1 National initiative
9.8.4.1.1 Plan
Austroads’ C-ITS strategic plan, which was published in 2012, proposed a five year “concept” of the path to deployment of C-ITS in Australia, although the calendar date of year one was not specified. The strategic plan states that the government saw itself as “approaching year one” but that the timing of tasks was dependent on international developments. The five-year plan concept is reproduced in Figure 9-11.

Study on the Deployment of C-ITS in Europe: Final Report | 106
Ricardo in Confidence Ref: Ricardo/ED60721/Issue Number 1
Ricardo Energy & Environment
Figure 9-11 Timing for delivery of C-ITS to Australia as foreseen in Austroads’ C-ITS strategic plan
Source: (Austroads, 2012)
9.8.4.1.2 Progress to date
According to a stakeholder interview, Australia is currently in phase 2 of the plan, although at present the plan is not often referred to in C-ITS policy.
Austroads has taken the following steps to progress the adoption of architecture and standards for C-ITS:
Set out a vision for a national ITS architecture (Austroads, 2014a).
Endorsed FRAME as the ‘source architecture’ of the forthcoming Australian National ITS architecture. This national architecture is slated for completion in 2015 (Austroads, 2014a).
Developed a business architecture for ITS (Austroads, 2014b), which among other things involved identifying all types of organisation that might be involved in delivery of ITS services in Australia (see Figure 9-12)
Completed an assessment of EU and US C-ITS standards. This review concluded that it would be better to choose one set of standards as a source for Australia rather than attempt to “mix and match” from both (Austroads, 2015). It is now fairly certain that Australia will follow EU standards by default.
Finally, the government’s biggest trial of C-ITS deployment in Australia (the Cooperative Intelligent Transport Initiative) is currently underway in New South Wales.
Austroads is currently working on defining initial system requirements on the following core functional areas for C-ITS:
1. Spectrum management and device licencing
2. Standards which to adopt and compliance
3. Security management (Austroads participation in EU-US Harmonisation group)
This process will require coordination with European partners, as the intention is to follow the EU C-ITS framework. Regarding the spectrum band reservation, Austroads were waiting for an ECC decision on relaxed spectrum mask requirements which was under discussion for a while and released in July 2015. A ‘class licencing’ spectrum allocation decision is currently underway, and expected within 6-12 months.

Study on the Deployment of C-ITS in Europe: Final Report | 107
Ricardo in Confidence Ref: Ricardo/ED60721/Issue Number 1
Ricardo Energy & Environment
According to a stakeholder, the 2016 ITS World Congress in Melbourne would be an important informal deadline for completion.
Figure 9-12 Organisations identified in Austroads’ ITS business architecture as being involved in delivery of ITS services
Source: (Austroads, 2014b)
9.8.4.2 CITI
The Cooperative Intelligent Transport Initiative (CITI) is a $1.65M (€1.1M) trial of V2V and V2I C-ITS deployment for heavy vehicles using a 42km road freight corridor in New South Wales. The trial is the first large scale test dedicated to heavy vehicles, and will establish the first semi-permanent test area in Australia for C-ITS. 83% of funds will come from national and state government, and the remaining 17% will come from a research institute known as National ICT Australia.
During the trial 30-60 vehicles will be fitted with DSRC transceivers in order to benefit from the following specific applications:
V2V: Intersection collision warning, forward collision warning and heavy braking ahead messages
V2I: Advance warning of red lights, and in-cab messages for truck and bus speed limits at a particular location
Partners involved in this trial include the Port Kembla authority which is helping to provide access to local infrastructure, and several commercial vehicle operators who have agreed to have their vehicles fitted with the DSRC devices. Vehicles began to be equipped in 2014 this will continue throughout 2015. Results will be gathered over the next couple of years but the project may be extended for several years beyond that (Wall, 2013; Transport for NSW, 2015).
According to a stakeholder, the project was chosen for:
1. Very unique geographical location: Port Kembla-Sydney corridor has lots of freight trucks, going up a steep cliff, posing a number of safety issues (tight turns, steep inclines). The project can help identify technology solutions and be a test bed for technologies.

Study on the Deployment of C-ITS in Europe: Final Report | 108
Ricardo in Confidence Ref: Ricardo/ED60721/Issue Number 1
Ricardo Energy & Environment
2. Trucks tend to be easier to fit equipment to. Moreover, they have high mileage (e.g. Port Kembla to Sidney every day). It has been fairly easy to sign up several freight companies to become involved.
The location has been a challenge in terms of setting up DSRC and satellite positioning. Some road parts are without electricity access, which is reflective of the wider situation on many Australian roads. Moreover, obtaining a ‘scientific’ permission for use of the 5.9 GHz spectrum band entailed administrative difficulties. The spectrum is currently embargoed but not allocated to C-ITS applications yet (see section 9.8.4.1.2).
9.8.5 Targeted C-ITS applications
The CITI project will involve trials of a limited number of V2V and V2I C-ITS applications. Additionally, in 2011 Austroads identified a wider set of applications which it believes will be of interest to Australia, most of which contribute to road safety. These applications are listed in Table 9-11. Austroads has encouraged the country’s national and state road agencies to focus on preparing business cases and trials for the adoption and deployment of these applications.
Table 9-11 Specific C-ITS applications identified by Austroads as being of interest to Australia
Application name ETSI use case code Principal benefit
Intersection collision warning UC003
Safety
Motorcycle approaching warning UC004
Collision risk warning UC012
Regulatory/contextual speed limits notification
UC018
Traffic light optimal speed advisory UC019
Driver fatigue for light and heavy vehicles N/A
Enhanced route guidance and navigation UC021 Network Efficiency
Source: (Austroads, 2011)
9.8.6 Policy approach
The Australian government describes itself as a “relatively small player in the global ITS space” – Australia’s GDP is equivalent to approximately 10% of the United States’, and Australia imports most of its vehicles, implying that the ability of Australia to take a leading role in ITS is very limited. Accordingly, the Transport and Infrastructure Council’s strategic plan states that Australian ITS architecture must be “consistent with global developments” (SCOTI, 2012), and Austroads has set out a strategic approach for C-ITS which consists firstly in adopting another region’s standards, and secondly contributing to the future development of those standards in a way that benefits Australia, as described in the quote above.
Austroads has acknowledged that it would be unwise for Australia to attempt to “mix and match” US and EU C-ITS standards, therefore, the country faced a choice between adopting a set of EU standards covering an extensive range of applications which are further away from deployment, or adopting US standards which are associated with a smaller set of (mainly safety-related) applications that are nearer readiness for widespread deployment (Austroads, 2015). According to a stakeholder interview, it has recently become clear that Australia will follow EU standards. This is due to a variety of reasons:
Australia has a national policy to adopt UNECE standards for cars, i.e. Australian cars are designed to European specifications
Several private toll roads operators using 5.8 GHz DSRC system are active in Australia, similar to Europe but different to the US.
The Australian radio channel allocation is very similar to the EU’s. It would not be possible for Australia to adopt US control channel allocation.

Study on the Deployment of C-ITS in Europe: Final Report | 109
Ricardo in Confidence Ref: Ricardo/ED60721/Issue Number 1
Ricardo Energy & Environment
Due to these reasons, practically all stakeholders consulted by Austroads favoured following EU standards.
9.8.7 Deployment and key results
9.8.7.1 Expected long-term results of total deployment
Austroads performed a basic analysis (Austroads, 2011) of the potential benefits of C-ITS in Australia, on the basis of a review of available evidence about the safety benefits of C-ITS at that time, in combination with contemporary road accident statistics for Australia. This review indicated that there are approximately 29,000 serious casualties of road accidents each year in Australia, but total deployment of just four specific V2V applications could prevent 7,500 to 10,350 (25% to 35%) of these casualties. The assumed distribution of casualties prevented by type of collision is shown in Table 9-12.
Table 9-12 Assumed potential for reducing serious casualties with DSRC C-ITS in Australia
Collision classification code
Description
Serious casualties per annum
Assumed % prevented by DSRC C-ITS
Serious causalities prevented by DSRC per annum
DCA 11x Vehicles from adjacent directions (e.g. intersection “cross traffic”)
4,300
52%-72%
2,250-3,100
DCA 12x Vehicles from opposing directions 4,650 2,400-3,350
DCA 13x Vehicles from the same direction (“nose to tail” collisions)
5,100 2,650-3,650
DCA 15x Overtaking 300 200-250
(Others) Includes pedestrian crashes, U-turn crashes, and “off path” crashes.
14,600 0% -
Total Total of the above 28,950 25%-35% 7,500-10,350
Source: (Austroads, 2011).
9.8.8 Relevance to European context
As a country without a significant home-grown automotive industry, Australia is dependent on industry developments from Europe, the USA and Japan, and tends to follow these closely. For C-ITS deployment, Australia has decided to follow EU standards and is looking towards the EU to take a lead, so that it can itself put standards and policies in place to allow similar technology to be deployed. Therefore, there is interest from Austroads in closer cooperation with Europe, including in certification, standards adoption and learning from deployment.

Study on the Deployment of C-ITS in Europe: Final Report | 110
Ricardo in Confidence Ref: Ricardo/ED60721/Issue Number 1
Ricardo Energy & Environment
9.9 CASE STUDY: ITS-G5
9.9.1 Overview
ITS-G5 is a European set of protocols and parameters for vehicle-to-vehicle (V2V) and vehicle-to-infrastructure (V2I) communications based on the IEEE standard 802.11 (used also for Wi-Fi) and its amendment 802.11p on wireless access in vehicular environments (ETSI, 2009; Sjöberg, 2011).
It has the potential to support low latency communications (less than 100 milliseconds) and is therefore a crucial enabling technology for safety-related, time-critical C-ITS applications, where rapid exchange of information may prevent (or mitigate the impacts of) accidents.
This review will focus in particular on ITS-G5A as a frequency spectrum allocated especially for road safety relevant applications in Europe which is the only frequency band currently mandated to be available for C-ITS applications EU-wide (Härri & Kenney, 2015)
9.9.2 Objectives
The European standards around ITS-G5 define the frequency ranges and protocols to be used in the communication between ITS stations. This includes procedures for avoiding interference with electronic toll collection systems in the 5.8 GHz range (CEN-DSRC) using deactivation of V2X systems near toll zones as well as stringent spectrum mask requirements (which are currently under review), i.e. the requirements for emitted signals to stay within a defined frequency limit. Moreover, decentralised congestion control (DCC), a procedure devised by ETSI specifically for controlling congestion of communication channels in C-ITS under high vehicle density is also part of ITS-G5 protocols. These basic sets of rules within the European C-ITS architecture are known as the access and media layer (Austroads, 2015).
Austroads (2015) identify 5 relevant European standards defining the G5 access and media layer:
ETSI ES 202 663 – Intelligent Transport Systems (ITS); European profile standard for the physical and medium access control layer of Intelligent Transport Systems operating in the 5 GHz frequency band.
ETSI EN 302 663 – Intelligent Transport Systems (ITS); Access layer specification for Intelligent Transport Systems operating in the 5 GHz frequency band.
ETSI TS 102 687 – Intelligent Transport Systems (ITS); Decentralised Congestion Control Mechanisms for Intelligent Transport Systems operating in the 5 GHz range; Access layer
ETSI TS 102 792 – Intelligent Transport Systems (ITS); Mitigation techniques to avoid interference between European CEN Dedicated Short Range Communication (CEN DSRC) equipment and Intelligent Transport Systems (ITS) operating in the 5 GHz frequency range
ETSI TS 102 724 – Intelligent Transport Systems (ITS); Harmonised Channel Specifications for Intelligent Transport Systems operating in the 5 GHz frequency band
ITS-G5 is subdivided into three frequency bands, ITS-G5A, ITS-G5B and ITS-G5C (ETSI, 2009).
ITS-G5 Application Frequency
ITS-G5A Dedicated to ITS for safety related applications
5,875 GHz to 5,905 GHz
ITS-G5B Dedicated to ITS for non-safety related applications
5,855 GHz to 5,875 GHz
ITS-G5C Used for V2I and I2V ITS applications 5,470 GHz to 5,725 GHz
The 30 MHz of ITS-G5A frequency band is currently divided into 3 sub-channels of 10 MHz each:
G5SC1- This is the main service channel for safety and efficiency messages mainly used for high throughput, safety messages with medium priority, multi-hop and geocast messages at the second hop.

Study on the Deployment of C-ITS in Europe: Final Report | 111
Ricardo in Confidence Ref: Ricardo/ED60721/Issue Number 1
Ricardo Energy & Environment
G5SC2- This is a service channel used only with low transmission power for very short range communications, mainly between vehicles and roadside stations (for ad-hoc communication).
G5CC- This channel also can be used for time critical messages like in the case of G5SC1. This is a control channel which is common for all applications.
ITS-G5B has 2 service channels, G5SC4 and G5SC3 which are of 10MHz each. G5SC5 is defined to be in the 255 MHz wide ITS-G5C band, and the channel spacing can be either 10 or 20MHz. This band is shared with standard Wi-Fi applications which may cause occasional interference and is therefore not suited for safety applications.
Figure 9-13: European ITS channel allocation (Şoriga, 2012)
Note: The ‘Future ITS applications’ spectrum is also known as ITS-G5D (Härri & Kenney, 2015)
Similar spectrum bands have been allocated in the US (75MHz in the range 5,850–5,925GHz) and in in Japan (80MHz in the range 5,770–5,850GHz). The US spectrum was reserved in 1999 (Alleven, 2015). In 2003, the DOT added licencing and service rules for the spectrum, subdividing it into 7 non-overlapping channels of 10 MHz each. In Europe, the spectrum allocation process started with ETSI calling upon the ECC to reserve a European ITS frequency in 2005. ETSI took account of the existing US allocation, recommending a 5,875 GHz to 5,925 GHz band which would allow aligning the control channel frequency at 5,885 GHz to 5,895 GHz. However, finally the control channels were not allocated on the same frequency, the European control channel having been allocated 10 MHz higher. Despite these differences, it is suggested that the same devices can be used for both the US and the EU systems although different firmware or software will be required (Austroads, 2015). However, as mentioned above, spectrum mask requirements are a lot higher in the EU than the US (but are currently under revision) which may mean EU devices would require more expensive filters (Austroads, 2015). Less information is available on how the 5.8 GHz spectrum was allocated to ITS applications in Japan.
Concerns have been raised over insufficient band width for ITS-G5A which is viewed as being insufficient for more advanced applications beyond day 1 (Skov Andersen, 2015). Shi and Sung (2014) find that an 80 MHz, rather than the currently allocated 10 MHz G5CC channel would be needed for transmission of safety-critical messages on a crowded motorway with 99% reliability.
Moreover, the existing 5.8 and 5.9 GHz frequency bands are coming under pressure to be shared with other broadband applications (European Commission, 2014). In particular in the US there has been some debate on whether and how the reliability of ITS services can be ensured when the frequency is shared with Wi-Fi applications after the FCC issued a Notice of Proposed Rulemaking which proposed a change that would allow the band allocated to ITS to be shared with unlicensed Wi-Fi devices (Alleven, 2015). Similarly, in Europe the Commission has mandated CEPT to investigate the possibilities for spectrum sharing. CEPT’s response, however, suggests that for now no spectrum sharing with adequate protection of ITS services is possible (CEPT, 2015).
9.9.3 Stakeholders Involved
Overall, responsibility for the development of European standards on C-ITS is split between the European Telecommunications Standards Institute (ETSI) and the European Committee for

Study on the Deployment of C-ITS in Europe: Final Report | 112
Ricardo in Confidence Ref: Ricardo/ED60721/Issue Number 1
Ricardo Energy & Environment
Standardisation (CEN), in coordination with the International Standards Organisation (ISO). A first set of comprehensive standards covering the whole C-ITS architecture known as ‘release 1’ were published by ETSI and CEN in late 2013. ETSI is in charge of delivering the 5.9 GHz communications on the vehicle-to-vehicle side while CEN/ISO are essentially in charge of vehicle-to-infrastructure communications and developing a platform in which the 5.9 GHz communications complies with other standardised communications (Austroads, 2015). EU Mandate 453 of 2009 of the Commission on C-ITS interoperability defines how exactly the responsibilities are divided.
9.9.3.1 ITS-G5
ETSI produces globally-applicable standards for Information and Communications Technologies (ICT), including fixed, mobile, radio, converged, broadcast and Internet technologies. It creates standards via consensus and through direct input from its 800 plus members from 64 countries. ETSI is also officially recognised as a European standards organisation by the European Commission. It supports European regulations and legislation through the creation of Harmonised European Standards. Only standards developed by the three ESOs (CEN, CENELEC and ETSI) are recognised as European Standards (ENs). The standards development process is carried out in technical committees and working groups, which are often supported by Special Task Forces (STFs) in which teams of skilled and experienced experts work on a selected topic. ETSI standards are open and available free of charge.
ETSI’s Technical Committee for Intelligent Transport Systems (ETSI TC ITS), which was created in 2007, is responsible for developing the technical standards and specification for ITS. ETSI TC ITS has established liaisons with other standards development organisations and cooperates with various European R&D projects, organisations and industry consortia. ETSI TC ITS has created five working groups (WGs) with the following scope and objectives:
WG1- User and application requirements
WG2- Architecture, cross-layer, web services
WG3- Transport and network
WG4- Media and medium related issues
WG5- Security
The ETSI TC ITS is driven by the work of its members, which are essentially those of the Car2Car Communication Consortium: OEMs, suppliers and some involvement from universities. Members propose work items and then work on them. This leads to standardisation processes generally being much faster than under CEN and ISO which work mostly with consultants and have a wider range of stakeholders involved. Generally therefore finding agreement within these organisations tends to be more time consuming and stakeholders have suggest that the CEN/ISO contributions to the ‘release 1’ set of standards have taken longer to complete.
9.9.3.2 Reservation of frequency band G5 for safety-related ITS applications
A crucial stakeholder in the determination of the frequency band decisions was the Electronic Communications Committee (ECC) of the European Conference of Postal and Telecommunications Administrations (CEPT).
The ECC is formed of the radio and telecommunications regulatory authorities of the 47 CEPT member countries and makes decisions on common procedures. In its TR 102 492-1 of 2005, ETSI called upon ECC to develop a frequency decision so C-ITS equipment can start to be fitted to vehicles. Based on upper bound of the designated US frequency band for automotive safety applications at 5,925 MHz and the 5.8 GHz toll collection band, it was recommended that the 5,875-5,905 GHz band be reserved for safety-critical C-ITS applications (G5A), and the band 5,905-5,925 for future C-ITS extensions (G5D). An ECC Decision was made in 2008 to reserve the above frequency bands, following ETSI’s recommendations (ECC/DEC(08)01). The European Commission is responsible for enforcing spectrum decisions in its Member States and echoed the ECC Decision in its Commission Decision 2008/671/EC. Moreover, an ECC Recommendation has been made to make the 20 MHz frequency band from 9,855GHz to 9.875GHz (G5B) available for non-safety relevant ITS applications. The ECC Decision and Recommendation were made on the basis of numerous studies examining the potential impacts, for example on neighbouring bands. This approach contrasts with that of the US, where the Federal Communications Commission was quick to make a decision on spectrum reservation, taking more of a trial and error approach.

Study on the Deployment of C-ITS in Europe: Final Report | 113
Ricardo in Confidence Ref: Ricardo/ED60721/Issue Number 1
Ricardo Energy & Environment
9.9.4 Timings
The basic elements of ITS-G5 have been set out in the mid-late 2000s. In its 2005 document requesting ECC to reserve a frequency band for C-ITS applications (TR 102 492-1), ETSI highlighted the intention to place commercial ITS products on the market by 2008, thus requiring ECC to reserve the frequency two years earlier, by 2006. However, ECC’s decision to reserve the frequency was only made in 2008. ETSI’s ES 202 663 standard which first refers to ‘ITS-G5’ as European profile standard on the basis of IEEE 802.11p was published in 2009.
A first set of comprehensive standards covering the whole C-ITS architecture known as ‘release 1’ were published by ETSI and CEN in late 2013, following EU Mandate 453 of 2009 of the Commission on C-ITS interoperability. ‘Release 1’ included comprises 157 standards across all layers. A subset of these is considered to be the minimum to enable operational deployment in day 1. These are undergoing an error correction process. In some cases, alignment between ETSI and CEN standards is also needed (Skov Andersen, 2014).
A ‘release 2’ is planned once initial deployment has taken place. This would incorporate more advanced C-ITS services.
9.9.5 Relevance to European context
The development of ITS-G5, both in terms of the frequency allocation process and in terms of the wider ‘release 1’ set of standards defining C-ITS communication in 5.9GHz frequency range has been a key part of European C-ITS activity.
In general, the decision process of reserving the frequency spectrum has been slow but thorough. Similarly, deployment of C-ITS is going slower than expected. Overall, however, stakeholders appear confident that much progress has been made and that the mostly industry-led initiative of developing standards in the field especially within the ETSI TC ITS working group in charge of the vehicle-to-vehicle aspects of the G5 system.

Study on the Deployment of C-ITS in Europe: Final Report | 114
Ricardo in Confidence Ref: Ricardo/ED60721/Issue Number 1
Ricardo Energy & Environment
10 Annex D: Matrix approach
At the July meeting of WG1, a matrix-based, ‘building block’ approach to developing deployment scenarios was agreed and implemented. The main steps of the approach are shown in Figure 10-1. The baseline scenario is also developed using a similar methodology.
Figure 10-1. Scenario definition methodology overview
10.1 Step 1: Service bundle definition
C-ITS services are grouped into a series of service bundles, based on a number of metrics, including: whether they are V2V or V2I; whether they are day 1 or day 1.5 services; their primary targeted geographic deployment areas (TEN-T corridors, core TEN-T, TEN-T comprehensive, urban); the communications technology they employ; their primary targeted vehicle type(s); and their primary purpose. The process for developing these service bundles has been heavily informed by our extensive literature review and consultations with WG1 members, as well as the outputs of the previous WG1 meetings.
Based on these inputs, a series of nine self-contained C-ITS service bundles have been defined, each comprised of similar or linked services, as described in Table 10-1 below.
Table 10-1 C-ITS service bundles for scenario building
Service bundle C-ITS Services Rationale
Bundle 1
Day 1, V2V, ITS-G5
• Emergency brake light
• Emergency vehicle approaching
• Slow or stationary vehicle(s)
• Traffic jam ahead warning
• Hazardous location notification
• Day 1 safety-based V2V services based on ITS-G5 communication, likely to be deployed to vehicles supported by US legislation
Bundle 2
Day 1, V2I, mainly applicable to motorways
• In-vehicle signage
• In-vehicle speed limits
• Probe vehicle data
• Shockwave damping
• Road works warning
• Weather conditions
• Day 1 V2I, services that deliver most benefit to motorways. Some services listed here may also be applicable to other road types

Study on the Deployment of C-ITS in Europe: Final Report | 115
Ricardo in Confidence Ref: Ricardo/ED60721/Issue Number 1
Ricardo Energy & Environment
Bundle 3
Day 1, V2I, mainly applicable to urban areas
• Green Light Optimal Speed Advisory (GLOSA) / Time To Green (TTG)
• Signal violation/Intersection safety
• Traffic signal priority request by designated vehicles
• Day 1 V2I, services expected to only be applicable in urban areas. Therefore, these services are in a separate bundle to those in Bundle 2
Bundle 4
Day 1.5, V2I, Parking Information
• Off street parking information
• On street parking management and information
• Park & Ride information
• Information on AFV fuelling & charging stations
• C-ITS services intended to provide information regarding parking (and refuelling) to drivers
Bundle 5
Day 1.5, V2I, Traffic and other information
• Traffic information and smart routing
• C-ITS services intended to provide traffic information to drivers
Bundle 6
Day 1.5, Freight specific services
• Loading zone management
• Zone access control management • Zone management services
Bundle 7
Day 1.5, V2X (mainly applicable to urban areas), likely to be ITS-G5
• Vulnerable road user protection (pedestrians and cyclists)
• V2X service expected to be post day 1. Communication method is likely to be ITS-G5. Main benefits are likely to be seen in urban areas.
Bundle 8
Day 1.5, V2V, likely to be ITS-G5
• Cooperative collision risk warning
• Motorcycle approaching indication
• Post day 1 V2V services that are likely to be based on ITS-G5. As for Day 1 services, V2V and V2I services are in separate service bundles.
Bundle 9
Day 1.5, V2I • Wrong way driving
• Post day 1 V2I service. As for Day 1 services, V2V and V2I services are in separate service bundles.
10.2 Step 2: Defining a matrix of priority scenario building blocks
Having defined a series of relevant service bundles, the likely applicability of each bundle to the different road geographies and vehicle types is considered. The applicability of each service bundle is determined by their technical compatibility, the likely magnitude of benefits associated with each service bundle/road geography/vehicle type combination, and the likelihood of achieving significant long-term penetration in that segment. Based on this thought process, the applicability of each service bundle to different combinations of road geography and vehicle type can be represented in a colour-coded matrix to visually represent the most applicable combinations, as shown in
Table 10-2 below.
Each service bundle/road geography/vehicle type combination can be thought of as a basic building block, from which scenarios can be developed by deploying each building block at different times and rates. The most applicable combinations from the colour-coded matrix (i.e. those in dark green) represent the most likely building blocks from which scenarios can be built initially.

Study on the Deployment of C-ITS in Europe: Final Report | 116
Ricardo in Confidence Ref: Ricardo/ED60721/Issue Number 1
Ricardo Energy & Environment
Table 10-2 – Mapping of applicability of service bundles to different road geographies and vehicle types
Colour coding
Highly applicable
Applicable Applicable but limited benefits
Few benefits Not relevant
in this environment
Bundle of servicesTEN-T
Corridors
TEN-T
Core
TEN-T
Comprehensive
Non m-way
non urbanUrban Services
Personal transport
Public transport
Freight
Personal transport
Public transport
Freight
Personal transport
Public transport
Freight
Personal transport
Public transport
Freight
Personal transport
Public transport
Freight
Personal transport
Public transport
Freight
Personal transport
Public transport
Freight
Personal transport
Public transport
Freight
Personal transport
Public transport
Freight
Bundle 1
Day 1 V2V - safety
ITS-G5
V
Emergency brake light
Emergency vehicle approaching
Slow or stationary vehicle(s)
Traffic jam ahead warning
Hazardous location notification
Bundle 2
Day 1 V2I (mainly
applicable to motorways)
I
Road works warning
Weather conditions
In-vehicle signage
In-vehicle speed limits
Probe vehicle data
Shockwave damping
Bundle 3
Day 1 V2I (mainly
applicable to urban
areas)
I
GLOSA/TTG
Signal violation/intersection safety
Traffic signal priority request by designated
vehicles
Bundle 4
Day 1.5 V2I - Parking
information
I
Off street parking information
On street parking management and
information
Park & Ride information
Bundle 5
Day 1.5 V2I - Traffic and
other information
I
Information on fuelling & charging stations
for AFV
Traffic information & smart routing
Urban zone access control
Bundle 6
Day 1.5 V2I - Services
specific to freight
I Loading zone management
Bundle 9
Day 1.5 V2I - safetyI Wrong way driving
Bundle 7
Day 1.5 - V2X (mainly
applicable to urban
areas)
X Vulnerable road user protection
Bundle 8
Day 1.5 V2V - safetyV
Motorcycle approaching indication
Cooperative collision risk warning
Possible scenario building
blocks

Study on the Deployment of C-ITS in Europe: Final Report | 117
Ricardo in Confidence Ref: Ricardo/ED60721/Issue Number 1
Ricardo Energy & Environment
10.3 Steps 3 and 4: Developing scenarios from the building blocks
By selecting various combinations of the most likely building blocks, it is possible to develop a series of scenarios, each of which shows increasing C-ITS services deployed as well as the coverage of services. This approach was used successfully at the July 2015 WG1 meeting to define a series of five deployment scenarios, each of which builds upon previous scenarios by incorporating additional ‘building blocks’. The uptake and penetration rates associated with different bundles within each scenario and the baseline scenario are described in detail in Annex E: C-ITS service and infrastructure uptake and penetration rates. These scenarios are designed to be independent and additional, thereby allowing each scenario to independently be compared to the baseline, and to each other in a variety of configurations. The final deployment scenario matrix developed as a result of discussions in the July 2015 WG1 meeting can be found in Table 10-3.
Table 10-3 – Agreed scenario definitions
Key
A: Scenario A B: Scenario B C: Scenario C D: Scenario D E: Scenario E
TEN-T
Corridors
TEN-T
Core
TEN-T
Comprehensive
Non m-way non
urbanUrban Services
Personal transport A A A A A
Public transport C C C C C
Freight A A A A A
Personal transport B B C C/D C
Public transport
Freight B B C C/D C
Personal transport C/D C
Public transport C/D C
Freight C/D C
Personal transport D D E E C
Public transport
Freight E E E E C
Personal transport A A B C/D C
Public transport
Freight B B B C/D C
Personal transport D
Public transport
Freight D D D
Personal transport E E
Public transport E E
Freight E E
Personal transport E E E E E
Public transport E E E E E
Freight E E E E E
Personal transport E E E E
Public transport
Freight E E E E
V
Emergency brake light
Emergency vehicle approaching
Slow or stationary vehicle(s)
Traffic jam ahead warning
Hazardous location notification
I
Road works warning
Weather conditions
In-vehicle signage
In-vehicle speed limits
Probe vehicle data
Shockwave damping
I
GLOSA/TTG
Signal violation/intersection safety
Traffic signal priority request by
designated vehicles
I
Off street parking information
On street parking management and
information
Park & Ride information
Information on fuelling & charging
stations for AFVs
I Traffic information & smart routing
ILoading zone management
Urban zone access control
I Wrong way driving
X Vulnerable road user protection
VMotorcycle approaching indication
Cooperative collision risk warning
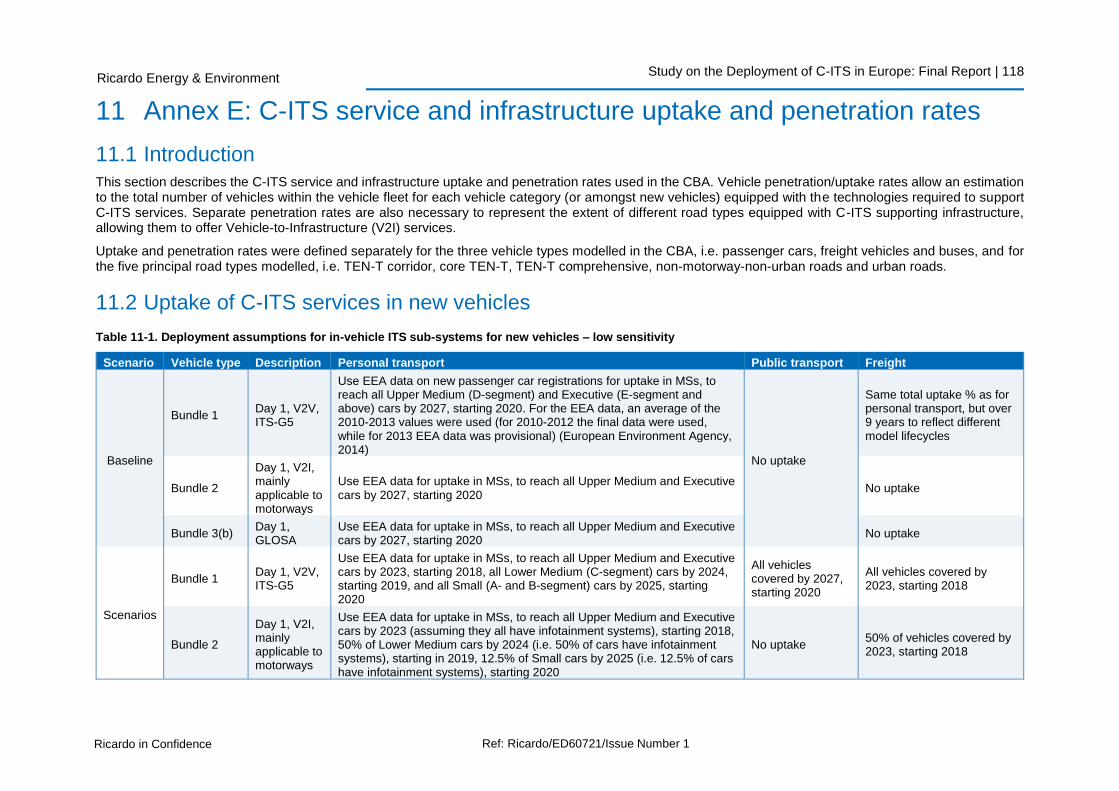
Study on the Deployment of C-ITS in Europe: Final Report | 118
Ricardo in Confidence Ref: Ricardo/ED60721/Issue Number 1
Ricardo Energy & Environment
11 Annex E: C-ITS service and infrastructure uptake and penetration rates
11.1 Introduction
This section describes the C-ITS service and infrastructure uptake and penetration rates used in the CBA. Vehicle penetration/uptake rates allow an estimation to the total number of vehicles within the vehicle fleet for each vehicle category (or amongst new vehicles) equipped with the technologies required to support C-ITS services. Separate penetration rates are also necessary to represent the extent of different road types equipped with C-ITS supporting infrastructure, allowing them to offer Vehicle-to-Infrastructure (V2I) services.
Uptake and penetration rates were defined separately for the three vehicle types modelled in the CBA, i.e. passenger cars, freight vehicles and buses, and for the five principal road types modelled, i.e. TEN-T corridor, core TEN-T, TEN-T comprehensive, non-motorway-non-urban roads and urban roads.
11.2 Uptake of C-ITS services in new vehicles
Table 11-1. Deployment assumptions for in-vehicle ITS sub-systems for new vehicles – low sensitivity
Scenario Vehicle type Description Personal transport Public transport Freight
Baseline
Bundle 1 Day 1, V2V, ITS-G5
Use EEA data on new passenger car registrations for uptake in MSs, to reach all Upper Medium (D-segment) and Executive (E-segment and above) cars by 2027, starting 2020. For the EEA data, an average of the 2010-2013 values were used (for 2010-2012 the final data were used, while for 2013 EEA data was provisional) (European Environment Agency, 2014)
No uptake
Same total uptake % as for personal transport, but over 9 years to reflect different model lifecycles
Bundle 2
Day 1, V2I, mainly applicable to motorways
Use EEA data for uptake in MSs, to reach all Upper Medium and Executive cars by 2027, starting 2020
No uptake
Bundle 3(b) Day 1, GLOSA
Use EEA data for uptake in MSs, to reach all Upper Medium and Executive cars by 2027, starting 2020
No uptake
Scenarios
Bundle 1 Day 1, V2V, ITS-G5
Use EEA data for uptake in MSs, to reach all Upper Medium and Executive cars by 2023, starting 2018, all Lower Medium (C-segment) cars by 2024, starting 2019, and all Small (A- and B-segment) cars by 2025, starting 2020
All vehicles covered by 2027, starting 2020
All vehicles covered by 2023, starting 2018
Bundle 2
Day 1, V2I, mainly applicable to motorways
Use EEA data for uptake in MSs, to reach all Upper Medium and Executive cars by 2023 (assuming they all have infotainment systems), starting 2018, 50% of Lower Medium cars by 2024 (i.e. 50% of cars have infotainment systems), starting in 2019, 12.5% of Small cars by 2025 (i.e. 12.5% of cars have infotainment systems), starting 2020
No uptake 50% of vehicles covered by 2023, starting 2018

Study on the Deployment of C-ITS in Europe: Final Report | 119
Ricardo in Confidence Ref: Ricardo/ED60721/Issue Number 1
Ricardo Energy & Environment
Scenario Vehicle type Description Personal transport Public transport Freight
Bundle 3
Day 1, V2I, mainly applicable to urban areas
Use EEA data for uptake in MSs, to reach all Upper Medium and Executive cars by 2023, starting 2018, all Lower Medium cars by 2024, starting 2019, and all Small cars by 2025, starting 2020
All vehicles covered by 2027, starting 2020
All vehicles covered by 2023, starting 2018
Bundle 4 Day 1.5, V2I, Parking Information
Use EEA data for uptake in MSs, to reach all Upper Medium and Executive cars by 2023 (assuming they all have infotainment systems), starting 2018, 50% of Lower Medium cars by 2024 (i.e. 50% of cars have infotainment systems), starting in 2019, 12.5% of Small cars by 2025 (i.e. 12.5% of cars have infotainment systems), starting 2020
No uptake No uptake
Bundle 5
Day 1.5, V2I, Traffic and other information
Use EEA data for uptake in MSs, to reach all Upper Medium and Executive cars by 2023 (assuming they all have infotainment systems), starting 2018, 50% of Lower Medium cars by 2024 (i.e. 50% of cars have infotainment systems), starting in 2019, 12.5% of Small cars by 2025 (i.e. 12.5% of cars have infotainment systems), starting 2020
No uptake 50% of vehicles covered by 2023, starting 2018
Bundle 6
Day 1.5, Freight specific services
No uptake No uptake 50% of vehicles covered by 2023, starting 2018
Bundle 7
Day 1.5, V2X (mainly applicable to urban areas), likely to be ITS-G5
Use EEA data for uptake in MSs, to reach all Upper Medium and Executive cars by 2028, starting 2025, all Lower Medium cars by 2029, starting 2026, and all Small cars by 2030, starting 2027
All vehicles covered by 2030, starting 2025
All vehicles covered by 2030, starting 2025
Bundle 8
Day 1.5, V2V, likely to be ITS-G5
Bundle 9 Day 1.5, V2I
Key assumptions:
The baseline scenario includes only Bundles 1, 2 and 3 for luxury (i.e. segment D and E) vehicles
A proportion of freight vehicles is expected to receive only Bundle 1 in the baseline (same % overall as for passenger cars)
Bundles 1 and 3 are assumed to be deployed alongside ITS-G5 deployments in vehicles, which are expected to occur across vehicle lifecycles, staggered by vehicle segment

Study on the Deployment of C-ITS in Europe: Final Report | 120
Ricardo in Confidence Ref: Ricardo/ED60721/Issue Number 1
Ricardo Energy & Environment
Bundles 2, 4 and 5 are assumed to be deployed only in vehicles with infotainment systems, due to the requirement to effectively display the information, deployment is expected to occur across vehicle lifecycles, staggered by vehicle segment
Day 1.5 services (Bundles 7, 8 and 9, all requiring ITS-G5) are deployed to all vehicles over a relatively short timeframe
All buses receive only basic V2V safety services (Bundle 1 and Bundles 7-9 later on) and traffic signal prioritisation (Bundle 3) in the scenarios
All freight vehicles are assumed to receive Bundles 1 and 3 (ITS-G5 safety-based), with 50% of vehicles also receiving the remaining V2I Bundles 2, 4 and 6

Study on the Deployment of C-ITS in Europe: Final Report | 121
Ricardo in Confidence Ref: Ricardo/ED60721/Issue Number 1
Ricardo Energy & Environment
Table 11-2. Deployment assumptions for in-vehicle ITS sub-systems for new vehicles – central and high sensitivities
Scenario Vehicle type Description Personal transport Public transport Freight
Baseline
Bundle 1 Day 1, V2V, ITS-G5
Use EEA data for uptake in MSs, to reach all Upper Medium and Executive cars by 2027, starting 2020
No uptake
Same total uptake % as for personal transport, but over 9 years to reflect different model lifecycles
Bundle 2 Day 1, V2I, mainly applicable to motorways
Use EEA data for uptake in MSs, to reach all Upper Medium and Executive cars by 2027, starting 2020
No uptake
Bundle 3(b) Day 1, GLOSA Use EEA data for uptake in MSs, to reach all Upper Medium and Executive cars by 2027, starting 2020
No uptake
Scenarios
Bundle 1 Day 1, V2V, ITS-G5
Use EEA data for uptake in MSs, to reach all Upper Medium and Executive cars by 2021, starting 2018, all Lower Medium cars by 2022, starting 2019, and all Small cars by 2023, starting 2020
All vehicles covered by 2027, starting 2020
All vehicles covered by 2021, starting 2018
Bundle 2 Day 1, V2I, mainly applicable to motorways
Use EEA data for uptake in MSs, to reach all Upper Medium and Executive cars by 2021 (assuming they all have infotainment systems), starting 2018, 50% of Lower Medium cars by 2022 (i.e. 50% of cars have infotainment systems), starting in 2019, 12.5% of Small cars by 2023 (i.e. 12.5% of cars have infotainment systems), starting 2020
No uptake 50% of vehicles covered by 2021, starting 2018
Bundle 3 Day 1, V2I, mainly applicable to urban areas
Use EEA data for uptake in MSs, to reach all Upper Medium and Executive cars by 2021, starting 2018, all Lower Medium cars by 2022, starting 2019, and all Small cars by 2023, starting 2020
All vehicles covered by 2027, starting 2020
All vehicles covered by 2021, starting 2018
Bundle 4 Day 1.5, V2I, Parking Information
Use EEA data for uptake in MSs, to reach all Upper Medium and Executive cars by 2021 (assuming they all have infotainment systems), starting 2018, 50% of Lower Medium cars by 2022 (i.e. 50% of cars have infotainment systems), starting in 2019, 12.5% of Small cars by 2023 (i.e. 12.5% of cars have infotainment systems), starting 2020
No uptake No uptake

Study on the Deployment of C-ITS in Europe: Final Report | 122
Ricardo in Confidence Ref: Ricardo/ED60721/Issue Number 1
Ricardo Energy & Environment
Bundle 5 Day 1.5, V2I, Traffic and other information
Use EEA data for uptake in MSs, to reach all Upper Medium and Executive cars by 2021 (assuming they all have infotainment systems), starting 2018, 50% of Lower Medium cars by 2022 (i.e. 50% of cars have infotainment systems), starting in 2019, 12.5% of Small cars by 2023 (i.e. 12.5% of cars have infotainment systems), starting 2020
No uptake 50% of vehicles covered by 2021, starting 2018
Bundle 6 Day 1.5, Freight specific services
No uptake No uptake 50% of vehicles covered by 2021, starting 2018
Bundle 7
Day 1.5, V2X (mainly applicable to urban areas), likely to be ITS-G5
Use EEA data for uptake in MSs, to reach all Upper Medium and Executive cars by 2027, starting 2025, all Lower Medium cars by 2028, starting 2026, and all Small cars by 2029, starting 2027
All vehicles covered by 2028, starting 2025
All vehicles covered by 2028, starting 2025
Bundle 8 Day 1.5, V2V, likely to be ITS-G5
Bundle 9 Day 1.5, V2I
Key assumptions:
The baseline scenario includes only Bundles 1, 2 and 3 for luxury (i.e. segment D and E) vehicles
A proportion of freight vehicles is expected to receive only Bundle 1 in the baseline (same % overall as for passenger cars)
Bundles 1 and 3 are assumed to be deployed alongside ITS-G5 deployments in vehicles, which are expected to occur across vehicle lifecycles, staggered by vehicle segment
Bundles 2, 4 and 5 are assumed to be deployed only in vehicles with infotainment systems, due to the requirement to effectively display the information, deployment is expected to occur across vehicle lifecycles, staggered by vehicle segment
Day 1.5 services (Bundles 7, 8 and 9, all requiring ITS-G5) are deployed to all vehicles over a relatively short timeframe
All buses receive only basic V2V safety services (Bundle 1 and Bundles 7-9 later on) and traffic signal prioritisation (Bundle 3) in the scenarios
All freight vehicles are assumed to receive Bundles 1 and 3 (ITS-G5 safety-based), with 50% of vehicles also receiving the remaining V2I Bundles 2, 4 and 6

Study on the Deployment of C-ITS in Europe: Final Report | 123
Ricardo in Confidence Ref: Ricardo/ED60721/Issue Number 1
Ricardo Energy & Environment
11.3 Uptake of C-ITS services in aftermarket systems
Table 11-3. Deployment assumptions for aftermarket ITS sub-systems for existing vehicles not already fitted with ITS sub-systems – low sensitivity
Scenario Vehicle type Description Personal transport Public transport Freight
Baseline
Bundle 1 Day 1, V2V, ITS-G5
No uptake as requires ITS-G5
No uptake
No uptake
Bundle 2 Day 1, V2I, mainly applicable to motorways
25% of all vehicles that can be fitted with an aftermarket device receive this service by 2030, starting 2020
25% of all HGVs that can be fitted with an aftermarket device receive this service by 2030, starting 2020
Bundle 3(b) Day 1, GLOSA No uptake as requires ITS-G5 No uptake
Scenarios
Bundle 1 Day 1, V2V, ITS-G5
No uptake as requires ITS-G5 No uptake No uptake as requires ITS-G5
Bundle 2 Day 1, V2I, mainly applicable to motorways
50% of all vehicles that can be fitted with an aftermarket device receive this service by 2030, starting 2020
No uptake
50% of all freight vehicles that can be fitted with an aftermarket device receive this service by 2030, starting 2020
Bundle 3 Day 1, V2I, mainly applicable to urban areas
No uptake as requires ITS-G5
50% of all vehicles that can be fitted with an aftermarket device receive this service by 2030, starting 2020
No uptake as requires ITS-G5
Bundle 4 Day 1.5, V2I, Parking Information
50% of all vehicles that can be fitted with an aftermarket device receive this service by 2030, starting 2020
No uptake No uptake
Bundle 5 Day 1.5, V2I, Traffic and other information
50% of all vehicles that can be fitted with an aftermarket device receive this service by 2030, starting 2020
No uptake
50% of all freight vehicles that can be fitted with an aftermarket device receive this service by 2030, starting 2020
Bundle 6 Day 1.5, Freight specific services
No uptake No uptake
50% of all freight vehicles that can be fitted with an aftermarket device receive this service by 2030, starting 2020
Bundle 7
Day 1.5, V2X (mainly applicable to urban areas), likely to be ITS-G5 No uptake as requires ITS-G5 No uptake as requires ITS-G5 No uptake as requires ITS-G5
Bundle 8 Day 1.5, V2V, likely to be ITS-G5
Bundle 9 Day 1.5, V2I

Study on the Deployment of C-ITS in Europe: Final Report | 124
Ricardo in Confidence Ref: Ricardo/ED60721/Issue Number 1
Ricardo Energy & Environment
Key assumptions:
Aftermarket devices are focussed on offering V2I services only. They are assumed to not have V2V capability, due to the need for many of these services to be connected to the CAN bus of the vehicle
All aftermarket devices operate using a cellular network connection and do not have ITS-G5 capability
Aftermarket devices are likely to involve a combination of Personal Navigation Devices (PNDs) and smartphone-based apps. A top-down approach is used to estimate penetration rates, calibrated using a bottom-up analysis of device uptake rates
Buses receive only traffic signal prioritisation as an aftermarket device, as part of Bundle 3 (they are the only vehicle type to be offered a ITS-G5 based service through the aftermarket)
Some uptake of Bundle 2 services only occurs via the aftermarket in the baseline (25%)
Bundles 2, 4, 5 and 6 (all V2I services) are offered in the scenarios
Similar uptake rates are used for freight and passenger cars, although it is expected that the devices themselves and the business models for their inclusion will be different

Study on the Deployment of C-ITS in Europe: Final Report | 125
Ricardo in Confidence Ref: Ricardo/ED60721/Issue Number 1
Ricardo Energy & Environment
Table 11-4. Deployment assumptions for aftermarket ITS sub-systems for existing vehicles not already fitted with ITS sub-systems – central and high sensitivities
Scenario Vehicle type Description Personal transport Public transport Freight
Baseline
Bundle 1 Day 1, V2V, ITS-G5 No uptake as requires ITS-G5
No uptake
No uptake
Bundle 2 Day 1, V2I, mainly applicable to motorways
25% of all vehicles that can be fitted with an aftermarket device receive this service by 2030, starting 2020
25% of all HGVs that can be fitted with an aftermarket device receive this service by 2030, starting 2020
Bundle 3(b) Day 1, GLOSA No uptake as requires ITS-G5 No uptake
Scenarios
Bundle 1 Day 1, V2V, ITS-G5 No uptake as requires ITS-G5 No uptake No uptake as requires ITS-G5
Bundle 2 Day 1, V2I, mainly applicable to motorways
50% of all vehicles that can be fitted with an aftermarket device receive this service by 2026, starting 2020
No uptake
50% of all freight vehicles that can be fitted with an aftermarket device receive this service by 2026, starting 2020
Bundle 3 Day 1, V2I, mainly applicable to urban areas
No uptake as requires ITS-G5
50% of all vehicles that can be fitted with an aftermarket device receive this service by 2026, starting 2020
No uptake as requires ITS-G5
Bundle 4 Day 1.5, V2I, Parking Information
50% of all vehicles that can be fitted with an aftermarket device receive this service by 2026, starting 2020
No uptake No uptake
Bundle 5 Day 1.5, V2I, Traffic and other information
50% of all vehicles that can be fitted with an aftermarket device receive this service by 2026, starting 2020
No uptake
50% of all freight vehicles that can be fitted with an aftermarket device receive this service by 2026, starting 2020
Bundle 6 Day 1.5, Freight specific services
No uptake No uptake
50% of all freight vehicles that can be fitted with an aftermarket device receive this service by 2026, starting 2020
Bundle 7
Day 1.5, V2X (mainly applicable to urban areas), likely to be ITS-G5 No uptake as requires ITS-G5 No uptake as requires ITS-G5 No uptake as requires ITS-G5
Bundle 8 Day 1.5, V2V, likely to be ITS-G5
Bundle 9 Day 1.5, V2I

Study on the Deployment of C-ITS in Europe: Final Report | 126
Ricardo in Confidence Ref: Ricardo/ED60721/Issue Number 1
Ricardo Energy & Environment
Key assumptions:
Aftermarket devices are focussed on offering V2I services only. They are assumed to not have V2V capability, due to the need for many of these services to be connected to the CAN bus of the vehicle
All aftermarket devices operate using a cellular network connection and do not have ITS-G5 capability
Aftermarket devices are likely to involve a combination of Personal Navigation Devices (PNDs) and smartphone-based apps. A top-down approach is used to estimate penetration rates, calibrated using a bottom-up analysis of device uptake rates
Buses receive only traffic signal prioritisation as an aftermarket device, as part of Bundle 3 (they are the only vehicle type to be offered a ITS-G5 based service through the aftermarket)
Some uptake of Bundle 2 services only occurs via the aftermarket in the baseline (25%)
Bundles 2, 4, 5 and 6 (all V2I services) are offered in the scenarios
Similar uptake rates are used for freight and passenger cars, although it is expected that the devices themselves and the business models for their inclusion will be different

Study on the Deployment of C-ITS in Europe: Final Report | 127
Ricardo in Confidence Ref: Ricardo/ED60721/Issue Number 1
Ricardo Energy & Environment
11.4 Uptake of C-ITS services in infrastructure
Table 11-5. Deployment assumptions for roadside and cellular ITS sub-systems – low sensitivity
Scenario Road type Infrastructure penetration
Baseline
TEN-T Corridor
Use actual data based on average deployment levels to-date in each country grouping to estimate penetration by 2020. Assume constant to 2030
TEN-T Core
TEN-T Comprehensive
Non-Urban Non-Motorway
Urban 8% x 25% per year from 2020
Scenarios
TEN-T Corridor 100% by 2030, starting 2020
TEN-T Core 50% by 2030, starting 2020
TEN-T Comprehensive
20% by 2030, starting 2020
Non-Urban Non-Motorway
No uptake
Urban 8% x 50% per year from 2020-25, then 8% per year from 2025
Key assumptions:
The baseline includes no further installation of roadside units beyond that resulting for existing or planned projects to 2020 (although this level of deployment is maintained to 2030)
In urban areas, it is assumed that 25% of new traffic lights are equipped with ITS-G5 transmitters in the baseline beyond 2020, with an average lifetime for traffic lights assumed at 12.5 years
Activity is expected to be focused on TEN-T corridors in the deployment scenarios, with diminishing activity for smaller roads
Urban infrastructure deployment in the scenarios is based on a 12.5 year traffic light lifetime, 50% of devices are fitted with ITS-G5 capability between 2020-25, 100% thereafter
The above assumptions are for front runner countries. Other country groupings are scaled based on their relative baseline infrastructure coverage rates

Study on the Deployment of C-ITS in Europe: Final Report | 128
Ricardo in Confidence Ref: Ricardo/ED60721/Issue Number 1
Ricardo Energy & Environment
Table 11-6. Deployment assumptions for roadside and cellular ITS sub-systems – central sensitivity
Scenario Road type Infrastructure penetration
Baseline
TEN-T Corridor
Use actual data based on average deployment levels to-date in each country grouping to estimate penetration by 2020. Assume constant to 2030
TEN-T Core
TEN-T Comprehensive
Non-Urban Non-Motorway
Urban 8% x 25% per year from 2020
Scenarios
TEN-T Corridor 100% by 2026, starting 2020
TEN-T Core 100% by 2026, starting 2020
TEN-T Comprehensive
50% by 2026, starting 2020
Non-Urban Non-Motorway
20% by 2026, starting 2020
Urban 0-20% from 2020-23, then rises to 60% from 2024-2026
Key assumptions:
The baseline includes no further installation of roadside units beyond that resulting for existing or planned projects to 2020 (although this level of deployment is maintained to 2030)
In urban areas, it is assumed that 25% of new traffic lights are equipped with ITS-G5 transmitters in the baseline beyond 2020, with an average lifetime for traffic lights assumed at 12.5 years
Activity is expected to be focused on TEN-T corridors in the deployment scenarios, with diminishing activity for smaller roads
Urban infrastructure deployment in the scenarios is based on a shorter 7.5 year traffic light lifetime, with 50% of devices fitted with ITS-G5 capability between 2020-23, and 100% from 2024-2026
The above assumptions are for front runner countries. Other country groupings are scaled based on their relative baseline infrastructure coverage rates

Study on the Deployment of C-ITS in Europe: Final Report | 129
Ricardo in Confidence Ref: Ricardo/ED60721/Issue Number 1
Ricardo Energy & Environment
Table 11-7. Deployment assumptions for roadside and cellular ITS sub-systems – high sensitivity
Scenario Road type Infrastructure penetration
Baseline
TEN-T Corridor
Use actual data based on average deployment levels to-date in each country grouping to estimate penetration by 2020. Assume constant to 2030
TEN-T Core
TEN-T Comprehensive
Non-Urban Non-Motorway
Urban 8% x 25% per year from 2020
Scenarios
TEN-T Corridor
Assume coverage in line with national cellular coverage expectations
TEN-T Core
TEN-T Comprehensive
Non-Urban Non-Motorway
Urban 0-40% from 2020-2023, then rises to 80% from 2024-2026
Key assumptions:
The baseline includes no further installation of roadside units beyond that resulting for existing or planned projects to 2020 (although this level of deployment is maintained to 2030)
In urban areas, it is assumed that 25% of new traffic lights are equipped with ITS-G5 transmitters in the baseline beyond 2020, with an average lifetime for traffic lights assumed at 12.5 years
In the scenarios, infrastructure coverage for non-urban roads is expected to be in line with coverage of cellular networks, i.e. c. 97% from day 1
Urban infrastructure deployment in the scenarios is based on a shorter 7.5 year traffic light lifetime, with 100% of devices fitted with ITS-G5 capability between 2020-26
The above assumptions are for front runner countries. Other country groupings are scaled based on their relative baseline infrastructure coverage rates

Study on the Deployment of C-ITS in Europe: Final Report | 130
Ricardo in Confidence Ref: Ricardo/ED60721/Issue Number 1
Ricardo Energy & Environment
12 Annex F: C-ITS service impact data
12.1 Introduction
This section describes the C-ITS service impacts data used in the CBA. These are the impacts of C-ITS services on individual vehicles when installed across different vehicle and road types. Wherever possible impacts data were defined separately for the three vehicle types modelled in the CBA, i.e. passenger cars, freight vehicles and buses, and for the five principal road types modelled, i.e. TEN-T corridor, core TEN-T, TEN-T comprehensive, non-motorway-non-urban roads and urban roads. Where disaggregated data was not available, impacts were assumed to be constant across different vehicle and road categories.
Impacts can be in terms of fuel consumption, CO2 emissions, polluting emissions, or accident rates.
Individual impacts are combined with C-ITS deployment scenario service bundle uptake and penetration rates in the ASTRA/TRUST modelling environments to estimate the total EU-level impact of services for each deployment scenario.
The EU-level impacts can be converted to monetary benefits through using typical values for the external cost of transport from the Handbook on External Costs of Transport (Ricardo-AEA et al., 2014).
12.1.1 C-ITS service impact data overview
12.1.1.1 Impact data collected
For each C-ITS service included in the C-ITS deployment scenarios, data related to the following parameters was collected:
1. Traffic efficiency i.e. the percentage change in average speed for a vehicle equipped with C-ITS services.
2. Fuel consumption i.e. the percentage change in fuel consumption for a vehicle equipped with C-ITS services.
3. Polluting emissions i.e. the percentage change in NOx, CO, VOC and PM emissions for a vehicle equipped with C-ITS services
4. Safety i.e. the percentage change in accident rates (classified by fatalities, serious injuries, light injuries and material damages) for a vehicle equipped with C-ITS services.
The data collected for each C-ITS service is discussed in turn in this document, which is divided into three key sections as follows:
Section 1: this section provides an introduction to the data collection task, summarises the key objectives and assumptions, and lists the main data sources.
Section 2: this section discusses the impact data collected for each C-ITS service.
Section 3: this section discusses C-ITS service overlap and how this was accounted for in the modelling.
Section 4: this section includes a full list of data sources used in the C-ITS service impacts data collection.
In addition, an Excel document accompanying this report summarises all impacts data inputted into the modelling.
12.1.1.2 Impacts categorisation
C-ITS services can have varying impacts depending on the road type and vehicle type in which they are deployed. Furthermore, some services are not applicable to some road or vehicles types. Where available, impact data was therefore collected for the road and vehicle types modelled in the deployment scenarios.
The categories of roads modelled in the deployment scenarios are as follows:
TEN-T Corridors
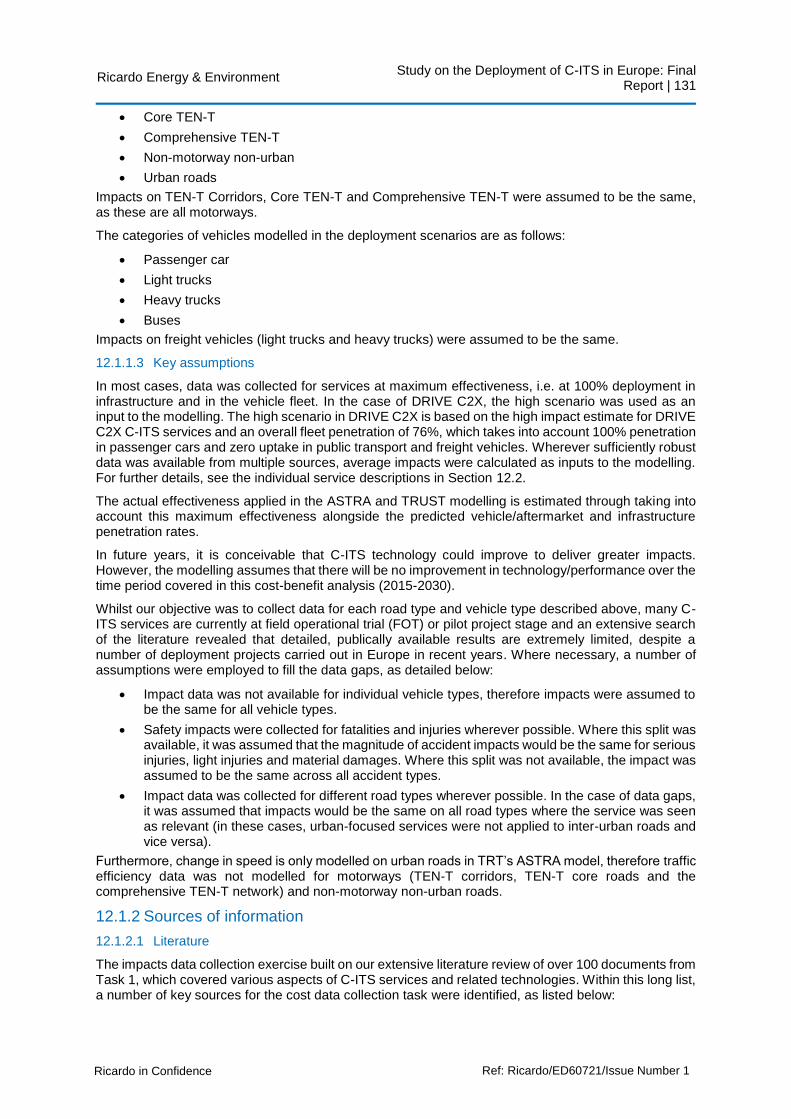
Study on the Deployment of C-ITS in Europe: Final Report | 131
Ricardo in Confidence Ref: Ricardo/ED60721/Issue Number 1
Ricardo Energy & Environment
Core TEN-T
Comprehensive TEN-T
Non-motorway non-urban
Urban roads
Impacts on TEN-T Corridors, Core TEN-T and Comprehensive TEN-T were assumed to be the same, as these are all motorways.
The categories of vehicles modelled in the deployment scenarios are as follows:
Passenger car
Light trucks
Heavy trucks
Buses
Impacts on freight vehicles (light trucks and heavy trucks) were assumed to be the same.
12.1.1.3 Key assumptions
In most cases, data was collected for services at maximum effectiveness, i.e. at 100% deployment in infrastructure and in the vehicle fleet. In the case of DRIVE C2X, the high scenario was used as an input to the modelling. The high scenario in DRIVE C2X is based on the high impact estimate for DRIVE C2X C-ITS services and an overall fleet penetration of 76%, which takes into account 100% penetration in passenger cars and zero uptake in public transport and freight vehicles. Wherever sufficiently robust data was available from multiple sources, average impacts were calculated as inputs to the modelling. For further details, see the individual service descriptions in Section 12.2.
The actual effectiveness applied in the ASTRA and TRUST modelling is estimated through taking into account this maximum effectiveness alongside the predicted vehicle/aftermarket and infrastructure penetration rates.
In future years, it is conceivable that C-ITS technology could improve to deliver greater impacts. However, the modelling assumes that there will be no improvement in technology/performance over the time period covered in this cost-benefit analysis (2015-2030).
Whilst our objective was to collect data for each road type and vehicle type described above, many C-ITS services are currently at field operational trial (FOT) or pilot project stage and an extensive search of the literature revealed that detailed, publically available results are extremely limited, despite a number of deployment projects carried out in Europe in recent years. Where necessary, a number of assumptions were employed to fill the data gaps, as detailed below:
Impact data was not available for individual vehicle types, therefore impacts were assumed to be the same for all vehicle types.
Safety impacts were collected for fatalities and injuries wherever possible. Where this split was available, it was assumed that the magnitude of accident impacts would be the same for serious injuries, light injuries and material damages. Where this split was not available, the impact was assumed to be the same across all accident types.
Impact data was collected for different road types wherever possible. In the case of data gaps, it was assumed that impacts would be the same on all road types where the service was seen as relevant (in these cases, urban-focused services were not applied to inter-urban roads and vice versa).
Furthermore, change in speed is only modelled on urban roads in TRT’s ASTRA model, therefore traffic efficiency data was not modelled for motorways (TEN-T corridors, TEN-T core roads and the comprehensive TEN-T network) and non-motorway non-urban roads.
12.1.2 Sources of information
12.1.2.1 Literature
The impacts data collection exercise built on our extensive literature review of over 100 documents from Task 1, which covered various aspects of C-ITS services and related technologies. Within this long list, a number of key sources for the cost data collection task were identified, as listed below:

Study on the Deployment of C-ITS in Europe: Final Report | 132
Ricardo in Confidence Ref: Ricardo/ED60721/Issue Number 1
Ricardo Energy & Environment
013 - DRIVE C2X Deliverable D11.4. Impact Assessment and User Perception of Cooperative Systems.
113 - EasyWay Business case and benefit-cost assessment of EasyWay priority cooperative services
017 - eIMPACT Socio-economic Impact Assessment of Stand-alone and Co-operative Intelligent Vehicle Safety Systems (IVSS) in Europe. Deliverable D4. Impact assessment of Intelligent Vehicle Safety Systems.
046 - SAFESPOT Deliverable SP6 – BLADE – Business models, Legal Aspects, and DEployment
040 - CODIA Deliverable 5 – Final study report
045 - eSafetyForum Intelligent Infrastructure Working Group – Final Report
124 – TNO Impact of Information and Communication Technologies on Energy Efficiency in Road Transport – Final Report
004 – COMeSafety2 D2.3 Cost Benefits Analysis & Business Model Elements for Deployment
iMobility Effects database
The most commonly used data sources are described in more detail in a series of boxes when they are first referenced throughout this document.
Where C-ITS service impact data was not directly available from literature, a number of approaches were used to fill the data gaps, including:
Identifying impacts from other non-C-ITS services or technologies which are expected to operate through a similar mechanism to specific C-ITS services, for example ‘lane change assist’ as one component of the Day 1.5 service Cooperative Collision Risk Warning.
Estimating impacts from first principles based on, for example using known accident data linked to specific accident types targeted by certain C-ITS services to estimate the impact of a specific C-ITS service on accident rates.
The detailed assumptions used for each C-ITS service are listed under each service heading in Section 2.
12.1.2.2 Expert input
In addition to the desk-based data collection, various draft impacts data points were discussed with individual experts from within and outside of WG1 over the course of July-September 2015. For example, where data was inconsistent between studies or where gaps remained from the literature review, a number of industry experts (mainly from within WG1) were contacted either unilaterally or in groups (via email or by teleconference) as part of Task 8 (cross cutting stakeholder engagement task). Ricardo Energy & Environment invited industry experts to:
Comment on the impact data collected
Suggest further sources of information
Provide impact data where sufficient evidence was not available in the literature
This resulted in a number of revisions to the impacts data included in this document.

Study on the Deployment of C-ITS in Europe: Final Report | 133
Ricardo in Confidence Ref: Ricardo/ED60721/Issue Number 1
Ricardo Energy & Environment
12.2 Input data for services
12.2.1 Emergency electronic brake light (EBL)
12.2.1.1 Service overview
The emergency electronic brake light is a service aimed at preventing rear end collisions by informing drivers of hard braking by vehicles ahead. Using this information, drivers will be better prepared for slow traffic ahead and will be able to adjust their speed accordingly.
12.2.1.2 Technical information
Day 1 vehicle-to-vehicle (V2V) service, likely based on ITS-G5 communication
Bundle 1
In response to a vehicle suddenly braking, a message is sent to following vehicles to warn drivers of an abrupt decrease in traffic speed ahead. Emergency electronic brake lights are displayed in the following vehicles, giving drivers the opportunity to adjust their speed to avoid a potential collision. This service is applicable on all road and vehicle types, although it is envisaged to be particularly useful on congested, high speed roads, or in areas where visibility is poor. In this situation, following vehicles may not be able to see the brake lights of all vehicles ahead of them and would therefore have very limited time to react to hard braking without the service. This service predominantly relies on V2V ITS-G5 communication, although a number of projects are looking to demonstrate its effectiveness using high-speed (e.g. 4G/5G) cellular networks.
12.2.1.3 Impact data
The main data source for the impacts of the emergency electronic brake light was from FOTs in the DRIVE C2X project (TNO et al., 2014). An overview of the general methodology is provided in Box 2. This service was only tested in Germany, in partnership with the simTD project (simTD, 2013). A US DoT cost-benefit analysis report was also used as a comparison (John A. Volpe National Transportation Systems Center, 2008).
Box 2: Overview of key data source – DRIVE C2X project
The DRIVE C2X project used log data resulting from Field Operational Tests (FOTs) carried out on several test sites in different EU countries (Finland, France, Germany, Italy, the Netherlands, Spain, and Sweden).
The study aimed to harmonise the testing conditions as far as possible, in order to allow the data across the pilot sites to be combined. Nevertheless, several aspects differed significantly from one test site to others. These differences can be explained by cultural, country specific aspects as well as acquisition related influences (private drivers vs. employees).
The FOTs focused on functions that provide information or warnings to drivers. This means that the impact is dependent on whether and how the driver responds. Thus, the impact assessment first aimed to measure driver behaviour in order to provide input data for an impact assessment in four target areas: safety, efficiency, mobility, and environment.
Driver behaviour data was collected in two main ways: controlled tests” (CTs) and naturalistic driving (ND). In CT, drivers were called into the test and followed the driving instructions provided by the Test-Site Instructor, allowing the driver to encounter specific test situations. In the ND approach, drivers were monitored in their daily driving. Data on driver behaviour was then pooled across the test sites and used as input for the assessment of impacts.
Safety impacts were calculated by making use of the results of the field tests regarding driver behaviour, expert assessment and previous expert assessments found in the literature. Traffic efficiency and environmental impact assessment made use of simulation models. The mobility impact assessment in DRIVE C2X was based on the mobility model developed in TeleFOT project, The mobility assessment data consisted of user interviews (questionnaires and focus groups) based on experience in real traffic.. The scaling up of the effects to the EU-level made use of external data.
Source: (TNO et al., 2014)

Study on the Deployment of C-ITS in Europe: Final Report | 134
Ricardo in Confidence Ref: Ricardo/ED60721/Issue Number 1
Ricardo Energy & Environment
Other studies that considered the impacts include the eIMPACT project (TNO, VTT, Movea, PTV, BASt, 2008) and a cost-benefit analysis performed for the U.S. Department of Transport (John A. Volpe National Transportation Systems Center, 2008). We have chosen to prioritise the DRIVE C2X data ahead of these source as it was published in 2014 (compared to 2008 for the other sources), is based on FOT data and its primary focus is on the EU, compared to the US DoT study.
12.2.1.3.1 Traffic efficiency
The primary effect of emergency electronic brake light is intended to be on safety, hence the traffic efficiency impacts are expected to be minimal. No traffic efficiency effects are therefore anticipated on an EU level as a consequence of this service and it is not included as part of the model. This is confirmed by the DRIVE C2X study, which did not consider traffic efficiency effects for this service.
12.2.1.3.2 Fuel consumption and CO2
The primary effect of emergency electronic brake light is intended to be on safety, hence the fuel efficiency impacts are expected to be minimal. No fuel efficiency benefits are therefore anticipated on an EU level as a consequence of this service and it is not included as part of the model. This is confirmed by the DRIVE C2X study, which did not consider the effect on fuel consumption for this service.
12.2.1.3.3 Environmental and emissions impacts
The primary effect of emergency electronic brake light is intended to be on safety, hence the emissions impacts are expected to be minimal. No effects on emissions are therefore anticipated on an EU level as a consequence of this service and it is not included as part of the model. This is confirmed by the DRIVE C2X study, which did not consider the effect on polluting emissions for this service.
12.2.1.3.4 Safety
The primary objective of this service is to prevent rear end collisions, although other types of accident may also be prevented. Specifically, this service is thought to reduce the number of panic manoeuvres performed by vehicles, due to the early warning. This service can act via two mechanisms (TNO et al., 2014):
Direct in-vehicle modification of the driver task – the driver behind the braking vehicle has more time to react to the braking vehicle ahead.
Modification of interaction between vehicles – following drivers (with or without emergency brake light capability) will also have more time to react to the braking vehicle ahead.
In the DRIVE C2X study, impacts were assessed separately for: a) motorways and high speed rural roads (with a speed limit of at least 80 km/hour) and b) urban roads and low speed rural roads. The assumptions made in the DRIVE C2X study in scaling up these impacts are detailed below (TNO et al., 2014).
Rear-end collisions prevented via direct in-vehicle modification of the driving task:
60-80% of fatalities and injuries on rural roads occur on high speed rural roads, whilst all fatalities and injuries on motorways are considered to be high-speed (>80km/h).
It is assumed that 50-70% of rear end collisions occurring on motorways and high speed rural roads could be influenced by the emergency brake light service.
o 20-30% of these fatalities and injuries could be prevented by the emergency electronic brake light.
It is assumed that 10-25% of rear end collisions occurring on urban roads and low speed rural roads (the remaining 20-40% of rural roads) could be influenced by the emergency brake light service.
o 30-40% of these fatalities and injuries could be prevented by the emergency electronic brake light.
Other collision types (other than rear-end) prevented via direct in-vehicle modification of the driving task:
Magnitude of the safety benefit was estimated to be 5-10% of the impact for rear collisions (as described above) per accident type.

Study on the Deployment of C-ITS in Europe: Final Report | 135
Ricardo in Confidence Ref: Ricardo/ED60721/Issue Number 1
Ricardo Energy & Environment
Rear-end collisions prevented via modification of interaction between road users:
When a driver reacts to hard braking ahead, following vehicles will also have increased time to react.
o On motorways and high speed rural roads, a 0.10-0.15% reduction in fatalities is expected.
o On motorways and high speed rural roads, a 0.02-0.03% reduction in injuries is expected.
o On urban roads and low speed rural roads, a 0.15-0.30% reduction in fatalities is expected.
o On urban roads and low speed rural roads, a 0.10-0.20% reduction in injuries is expected.
The relatively low effectiveness of this service for interactions between road users is due to the high element of surprise and very small time margins involved in these types of crashes.
Overall for the EU-28, the DRIVE C2X study calculated a decrease in fatalities between 25 and 304 in 2030 and a decrease in injuries between 1,322 and 16,219 in 2030.
The DRIVE C2X high penetration scenario was used as an input to the model, which corresponds to a 2.7% decrease in fatalities and a 2.5% decrease in injuries.
The US DoT also assessed the potential safety impact of this service in 2030 as part of a cost-benefit analysis and calculated a 0.88% decrease in annual light vehicle crashes, which is a significantly lower figure than DRIVE C2X (John A. Volpe National Transportation Systems Center, 2008). The discrepancy is likely to be due to the differences in road and driving characteristics in the USA and EU and higher traffic density on European roads.
12.2.1.3.5 Other impacts
As part of DRIVE C2X, user acceptance tests were not carried out for the emergency brake light functionality. The simTD project reported that driver behaviour was not significantly affected by the emergency brake light, however recommends further studies to support this theory (Mühlbacher, 2013). The simTD project questions whether there are benefits for drivers further behind the braking vehicle and again proposes that further research should be carried out to determine the impact of this service on all vehicles in a queue.

Study on the Deployment of C-ITS in Europe: Final Report | 136
Ricardo in Confidence Ref: Ricardo/ED60721/Issue Number 1
Ricardo Energy & Environment
12.2.2 Emergency vehicle approaching (EVA)
12.2.2.1 Service overview
This service aims to give an early warning of approaching emergency vehicles, prior to the siren or light bar being audible or visible. This should allow vehicles extra time to clear the road for emergency vehicles and help to reduce the number of unsafe manoeuvres.
12.2.2.2 Technical information
Day 1 V2V service, likely based on ITS-G5 communication
Bundle 1
Approaching emergency vehicles will communicate with vehicles ahead to warn drivers to clear the road. The advance warning provided by this service will give vehicles extra time to clear the road for approaching emergency vehicles in a safe and timely manner. This service is applicable for all road and vehicle types. This service predominantly relies on V2V ITS-G5 communication, although a number of projects are looking to demonstrate its effectiveness using high-speed (e.g. 4G/5G) cellular networks.
12.2.2.3 Impact data
The main data source for the impacts of the emergency vehicle approaching service was the DRIVE C2X project (TNO et al., 2014). An overview of the general methodology is provided in Box 2. Trials of this service were carried out at test sites in Germany, Italy and Spain. Data for this service was very limited, perhaps due to the limited real world opportunities to trial this type of service. To our knowledge, there are no other publically available studies that examine the emergency vehicle approaching service specifically.
12.2.2.3.1 Traffic efficiency
The primary effect of the emergency vehicle approaching service is intended to be on safety, hence the traffic efficiency impacts are expected to be minimal. No traffic efficiency effects are therefore anticipated on an EU level as a consequence of this service and it is not included as part of the model. This is confirmed by the DRIVE C2X study, which did not consider traffic efficiency effects for this service.
12.2.2.3.2 Fuel consumption and CO2
The primary effect of the emergency vehicle approaching service is intended to be on safety, hence the fuel efficiency impacts are expected to be minimal. No fuel efficiency benefits are therefore anticipated on an EU level as a consequence of this service and it is not included as part of the model. This is confirmed by the DRIVE C2X study, which did not consider the effect on fuel consumption for this service.
12.2.2.3.3 Environmental and emissions impacts
The primary effect of the emergency vehicle approaching service is intended to be on safety, hence the emissions impacts are expected to be minimal. No effects on emissions are therefore anticipated on an EU level as a consequence of this service and it is not included as part of the model. This is confirmed by the DRIVE C2X study, which did not consider the effect on polluting emissions for this service.
12.2.2.3.4 Safety
A reduction in collisions can be expected when this service is implemented due to the increased time drivers have available to inform their driving decisions.
The DRIVE C2X study used French accident statistics to estimate the impact of the emergency vehicle approaching warning (TNO et al., 2014). These show that 0.8% of fatal accidents and 1.1% of injuries included an emergency vehicle. This does not include accidents where the emergency vehicle was not directly involved. A multiplier of 1-5 was used for these accidents, based on another study (Clawson, 1997). Of these additional accidents, it was estimated that only 1-5% would result in injuries or fatalities.
The accidents were then categorised according to whether they occurred at an intersection or on a link section of road. Here, the following assumptions were made:

Study on the Deployment of C-ITS in Europe: Final Report | 137
Ricardo in Confidence Ref: Ricardo/ED60721/Issue Number 1
Ricardo Energy & Environment
50-70% of emergency vehicle related (directly or indirectly) fatalities and injuries occur at intersections (Auerbach, 1988; Elling, 1988).
50-70% of emergency vehicle related (directly or indirectly) fatalities and injuries occurring at intersections could be prevented by the emergency vehicle approaching service.
60-80% of emergency vehicle related (directly or indirectly) fatalities and injuries occurring at links (the remaining 30-50% of total fatalities and injuries) could be prevented by the emergency vehicle approaching service. This higher figure is due to the lower complexity of the road layout and reflects the fact that it is likely to be easier for drivers to give way to emergency vehicles.
The results in the DRIVE C2X report were presented in terms of the overall impact in the EU-28 in 2030. It was estimated that 14-84 fatalities and 933-4954 injuries could be prevented (TNO et al., 2014). The high scenario in DRIVE C2X equates to a 0.8% reduction in fatalities and a 0.8% reduction in injuries.
12.2.2.3.5 Other impacts
A survey of test participants during the DRIVE C2X study revealed some interesting insights regarding this service. 92% of participants viewed the service as useful (the highest in the study), however only 41% indicated they would be willing to pay for this feature (TNO et al., 2014). On a scale of 1 to 7, the average increased feeling of safety was rated at 5.6-6.0, suggesting that this service can offer an improved driving experience.
No impact on modal shift was reported.

Study on the Deployment of C-ITS in Europe: Final Report | 138
Ricardo in Confidence Ref: Ricardo/ED60721/Issue Number 1
Ricardo Energy & Environment
12.2.3 Slow or stationary vehicle(s) warning (SSV)
12.2.3.1 Service overview
Slow or stationary vehicle(s) warning is intended to deliver safety benefits by warning approaching drivers about slow or stationary/broken down vehicle(s) ahead, which may be acting as obstacles in the road. The warning helps to prevent dangerous manoeuvres as drivers will have more time to prepare for the hazard. This service can also be referred to as car breakdown warning.
12.2.3.2 Technical information
Day 1 V2V service, likely based on ITS-G5 communication
Bundle 1
Slow or stationary vehicle(s) signal to nearby vehicles to warn approaching drivers of their presence. These messages can then be relayed to following drivers, who can consequently plan to take an alternative route, or make evasive manoeuvres, thus improving traffic fluidity, safety and delivering efficiency benefits. This service is applicable to all road and vehicle types. As for the emergency electronic brake light service, it is anticipated that this service will be especially useful for warning vehicles of the potential danger of a rear end collision when visibility is poor. This service predominantly relies on V2V ITS-G5 communication, although a number of projects are looking to demonstrate its effectiveness using high-speed (e.g. 4G/5G) cellular networks.
12.2.3.3 Impact data
The main data source for the impacts of slow or stationary vehicle(s) warning was the DRIVE C2X project (TNO et al., 2014). An overview of the general methodology is provided in Box 2. This service was tested at sites in Finland, Italy, Spain and Sweden. In DRIVE C2X, this service is evaluated alongside ‘obstacle warning’ and ‘roadworks warning’, as the services perform a similar function, act via similar mechanisms and present information to drivers in a similar manner.
The eIMPACT project (TNO et al., 2014) evaluated the impacts of a service called ‘wireless local danger warning’, which is based on V2V communication. An overview of the general methodology is provided in Box 3.The eIMPACT definition of this service includes both obstacle/stationary vehicle warning and weather warning functionality.
Box 3. Overview of key data source – eIMPACT project
The eIMPACT project assessed the socio-economic effects of Intelligent Vehicle Safety Systems (IVSS) and their impacts on safety and traffic efficiency. Results from the impact assessment (Deliverable D4) were then used to inform a cost-benefit analysis (Deliverable D6).
The results of the study were published in 2008 and calculated the potential impacts of IVSS in the years 2010 and 2020. The impact assessment was performed for low (business as usual) and high (policy incentives) scenarios for both years. For each scenario, the fleet penetration varied by service, vehicle type (passenger car or goods vehicle) and by year (2010 or 2020). In addition to the scenarios, the maximum effectiveness of each service based on 100% penetration at EU-25 level was also calculated as part of eIMPACT. Results were given for the EU-25 as a whole and are not separated by road type, or vehicle type. We have used the values based on 100% penetration as a source of data in this project.
Twelve services were evaluated, although only three were defined as having cooperative functionality:
Intersection safety - the description of this service in the eIMPACT report also includes GLOSA/TTG functionality and is not limited to signalised intersections (also provides right of way assistance and left turn assistance).
Speed alert - considers the service to have V2I functionality in 2020 but not in 2010.
Wireless local danger warning - includes weather warnings and obstacle/stationary vehicle warnings, both of which are based on V2V communication.

Study on the Deployment of C-ITS in Europe: Final Report | 139
Ricardo in Confidence Ref: Ricardo/ED60721/Issue Number 1
Ricardo Energy & Environment
Another service, pre-crash protection of vulnerable road users, was also evaluated. This is similar to the vulnerable road user protection service evaluated in this study, however in eIMPACT it was not considered to be a cooperative system and was assumed to operate by detecting vulnerable road users via sensors. The two services are likely to present information to the driver in a similar manner and safety impacts will occur via similar mechanisms, therefore we believe the data presented can be of some value.
Safety impacts were calculated by making use of expert estimations and were scaled up to EU-25 level based on current accident statistics. In addition to this, consultation with key stakeholders was an integral part of the eIMPACT project.
Sources: (TNO, VTT, Movea, PTV, BASt, 2008) (eImpact, 2008)
12.2.3.3.1 Traffic efficiency
The traffic efficiency impacts of the slow or stationary vehicle(s) service are expected to be minimal as its purpose is to improve safety, rather than prevent traffic jams (TNO et al., 2014). In addition to this, broken down, stationary, or exceptionally slow vehicles (such as tractors) on the road are relatively infrequent events, therefore effects on traffic on an EU level will be negligible. This impact is therefore not included in our model.
12.2.3.3.2 Fuel consumption and CO2
The primary effect of the slow or stationary vehicle warning is intended to be on safety, hence the fuel efficiency impacts are expected to be minimal. No fuel efficiency benefits are therefore anticipated on an EU level as a consequence of this service and it is not included as part of the model. This is confirmed by the DRIVE C2X study, which did not consider the effect on fuel consumption for this service.
12.2.3.3.3 Environmental and emissions impacts
The primary effect of the slow or stationary vehicle warning is intended to be on safety, hence the emissions impacts are expected to be minimal. No effects on emissions are therefore anticipated on an EU level as a consequence of this service and it is not included as part of the model. This is confirmed by the DRIVE C2X study, which did not consider the effect on polluting emissions for this service.
12.2.3.3.4 Safety
This service is expected to work by informing drivers of slow or stationary vehicle(s) before they would be aware of the hazard without the service and may be particularly beneficial if the hazard is in an area with low visibility. This should enable drivers to have more time to prepare and navigate safely past the slow/stationary vehicle. In the DRIVE C2X study, a decrease in speed was observed for vehicles participating in the trial.
The DRIVE C2X study used accident statistics for single vehicle accidents with an object other than a pedestrian for three road types (motorways, rural roads and urban roads) to scale up the FOT results to EU level. The following assumptions were then made to scale up the potential safety impacts:
10-20% of accidents with an object other than a pedestrian the object would be a broken down vehicle.
The effectiveness of car breakdown warning would vary depending on road type. The percentage of accidents prevented by road type is given below.
o Motorways: 70-90%
o Rural roads: 65-85%
o Urban roads: 30-50%
Using these findings, the authors presented data in terms of the number of expected injuries and fatalities prevented (TNO et al., 2014). For the year 2030, this has been estimated to be between 12-125 fatalities and 427-2794 injuries (figures assume 76% fleet penetration). The high scenario in DRIVE C2X equates to an average 1.1% decrease in fatalities and a 0.7% decrease in injuries.
The eIMPACT study also covered this service as part of the wireless location danger warning (one aspect of which is obstacle/stationary vehicle warning). In total, this service is estimated to have a 4.5% reduction in fatalities and a 2.8% reduction in injuries. This estimate assumes 100% penetration and the results are presented for EU-25 level. These values are much larger than those predicted by DRIVE

Study on the Deployment of C-ITS in Europe: Final Report | 140
Ricardo in Confidence Ref: Ricardo/ED60721/Issue Number 1
Ricardo Energy & Environment
C2X, however this is likely due to the fact that in eIMPACT, weather conditions were also considered as part of the wireless location danger warning service.
To check for agreement between the two sources, the DRIVE C2X safety impacts for slow or stationary vehicle(s) and weather warning were added together. This gave a total impact of 4.56% on fatalities and a 4.04% impact on accidents. The impact on fatalities compares well to eIMPACT data, however the combined impact on injuries for slow or stationary vehicle and weather warning predicted by DRIVE C2X is larger than that predicted by eIMPACT.
The DRIVE C2X data has been used in preference to the eIMPACT data for input into the model, as it is based on FOT data and because it provides a separate impact for slow or stationary vehicle warning, whereas eIMPACT does not.
12.2.3.3.5 Other impacts
User acceptance for the car breakdown, or slow or stationary vehicle warning was one of the highest observed during the DRIVE C2X project and was widely noted to be a very helpful feature. Drivers particularly liked the increased feeling of safety gained by reducing the surprise of encountering a slow, stationary, or broken down vehicle in the road (TNO et al., 2014).
Study on the Deployment of C-ITS in Europe: Final Report | 141
Ricardo in Confidence Ref: Ricardo/ED60721/Issue Number 1
Ricardo Energy & Environment
12.2.4 Traffic jam ahead warning (TJW)
12.2.4.1 Service overview
The Traffic Jam Ahead Warning (TJW) provides an alert to the driver on approaching the tail end of a traffic jam at speed - for example if it is hidden behind a hilltop or curve. This allows the driver time to react safety to traffic jams before they might otherwise have noticed them themselves. The primary objective is to avoid rear end collisions that are caused by traffic jams on highways.
12.2.4.2 Technical information
Day 1 V2V service, likely based on ITS-G5 communication
Bundle 1
This service is applicable for all road and vehicle types, however its main benefit is expected to be on high speed roads (TEN-T Corridors, TEN-T Core and TEN-T Comprehensive network), where the system will be able to warn of traffic ahead faster than the driver is capable of identifying the danger. This service predominantly relies on V2V ITS-G5 communication, although a number of projects are looking to demonstrate its effectiveness using high-speed (e.g. 4G/5G) cellular networks.
12.2.4.3 Impact data
The main data source for the impacts of TJW was the DRIVE C2X project (TNO et al., 2014). An overview of the general methodology is provided in Box 2.
For TJW, Field tests were carried out at the test sites in Spain, Italy and Germany. The test site in Germany had such a small number of traffic jams that no impacts were found. Italy also had a small number of events recorded – since real vehicle queues did not occur at all, artificial TJW events were triggered manually in high traffic density situations on motorways. Similarly, the test site in Spain had few traffic jams occurring, mainly in urban areas. Since the TJW events from Italy and Spain came from two different traffic scenarios (highway vs. urban roads respectively), it was difficult to draw a conclusion on the effectiveness from the pooled data. Nevertheless, an assessment was made using the available information and expert judgement.
In addition to DRIVE C2X, the EasyWay study considered the safety impacts of TJW (EasyWay, 2012). The EasyWay figures were based on the eIMPACT project from 2008, which scaled the values up to EU-25 level, therefore the DRIVE C2X data were used in preference. An overview of the methodology for the EasyWay project is provided in Box 4.
Box 4. Overview of key data source – EasyWay project
The cost-benefit analysis carried out in the EasyWay study considered the impacts of C-ITS on road safety, efficiency and congestion as well as fuel consumption and emissions. The analysis was carried out for the year 2030 and assumed 100% of all vehicles will be equipped with some form of communication device that can facilitate cooperative services. The study assumed that one third will be installed by OEMs, one third will be aftermarket devices and one third will be nomadic devices. Primary data (for 2010) was obtained from national representatives and usually came from gathered national statistics, including:
Vehicle fleet compositions
Vehicle kilometres driven by road type
Road accident statistics by severity (i.e., fatalities, injured, property damage etc.)
Congestion (i.e., delays),
Emissions (NOx, CO, PM2.5)
Fuel Economy/CO2 emissions for diesel and petrol cars
Road infrastructure deployment In cases where data was missing, the missing data was estimated by interpolating/extrapolating between countries with similar characteristics (left undefined by authors), the resulting estimates were then sent for approval form that country's representatives in the task.
Study on the Deployment of C-ITS in Europe: Final Report | 142
Ricardo in Confidence Ref: Ricardo/ED60721/Issue Number 1
Ricardo Energy & Environment
To make more robust estimates for C-ITS impacts, adaptations were made to account for changes in driving behaviour and travel behaviour. These adaptations were based on simple models taken from various literature sources. The key sources were:
Kulmala, R.; Leviäkangas, P.; Sihvola, N.; Rämä, P.; Francics, J.; Hardman, E.; Ball, S.; Smith, B.; McCrae, I., Barlow, T.; Stevens, A. (2008). CODIA Deliverable 5: Final Study Report. CODIA Co-Operative systems Deployment Impact Assessment. Submitted to European Commission DG-INFSO
Wilmink I., Janssen W., Jonkers E., Malone K., van Noort M., Klunder G., Rämä P., Sihvola N., Kulmala R., Schirokoff A., Lind G., Benz T., Peters H. & Schönebeck S. (2008). Impact assessment of Intelligent Vehicle Safety Systems. eIMPACT Deliverable D4. Version 1.0 April 2008.
Janssen W.H., Brouwer R.F.T. and Huang Y. (2004). Risk trade-offs between driving behaviour and driver state. AIDE Deliverable D2.3.2.
Nilsson G. (2004). Traffic Safety Dimensions and the Power Model to describe the effect of speed and safety. Bulletin 221. Department of Technology and Society. Lund University. Sweden.
The data required to parametrise these models were usually taken from the same papers that presented the models. For example, for hazardous location notification
It is assumed that it comprises of low friction warnings and low visibility warning. The corresponding estimated safety improvements are: 5% and 12% reductions in injury crashes, respectively; and 10% and 23% reductions in fatal crashes, respectively [Kulmala et. al. (2008) Nilsson (2004)]
Following Kulmala et. al. (2008) and Janssen et. al. (2006), the effects of increased awareness is assumed to further reduce the risk of accidents by 11%
Kulmala et. al. (2008), utilising the results of Janssen et. al. (2006) estimated an overall headway-related crash risk decrease of 4%
Assuming that speed awareness and headway effects are independent (an assumption that is made for all mechanism and sub-mechanisms in adapting for behavioural changes) safety impacts for hazardous location notification is -22% (0.915 x 0.89 x 0.96 = 0.78) for injuries and -29% (0.835 x 0.89 x 0.96 = 0.71) for fatal accidents/fatalities.
Finally, the forecasts for 2030 were estimated from the 2010 data by utilising any existing national forecasts and the forecasts provided by the eIMPACT (Wilmink et al. 2008) and CODIA projects (Kulmala et al. 2008). In addition, the general energy use and CO2 forecast were taken from European Energy and Transport Trends to 2030 (published in 2007)12. Note that for safety, the 2020 forecast was used for the 2030 forecast because the authors assumed that almost all additional safety improvement between 2020 and 2030 would result from cooperative systems. As for the other estimates, all forecasts were validated by the national representatives.
Source: (EasyWay, 2012)
12.2.4.3.1 Traffic efficiency
In DRIVE C2X, the traffic efficiency impacts of TJW were examined using traffic simulation, which did not show any statistically significant changes in traffic efficiency (TNO et al., 2014). This is because TJW affects how a driver approaches the tail of a traffic jam and will not affect the duration of the traffic jam. Multiple simulation runs also found that there were no second order effects impacting the characteristics of an existing traffic jam (TNO et al., 2014), and hence this impact was considered insignificant for the purposes of this study. Therefore, zero impact was assumed for this impact category in the model.
12.2.4.3.2 Fuel consumption and CO2
The primary effect of TJW is intended to be on safety. Hence the fuel efficiency impacts are expected to be minimal. Minor reductions in fuel consumption could occur if a driver were able to decelerate more
12http://ec.europa.eu/dgs/energy_transport/figures/trends_2030_update_2007/energy_transport_trends_2030_update_2007_en.pdf

Study on the Deployment of C-ITS in Europe: Final Report | 143
Ricardo in Confidence Ref: Ricardo/ED60721/Issue Number 1
Ricardo Energy & Environment
economically. Nevertheless, the effects are small and valid only for a short distance influenced by the traffic jam. The results from DRIVE C2X confirmed that impacts on fuel efficiency were statistically insignificant and could not be scaled up to the EU level (TNO et al., 2014).
12.2.4.3.3 Environmental and emissions impacts
The primary effect of TJW is intended to be on safety. Hence the environmental impacts are expected to be minimal. Minor reductions in pollutant emissions could occur if a driver were able to decelerate more economically. Nevertheless, the effects are small and valid only for a short distance influenced by the traffic jam. The results from DRIVE C2X confirmed that impacts on pollutants were statistically insignificant and could not be scaled up to the EU level (TNO et al., 2014).
12.2.4.3.4 Safety
The primary safety benefit provided by TJW is to avoid a rear-end collision due to ensuring earlier driver awareness of a traffic jam tail. (TNO et al., 2014). In case of high traffic flow, there might be problems of side-by-side collisions and other accident types as well if drivers carry out panic manoeuvres.
In DRIVE C2X, safety effects were presented for the EU-28 as a percentage reduction in fatalities or injuries in 2030, corresponding to various scenarios, which are based on a combination of different fleet penetration levels and the level of ambition of safety impact estimates.
Specifically, positive effects that were expected are:
The driver will slow down earlier than without TJW.
The driver will slow down to a lower speed than without TJW.
The driver will not slow down earlier, but be able to react faster on approach to the traffic jam.
The driver may also brake more smoothly when reaching the traffic jam, or to keep the lane in case of high traffic flow.
A possible rebound effect is that the driver would pay less attention to potential traffic jams due to relying on the system. However, the information provision is dependent on equipped vehicles being present to send the warning.
When the user of TJW approaches the traffic jam more smoothly, the non-users behind will most likely do so, too. The amount of fatalities and injuries in rear collisions caused by traffic jam to be prevented was assessed to be 1-5% for all driving environments due to smoother non-user driving behaviour. The impact was assessed to be 5-10% of the impact for rear collisions to other accident types except frontal collisions.
In DRIVE C2X, FOT results were scaled up to EU-28 level based on the number of traffic jams in the EU-27. This was based on data from the Netherlands, since information for the EU was not available.
In the DRIVE C2X high scenario, the overall safety impact of TJW was calculated to be up to 193 prevented fatalities and up to 16,619 prevented injuries per year in the EU-28 in 2030. This is equivalent to a 1.7% reduction in fatalities and a 2.5% reduction in injuries.
The EasyWay project calculated the impact of the traffic jam ahead warning service on injury and fatal accidents at EU-27 level. The results from this study are shown below:
Injury accidents and injuries: Average 2.8% reduction in injuries
o (-4.9% on motorways, -4.1% on interurban and rural roads, and -2.0% on urban roads)
Fatal accidents and fatalities: Average 2.4% reduction in fatalities
o (-3.3% on motorways, -2.8% on interurban and rural roads, and -1.6% on urban roads)
These values are higher than those calculated by the DRIVE C2X report (Table 12-1), however the benefits are separated by road type, as desired for the modelling. It was decided to use the DRIVE C2X data as an input to the model (given the fact that it is based on FOTs) but the impact was scaled for each road type based on the ratios from the EasyWay studies. This gave the following safety impacts:
Motorways: 2.4% reduction in fatalities, 4.4% reduction in injuries
Non-motorway non-urban roads: 2.0% reduction in fatalities, 3.7% reduction in injuries
Urban roads: 1.2% reduction in fatalities, 1.8% reduction in injuries

Study on the Deployment of C-ITS in Europe: Final Report | 144
Ricardo in Confidence Ref: Ricardo/ED60721/Issue Number 1
Ricardo Energy & Environment
Table 12-1. Summary of safety impacts of the traffic jam ahead warning service stated in various EU studies
Study Fatalities (reduction) Injuries (reduction) Scenario
DRIVE C2X 1.74% 2.52%
76% penetration, high safety impact estimate
EU-28, 2030
EasyWay
2.4% (average)
3.3% (motorways)
2.8% (interurban roads)
1.6% (urban roads)
2.8% (average)
4.9% (motorways)
4.1% (interurban roads)
2.0% (urban roads)
100% penetration
EU-27, 2030
12.2.4.3.5 Other impacts
Subjective assessment carried out in DRIVE C2X using stakeholder input suggested that TJW could help to achieve very slight decreases in stress and uncertainty, and contribute to slightly increased feelings of safety and comfort (TNO et al., 2014). The scores provided on a rating scale however fell close to the middle (i.e. a neutral impact) and therefore the effects are considered in this study to be insignificant overall. User acceptance was relatively high, with 79% of the respondents in the DRIVE C2X survey willing to use the function (TNO et al., 2014).
There were no indications of any impact on modal shift (TNO et al., 2014).

Study on the Deployment of C-ITS in Europe: Final Report | 145
Ricardo in Confidence Ref: Ricardo/ED60721/Issue Number 1
Ricardo Energy & Environment
12.2.5 Hazardous location notification (HLN)
12.2.5.1 Service overview
This service gives drivers an advance warning of upcoming hazardous locations in the road. Examples of these hazards include a sharp bend in the road, steep hill, pothole, obstacle, or slippery road service. Using this information, drivers will be better prepared for upcoming hazards and will be able to adjust their speed accordingly.
12.2.5.2 Technical information
Day 1 V2V service, likely based on ITS-G5 communication
Bundle 1
Hazardous locations are automatically detected by vehicles in response to changing driving behaviour or information gained from vehicle information systems. For example, a sharp bend may be detected by rapid braking and change of vehicle direction, while a pothole may be detected by a vehicle’s electronic stability control system. Information concerning the specific location and type of danger is retained and sent to vehicles in the surrounding area, warning of the hazard. This service is suitable for all vehicles and road types and may be used in combination with data gained from V2I services such as weather warning and in-vehicle signage. Whilst it is expected to rely primarily on V2V ITS-G5 communication, a number of projects are looking to demonstrate its effectiveness using high-speed (e.g. 4G/5G) cellular networks.
12.2.5.3 Impact data
The main data sources for the impacts of the hazardous location notification service are the EasyWay, eIMPACT, CODIA and eSafetyForum Intelligent Infrastructure Working Group reports. The EasyWay and CODIA projects uses estimates from eIMPACT. An overview of the general methodology for the eSafetyForum Intelligent Infrastructure Working Group Report is provided in Box 6, while an overview of CODIA is provided in Box 5.
Box 5. Overview of key data source - CODIA
The CODIA study (Co-Operative Systems Deployment Impact Assessment) aimed to evaluate the costs, impacts and benefits of five C-ITS services, namely:
Speed adaptation due to weather conditions, obstacles or congestion (V2I)
Reversible lanes due to traffic flow (V2I)
Local danger / hazard warning (V2V)
Post crash warning (V2V)
Cooperative intersection collision warning (V2V and V2I)
The potential impacts of the selected C-ITS services were assessed up to the year 2030 and considered the entire vehicle fleet in EU-25 countries. Data was obtained from a wide range of literature sources including scientific journals, relevant EU R&D projects (in particular the COOPERS, CVIS and SAFESPOT projects) and the US DoT, For the impact assessment. The majority of vehicle, accident and traffic data was obtained from the eIMPACT project.
As many systems were not fully defined while the study was being carried out, assumptions and key findings were validated with experts from the European Commission, related European research projects, industry, and academia.
Source: (VTT, TRL, 2008)

Study on the Deployment of C-ITS in Europe: Final Report | 146
Ricardo in Confidence Ref: Ricardo/ED60721/Issue Number 1
Ricardo Energy & Environment
Box 6. Overview of key data source - eSafetyForum Intelligent Infrastructure Working Group Final Report
The eSafetyForum Intelligent Infrastructure Working Group (II WG) was formed to define Intelligent Infrastructure. The II WG aimed to answer five key questions, which are addressed in the Final Report:
What is intelligent infrastructure?
Which services contribute to the implementation of Intelligent Infrastructure?
Which technological resources are necessary for these services and which business areas need to implement them?
What needs to be done to assist/promote the implementation of these technological resources and services?
What is the relation between Intelligent Infrastructure and Intelligent Vehicles?
As part of this report, a literature review, surveying over 20 papers was performed to assess the potential benefits and added value for a number of C-ITS services. Data for three impact categories (impact on fatalities/injuries, impact on congestion, impact on CO2 emissions) were gathered for a variety of services. Services covered which are relevant to this study are: real time event information, real time traffic information, travel time information, weather information, speed limit information, parking information and guidance, local hazard warning, dynamic route guidance, emergency vehicle warning, wrong way driving warning, road user charging, requesting green/signal priorities, and intelligent truck parking.
The final report mentions a number of limitations of the values presented, noting that “figures are all based on detailed specifications of the system in question” and that “similar systems with a different technology set-up or different content quality may have largely deviating estimates of effectiveness with regard to safety, efficiency, mobility and environment”. The report stresses that local effects will be vastly different to EU scale impacts, however does not state whether the results presented are for single events, or for EU level. Further to this, penetration rates are not given for the impact data and results are not broken down by vehicle type, road type, or accident type (in the case of safety impacts).
At the time of publication (2010), few evaluation studies for cooperative systems had been performed and furthermore, the authors stated that very few quantitative estimates of the impacts have been produced. As a result, data from this study was treated with caution and was only used in the absence of any other data.
12.2.5.3.1 Traffic efficiency
The eSafetyForum Intelligent Infrastructure Working Group Final Report found a 2-10% reduction in congestion. The report does not specify penetration level, vehicle type or road type (eSafetyForum, 2010). Further to this, it is unclear whether this is the impact of a single event, or whether the results were scaled up to EU level (as discussed in Box 6). The lower end of this range was therefore assumed, i.e. an impact of 2% improvement in speed across all vehicle types.
12.2.5.3.2 Fuel consumption and CO2
No data was identified for this impact category in the reports reviewed. The primary effect of the hazardous location service is intended to be on safety, hence the fuel efficiency impacts are expected to be minimal. No fuel efficiency benefits are therefore anticipated on an EU level as a consequence of this service and it is not included as part of the model.
12.2.5.3.3 Environmental and emissions impacts
No data was identified for this impact category in the reports reviewed. The primary effect of the hazardous location service is intended to be on safety, hence the emissions impacts are expected to be minimal. No emissions benefits are therefore anticipated on an EU level as a consequence of this service and it is not included as part of the model.
12.2.5.3.4 Safety

Study on the Deployment of C-ITS in Europe: Final Report | 147
Ricardo in Confidence Ref: Ricardo/ED60721/Issue Number 1
Ricardo Energy & Environment
The safety impacts of this service were covered by several papers. The EasyWay study calculated the impact of the hazardous location service on injuries and fatalities by taking into consideration the expected change in vehicle speed (as discussed in Box 4). The impacts were also calculated by road type, therefore this data is used in preference to those given by the eSafetyForum Intelligent Infrastructure Working Group Final Report and the CODIA study. Furthermore, the EasyWay study builds on the CODIA study in their calculation of safety impacts. The impact on injuries and accidents calculated by EasyWay were used in the model as they build on the CODIA study and are broken down by road type. The impacts are as follows:
Injury accidents and injuries: Average 3.1% reduction o This is equivalent to -5.3% on motorways, -5.3% on interurban and rural roads, and
-1.9% on urban roads
Fatal accidents and fatalities: Average 4.1% reduction o This is equivalent to -5.2% on motorways, -5.3% on interurban and rural roads, and
-1.7% on urban roads
The eSafetyForum report (eSafetyForum, 2010) gives a value of 2-10% for the estimated reduction in fatalities/injuries. Assuming the average of this range is taken (6%), this value is significantly larger than the averages reported by EasyWay. The objective of the eSafetyForum report was to given an indication of the possible benefits, therefore the range is likely to capture all estimates, regardless of whether some data points may be outliers.
The CODIA report (VTT, TRL, 2008) also assessed the impact of local danger warnings. At 100% penetration, the authors state that a 4.2% reduction in fatalities and a 3.1% reduction in injuries is expected, provided that the system is used for all vehicle kilometres driven.
Table 12-2. Summary of safety impacts for the hazardous location service, as reported in EU C-ITS studies
Study Fatalities (reduction) Injuries (reduction) Scenario
EasyWay
4.1% (average)
5.2% (motorways)
5.3% (interurban and rural roads)
1.7% (urban roads)
3.1% (average)
5.3% (motorways)
5.3% (interurban and rural roads)
1.9% (urban roads)
100% penetration
EU-27, 2030
eSafetyForum 2-10% 2-10% Not stated
CODIA 4.2% 3.1% 100% penetration, expected impact if all vehicles were equipped, regardless of year
12.2.5.3.5 Other impacts
No data related to other impacts was identified in the reports reviewed.

Study on the Deployment of C-ITS in Europe: Final Report | 148
Ricardo in Confidence Ref: Ricardo/ED60721/Issue Number 1
Ricardo Energy & Environment
12.2.6 In-vehicle signage (VSGN)
12.2.6.1 Service overview
In-vehicle signage is a vehicle-to-infrastructure (V2I) service that informs drivers of relevant road signs in the vehicle’s vicinity, alerting drivers to signs that they may have missed, or may not be able to see. The main purpose of this service is to provide information, give advance warning of upcoming hazards and increase driver awareness.
12.2.6.2 Technical information
Day 1 V2I service, which is based on a hybrid communications concept (cellular or ITS-G5, depending on the infrastructure equipment)
Bundle 2
Via V2I communication, information about relevant road signs is provided to the driver. Roadside units may be mounted on traffic signs and key points along roads, informing drivers of potentially dangerous road conditions ahead, speed limits and upcoming junctions. Alternatively this information may be transmitted via the local cellular network. This service is applicable to all vehicle and road types, however may have particular benefits on motorways.
12.2.6.3 Impact data
Data availability for impacts directly related to in-vehicle signage was extremely limited. The DRIVE C2X project tested six specific road signs (children, merge, pedestrian crossing ahead, pedestrian crossing, stop, yield), however trials were on a small scale and quantitative assessments of specific impacts were limited to two very specific road signs (pedestrian crossing and children sign) (TNO et al., 2014). An overview of the general methodology of DRIVE C2X is provided in Box 2.
A report by the US Department of Transport NHTSA also estimated the impact of several road signs, however impacts were only given in terms of reduction in accidents and were not further categorised by severity.
12.2.6.3.1 Traffic efficiency
Although in-vehicle signage may influence traffic in a very local environment the effects are expected to be limited on an EU level, with the primary effect intended to be on safety. As in-vehicle signage is not expected to have a significant effect this impact is not included in the model. This is confirmed by the DRIVE C2X study, which did not consider the effect on traffic efficiency for this service.
12.2.6.3.2 Fuel consumption and CO2
The primary effect of in-vehicle signage is intended to be on safety, hence the fuel efficiency impacts are expected to be minimal. No fuel efficiency are therefore anticipated on an EU level as a consequence of this service and it is not included as part of the model. This is confirmed by the DRIVE C2X study, which did not consider the effect on fuel consumption for this service.
12.2.6.3.3 Environmental and emissions impacts
The primary effect of in-vehicle signage is intended to be on safety, hence the emissions impacts are expected to be minimal. No emissions benefits are therefore anticipated on an EU level as a consequence of this service and it is not included as part of the model. This is confirmed by the DRIVE C2X study, which did not consider the effect on emissions for this service.
12.2.6.3.4 Safety
The DRIVE C2X study estimated safety impacts based on small scale trials of only two signs: pedestrian crossing and child sign. The impact data for the high scenario is as follows:
Impact on fatalities: 1.04% reduction
Impact on injuries: 0.46% reduction
As DRIVE C2X only based the impacts on the pedestrian crossing and child road signs, the impacts of other types of road signs were estimated based on data from the US DoT report (John A. Volpe National Transportation Systems Center, 2008). This report estimates that a stop sign violation warning is

Study on the Deployment of C-ITS in Europe: Final Report | 149
Ricardo in Confidence Ref: Ricardo/ED60721/Issue Number 1
Ricardo Energy & Environment
expected to lead to a 0.088% reduction in annual light vehicle crashes. The same impact for a merge was assumed, stop and yield sign, leading to the following impacts per road type:
Motorways:
o Impact on fatalities: 1.04% reduction (from DRIVE C2X)
o Impact on injuries: 0.46% reduction (from DRIVE C2X)
Non-motorway non-urban roads:
o Impact on fatalities: 1.04% (from DRIVE C2X) + (3 x 0.088%) (applying the value of 0.088% from US DoT report for stop sign violation and assuming the same impact for merge, stop and yield signs) = 1.30% reduction in fatalities
o Impact on injuries: 0.46% (from DRIVE C2X) + (3 x 0.088%) (applying the value of 0.088% from US DoT report for stop sign violation and assuming the same impact for merge, stop and yield signs) = 0.72% reduction in injuries
Urban roads:
o Impact on fatalities: 1.04% (from DRIVE C2X) + (3 x 0.088%) (applying the value of 0.088% from US DoT report for stop sign violation and assuming the same impact for merge, stop and yield signs) = 1.30% reduction in fatalities
o Impact on injuries: 0.46% (from DRIVE C2X) + (3 x 0.088%) (applying the value of 0.088% from US DoT report for stop sign violation and assuming the same impact for merge, stop and yield signs) = 0.72% reduction in injuries
12.2.6.3.5 Other impacts
No data related to other impacts was identified in the reports reviewed.

Study on the Deployment of C-ITS in Europe: Final Report | 150
Ricardo in Confidence Ref: Ricardo/ED60721/Issue Number 1
Ricardo Energy & Environment
12.2.7 In-vehicle speed limits (VSPD)
12.2.7.1 Service overview
In-vehicle speed limits are intended to prevent speeding and bring safety benefits by informing drivers of speed limits. Speed limit information may be displayed to the driver continuously, or targeted warnings may be displayed in the vicinity of road signs, or if the driver exceeds or drives slower than the speed limit.
12.2.7.2 Technical information
Day 1 V2I service, which is based on a hybrid communications concept (cellular or ITS-G5, depending on the infrastructure equipment)
Bundle 2
Roadside units at key points along roads can broadcast information to drivers about speed limits, ensuring that drivers are aware of the permitted driving speed. Alternatively this information may be transmitted via the local cellular network. This service is applicable to all vehicle and road types, however may have particular benefits when warning drivers of changing speed limits when travelling along high speed roads.
12.2.7.3 Impact data
The main data source for the impacts of in-vehicle speed limits was the DRIVE C2X project (TNO et al., 2014). An overview of the general methodology is provided in Box 2. This service was trialled at test sites in Finland, Italy, Spain and Sweden in DRIVE C2X and the data was used to produce EU-level impact data reported in the DRIVE C2X impact assessment.
Other studies that considered the impacts of in-vehicle speed limits include eIMPACT, eSafetyForum Intelligent Infrastructure Work Group and SAFESPOT (TNO, VTT, Movea, PTV, BASt, 2008; eSafetyForum, 2010; SAFESPOT, 2010). DRIVE C2X refers to and builds on many of these studies; we therefore believe the DRIVE C2X study is a more reliable source of data as it is based on more recent estimates and FOT results.
12.2.7.3.1 Traffic efficiency
The primary objectives of the in-vehicle speed limit service are to decrease speed and improve safety. The increase in delay per vehicle-km found in the DRIVE C2X study (TNO et al., 2014) is therefore not surprising and can be attributed to a higher awareness of speed limits. Many traffic efficiency effects observed in the DRIVE C2X study were not statistically significant, with the only significant results being found for motorways and rural roads during off-peak times. The authors argue that this is because the impact was measured at specific point on the road (which may be subject to larger variations) rather than if speed was measured over a long stretch of road. The overall delay for different road types is shown below:
0.6 seconds per kilometre on motorways
1.1 seconds per kilometre on rural roads
No significant effect on delay on urban roads
The eIMPACT and eSafetyForum Intelligent Infrastructure Working Group studies also considered the impact of in-vehicle speed limits on speed. The results of these studies are summarised below:
eSafetyForum: Speed limit information 2-10% reduction in congestion.
eIMPACT - average change in speed:
o Motorways: 1.1% increase (low demand), 0.6% increase (high demand)
o Rural roads: 1.0% decrease (low demand), 0.9% decrease (high demand)
o Urban roads: 1.4% decrease (low demand), 1.7% decrease (high demand)

Study on the Deployment of C-ITS in Europe: Final Report | 151
Ricardo in Confidence Ref: Ricardo/ED60721/Issue Number 1
Ricardo Energy & Environment
Change in speed was only modelled for urban roads in TRT’s ASTRA model. DRIVE C2X showed that in-vehicle speed limits did not have a statistically significant impact on urban roads, however further trials are needed to confirm this.
As an input to the model the average speed change from the eIMPACT project was therefore scaled for urban roads based on vehicle kilometres driven in high demand and low demand situations, to give an average 1.40% reduction in vehicle speed in urban areas. The reduction was only applied to passenger cars and not to public transport.
12.2.7.3.2 Fuel consumption and CO2
Fuel consumption benefits were seen for the in-vehicle speed limits function in the DRIVE C2X study, which is likely to be due to a smoother driving style. Specifically, greater awareness of speed limits may reduce sudden acceleration and braking manoeuvres. The DRIVE C2X FOT only found a statistically significant reduction in fuel consumption on motorways and on rural roads. The DRIVE C2X study provides impact data for two scenarios:
speed limit information shown only in the vicinity of road signs
speed limit information displayed continuously
A much greater impact was observed when speed limit information was displayed continuously (TNO et al., 2014). In practice, speed limit information may not be displayed continuously if a variety of C-ITS services are implemented into a vehicle, therefore we have chosen to use the values for speed limit information shown only in the vicinity of road signs.
The impacts of in-vehicle speed limits were scaled up from FOT scale to EU-27 level based on the number of vehicle-kilometres travelled, in order to determine absolute fuel savings (in tonnes). We converted the figures for the high penetration level (76%) to percentages based on the share of vehicle kilometres travelled on each road type, which gave a 2.3% fuel saving on motorways and a 3.5% fuel saving on non-motorway non-urban roads. These values are in the range suggested by the eSafetyForum study, which stated a 2-10% reduction in CO2 emissions (eSafetyForum, 2010).
12.2.7.3.3 Environmental and emissions impacts
Minor environmental benefits were seen on motorways for the in-vehicle speed limits function in the DRIVE C2X study, which is likely to be due to a smoother driving style. Specifically, greater awareness of speed limits may reduce sudden acceleration and braking manoeuvres. However on non-motorway-non-urban roads, DRIVE C2X estimates a small increase in emissions, particularly PM emissions, likely due to increased braking or speed changes when approaching new speed limits. No significant effect was observed in urban areas.
The absolute emissions changes stated in DRIVE C2X for the high penetration level (76%) were converted to percentage savings on each road type, based on vehicle-kilometres driven on EU roads. The following values were inputted into the model:
NOx: 0.5% reduction (motorways), 0.4% reduction (non-motorway non-urban roads), zero change (urban roads)
PM: 0.4% decrease (motorways), 4.2% increase (non-motorway non-urban roads), zero change (urban roads)
CO: 0.2% reduction (motorways), 0.2% increase (non-motorway non-urban roads), zero change (urban roads)
VOCs: 0.1% increase (motorways), 0.5% increase (non-motorway non-urban roads), zero change (urban roads)
12.2.7.3.4 Safety
The primary function of in-vehicle speed limits is intended to be reducing speeding; an improvement in road safety is therefore expected. The DRIVE C2X study confirms this assertion and reports significant reductions in both injuries and fatalities, however the magnitude of these impacts varies depending on whether speed-limit information is shown to the driver continuously or only in the vicinity of road signs. If speed limit information is only shown in the vicinity of road signs the number of prevented fatalities is estimated to be 121-768 in 2030, whereas if information is provided continuously, an estimated 566-1772 prevented fatalities is expected. In practice, speed limit information may not be displayed

Study on the Deployment of C-ITS in Europe: Final Report | 152
Ricardo in Confidence Ref: Ricardo/ED60721/Issue Number 1
Ricardo Energy & Environment
continuously if a variety of C-ITS services are implemented into a vehicle, therefore the values for speed limit information shown only in the vicinity of road signs were selected for the modelling inputs.
The values for the high scenario were converted to percentages based on projected EU fatalities in 2030 (as stated in the DRIVE C2X report). This is equivalent to a 6.9% reduction in fatalities and a 3.9% reduction in injuries, applied to passenger cars and freight for all road types in the modelling.
A number of other studies covered the safety impacts of in-vehicle speed limits, as summarised in Table 12-3.
Table 12-3. Summary of safety impacts of in-vehicle speed limits
Study Fatalities (reduction) Injuries (reduction) Scenario
DRIVE C2X 6.93% 3.93%
High penetration (100% in cars, overall 76% system penetration, high safety impact estimate)
EU-28, 2030
eIMPACT 8.7% 6.2% 100% penetration
EU-25, 2020
SAFESPOT 7.1% 4.9% 100% penetration
EU-25, 2020
eSafetyForum 2-10% 2-10% Not stated
CODIA 7.2% 4.8% 100% penetration for light/heavy vehicles, 55% of driven km
The eIMPACT project estimated an 8.7% reduction in fatalities and a 6.2% reduction in injuries, assuming 100% penetration at EU-25 level. In comparison with DRIVE C2X data, the impact on both fatalities and injuries is higher.
SAFESPOT also assesses the impact of in-vehicle speed alerts And estimates a 7.1% reduction in fatalities and a 4.9% reduction in injuries at an EU-25 level, assuming 100% penetration in 2020 (SAFESPOT, 2010). The estimation of impacts are based on the eIMPACT and CODIA studies and are comparable to those stated in DRIVE C2X.
The eSafetyForum study estimates a 2-10% reduction of fatalities/injuries. The average of this (6%) is comparable with the DRIVE C2X figure for fatalities avoided, however it is much higher than the figure for injuries. This may be because the impacts on fatalities and injuries were not treated separately as part of the eSafetyForum literature review.
CODIA estimated the effect of a service called ‘dynamic speed adaptation’ at a 100% penetration rate. The expected reduction in fatalities was stated as 7.2%, while the reduction in injuries was estimated to be 4.8%. These figures are comparable to a number of studies covered here.
We have used the DRIVE C2X figures as inputs to the model as the values are based on FOT data and build on the findings of earlier EU studies in this field.
12.2.7.3.5 Other impacts
Stakeholder inputs during the DRIVE C2X project (TNO et al., 2014) suggest that user acceptance for in-vehicle speed limits is in-line with other C-ITS services. Drivers found warning messages useful when

Study on the Deployment of C-ITS in Europe: Final Report | 153
Ricardo in Confidence Ref: Ricardo/ED60721/Issue Number 1
Ricardo Energy & Environment
they exceeded the speed limit, however only 28% felt that the system provided benefits that were not provided by other functions on the market. This is likely due to satellite navigation systems providing this capability.
Qualitative effects of in-vehicle speed limits were a reported improvement in comfort and safety, however the impact on stress was questionable. Mean values for these impacts were assessed at 4.2-5.2 for comfort (on a scale from 1, strongly disagree to 7, strongly agree), and 5.2 for safety.
There were no reported impacts on modal shift.

Study on the Deployment of C-ITS in Europe: Final Report | 154
Ricardo in Confidence Ref: Ricardo/ED60721/Issue Number 1
Ricardo Energy & Environment
12.2.8 Probe Vehicle Data (PVD)
12.2.8.1 Service overview
The purpose of probe vehicle data is to collect and collate vehicle data, which can then be used for a variety of applications. For example, road operators may use the data to improve traffic management.
12.2.8.2 Technical information
Day 1 V2I service, which is based on a hybrid communications concept (cellular or ITS-G5, depending on the infrastructure equipment)
Bundle 2
Also known as Floating Car Data (FCD), probe vehicle data refers to the collection of data generated by vehicles. Information on a variety of vehicle parameters may be collected, including positional information, time stamp and direction of motion. Driver actions such as steering, braking, flat tyre, windscreen wiper status, air bag status, as well as weather and road surface conditions can also be transmitted and collated. This probe vehicle data is used to manage traffic flows, maintain roads and to alert users in hot spots, where the danger of accidents accumulates. This service is applicable to all road and vehicle types, however may be most useful on motorways. It has the potential to deliver safety, efficiency, vehicle operation and environmental benefits. It can be delivered via the presence of roadside units to aggregate and re-transmit the data, or via the use of cellular networks.
12.2.8.3 Impact data
The main data sources for the impacts of the probe vehicle data service were the EasyWay and eIMPACT projects. To our knowledge, there are no other publically available studies that examine probe vehicle data specifically.
12.2.8.3.1 Traffic efficiency
In TRT’s ASTRA model, traffic efficiency impacts are only modelled on urban roads. The majority of the benefits of probe vehicle data are expected to be realised on motorways, therefore the impact of this service on traffic efficiency on urban roads was assumed to be zero.
12.2.8.3.2 Fuel consumption and CO2
In the CODIA study, two services called speed adaptation due to accident and speed adaptation due to poor weather were assessed. If added together, these services have similar functionality to the probe vehicle data service described in this project. CODIA estimated the impact on carbon dioxide emissions to be as follows (at 100% penetration in EU-25 countries):
Speed adaptation due to accident: 58.5 tonnes reduction
Speed adaptation due to poor weather: 27,682 tonnes reduction
Speed adaptation total: 27,741 tonnes reduction (EU-25)
The carbon dioxide emissions were scaled up to EU-27 level based on vehicle kilometre data from TRT’s ASTRA and TRUST models, and then divided by the total EU carbon dioxide emissions stated in DRIVE C2X. This is equivalent to a 0.006% reduction in fuel consumption in EU-27 countries.
12.2.8.3.3 Environmental and emissions impacts
Impacts on emissions were also given in the CODIA study for the dynamic speed adaptation service (includes speed limit advice given as a consequence of weather, obstacles and congestion). The results calculated in the study on an EU-25 level for a 100% penetration scenario are summarised below:
Impact on NOx emissions:
Speed adaptation due to accident: 0.7 tonnes reduction
Speed adaptation due to poor weather: 490 tonnes reduction
Speed adaptation total: 491. tonnes reduction
Impact on PM emissions:
Speed adaptation due to accident: 0.015 tonnes reduction

Study on the Deployment of C-ITS in Europe: Final Report | 155
Ricardo in Confidence Ref: Ricardo/ED60721/Issue Number 1
Ricardo Energy & Environment
Speed adaptation due to poor weather: 5.13 tonnes reduction
Speed adaptation total: 5.12 tonnes reduction
These values are equivalent to the following percentages at EU level:
0.003% reduction in NOx emissions
0.001% reduction in PM emissions
As no further data was available, we have assumed the same CO reduction as for fuel consumption (assuming a linear relationship between carbon content and emissions). For VOC emissions, we have also applied the same percentage reduction as for fuel consumption (0.006%).
12.2.8.3.4 Safety
The safety impacts of probe vehicle data are primarily related to extended probe vehicle data, where the emphasis is on informing the driver about adverse road conditions ahead, for example adverse weather conditions. Safety impacts of probe vehicle data were reported in the EasyWay study (EasyWay, 2012). The following impacts were estimated (for EU-27, 100% penetration):
Injury accidents and injuries: overall 2.8% reduction (4.9% on motorways, 4.1% on interurban and rural roads, and 2.0% on urban roads)
Fatal accidents and fatalities: overall 2.4% reduction (3.3% on motorways, 2.8% on interurban and rural roads, and 1.6% on urban roads)
12.2.8.3.5 Other impacts
No data related to other impacts was identified in the reports reviewed.

Study on the Deployment of C-ITS in Europe: Final Report | 156
Ricardo in Confidence Ref: Ricardo/ED60721/Issue Number 1
Ricardo Energy & Environment
12.2.9 Roadworks warning (RWW)
12.2.9.1 Service overview
Roadworks warnings enable road operators to communicate information about road works and restrictions to drivers. This allows drivers to be better prepared for upcoming roadworks and potential obstacles in the road, therefore reducing the probability of collisions.
12.2.9.2 Technical information
Day 1 V2I service, which is based on a hybrid communications concept (cellular or ITS-G5, depending on the infrastructure equipment)
Bundle 2
Roadside units are mounted on road works, enabling messages and instructions to be sent to approaching drivers, either directly via ITS-G5 communications, or via the cellular network. This service is applicable to all road and vehicle types.
12.2.9.3 Impact data
The main data source for the impacts of roadworks warning was the DRIVE C2X project (TNO et al., 2014). An overview of the general methodology is provided in Box 2. For roadworks warning, tests were carried out at test sites in Finland, Italy and Sweden. In DRIVE C2X, this service is evaluated in the same section as ‘obstacle warning’ and ‘car breakdown warning’, as the services perform a similar function, act via similar mechanisms and present information to drivers in a similar manner.
To our knowledge, there are no other publically available studies that examine roadworks warning specifically.
12.2.9.3.1 Traffic efficiency
The traffic efficiency impacts of the roadworks warning service are expected to be minimal as its purpose is to improve safety, rather than prevent traffic jams (TNO et al., 2014). No traffic efficiency impacts are expected when scaled up to EU level and it is not included as part of the model. This is confirmed by the DRIVE C2X study, which did not consider the effect on traffic efficiency for this service.
12.2.9.3.2 Fuel consumption and CO2
Fuel efficiency impacts are expected to be negligible for this service when scaled up to an EU level. This is confirmed by the DRIVE C2X study, which did not consider the effect on fuel consumption for this service.
12.2.9.3.3 Environmental and emissions impacts
Impacts on vehicle emissions impacts are expected to be negligible for this service when scaled up to an EU level. This is confirmed by the DRIVE C2X study, which did not consider emissions impacts for this service.
12.2.9.3.4 Safety
The key objective of the roadworks warning service is to improve safety, which as described in the DRIVE C2X study can be achieved by reducing the likelihood of several different types of collisions. The types of collisions expected to be prevented the most by this service are side-by-side collisions, single vehicle collisions with obstacles and rear collisions (TNO et al., 2014). Specifically, the service is expected to:
Warn drivers about upcoming roadworks (especially those outside of the field of vision) and therefore limit unsafe manoeuvres.
Increase driver alertness.
Help to avoid sudden braking or steering/swerving manoeuvres.
Reduce speed in the proximity of roadworks, thus decreasing the severity of potential injuries.

Study on the Deployment of C-ITS in Europe: Final Report | 157
Ricardo in Confidence Ref: Ricardo/ED60721/Issue Number 1
Ricardo Energy & Environment
DRIVE C2X scaled up safety impacts based on Swedish road safety statistics (Liljegren, 2014), which estimate that 2.3% of injuries and 3% of fatalities occur due to roadworks. The study assumes 100% infrastructure and vehicle penetration and also details the following assumptions:
Roadworks warning would only be effective for accidents caused due to inattention or lack of awareness (80-90% of accidents).
Includes winter road maintenance work which does not take place in all parts of EU28. In those countries, the number of road works may be higher overall and may be made all year round (in Nordic countries, road works only take place in the summer).
Effectiveness of the system was estimated to be 80-90% for rear collisions, single vehicle collisions with pedestrians and other obstacles. This high level of effectiveness is due to drivers expecting these types of hazards and has been based on previous naturalistic driving studies (Dingus, 2006).
80-90% system effectiveness was also assumed for ‘other single vehicle accidents’. This category primarily includes driving off road during a panic manoeuvre, which would most likely be significantly reduced if roadworks warnings were operational.
The effectiveness was estimated to be 70–80% for frontal collisions. This also represents panic manoeuvres.
60-70% effectiveness for other accident types. This lower effectiveness is due to the unexpected nature of these types of accident.
In the DRIVE C2X high scenario, the overall safety impact for this service was calculated to be 209 prevented fatalities and 9939 prevented injuries in EU-28 countries if the service was deployed in 100% of passenger cars (equivalent to a 76% fleet penetration). This is equivalent to a 1.9% decrease in fatalities and a 1.5% decrease in injuries, which were used as inputs to the model. Impacts were assumed to be the same on all road types.
12.2.9.3.5 Other impacts
Subjective assessment carried out during the DRIVE C2X study using stakeholder input suggested that roadworks warning has limited usefulness, however the willingness to use the service remained rather high at 79%. Further assessment suggested that the impacts of the service on stress, comfort and feelings of uncertainty were minimal. There were no reported impacts on modal shift, or a change in travel patterns in the DRIVE C2X study.

Study on the Deployment of C-ITS in Europe: Final Report | 158
Ricardo in Confidence Ref: Ricardo/ED60721/Issue Number 1
Ricardo Energy & Environment
12.2.10 Weather conditions (WTC)
12.2.10.1 Service overview
The objective of this service is to increase safety through providing accurate and up-to-date local weather information. Drivers are informed about dangerous weather conditions ahead, especially where the danger is difficult to perceive visually, such as black ice or strong gusts of wind.
12.2.10.2 Technical information
Day 1 V2I service, which is based on a hybrid communications concept (cellular or ITS-G5, depending on the infrastructure equipment)
Bundle 2
Vehicles are sent information from roadside units warning the driver of dangerous, or changeable weather conditions. Alternatively, the messages may be transmitted via the cellular network. This service is applicable to all roads and vehicle types.
12.2.10.3 Impact data
The main data source for the impacts of the weather conditions service was the DRIVE C2X project (TNO et al., 2014). An overview of the general methodology is provided in Box 2. FOTs took place in Finland and Spain as part of this project, with a total of 39 participants. In Finland, slippery road warnings were presented in winter conditions, while in Spain warnings about rainy conditions were shown.
Other studies that considered the impacts include eIMPACT (TNO, VTT, Movea, PTV, BASt, 2008), CODIA (VTT, TRL, 2008), eSafetyForum (eSafetyForum, 2010), EasyWay (EasyWay, 2012) and SAFESPOT (SAFESPOT, 2010). Much of the safety impacts data in these projects build on and the eIMPACT study. As the DRIVE C2X project incorporates FOT results into their estimates, values from this data source were used.
12.2.10.3.1 Traffic efficiency
The primary effect of the weather conditions warning is intended to be on safety, hence the traffic efficiency impacts are expected to be minimal.
The DRIVE C2X study did not assess the effect of this service on traffic efficiency, citing a lack of results to be able to qualitatively evaluate the service. CODIA assessed a “local danger warning due to poor weather” service, which led to an increase of 28,489 thousand hours on the road per year in EU25 at a 100% penetration rate. When converted to a percentage, the effect on time spent on the road is less than 0.1%, applied to both cars and public transport on all road types in the modelling.
Another service, ‘speed adaptation due to poor weather’ was also separately assessed in CODIA. The impacts associated with this service have not been included in this study as the service definition for weather warning does not state that speed limit information will be provided to the driver.
12.2.10.3.2 Fuel consumption and CO2
The primary effect of the weather conditions warning is intended to be on safety, hence the fuel consumption impacts are expected to be minimal on an EU level. The DRIVE C2X study did not assess the effect of this service on fuel consumption, however CODIA assessed a service called ‘local danger warning due to poor weather’. At a 100% penetration level, a 47,407 tonnes per year reduction in carbon emissions at EU-25 level was calculated (VTT, TRL, 2008). This was scaled to EU-27 level based on vehicle kilometre data from TRT’s TRUST and ASTRA models. The resulting value (48,444) was divided by the total annual EU CO2 emissions stated in DRIVE C2X. This gives a 0.005% reduction in fuel consumption at an EU-27 level, which was applied to both cars and public transport on all road types in the modelling.
12.2.10.3.3 Environmental and emissions impacts
Minor emissions benefits for the ‘local danger warning due to poor weather’ service were reported in CODIA. At a 100% penetration level, the following impacts on emissions were calculated by CODIA (VTT, TRL, 2008):

Study on the Deployment of C-ITS in Europe: Final Report | 159
Ricardo in Confidence Ref: Ricardo/ED60721/Issue Number 1
Ricardo Energy & Environment
752.50 tonnes per year reduction in NOx emissions at EU25 level
9.15 tonnes per year reduction in particulate matter emissions at EU25 level
These values are equivalent to the following percentages at EU level:
0.02% reduction in NOx emissions
0.01% reduction in PM emissions
As further data was not available, we have assumed the same CO reduction as for fuel consumption (assuming a linear relationship between carbon content and emissions). For VOC emissions, we have also applied the same percentage reduction as for fuel consumption. These values were applied to cars and freight vehicles on all road types in the modelling.
12.2.10.3.4 Safety
The objective of this service is to increase safety in adverse weather conditions such as ice, fog, rain, snow, sleet, hail and wind. The main impacts are expected to occur via direct in-vehicle modification of the driving task after drivers receive information about adverse weather conditions. Specifically, this service is expected to have a number of impacts:
In conditions where the danger can easily be perceived (such as heavy rain), the notification serves as a reminder of the potential danger ahead, and increasing driver awareness.
In situations where the danger cannot be easily be perceived (such as strong cross-winds, or black ice) drivers will receive valuable information regarding local weather conditions/hazards that they otherwise would not have known about.
In both of the above situations, the driver will be more prepared for the hazard and will have the opportunity to adjust their speed accordingly, preventing sudden braking, accelerating, swerving or overtaking manoeuvres.
It is thought that any rebound effects from over-reliance on the system will be negligible. This is because the information used to deliver the service will come partially from other vehicles further ahead and therefore drivers cannot assume that there will always be suitably-equipped vehicles ahead (TNO et al., 2014).
DRIVE C2X scaled up safety impacts based on the impact on driver speeds, driver awareness and the headway between vehicles, using values from FOT data, expert estimates and estimates from the CODIA and eIMPACT projects. For the high scenario in 2030, this resulted in a projected 3.43% reduction in fatalities and a 3.35% reduction in injuries, applied to cars and freight on all road types in the modelling.
Potential safety impacts of the weather conditions service are covered in many other studies, as summarised in Table 12-4. The values from DRIVE C2X are used as an input to the modelling in this project as they are based on FOT data and build on previous EU studies. A discussion of results from other studies is provided below for comparison.
Table 12-4. Summary of safety impacts of weather conditions services from EU studies
Study Fatalities (reduction) Injuries (reduction) Scenario
DRIVE C2X 3.43% 3.35%
76% penetration, high safety impact estimate
EU-28, 2030
EasyWay 16.5% (average) 8.5% (average) 100% penetration
EU-27, 2030
eIMPACT 4.5% 2.8% 100% penetration
EU-25, 2020
SAFESPOT 1.6% (V2I)
16.4% (V2V)
0.7% (V2I)
8.6% (V2V)
100% penetration
EU-25, 2020

Study on the Deployment of C-ITS in Europe: Final Report | 160
Ricardo in Confidence Ref: Ricardo/ED60721/Issue Number 1
Ricardo Energy & Environment
Study Fatalities (reduction) Injuries (reduction) Scenario
eSafetyForum 2-4% 2-4% Not stated
Estimations in the EasyWay project are based on the methodology from the CODIA project and state that if the base speed is 80km/h, there will be a 5% decrease in injury crash risk in adverse conditions, if low friction warnings are displayed, while a 12% decrease in injury collisions is expected for a fog warning. For a fatal crash risk, the percentage reductions are 10% for low friction warning and 23% for fog warnings. EasyWay averaged these figures to give overall impacts of 8.5% on injury crashes and 16.5% on fatal crashes.
eIMPACT evaluated a service called wireless location danger warning, one aspect of which is weather warning. A 4.5% reduction in fatalities and a 2.8% reduction in injuries was estimated, assuming 100% penetration on an EU-25 level. These values are slightly higher than those estimated by DRIVE C2X, however this is likely to be because eIMPACT also considered stationary vehicle warning to be part of this service.
SAFESPOT assesses the impact of two weather warning services: road departure (V2V) and hazard and incident warning (V2I). The road departure (V2V) use case informs the drivers of road conditions, such as a slippery road. SAFESPOT estimates an 8.6% reduction in injuries and a 16.4% reduction in fatalities, which is based on values obtained from the eIMPACT and CODIA projects. These figures are almost identical to EasyWay. The hazard and incident warning (V2I) use case includes weather conditions that result in reduced friction on the road or reduced visibility, such as ice, rain or fog and was shown to be significantly less effective than the V2V service. The estimation of impacts are again based on the eIMPACT and CODIA studies. SAFESPOT estimates a 1.6% reduction in fatalities and a 0.7% reduction in injuries at an EU-25 level, assuming 100% penetration in 2020 (SAFESPOT, 2010). These values are slightly lower than other reports reviewed in this section.
Finally, eSafetyForum reported that a weather conditions service could lead to a 2-4% reduction of fatalities/injuries. This is consistent with the DRIVE C2X figures.
12.2.10.3.5 Other impacts
A survey of drivers in the DRIVE C2X study indicated that 76% of drivers agreed that the weather conditions warning was useful, which is lower than the average for all services tested. This is likely due to the fact that drivers were more enthusiastic about particular types of weather warnings than others. For example, qualitative feedback provided by test drivers showed they were particularly receptive to warnings about potentially more serious hazards such as ice on the road, however they were less enthusiastic about receiving repetitive rainy conditions warnings while driving along a straight road. User acceptance is therefore likely to be dependent on the type of weather warning and how drivers value each type of weather warnings.
Further assessment showed that test drivers felt an increased sense of safety and comfort as a result of this service. On a scale of 1 (strongly disagree) to 7 (strongly agree), the mean value for increased feeling of comfort was 4.8 and for safety was 5.5.
There were no reported impacts on modal shift, or a change in travel patterns in the DRIVE C2X study.

Study on the Deployment of C-ITS in Europe: Final Report | 161
Ricardo in Confidence Ref: Ricardo/ED60721/Issue Number 1
Ricardo Energy & Environment
12.2.11 Shockwave damping (SWD)
12.2.11.1 Service overview
Shock wave damping aims to smooth the flow of traffic, by damping traffic shock waves.
12.2.11.2 Technical information
Day 1 V2I service, which is based on a hybrid communications concept (cellular or ITS-G5, depending on the infrastructure equipment)
Bundle 2
Real-time traffic data is used to feed advisory speeds to cars to smooth out speed variations. This service is applicable to all vehicle types and is particularly relevant to motorways. Again, it could be delivered via roadside units, or the cellular network.
12.2.11.3 Impact data
The main data source for the impacts of shockwave damping was the CODIA project (VTT, TRL, 2008). To our knowledge, there are no other publically available studies that specifically examine this service. The majority of the benefits of shockwave damping are expected to be on motorways, therefore the impact of this service on urban roads and non-urban, non-motorway roads is assumed to be zero.
12.2.11.3.1 Traffic efficiency
CODIA assessed a dynamic speed adaptation due to congestion service that closely matches our definition of the shockwave damping service. As a consequence of this service, the authors estimated an increase of time spent on the road of 63.5 thousand vehicle hours per year in EU25 at 100% penetration rate. In TRT’s ASTRA model, traffic efficiency impacts are only modelled on urban roads. This service is not expected to have an impact on urban roads, therefore the impact on traffic efficiency was assumed to be zero.
12.2.11.3.2 Fuel consumption and CO2
The dynamic speed adaptation due to congestion service assessed in CODIA estimates a reduction of 26,232 tonnes per year of carbon emissions at EU-25 level in a 100% penetration scenario (VTT, TRL, 2008). When calculated as a percentage, these effects are extremely small (0.005% reduction). It is assumed that all fuel consumption benefits will occur on motorways and that there will be zero impact on fuel consumption on non-motorway non-urban, and urban roads.
12.2.11.3.3 Environmental and emissions impacts
The dynamic speed adaptation due to congestion service assessed in CODIA calculated the following impacts on vehicle emissions if the service is deployed at a 100% penetration level in EU-25 countries (VTT, TRL, 2008):
363 tonnes per year reduction in NOx emissions at EU25 level
6.0 tonnes per year reduction in particulate matter emissions at EU25 level
When calculated as a percentage, these effects are extremely small (less than 0.1%).
12.2.11.3.4 Safety
One of the primary objectives of this service is to improve safety on high-speed roads. In CODIA, estimates of safety impacts were presented for the dynamic speed adaptation due to congestion/obstacles at a 100% penetration level (VTT, TRL, 2008). The study estimates a 13% reduction in fatalities and a 10.3% reduction in injuries on motorways.
The inclusion of obstacle warnings in the CODIA definition results in additional functionality to the shockwave damping service defined in this study, therefore the safety impacts of the hazardous location service were subtracted from the figures reported in CODIA. This gave the following values, which were used in the modelling:
Reduction in fatalities on motorways: 7.8%
Reduction in injuries on motorways: 5.0%

Study on the Deployment of C-ITS in Europe: Final Report | 162
Ricardo in Confidence Ref: Ricardo/ED60721/Issue Number 1
Ricardo Energy & Environment
12.2.11.3.5 Other impacts
No data related to other impacts was identified in the reports reviewed.

Study on the Deployment of C-ITS in Europe: Final Report | 163
Ricardo in Confidence Ref: Ricardo/ED60721/Issue Number 1
Ricardo Energy & Environment
12.2.12 Green Light Optimal Speed Advisory (GLOSA) / Time to Green (TTG)
12.2.12.1 Service overview
GLOSA provides speed advice to drivers approaching traffic lights, reducing the likelihood that they will have to stop at a red light, and reducing the number of sudden acceleration or braking incidents. This is intended to provide traffic efficiency, vehicle operation (fuel saving) and environmental benefits by reducing unnecessary acceleration.
12.2.12.2 Technical information
Day 1 V2I service, likely based on ITS-G5 communication
Bundle 3
Traffic lights are connected to a roadside unit, which broadcasts information to nearby vehicles informing them of the traffic light phase schedule. This will enable vehicles to calculate optimal speed of approach. Time to green information may also be presented to drivers. It is applicable to all vehicle types and is particularly suitable in urban areas, where intersections are generally sited. Whilst it is expected to rely primarily on V2I ITS-G5 communication, a number of projects are looking to demonstrate its effectiveness using high-speed (e.g. 4G/5G) cellular networks.
12.2.12.3 Impact data
The main data source for the impacts of GLOSA was the DRIVE C2X project (TNO et al., 2014). An overview of the general methodology is provided in Box 2. For GLOSA, tests were carried out at test sites in Germany, Spain and Sweden. However, the number of events available after filtering in Sweden was too low to provide a good comparison of with and without-service behaviour. Similarly, the data from the Spanish test site was interpreted as a first order effect rather than an effect of GLOSA. Hence, pooling the GLOSA data was not straightforward due to the large differences in experimental set-up
Other studies that considered the impacts include the Dutch ODYSA project and subsequent follow-ons; Beek et al. 2013 and van Katwijk et al. These studies were taken into account in the DRIVE C2X results and hence were not considered further here.
12.2.12.3.1 Traffic efficiency
In DRIVE C2X, traffic efficiency was assessed by naturalistic driving tests on urban roads and by simulations. The results were dependent on the level of traffic, with tests showing a slight overall increase in delay per traffic light, which was attributed to the slower speed of approach. The time spent stationary at traffic lights may be reduced by this service but the effects are not statistically significant. Results from the test site in Germany indicated that driver behaviour may become smoother and results from the literature surveyed by the authors of DRIVE C2X are inconclusive. The DRIVE C2X study team fed FOT data into a model, in order to calculate impacts. They reported an unexpected results of a 9% increase in delay for the implementation of GLOSA, however this was probably due to the way the yellow light was simulated in the model.
Overall, the effects on traffic efficiency are assumed to be small because (1) the system is not necessary when the driver arrives at a light that is already green; and (2) GLOSA has limited potential to affect the possibility of a driver arriving at a red light.
As the results currently stated in the literature are inconclusive, it is assumed that this service will not have an impact on traffic efficiency in urban areas.
12.2.12.3.2 Fuel consumption and CO2
The primary effect of GLOSA is expected to be on fuel efficiency and environmental impacts due to reduced braking and acceleration while passing through traffic lights. The DRIVE C2X study shows that impacts are dependent on vehicle technology, with hybrids showing lower potential for improvement. The impact on motorways is assumed to be negligible, since GLOSA is only effective at traffic light controlled intersections. The study reported the following specific effects on urban roads, in the high penetration scenario:
A reduction in fuel consumption of 3% when approaching an intersection. The authors scaled this impact to EU-27 level based on the number of approaching vehicles at signalised

Study on the Deployment of C-ITS in Europe: Final Report | 164
Ricardo in Confidence Ref: Ricardo/ED60721/Issue Number 1
Ricardo Energy & Environment
intersections in EU-27 countries. The number of approaching vehicles per year at signalised intersections in the EU-27 was estimated to be 1.708 trillion, concentrated on rural and urban roads (estimated to be 70% for urban and 30% for rural), as shown in Table 12-5. Although the amount of signalised intersections was known at the EU level, the number of approaching vehicles was estimated based on data from the Netherlands, as information for the EU was not available.
Table 12-5. Estimation of the number of vehicles approaching intersections in EU-27 countries per year (Source: DRIVE C2X)
Road type Low demand (billions) High demand (billions)
High speed roads 0 0
Rural roads 358.7 153.7
Urban roads 837.0 358.7
An overall reduction in fuel consumption of 219,729 tonnes on rural roads and 512,702 on urban roads when scaled up to EU-27 level.
This is equivalent to a 0.1% reduction in fuel consumption on rural roads and a 0.7% reduction in fuel consumption on urban roads.
The DRIVE C2X values are lower than an earlier TNO study which estimated that traffic signal optimisation could lead to a 2% reduction in CO2 emissions on an EU-27 level. We have opted to use the DRIVE C2X figures in the modelling as they are based on FOT data.
12.2.12.3.3 Environmental and emissions impacts
Only the DRIVE C2X study presented detailed results about the impact of GLOSA on vehicle emissions. Per intersection approach, the following effects were observed:
Reductions in CO and HC emissions of 15.5% and 40.2%. The levels of changes to these pollutants are large because they are highly sensitive to acceleration and braking.
Reduction in NOx emissions of 3.2%
The authors scaled these figures up to EU-27 level by road type to give the impact on each pollutant in tonnes per year. These absolute emissions reductions were converted to percentages based on the annual pollutant emissions by road type from TRT’s ASTRA and TRUST models. The following inputs were used in the model:
CO: 0.3% reduction (non-motorway non-urban roads), 0.8% (urban roads)
NOx: 0.1% reduction (non-motorway non-urban roads), 0.2% (urban roads)
VOCs: 0.5% reduction (non-motorway non-urban roads), 0.6% (urban roads)
PM: 0.1% reduction (non-motorway non-urban roads), 0.0% (urban roads)
12.2.12.3.4 Safety
GLOSA was found to have minor safety benefits in the DRIVE C2X study (TNO et al., 2014), mainly as a consequence of the lower number of vehicles needing to stop at traffic lights. Since the primary objective of GLOSA is not safety-related, it is to be expected that the overall impacts are small.
Specifically, positive effects that were expected are:
On average, drivers will need to stop at traffic lights less with GLOSA. The probability of a rear-end collision is therefore reduced.
Smoother driving behaviour is expected on the approach to traffic lights, reducing both the risk and severity of a collision.
Drivers will, on average, approach traffic lights at a lower speed with GLOSA.

Study on the Deployment of C-ITS in Europe: Final Report | 165
Ricardo in Confidence Ref: Ricardo/ED60721/Issue Number 1
Ricardo Energy & Environment
Abrupt and indecisive braking behaviour will be eliminated due to the information GLOSA provides to drivers. This will reduce the risk and impact of rear-end crashes, limit red light violations and reduce angle-crashes.
However, the study also suggests that GLOSA may be less effective and less reliable for adaptive or actuated traffic lights, as these are dependent on unpredictable traffic flows. The service may also distract drivers, resulting in decreased attention on the road ahead, due to focussing on the in-vehicle advisory system. This is expected to be minor and may be limited further by good design on the in-vehicle interface.
The effectiveness of GLOSA was found to be highly dependent on penetration rate and traffic intensity. Safety effects were presented as a percentage reduction in fatalities or injuries in 2030 for 100% infrastructure penetration. In the high scenario in 2030, the average fatalities prevented was estimated to be 0.1% on both urban and rural roads, while the average number of injuries prevented was estimated to be 0.1% on rural roads and 0.3% on urban roads.
12.2.12.3.5 Other impacts
Stakeholder inputs during the DRIVE C2X project suggest that user acceptance for GLOSA is very high, with 86% of drivers rating the service as useful, while 50% claimed they would be willing to pay for use of the feature if it was available in their vehicle (TNO et al., 2014).
Qualitative effects of GLOSA were reported as improvements in terms of decreased stress and uncertainty, and an increased feeling of safety and comfort. The typical mean agreement values for comfort were 4.9-5.6 (on a scale from 1, strongly disagree to 7, strongly agree), for safety approximately 4.8 and for stress 4.7-5.2. Stress and uncertainty were also assessed on a scale from -3 to 3 (decrease-increase), and the typical mean values for those scales were approximately -0.5 for stress and from -1.0 to -0.2 for uncertainty.
There were no reported impacts on modal shift.

Study on the Deployment of C-ITS in Europe: Final Report | 166
Ricardo in Confidence Ref: Ricardo/ED60721/Issue Number 1
Ricardo Energy & Environment
12.2.13 Signal violation/Intersection safety (SigV)
12.2.13.1 Service overview
The primary objective of this service is to reduce the number and severity of collisions at signalised intersections.
12.2.13.2 Technical information
Day 1 V2I service, likely based on ITS-G5 communication
Bundle 3
This service, also known as the Red Light Violation Warning (RLVW), allows for drivers to be warned when they are in danger of violating a red light, or when it is probable that another vehicle is going to make a red light violation. It is applicable to all vehicle types and is particularly suitable in urban areas, where intersections are generally sited.
12.2.13.3 Impact data
The main data sources for the impacts of signal violation/intersection safety were the eIMPACT project (TNO, VTT, Movea, PTV, BASt, 2008) and SAFESPOT study. An overview of the general methodology for the eIMPACT study is provided in Box 3.
12.2.13.3.1 Traffic efficiency
The SAFESPOT study assumes that no traffic impacts are experienced but refers to the statement in the eIMPACT study that traffic effects are expected but have not been proven (SAFESPOT, 2010). As no quantitative estimates have been given in the literature, it is assumed that this service will not have an impact on traffic efficiency.
12.2.13.3.2 Fuel consumption and CO2
No data was identified for this impact category in the reports reviewed. Fuel consumption impacts for this service are assumed to be zero.
12.2.13.3.3 Environmental and emissions impacts
No data was identified for this impact category in the reports reviewed. Impacts on vehicle emissions for this service are assumed to be zero.
12.2.13.3.4 Safety
The primary objective of this service is to improve safety at traffic intersections. A review of the reports covering this service revealed that the intersection safety service is defined differently depending on the study, with some studies including additional functionality such as GLOSA. A summary of the safety impacts stated in the studies reviewed is given in Table 12-6.
Table 12-6. Summary of safety impacts of the intersection safety service reported in other European studies
Study Fatalities (reduction) Injuries (reduction) Scenario
eIMPACT 3.9% (includes GLOSA / TTG)
7.3% (includes GLOSA / TTG)
100% penetration
EU-25, 2020
SAFESPOT
0.7% (V2V left-turn assist only)
3.1% (V2I red light violation, left and right turn assistance)
2.2% (V2V left-turn assist only)
4.8% (V2I red light violation, left and right turn assistance)
100% penetration
EU-25, 2020

Study on the Deployment of C-ITS in Europe: Final Report | 167
Ricardo in Confidence Ref: Ricardo/ED60721/Issue Number 1
Ricardo Energy & Environment
Study Fatalities (reduction) Injuries (reduction) Scenario
CODIA 3.7% 6.9%
100% penetration, assuming all vehicles were equipped, regardless of the year.
The eIMPACT study states 3.9% reduction in fatalities, 7.3% reduction in injuries, assuming 100% penetration in at EU-25 level in 2020. GLOSA/TTG functionality is also included in the eIMPACT definition of this service. If the safety impacts of GLOSA (the high scenario in the DRIVE C2X study estimates a 0.1% reduction in fatalities and a 0.3% reduction injuries) are subtracted from the impact predicted by eIMPACT, the impact would be a 3.8% reduction in fatalities and a 7.0% reduction in injuries. These are very similar to those suggested by CODIA (VTT, TRL, 2008).
The SAFESPOT study evaluated two intersection safety functions. The first function, a V2V service called “lateral collision – road intersection safety” assessed the impact of in-vehicle left-turn assistance (SAFESPOT, 2010). Assuming 100% penetration in the EU-25 in 2020, the estimated impact of this service is a 0.7% reduction in fatalities and a 2.2% reduction in injuries. These results are based on the PReVAL project, which follows the same methodological approach implemented by the eIMPACT study. Another intersection safety function evaluated by SAFESPOT was the “Intelligent Cooperative Intersection Safety system – IRIS” service, which is based on V2I communication. This service primarily aims to prevent red light violations, although also includes left and right turn assistance. The estimated impact of this service, assuming 100% penetration, is a 3.1% reduction in fatalities and a 4.8% reduction in injuries at EU-25 level (SAFESPOT, 2010). These results are based on the findings of the eIMPACT and CODIA projects. If the impacts of the two SAFESPOT intersection safety services are added together, a 3.8% reduction in fatalities and a 7.0% reduction in injuries is found.
The CODIA study also assessed the impact of cooperative intersection collision warning. This report estimated a 3.7% reduction in fatalities and a 6.9% reduction in injuries at a 100% penetration rate, providing the system is used in all intersections in the EU (VTT, TRL, 2008).
Based on the above, the most appropriate figure was selected as the eIMPACT estimation (with GLOSA impacts subtracted). A 3.8% reduction in fatalities and a 7.0% reduction in injuries on urban roads, and non-motorway non-urban roads were used as inputs to the modelling. These percentages were applied to all vehicle types and are very similar to those stated by the SAFESPOT and CODIA studies.
12.2.13.3.5 Other impacts
No data related to other impacts was identified in the reports reviewed.

Study on the Deployment of C-ITS in Europe: Final Report | 168
Ricardo in Confidence Ref: Ricardo/ED60721/Issue Number 1
Ricardo Energy & Environment
12.2.14 Traffic signal priority request by designated vehicles (TSP)
12.2.14.1 Service overview
The traffic signal priority request by designated vehicles allows drivers of priority vehicles (for example emergency vehicles, public transport, HGVs) to be given priority at signalised junctions.
12.2.14.2 Technical information
Day 1 V2I service, likely based on ITS-G5 communication
Bundle 3
This service works by either extending or terminating the current traffic light phase, to ensure that the required phase is displayed. Different levels of priority can be applied, depending on the vehicle type. For example, emergency vehicles may be given the highest priority, whereas the appropriate level of green priority for a public transport vehicle may be dependent on its current status, i.e. whether it is on-time or behind schedule. This has the potential to deliver a variety of benefits. Safety benefits may be gained by extending the phase for emergency vehicles travelling at speed, efficiency benefits for public transport and environmental benefits gained when reducing the need for vehicles to repeatedly brake and accelerate through signalised intersections. This service is most suitable for urban environments and is applicable for all vehicle types except passenger cars. Whilst it is expected to rely primarily on V2I ITS-G5 communication, a number of projects are looking to demonstrate its effectiveness using high-speed (e.g. 4G/5G) cellular networks.
12.2.14.3 Impact data
The main data sources for the impacts of the traffic signal priority request by designated vehicles service were the eSafetyForum Intelligent Infrastructure Working Group’s Final Report and the COMeSafety project. An overview of the general methodology of the eSafetyForum report is provided in Box 6.
To our knowledge, despite several European FOTs trialling this service, there are no other publically available studies that specifically examine traffic signal priority request by designated vehicles as a C-ITS service.
The limited information from the above two reports was therefore supplemented by additional desk research into traffic signal priority systems – this yielded one particularly useful source of information, namely a study by the UITP Working Group (TfL, TRL, University of Southampton, 2009) on the interaction of buses and signals at road crossings. This study analysed a number of European city bus priority projects, summarising travel time reduction data for buses equipped with a variety of bus priority systems allowing them to interact with traffic lights to smooth their passage through signalised intersections. One such example is the SCOOT system currently being trialled by Transport for London. Whilst not using the ITS-G5 protocols discussed in this study, some of the systems discussed in this study could loosely fall within the definition of C-ITS services and operate through very similar mechanisms to the C-ITS service discussed here. It was therefore deemed appropriate to use input data from this study to estimate impacts data from first principles.
12.2.14.3.1 Traffic efficiency
Traffic signal priority request will only be available to certain vehicles on non-motorway non-urban roads and urban roads. For the purposes of the modelling, it is assumed that this service will only apply to public transport and not passenger cars or freight vehicles. In most situations, there will also be secondary effects on non-bus users. This is captured in the modal shift element of TRT’s ASTRA model.
The eSafetyForum literature review suggests that requesting green/signal priorities can lead to a 1-2% reduction in congestion, however this cannot be easily translated into an impact on urban travel speed, which is the required input for the modelling.
In the absence of data from specific C-ITS studies, data from the UITP Working Group report was therefore used as an input to the model. Quantitative estimates of travel time savings for bus priority systems were given for trials in the following cities: Aalborg, Cardiff, Genoa, Gothenburg, Helsinki, Prague, Stockholm, Stuttgart, Toulouse and Turin. The average saving was a 9.2% reduction in travel time for buses equipped with some form of traffic signal priority system.

Study on the Deployment of C-ITS in Europe: Final Report | 169
Ricardo in Confidence Ref: Ricardo/ED60721/Issue Number 1
Ricardo Energy & Environment
12.2.14.3.2 Fuel consumption and CO2
Reduced fuel consumption is one of the main objectives of this service. The eSafetyForum report suggests that requesting green/signal priorities can lead to a 1-3% impact reduction in carbon dioxide emissions, while results of the FREILOT project show that HGVs equipped with this service reported reductions in fuel consumption of up to 20% (CRF, BASt, ERTICO, VOLVO, Hess-Consult, BMW, 2014). The FREILOT project was a FOT based on 11 intersections, with 7 trucks equipped with a number of services, including traffic signal priority, energy efficient driving (which provided speed advice and indicated when to shift up or down in order to save energy) and remote parking spot booking for loading and unloading. However given the lack of references in the eSafetyForum output and the difficulty in separating traffic signal priority from other services in the FREILOT project, it was decided to estimate fuel consumption and CO2 savings using the results of the UITP Working Group study referenced above.
To this end, the average speed of buses without any traffic signal priority service installed was estimated from the UITP Working Group study at 15.3 kph, alongside the improved speed (9.2% reduction in time spent travelling) of 17.2 kph. This difference in speed was used as an input to Ricardo Energy and Environment’s speed-emissions curve model, which is able to estimate the impact on CO2/fuel consumption, NOx and PM10 emissions.
The total improvement in fuel consumption and CO2 emissions was therefore estimated as 8.28% across all buses in urban environments.
12.2.14.3.3 Environmental and emissions impacts
NOx and PM emissions were estimated using the same speed-emissions curve model as for fuel consumption/CO2. Total improvement in NOx and PM emissions were estimated at 8.04% and 8.17% respectively across all buses in urban environments.
For CO and VOC emissions, these were assumed to be proportional to fuel consumption savings, and therefore estimated at an 8.28% reduction for urban buses.
12.2.14.3.4 Safety
No data was identified for this impact category in the reports reviewed and given that this service will most likely only be available to a limited number of vehicles, it is assumed that the impact on safety at an EU-level will be negligible for this service and it is not included in the model.
12.2.14.3.5 Other impacts
No data related to other impacts was identified in the reports reviewed.

Study on the Deployment of C-ITS in Europe: Final Report | 170
Ricardo in Confidence Ref: Ricardo/ED60721/Issue Number 1
Ricardo Energy & Environment
12.2.15 On street parking information and management (Pinfo)
12.2.15.1 Service overview
The provision of on-street parking information is intended to bring efficiency benefits to drivers and help to reduce emissions in urban areas by reducing the time spent ‘cruising’ at low speeds.
12.2.15.2 Technical information
Day 1 V2I service, which is based on a hybrid communications concept (cellular or ITS-G5, depending on the infrastructure equipment)
Bundle 4
Parking space availability is provided to interested vehicles, decreasing the amount of time spent searching for a safe, and appropriate place to park. This service is anticipated to be most applicable for urban roads, where on-street parking space availability is often limited and therefore in high demand. It is applicable for all vehicle types except public transport but will be most useful for drivers of cars. As for off street parking information, this service may include the functionality to book parking spaces in advance.
12.2.15.3 Impact data
The only data source which covered the potential impacts of the on street parking information service was the eSafetyForum Intelligent Infrastructure Working Group’s Final Report. An overview of the general methodology of the eSafetyForum report is provided in Box 6.
The information from this report was supplemented by additional desk research into the provision of parking information services and the time spent searching for parking spaces. A number of reports were used to estimate the impact of this service from first principles, as referenced below.
12.2.15.3.1 Traffic efficiency
Traffic efficiency improvements are expected to be the main benefit of this service. No data was identified for this impact category in the reports reviewed. The following methodology was therefore used to estimate impacts on traffic efficiency from first principles:
Identify the time spent looking for a parking space in a Member State. o In France, an estimated 70 million hours per year is spent ‘cruising’ trying to find
parking (Gantelet & Lefauconnier, 2006).
Scale this to EU level, based on total vehicle kilometres driven in urban areas (based on data for the EU-27 from TRT’s ASTRA model).
o Gives an estimated 450,272,549 hours ‘cruising’ per year for the EU
Apply an effectiveness factor to the parking information C-ITS service. o 3.5 times less time spent cruising for parking to final destination when parking
information is shown (or a 71% effectiveness), according to a report published by the University of Zurich (Tsiaras, Hobi, Hofstetter, Liniger, & Stiller, 2015).
Use this number to estimate the total change in time spent driving on urban roads from deploying parking information services to all vehicles at an EU level.
o 0.61% reduction in travel time/improvement in speed in urban areas across passenger and freight vehicles.
12.2.15.3.2 Fuel consumption and CO2
The average speed of vehicles when ‘cruising’ for parking spaces in urban areas was estimated at half the average speed limit for urban areas (Tsiaras, Hobi, Hofstetter, Liniger, & Stiller, 2015), i.e. 15 kph in the EU.
This speed was used as an input to Ricardo Energy and Environment’s speed-emissions curve model, which is able to estimate the impact in g/km on CO2/fuel consumption, NOx and PM10 emissions. Using the total time spent ‘cruising’ and average speed of ‘cruising’ referenced above, a total EU-level cruising distance could be determined, from which the total EU-level emissions impacts could be estimated.

Study on the Deployment of C-ITS in Europe: Final Report | 171
Ricardo in Confidence Ref: Ricardo/ED60721/Issue Number 1
Ricardo Energy & Environment
The total resultant improvement in fuel consumption and CO2 emissions was estimated from the above methodology as 0.79% across passenger and freight vehicles in urban environments.
12.2.15.3.3 Environmental and emissions impacts
NOx and PM emissions were estimated using the same speed-emissions curve model as for fuel consumption/CO2. Total improvement in NOx and PM emissions were estimated at 0.26% and 0.07% respectively across all passenger and freight vehicles in urban environments.
For CO and VOC emissions, these were assumed to be proportional to fuel consumption savings, and therefore estimated at a 0.79% reduction for urban passenger and freight vehicles.
12.2.15.3.4 Safety
The eSafetyForum reports that parking information and guidance will have zero impact on safety. Whilst there may be secondary impacts due to reduced congestion in urban areas, no data exists to support this and the safety impacts were therefore assumed to be zero.
12.2.15.3.5 Other impacts
No data related to other impacts was identified in the reports reviewed.

Study on the Deployment of C-ITS in Europe: Final Report | 172
Ricardo in Confidence Ref: Ricardo/ED60721/Issue Number 1
Ricardo Energy & Environment
12.2.16 Off street parking information and management (PMang)
12.2.16.1 Service overview
The provision of on-street parking information is intended to bring efficiency benefits to drivers and help to reduce emissions in urban areas by reducing the time spent ‘cruising’ at low speeds.
12.2.16.2 Technical information
Day 1 V2I service, which is based on a hybrid communications concept (cellular or ITS-G5, depending on the infrastructure equipment)
Bundle 4
Parking space availability is provided to interested vehicles, decreasing the amount of time spent searching for a safe and appropriate place to park. This service is applicable for all road types and all vehicle types except for public transport. It may be particularly useful for long-distance HGV drivers. In the future, this service may include advance booking capability. This will deliver efficiency and environmental benefits.
12.2.16.3 Impact data
To our knowledge, there are no other publically available studies that specifically examine off street parking information. Impacts for off street parking were assumed to be similar to on street parking, therefore the same values have been used as inputs to the modelling.
12.2.16.3.1 Traffic efficiency
No data was identified for this impact category in the reports reviewed, therefore the same value as for on street parking was used: a 0.61% reduction in travel time/improvement in speed in urban areas across passenger and freight vehicles was used as the modelling input .
12.2.16.3.2 Fuel consumption and CO2
No data was identified for this impact category in the reports reviewed, therefore the same value as for on street parking was used: a 0.79% reduction in fuel consumption/CO2 in urban areas across passenger and freight vehicles was used as an input to the modelling.
12.2.16.3.3 Environmental and emissions impacts
No data was identified for this impact category in the reports reviewed, therefore the same values as for on street parking were used as inputs to the modelling. These are summarised below:
NOx: 0.26% reduction in urban areas across passenger and freight vehicles
PM: 0.07% reduction in urban areas across passenger and freight vehicles
CO: 0.79% reduction in urban areas across passenger and freight vehicles
VOC: 0.79% reduction in urban areas across passenger and freight vehicles
12.2.16.3.4 Safety
The eSafetyForum Intelligent Infrastructure Working Group Report suggested that parking information services will have zero impact on safety. Whilst there may be secondary impacts due to reduced congestion in urban areas, no data exists to support this and the safety impacts were therefore assumed to be zero.
12.2.16.3.5 Other impacts
No data related to other impacts was identified in the reports reviewed.

Study on the Deployment of C-ITS in Europe: Final Report | 173
Ricardo in Confidence Ref: Ricardo/ED60721/Issue Number 1
Ricardo Energy & Environment
12.2.17 Park & Ride information (P&Ride)
12.2.17.1 Service overview
The provision of Park & Ride information is intended to reduce congestion in urban areas and also shift travel from cars to public transport.
12.2.17.2 Technical information
Day 1 V2I service, which is based on a hybrid communications concept (cellular or ITS-G5, depending on the infrastructure equipment)
Bundle 4
In combination with other parking information services, this will allow drivers to determine the most suitable parking option, while also allowing maximum utilisation from the perspective of the operator. This improves overall network efficiency and can deliver efficiency and environmental benefits. This service is applicable to all road types and is most applicable to personal cars.
12.2.17.3 Impact data
To our knowledge, there are no other publically available studies that specifically examine the impacts of this service.
12.2.17.3.1 Traffic efficiency
Park and ride schemes are designed to reduce congestion in urban areas, therefore some traffic efficiency impacts are to be expected. However, these urban efficiency gains do not occur directly with the vehicle using the service, since the impact of the service will be to increase the likelihood of the vehicle in question using Park & Ride services – thereby preventing it entering the congested urban area. This makes it very difficult to estimate the impact on efficiency from first principles. In the absence of any data for this impact category in the reports reviewed, it was assumed that the service would have zero impact on speed in urban areas.
12.2.17.3.2 Fuel consumption and CO2
Park and ride schemes are designed to reduce congestion in urban areas and to shift travel by car to public transport. Some passenger car fuel consumption benefits are to be expected, however there is a lack of data quantifying this effect in the literature. As an input to the modelling the same fuel saving as for the on-street parking service was assumed, i.e. 0.79% for passenger cars only.
12.2.17.3.3 Environmental and emissions impacts
No data was identified for this impact category in the reports reviewed. As an input to the modelling the same impacts as for the on-street parking service were used, as shown below:
NOx: 0.26% reduction in urban areas for passenger vehicles
PM: 0.07% reduction in urban areas for passenger vehicles
CO: 0.79% reduction in urban areas for passenger vehicles
VOC: 0.79% reduction in urban areas for passenger vehicles
12.2.17.3.4 Safety
The eSafetyForum Intelligent Infrastructure Working Group Report suggested that parking information services will have zero impact on safety. Whilst there may be secondary impacts due to reduced congestion in urban areas, no data exists to support this and the safety impacts were therefore assumed to be zero.
12.2.17.3.5 Other impacts
No data related to other impacts was identified in the reports reviewed.

Study on the Deployment of C-ITS in Europe: Final Report | 174
Ricardo in Confidence Ref: Ricardo/ED60721/Issue Number 1
Ricardo Energy & Environment
12.2.18 Information on alternative fuelled vehicle charging and fuelling stations (iFuel)
12.2.18.1 Service overview
The objective of this service is to broadcast electric vehicle charging point availability and AFV fuelling point information to relevant vehicles.
12.2.18.2 Technical information
Day 1 V2I service, which is based on a hybrid communications concept (cellular or ITS-G5, depending on the infrastructure equipment)
Bundle 4
This service allows users to be informed of and book charging point time windows for fuelling and charging stations for alternative fuels. This enables a more convenient driving experience and allows for vehicle owners to plan routes according to the location of appropriate refuelling points; eBilling information may also be included. This service is applicable on all road types and is currently focussed on cars, bringing vehicle operation and efficiency benefits. As technologies advance and fleet composition changes, this service may be applicable to additional vehicle types.
12.2.18.3 Impact data
To our knowledge, there are no publically available studies that specifically examine the impacts of this service. This service has a large overlap with the traffic information and smart routing service. This services is therefore considered to be included within the traffic information and smart routing service for the purpose of the modelling.
12.2.18.3.1 Traffic efficiency
All impacts are included within the traffic information and smart routing service for the modelling.
12.2.18.3.2 Fuel consumption and CO2
All impacts are included within the traffic information and smart routing service for the modelling.
12.2.18.3.3 Environmental and emissions impacts
All impacts are included within the traffic information and smart routing service for the modelling.
12.2.18.3.4 Safety
All impacts are included within the traffic information and smart routing service for the modelling.
12.2.18.3.5 Other impacts
No data related to other impacts was identified in the reports reviewed.

Study on the Deployment of C-ITS in Europe: Final Report | 175
Ricardo in Confidence Ref: Ricardo/ED60721/Issue Number 1
Ricardo Energy & Environment
12.2.19 Traffic information and smart routing (SmartR)
12.2.19.1 Service overview
The provision of traffic information and smart routing services to vehicles is intended to improve traffic efficiency and aid traffic flow management.
12.2.19.2 Technical information
Day 1 V2I service, which is based on a hybrid communications concept (cellular or ITS-G5, depending on the infrastructure equipment)
Bundle 5
Traffic flow management is achieved by optimising routes based on traffic flows, traffic lights and speed limits and by offering re-routing suggestions to vehicles based on real-time traffic information status alerts. This service is applicable to all road and vehicle types (except public transport) and is expected to deliver efficiency, vehicle operation and environmental benefits by limiting congestion.
12.2.19.3 Impact data
The main data sources for the impacts of the traffic information and smart routing service were the eSafetyForum Intelligent Infrastructure Working Group’s Final Report, the iMobility Effects Database (VTT, 2010) and the TNO report on the impact of information and communication technologies on energy efficiency in the road transport sector.
12.2.19.3.1 Traffic efficiency
The only report to assess traffic efficiency was the eSafetyForum report. This reported results for three related services: real time event information, real time traffic condition information, and travel time information. All services show a 1-15% reduction in congestion. In the absence of more precise data, the mid-point of this range was used for the modelling, i.e. an 8% improvement in traffic speed for both passenger and freight vehicles – only applicable in urban areas.
12.2.19.3.2 Fuel consumption and CO2
The eSafetyForum report presents results for three services: real time event information, real time traffic condition information, and travel time information, which all show a 1-10% reduction in fuel consumption/CO2 emissions. Further information about this service is not given and the report does not state whether these are the expected benefits at an EU-level.
In a study performed by TNO on the impact of information and communication technologies on energy efficiency in the road transport sector (TNO, 2009), a service called ‘fuel efficient route choice’ was assessed. This was calculated to have a 2.1% impact on fuel consumption at an EU level. As the emphasis of this service was on maximising fuel efficiency, rather than shortest journey time, the fuel savings benefits are expected to be lower than this value.
Another similar service assessed by TNO is the freight specific, trip departure planning service. The objective of this service is to ensure fleet journey time is minimised, based on real, current and predicted traffic conditions. This is a similar function as the traffic information and smart routing service defined in this report. In the TNO study, the trip departure planning service was estimated to have a 1.8% (reduction) impact on fuel consumption/CO2 emissions at an EU level, if implemented in all freight vehicles.
Due to limited other data for the traffic information and smart routing service, an average of the figures stated for the two TNO services was used and applied to all vehicles (except public transport) and road types. This gives a 1.95% impact on fuel consumption/CO2 emissions for passenger and freight vehicles across all road types. This figure is supported by the iMobility Effects Database, which reports a 2% impact on CO2 emissions at an EU level. (VTT, 2015)
12.2.19.3.3 Environmental and emissions impacts
No data was identified for this impact category in the reports reviewed, therefore emissions impacts were scaled using the ratio between fuel/CO2 impacts and emissions impacts for the in-vehicle speed limit service in urban areas. This resulted in the following impacts on emissions:

Study on the Deployment of C-ITS in Europe: Final Report | 176
Ricardo in Confidence Ref: Ricardo/ED60721/Issue Number 1
Ricardo Energy & Environment
NOx: 0.4% reduction on motorways, 1.7% reduction on non-motorway non-urban roads, 0.5% reduction on urban roads
PM: 0.3% reduction on motorways, 0.8% reduction on non-motorway non-urban roads, 0.1% reduction on urban roads
CO: 0.2% reduction on motorways, 4.2% reduction on non-motorway non-urban roads, 2.3% reduction on urban roads
VOCs: 0.1% increase on motorways, 6.5% reduction on non-motorway non-urban roads, 1.7% reduction on urban roads
12.2.19.3.4 Safety
No data was identified for this impact category in the reports reviewed. It is likely that this service could indirectly lead to safety benefits due to reduced driver hesitation and reduced congestion, however no reports quantify this effect. In the modelling this service is assumed to have no impact on safety.
12.2.19.3.5 Other impacts
No data related to other impacts was identified in the reports reviewed.

Study on the Deployment of C-ITS in Europe: Final Report | 177
Ricardo in Confidence Ref: Ricardo/ED60721/Issue Number 1
Ricardo Energy & Environment
12.2.20 Zone access control for urban areas (ZACM)
12.2.20.1 Service overview
The zone access control service is intended to manage access to specified zones. Using this information, drivers will be better informed and will be able to select the most appropriate route for their journey.
12.2.20.2 Technical information
Day 1 V2I service, which is based on a hybrid communications concept (cellular or ITS-G5, depending on the infrastructure equipment)
Bundle 6
Zone access control is likely to assist with the management of low emission zones (LEZs) and congestion charging schemes through communication between the vehicle and roadside sensing infrastructure. Drivers will be informed when entering a managed zone and may be charged depending on the type of access control implemented and/or the exhaust emissions characteristics of the vehicle. This service is intended to reduce congestion and bring environmental benefits. It is mainly applicable to urban areas and HGVs/cars, although could potentially be implemented on any road or vehicle type.
12.2.20.3 Impact data
The main data sources for the impacts of the zone access control for urban areas service were the eSafetyForum Intelligent Infrastructure Working Group’s Final Report and a study by TNO on the impact of information and communication technologies on energy efficiency in road transport (eSafetyForum, 2010; TNO, 2009). An overview of the general methodology of the eSafetyForum report is provided in Box 6.
12.2.20.3.1 Traffic efficiency
The impact of zone access control will be dependent on the individual schemes implemented in each urban area. Very little data is available about this service, therefore it is assumed that the impact on traffic efficiency impact on cars and buses is zero.
12.2.20.3.2 Fuel consumption and CO2
Information about the impact of zone access control for urban areas was limited to congestion charging zones; no information was found about zones that do not charge vehicles for entry. The eSafetyForum report estimated a 10-20% reduction in carbon dioxide emissions for road user charging, however the level of information provided was not sufficient enough for us to realistically scale this value to an EU-level, as required for the modelling (eSafetyForum, 2010). The TNO report calculated the impact of congestion charging to be a 0.5% reduction in CO2 emissions in the EU-27, which is equivalent to a 0.5% reduction in fuel consumption (TNO, 2009). This value is used as the input to the modelling for this service and is applied to freight and passenger vehicles in urban areas.
12.2.20.3.3 Environmental and emissions impacts
No data was identified for this impact category in the reports reviewed, therefore emissions impacts were scaled using the ratio between fuel/CO2 impacts and emissions impacts for the in-vehicle speed limit service in urban areas. This resulted in the following impacts on emissions:
0.12% reduction in NOx emissions across freight and passenger vehicles in urban areas
0.04% reduction in PM emissions across freight and passenger vehicles in urban areas
0.58% reduction in CO emissions across freight and passenger vehicles in urban areas
0.44% reduction in VOC emissions across freight and passenger vehicles in urban areas
12.2.20.3.4 Safety
No specific data was identified for this impact category in the reports reviewed, however a number of reports have suggested that congestion charging zones may indirectly lead to safety impacts.
For example, a study recently published by the University of Lancaster Management School suggested that implementation of the London Congestion Charge Zone has had an impact on road safety. The

Study on the Deployment of C-ITS in Europe: Final Report | 178
Ricardo in Confidence Ref: Ricardo/ED60721/Issue Number 1
Ricardo Energy & Environment
authors suggested that the policy caused a reduction in the number and severity of accidents within the congestion zone and surrounding areas.
While this service may have indirect safety benefits, this is not the primary objective of the service and with insufficient evidence to attribute a specific safety impact to this service, the safety impact was assumed to be zero.
12.2.20.3.5 Other impacts
No data related to other impacts was identified in the reports reviewed.

Study on the Deployment of C-ITS in Europe: Final Report | 179
Ricardo in Confidence Ref: Ricardo/ED60721/Issue Number 1
Ricardo Energy & Environment
12.2.21 Loading zone management (LZM)
12.2.21.1 Service overview
This service is intended to support the driver, fleet manager and road operator in the booking, monitoring and management of urban parking zones specific to freight vehicles.
12.2.21.2 Technical information
Day 1 V2I service, which is based on a hybrid communications concept (cellular or ITS-G5, depending on the infrastructure equipment)
Bundle 6
The driver or fleet operator can book urban loading bays in advance, specifying the planned delivery time, loading/unloading time required and vehicle type. Additional information such as desired flexibility in the delivery time and the estimated time to reach the parking zone may also be provided. This feature may utilise interaction with other C-ITS services, such as traffic information and smart routing. The fleet operator can therefore optimize delivery times, reduce driver stress and anticipate congestion problems, whereas the road operator can optimize the management of loading zones through increased knowledge of the delivery time period and duration. This service is primarily applicable in urban areas.
12.2.21.3 Impact data
Despite several European FOTs incorporating this service, to our knowledge, there are no publically available studies that specifically examine the impacts of this service.
12.2.21.3.1 Traffic efficiency
No data was identified for this impact category in the reports reviewed. Loading zone management is only applicable to freight vehicles. The ASTRA traffic efficiency model used in this study only takes into consideration cars and buses, therefore this service was not modelled for this impact category.
12.2.21.3.2 Fuel consumption and CO2
No data was identified for this impact category in the reports reviewed, although this service is expected to have similar impacts to parking services discussed in previous sections. As no other data specific to freight vehicles was available, the same input data was used as for the on-street parking information and management service. A 0.79% reduction in fuel savings/CO2 emissions for light trucks and heavy trucks on urban roads was therefore used as an input to the modelling.
12.2.21.3.3 Environmental and emissions impacts
No data was identified for this impact category in the reports reviewed, although this service is expected to have similar impacts to parking services discussed in previous sections. The following impacts on emissions were therefore assumed:
NOx: 0.26% reduction for light trucks and heavy trucks travelling on urban roads
PM: 0.07% reduction for light trucks and heavy trucks travelling on urban roads
CO: 0.79% reduction for light trucks and heavy trucks travelling on urban roads
VOCs: 0.79% reduction for light trucks and heavy trucks travelling on urban roads
12.2.21.3.4 Safety
No data was identified for this impact category in the reports reviewed.
12.2.21.3.5 Other impacts
No data related to other impacts was identified in the reports reviewed.

Study on the Deployment of C-ITS in Europe: Final Report | 180
Ricardo in Confidence Ref: Ricardo/ED60721/Issue Number 1
Ricardo Energy & Environment
12.2.22 Vulnerable road user protection – pedestrians and cyclists (VRU)
12.2.22.1 Service overview
This is a safety focussed service, which is intended to protect vulnerable road users. In this vase vulnerable road users are considered to be pedestrians and cyclists only.
12.2.22.2 Technical information
Day 1.5 V2X (where X signifies a pedestrian or cyclist), likely to be based on ITS-G5 communication
Bundle 7
This service is designed to increase safety by alerting drivers of the presence of vulnerable road users (those outside the vehicle such as pedestrians, cyclists).This may be achieved via communication with a smartphone, or in the case of cyclists, via communication with a C-ITS device fitted on the bike. In the case that installing ITS-G5 capability is not practical within smartphones, this service could be based on a cellular technology, provided it offers sufficiently low latency. Vulnerable road user protection is applicable to all vehicle types and is expected to bring safety benefits to all road types, however the majority of benefits are expected to be on urban roads.
12.2.22.3 Impact data
To our knowledge, there are currently no publically available studies that specifically examine the impacts of this service, however it is anticipated that results from the VRU ITS project will soon be available.
The eIMPACT project evaluated a non-cooperative intelligent transport service called “pre-crash protection of vulnerable road users”. This is similar to the vulnerable road user protection service evaluated in this study, however in eIMPACT it was not considered to be a cooperative system and was assumed to operate by detecting vulnerable road users via sensors. The two services are likely to present information to the driver in a similar manner and safety impacts will occur via similar mechanisms, therefore the data presented can be applied to the cooperative service.
12.2.22.3.1 Traffic efficiency
No data was identified for this impact category in the reports reviewed. It is assumed that this service will not have an impact on traffic efficiency at an EU level.
12.2.22.3.2 Fuel consumption and CO2
No data was identified for this impact category in the reports reviewed. It is assumed that this service will not have an impact on fuel consumption at an EU level.
12.2.22.3.3 Environmental and emissions impacts
No data was identified for this impact category in the reports reviewed. It is assumed that this service will not have an impact on vehicle emissions at an EU level.
12.2.22.3.4 Safety
Due to the absence of other data, data from the eIMPACT project for the “pre-crash protection of vulnerable road users” was referenced. This was not considered to be a cooperative system, however the results provide a good indication of the expected impacts of a similar cooperative service, as both services are expected to display similar information to the driver.
Assuming a 100% penetration in EU-25 countries, the eIMPACT study estimated a 1.8% reduction in fatalities and a 1.9% reduction in injuries for the pre-crash protection of vulnerable road users (TNO, VTT, Movea, PTV, BASt, 2008). Discussions with experts confirmed that the majority of benefits of this service will be seen in urban areas. A 1.8% reduction in fatalities and a 1.9% reduction in injuries has therefore been used for non-motorway non-urban roads, and urban roads, applied to all vehicle types. This service was assumed to have no impact on safety on motorways in the modelling.
12.2.22.3.5 Other impacts
No data related to other impacts was identified in the reports reviewed.

Study on the Deployment of C-ITS in Europe: Final Report | 181
Ricardo in Confidence Ref: Ricardo/ED60721/Issue Number 1
Ricardo Energy & Environment
12.2.23 Cooperative collision risk warning (CCRW)
12.2.23.1 Service overview
The cooperative collision risk warning is intended to minimise the risk of collisions between vehicles, for example when overtaking, or when merging with traffic.
12.2.23.2 Technical information
Day 1.5 V2V safety focussed service, likely to be based on ITS-G5 communication
Bundle 8
If a collision is likely, warning messages can be sent between vehicles, meaning that drivers can be immediately alerted about a collision risk and take evasive action where necessary. This service is particularly useful if the danger is outside of the driver’s field of vision or in an area where there is poor visibility (for example when a vehicle is turning in the road, overtaking, or merging with traffic). This service is applicable to all road and vehicle types. Given the uncertainty around Day 1.5 services and the evolution of cellular networks, it is possible that this service could be offered via both ITS-G5 or cellular networks, provided it offers sufficiently low latency.
12.2.23.3 Impact data
To our knowledge, there are no publically available studies that specifically examine the impacts of this service.
12.2.23.3.1 Traffic efficiency
No data was identified for this impact category in the reports reviewed. However, the primary purpose of this service is to offer safety benefits to drivers and, given the relative infrequency of near-collision events, it is assumed that this service will not have an impact on traffic efficiency for the purposes of modelling.
12.2.23.3.2 Fuel consumption and CO2
No data was identified for this impact category in the reports reviewed. However, the primary purpose of this service is to offer safety benefits to drivers and, given the relative infrequency of near-collision events, it is assumed that this service will not have an impact on fuel consumption/CO2 emissions for the purposes of modelling.
12.2.23.3.3 Environmental and emissions impacts
No data was identified for this impact category in the reports reviewed. However, the primary purpose of this service is to offer safety benefits to drivers and, given the relative infrequency of near-collision events, it is assumed that this service will not have an impact on emissions for the purposes of modelling.
12.2.23.3.4 Safety
The primary purpose of this service is to offer safety benefits to drivers. No data was identified for this impact category in the reports reviewed, however in the eIMPACT study a number of services were assessed, which if combined could provide similar functionality to the cooperative collision risk warning described above. The services that could be combined are lane change assistant, emergency braking and intersection safety. Intersection safety impacts will only be relevant on urban and non-motorway non-urban roads, whereas lane change assist functionality will only be appropriate on motorways.
For lane change assistant, the impact on safety at a 100% penetration level in 2020 for the EU-25 are as follows:
Impact on fatalities: 2.2% reduction
Impact on injuries: 4.8% reduction
The lane change assistant figures were added to the average values obtained for emergency brake light and signal violation / intersection safety, which were discussed in earlier sections.

Study on the Deployment of C-ITS in Europe: Final Report | 182
Ricardo in Confidence Ref: Ricardo/ED60721/Issue Number 1
Ricardo Energy & Environment
The total impact on safety on motorways was estimated as follows:
Impact on fatalities: 2.2% (lane change assist) + 2.74% (emergency brake light) = 4.94% for all vehicle types
Impact on injuries: 4.8% (lane change assist) + 2.46% (emergency brake light) = 7.26% for all vehicle types
The total impact on safety on urban roads and non-motorway non-urban roads was estimated as follows:
Impact on fatalities: 2.74% (emergency brake light) + 3.8% (signal violation / intersection safety) = 6.54% for all vehicle types
Impact on injuries: 2.46% (emergency brake light) + 7% (signal violation / intersection safety) = 9.46% for all vehicle types.
Clearly there is considerable overlap between cooperative collision risk warning and other Day 1 services, such as emergency brake light and signal violation / intersection safety. These overlaps are accounted for in the service weighting used in the modelling, as described in Section 3.
12.2.23.3.5 Other impacts
No data related to other impacts was identified in the reports reviewed.

Study on the Deployment of C-ITS in Europe: Final Report | 183
Ricardo in Confidence Ref: Ricardo/ED60721/Issue Number 1
Ricardo Energy & Environment
12.2.24 Motorcycle approaching indication (MAA)
12.2.24.1 Service overview
This service is intended to increase safety and prevent collisions between motorcycles and other vehicles.
12.2.24.2 Technical information
Day 1.5 V2V service, likely to be based on ITS-G5 communication technology
Bundle 8
The motorcycle approaching indication has many similarities to the Cooperative collision risk warning service described above. Continual communication between the motorcycle and vehicle allows the driver to be informed of motorcycles that are passing, or about to pass. Positional and movement information is automatically compared to determine whether there is a safe driving distance between the vehicle and motorcycle. In the event of a possible collision being detected, drivers can be warned and adjust their driving accordingly. The service can also assist with blind spots. This service is applicable to all road and vehicle types, although it is mainly expected to be effective in urban areas where most motorcycle-related accidents occur. Given the uncertainty around Day 1.5 services and the evolution of cellular networks, it is possible that this service could be offered via both ITS-G5 or cellular networks, provided it offers sufficiently low latency.
12.2.24.3 Impact data
To our knowledge, there are no publically available studies that specifically examine the impacts of this service. As a result, additional desk research was carried out to identify data that could be used to estimate the impacts of the wrong way driving service from first principles. A number of sources were used to estimate the impact of this service, as referenced below.
12.2.24.3.1 Traffic efficiency
No data was identified for this impact category in the reports reviewed. As wrong way driving incidents are relatively rare occurrences, it is assumed that this service will not have an impact on traffic efficiency at an EU level.
12.2.24.3.2 Fuel consumption and CO2
No data was identified for this impact category in the reports reviewed. As wrong way driving incidents are relatively rare occurrences, it is assumed that this service will not have an impact on fuel consumption/ CO2 emissions at an EU level.
12.2.24.3.3 Environmental and emissions impacts
No data was identified for this impact category in the reports reviewed. As wrong way driving incidents are relatively rare occurrences, it is assumed that this service will not have an impact on emissions at an EU level.
12.2.24.3.4 Safety
Safety benefits are expected to be the primary goal of this services. Whilst no data was directly identified for this impact category in the reports reviewed, a number of alternative sources enabled an estimation of the impact of this service on safety from first principles:
Identify total number of motorcycle accidents in Europe: 5,500 motorcycle deaths in 2010 (CARE database, European Commission, 2015), assume half reduction rate achieved overall in DRIVEC2X, gives death rate of 3,960/year in 2025 (launch year).
Identify primary types of accidents targeted (ACEM, 2009; Honda, 2014):
o Motorcycle (MC) into other vehicle (OV) impact at intersection; paths perpendicular: 9% of motorcycle accidents
o OV into MC impact at intersection; paths perpendicular: 6% of motorcycle accidents
o OV turning left in front of MC, MC perpendicular to OV path: 9% of motorcycle accidents

Study on the Deployment of C-ITS in Europe: Final Report | 184
Ricardo in Confidence Ref: Ricardo/ED60721/Issue Number 1
Ricardo Energy & Environment
o MC & OV in opp. dir., OV turns in front of MC, MC impacting: 9% of motorcycle accidents
o Total = 33% of all motorcycle accidents = 1,307 deaths per year in 2025
Assume MAI impacts this death rate at effectiveness of 44.4% (eImpact, 2008)
Total reduction in EU accidents in 2025 = 3.8% for all vehicle types, on urban roads only (as c. 90% of all motorcycle accidents occur in urban areas)
Note that in the absence of data distinguishing between fatalities, injuries and material damages, the 3.8% impact was applied to all of these accident types.
12.2.24.3.5 Other impacts
No data was identified for this impact category in the reports reviewed.

Study on the Deployment of C-ITS in Europe: Final Report | 185
Ricardo in Confidence Ref: Ricardo/ED60721/Issue Number 1
Ricardo Energy & Environment
12.2.25 Wrong way driving (WWD)
12.2.25.1 Service overview
The wrong way driving service is a Day 1.5 V2I safety focussed application intended to prevent accidents caused by wrong way driving. Incidents of wrong way driving can lead to serious accidents on high speed roads as approaching drivers perform swerving manoeuvres to avoid the oncoming vehicle. Advance warning of wrong way driving has two main functions: firstly, to alert the driver that they are driving in the wrong direction, and secondly, to warn surrounding vehicles of the danger.
12.2.25.2 Technical information
Day 1.5 V2I service, likely to be based on ITS-G5 communication technology
Bundle 9
Communication between vehicles and roadside units will enable the detection of wrong way driving and a notification will be sent to the vehicle warning of the danger. This service is suitable for all vehicle and road types. Given the uncertainty around Day 1.5 services and the evolution of cellular networks, it is possible that this service could be offered via both ITS-G5 or cellular networks, provided it offers sufficiently low latency.
12.2.25.3 Impact data
To our knowledge, there are no publically available studies that specifically examine the impacts of this service. As a result, additional desk research was carried out to identify data that could be used to estimate the impacts of the wrong way driving service from first principles. A number of sources were used to estimate the impact of this service, as referenced below.
12.2.25.3.1 Traffic efficiency
No data was identified for this impact category in the reports reviewed. As wrong way driving incidents are relatively rare occurrences, it is assumed that this service will not have an impact on traffic efficiency at an EU level.
12.2.25.3.2 Fuel consumption and CO2
No data was identified for this impact category in the reports reviewed. As wrong way driving incidents are relatively rare occurrences, it is assumed that this service will not have an impact on fuel consumption/ CO2 emissions at an EU level.
12.2.25.3.3 Environmental and emissions impacts
No data was identified for this impact category in the reports reviewed. As wrong way driving incidents are relatively rare occurrences, it is assumed that this service will not have an impact on emissions at an EU level.
12.2.25.3.4 Safety
Safety benefits are expected to be the primary goal of this services. Whilst no data was directly identified for this impact category in the reports reviewed, a number of alternative sources enabled an estimation of the impact of this service on safety from first principles:
Identify number of wrong way driving incidents and fatalities in a Member State.
o In 2013 in Germany, there were 2,000 incidents, of which 22 led to fatalities (DriveEuropeNews, 2014)
Scale this number of fatalities to the EU level, based on total vehicle kilometres driven on motorways (EU-28) from the ASTRA/TRUST modelling baseline.
o Gives an estimated 92 fatalities per year in the EU-28 caused by wrong way driving
Apply an effectiveness factor to the WWD C-ITS service.
o Based on expert opinion, a 60% reduction in fatalities and a 40% reduction in injuries in WWD incidents was applied.

Study on the Deployment of C-ITS in Europe: Final Report | 186
Ricardo in Confidence Ref: Ricardo/ED60721/Issue Number 1
Ricardo Energy & Environment
Use these numbers to estimate the total reduction in fatalities from deploying WWD to all vehicles at an EU level.
o 0.37% reduction in fatalities and 0.24% reduction in injuries on motorways only, applied to all vehicle types in EU-28 countries used as an input to the model
o It is assumed that the benefits of this service are likely to be seen on motorways and it is therefore assumed that the service will have zero impact at an EU-level on non-motorway non-urban roads and urban roads.
12.2.25.3.5 Other impacts
No data related to other impacts was identified in the reports reviewed.

Study on the Deployment of C-ITS in Europe: Final Report | 187
Ricardo in Confidence Ref: Ricardo/ED60721/Issue Number 1
Ricardo Energy & Environment
12.3 Overlap between services
A number of C-ITS services covered in this study have similar functionality, therefore multiple services are likely to overlap and be applicable to the same driving scenarios. For example, on approaching a traffic jam, both the emergency electronic brake light service and traffic jam ahead warning service will be applicable. Therefore in practice, when two or more similar services are deployed, the impacts may not be additional and further benefits from adding additional services may only be a fraction of each additional service if deployed individually.
In order to accurately estimate overall modelling impacts, it is important to capture this interaction between services, to avoid over-optimistic estimation of benefits from bundles of multiple services.
To this end, service overlap was accounted for in the modelling using a service weighting matrix, as shown in Table 12-7. This matrix applied a percentage weighting from 0-100% to each service, based on which services would be deployed before it in the progression of scenarios from Scenario A to E. Weightings were applied in increments of 25%, in an attempt to account for different amounts of overlap between different services.
When assessing potential overlap between C-ITS services, it was assumed that the same overlap would apply for all impacts, i.e. if a service eliminates 50% of the safety impacts of another service, it will also eliminate 50% of the fuel consumption impacts.
A full list of overlaps is described below:
Traffic jam ahead warning: it is assumed that 25% of the impacts of traffic jam ahead warning would be eliminated due to the emergency electronic brake light service.
Roadworks warning: it is assumed that 25% of the impacts of roadworks warning would be eliminated due to the emergency electronic brake light service and a further 25% of the impacts would be eliminated due to the traffic jam ahead warning.
Weather conditions: it is assumed that there is significant overlap with hazardous location warning and that 50% of the impacts will be eliminated.
Probe vehicle data: it is assumed that the function of this service is to collect vehicle data to aid road operators and to improve the performance of various other services. Furthermore, it will not be present as a specific service for end-users. All impacts are assumed to be accounted for by other services (100% overlap with other services).
Shockwave damping: it is assumed that 25% of the impacts of shockwave damping would be eliminated due to the emergency electronic brake light service.
Off street parking information and management: it is assumed that there is 100% overlap with other parking services (on street parking information and management and park & ride information), so no distinction is made when modelling the impact of these services.
Park & Ride information: it is assumed that there is 100% overlap with other parking services (on street parking information and management and off-street parking information and management), so no distinction is made when modelling the impact of these services.
Cooperative collision risk warning: it is assumed that 75% of the impacts of this service would be eliminated due to the intersection safety service and emergency electronic brake light services.

Study on the Deployment of C-ITS in Europe: Final Report | 188
Ricardo in Confidence Ref: Ricardo/ED60721/Issue Number 1
Ricardo Energy & Environment
Table 12-7. Service overlap matrix. Percentages equal the fraction of impacts included in the modelling. Red text signifies overlaps with another service
EBL = emergency brake light, EVA = emergency vehicle approaching warning, SSV = slow or stationary vehicle warning, TJW = traffic jam ahead warning, HLN= hazardous location notification, RWW = roadworks warning, WTC = weather conditions warning, VSPD = in-vehicle speed limits, VSGN = in-vehicle signage, PVD = probe vehicle data, SWD = shockwave damping, GLOSA = green light optimal speed advisory/time to green, SigV = signal violation /intersection safety, TSP = traffic signal priority request by designated vehicles, iFuel = information on alternative fuelled vehicle charging and recharging stations, Pinfo = on-street parking information and management, PMang = off-street parking information and management, P&Ride = Park & Ride information, SmartR = Traffic information and smart routing, ZACM = zone access control management, LZM = loading zone management, VRU = vulnerable road user protection, CCRW = cooperative collision risk warning, MCA = motorcycle approaching indication, WWD = wrong way driving warning.
Service
1_EB
L-1
2_EV
A-1
4_SS
V-1
5_TJ
W-1
24_HL
N-1
3_RW
W-2
6_WT
C-2
9_VSP
D-2
8_VSG
N-2
10_PV
D-2
11_SW
D-2
7_GLO
SA-3
12_Sig
V-3
13_TS
P-3
14_iFu
el-4
15_Pin
fo-4
16_PMa
ng-4
17_P&Ri
de-4
18_Sma
rtR-5
25_ZA
CM-6
20_LZ
M-6
19_VR
U-7
21_CC
RW-8
22_M
CA-8
23_WW
D-9
C-
ITS(N)
1_EBL-12_EVA-14_SSV-15_TJW-124_HLN-13_RWW-26_WTC-29_VSPD-28_VSGN-210_PVD-211_SWD-27_GLOSA-312_SigV-313_TSP-314_iFuel-415_Pinfo-416_PMang-417_P&Ride-418_SmartR-525_ZACM-620_LZM-619_VRU-721_CCRW-822_MCA-823_WWD-9C-ITS(N)
New vehicles
Retrofit
Infrastructure
Fuel consumption100% 100% 100% 75% 100% 50% 50% 100% 100% 0% 75% 100% 100% 100% 100% 100% 0% 0% 100% 100% 100% 100% 25% 100% 100% 100%
CO100% 100% 100% 75% 100% 50% 50% 100% 100% 0% 75% 100% 100% 100% 100% 100% 0% 0% 100% 100% 100% 100% 25% 100% 100% 100%
NOx100% 100% 100% 75% 100% 50% 50% 100% 100% 0% 75% 100% 100% 100% 100% 100% 0% 0% 100% 100% 100% 100% 25% 100% 100% 100%
VOC100% 100% 100% 75% 100% 50% 50% 100% 100% 0% 75% 100% 100% 100% 100% 100% 0% 0% 100% 100% 100% 100% 25% 100% 100% 100%
PM100% 100% 100% 75% 100% 50% 50% 100% 100% 0% 75% 100% 100% 100% 100% 100% 0% 0% 100% 100% 100% 100% 25% 100% 100% 100%
Fatalities100% 100% 100% 75% 100% 50% 50% 100% 100% 0% 75% 100% 100% 100% 100% 100% 0% 0% 100% 100% 100% 100% 25% 100% 100% 100%
Serious
injuries 100% 100% 100% 75% 100% 50% 50% 100% 100% 0% 75% 100% 100% 100% 100% 100% 0% 0% 100% 100% 100% 100% 25% 100% 100% 100%
Light
injuries 100% 100% 100% 75% 100% 50% 50% 100% 100% 0% 75% 100% 100% 100% 100% 100% 0% 0% 100% 100% 100% 100% 25% 100% 100% 100%
Material
damages 100% 100% 100% 75% 100% 50% 50% 100% 100% 0% 75% 100% 100% 100% 100% 100% 0% 0% 100% 100% 100% 100% 25% 100% 100% 100%
Average
speed 100% 100% 100% 75% 100% 50% 50% 100% 100% 0% 75% 100% 100% 100% 100% 100% 0% 0% 100% 100% 100% 100% 25% 100% 100% 100%

Study on the Deployment of C-ITS in Europe: Final Report | 189
Ricardo in Confidence Ref: Ricardo/ED60721/Issue Number 1
Ricardo Energy & Environment
13 Annex G: C-ITS supporting technology and service costs
13.1 Introduction
This section describes the C-ITS supporting technology and service costs used in the CBA. Cost data makes up the final main input element for the CBA, allowing the uptake and penetration rates for different services to be translated into costs, in order to compare them directly to the estimated benefits from the various EU-level impacts calculated from the modelling.
13.1.1 Introduction to C-ITS sub-systems
In order to fully understand the costs associated with the deployment of C-ITS services, it is necessary to consider the cost of the hardware/devices and associated software and services used to facilitate those C-ITS services. These devices can be broadly categorised into four types13:
1. Central ITS sub-systems, which may be part of a centralised traffic management system. One
such sub-system is able to manage C-ITS services for an entire city, or road operator, or national highway system etc. Deployment of other ITS sub-systems, such as C-ITS infrastructure/roadside units will require a central system for management purposes.
2. Personal ITS sub-systems such as mobile phones, tablets, personal navigation satnav-type devices, and other hand-held devices not attached to the vehicle’s information bus – these can enable V2I communications along suitably equipped roads/regions, or in the future, may be able to support V2V communications if equipped to use the correct communications protocols. Note that in this study, it is assumed that personal ITS sub-systems are only able to offer V2I services.
3. Vehicle ITS sub-system, which are either fitted by the vehicle manufacturer or retrofitted to the vehicle, and are attached to the vehicle communication buses – these can enable both V2V communications and V2I along suitably equipped roads/regions. Note that retrofitted vehicle ITS sub-systems are outside the scope of this study.
4. Roadside ITS sub-systems such as beacons on gantries, poles, smart traffic lights, etc. which allow V2I communications along specific stretches of roads.
To reflect the distinction between these ITS sub-system, this document is therefore divided into four key sections as follows:
Section 1: this section provides an introduction to the data collection task, summarises the key objectives and assumptions, and lists the main data sources.
Section 2: this section itemises our cost assumptions for Central ITS sub-systems.
Section 3: this section itemises our cost assumptions for Personal ITS sub-systems.
Section 4: this section itemises our cost assumptions for Vehicle ITS sub-systems.
Section 5: this section itemises our cost assumptions for Roadside ITS sub-systems.
In addition Section 6 includes a full list of data sources used in the cost data collection.
13.1.2 Cost data overview
13.1.2.1 Cost items collected
For each of the C-ITS sub-systems listed in Section 13.1.1, data related to the following parameters was collected:
1. Upfront costs, i.e. one-off costs incurred at the point of installation/commissioning.
2. Ongoing costs, i.e. the recurring costs associated with operating each sub-system.
13 ERTICO, “Communication Technologies for future C-ITS service scenarios” (2015)

Study on the Deployment of C-ITS in Europe: Final Report | 190
Ricardo in Confidence Ref: Ricardo/ED60721/Issue Number 1
Ricardo Energy & Environment
3. Equipment lifetime, to establish whether it was necessary to account for replacement costs within the lifetime of the CBA modelling (2015 to 2030).
4. The cost owner, to enable an estimation of the impact of different cost items on the various key stakeholders in the deployment of C-ITS services.
13.1.2.2 Technology learning rates
The majority of the systems deployed to support the rollout of C-ITS services are currently at a relatively early stage of maturity and costs are likely to improve through time. To account for this, a learning rate of 10% is applied to all up-front costs for personal, in-vehicle and roadside ITS sub-systems. That is, for every doubling in installed volume, up-front costs reduce by 10%.
13.1.3 Sources of information
13.1.3.1 Literature
The cost data collection exercise built on our extensive literature review of over 100 documents from Task 1, which covered various aspects of C-ITS services and related technologies. Within this long list, a number of key sources for the cost data collection task were identified, as listed below:
004 – COMeSafety, BMW: D2.3 Cost Benefits Analysis & Business Model Elements for Deployment
011 – CVIS costs, benefits and business models
017 – eIMPACT Socio-economic Impact Assessment of Stand-alone and Co-operative Intelligent Vehicle Safety Systems (IVSS) in Europe. Deliverable D4. Impact assessment of Intelligent Vehicle Safety Systems.
026 – NHTSA, US DoT: Vehicle-to-Vehicle Communications: Readiness of V2V Technology for Application
040 – COBRA, TNO: Deliverable 2 Methodology framework, Update
044 – CODIA
046 – SAFESPOT SP6 – BLADE – Business models, Legal Aspects, and Deployment
113 - EasyWay Business case and benefit-cost assessment of EasyWay priority cooperative services
114 – US DoT: National Connected Vehicle Field Infrastructure Footprint Analysis Final Report
13.1.3.2 Expert input
In addition to the desk-based data collection, the draft outputs of the cost data collection were discussed during the WG1 meeting held in Brussels on the 1st October 2015. This resulted in a number of revisions to the costs used in the CBA, which are also included in this document.
Finally, where data was inconsistent between studies or where gaps remained from the literature review, a number of industry experts (mainly from within WG1) were contacted either unilaterally or in groups as part of Task 8 (cross cutting stakeholder engagement task). Ricardo Energy & Environment invited industry experts to:
Comment on the cost data collected
Suggest further sources of information
Provide cost data where sufficient evidence was not available in the literature
In particular, a teleconference was held on 12th October 2015 to discuss roadside ITS sub-system costs. Following the teleconference, Ricardo Energy & Environment issued a revised list of infrastructure costs to all attendees, as summarised in this document.
13.1.3.3 Base year
Given the varying base years for cost data originating from different data sources, all pre-2015 costs have been inflated to 2015 levels using the Eurostat Harmonised indices of consumer prices (HICP) (European Commission, 2015).

Study on the Deployment of C-ITS in Europe: Final Report | 191
Ricardo in Confidence Ref: Ricardo/ED60721/Issue Number 1
Ricardo Energy & Environment
13.2 Central ITS sub-systems
Central ITS sub-systems are likely to be integrated into existing traffic management centres (TMCs).
One such sub-system is likely to have the ability to manage an entire city, road operator, national highway system etc. A central ITS sub-system is necessary so that roadside sub-systems are connected to a central system, where data can be analysed and used to enable effective traffic management and the deployment of V2I services.
In this cost-benefit analysis central ITS sub-system costs are considered on a Member State level; costs have been calculated per Member State, depending on the level of infrastructure penetration.
13.2.1 Business model
It is assumed that roadside ITS sub-systems will be integrated into existing traffic management centres and that additional TMCs will not need to be built to support the management of C-ITS services. Consequently, the costs described in this section only refer to the cost of additional equipment/services required to connect the roadside units to TMCs, back office integration costs, etc. It is assumed that these costs are borne by the highways agencies/urban transport authorities in each Member State.
In addition to the TMC integration costs, it is assumed that software applications are required to deliver the C-ITS services to various personal or in-vehicle ITS sub-systems. These must additionally be developed in each Member State and it is assumed that these costs are borne by the transport/highways agencies in each Member State.
13.2.2 Summary of inputs to the cost-benefit analysis
A summary of the key cost assumptions used in the CBA is given in Table 13-2. Sections 13.2.3-13.2.5 discuss these aspects in more detail.
Table 13-1. Breakdown of costs for central ITS sub-systems (front runner country)
Cost item Input Year Cost owner
Upfront costs
Integration of roadside units into TMC. Interface to urban standards/protocols
€1,500,000 2015 Highways Agency
Integration of roadside units into TMC. Interface to inter-urban standards/protocols
€1,500,000 2015 Highways Agency
Interface from roadside unit to local traffic controller (urban)
€1,000,000 2015 Highways Agency
Interface from roadside unit to local traffic controller (inter-urban)
€1,000,000 2015 Highways Agency
Ongoing costs
(per year)
Back office operations and maintenance (urban)
€250,000 2015 Highways Agency
Back office operations and maintenance (inter-urban)
€250,000 2015 Highways Agency
Application development costs (urban)
€300,000 2014 Highways Agency
Application development costs (inter-urban)
€300,000 2014 Highways Agency

Study on the Deployment of C-ITS in Europe: Final Report | 192
Ricardo in Confidence Ref: Ricardo/ED60721/Issue Number 1
Ricardo Energy & Environment
13.2.3 Upfront costs
It is assumed that each roadside unit will be connected to a TMC. Based on conversations with industry experts, it is assumed that each EU Member State operates with different road traffic standards/protocols. Two major upfront cost items are relevant to deploying central ITS sub-systems in each Member State:
A cost for developing a TMC interface for each Member State. Based on discussions with industry experts, development of a TMC interface is likely to cost between €1mn- €2mn. An average cost per interface of €1.5mn has been used in this CBA. Previous studies (EasyWay and COBRA) have suggested a cost of €500 per roadside ITS station to cover integration costs with TMCs. Based on this figure an average cost of €850,000 per TMC per country was calculated14. This compares well with the €1.5mn cost estimation used in this study, considering that previous studies have assumed an ITS sub-system range of 300-500m.
An interface to local traffic controllers (e.g. traffic lights) for roadside ITS sub-systems. Based on discussions with industry experts, a cost of €1mn per interface has been assumed.
Furthermore, each Member State is likely to have different urban traffic standards and inter-urban traffic standards. The total cost for integration of C-ITS services is therefore estimated at €2.5mn each for urban and inter-urban areas respectively within each Member State.
These costs are triggered only once roadside ITS sub-system penetration reaches 10% across urban and inter-urban areas respectively.
13.2.4 Ongoing costs
Two principal ongoing costs are assumed to be incurred, as follows:
The cost for maintaining the TMC back-office and local controller interfaces, estimated at 10% of capital costs based on the COBRA study (TNO, 2013), or €250,000 per year for urban and inter-urban areas respectively.
A cost for developing and maintaining software applications to deploy services to personal and in-vehicle ITS subs-systems, estimated at €300,000 per year. The development, maintenance and improvement of C-ITS mobile applications has been estimated to require between 1-5 FTEs (full time equivalents) and will be paid for by highways agencies via an annual service fee to app developers. Three FTEs are estimated to cost €300,000 per year, based on the COMeSafety2 cost-benefit analysis (BMW, 2014). As for the other central ITS sub-system costs, separate applications will be required for urban traffic standards and inter-urban traffic standards in each Member State, so this cost is assumed to apply to both urban and inter-urban areas.
The total ongoing cost per Member State is therefore €550,000 per year, with this cost being triggered for urban and inter-urban areas when each reaches 10% total ITS sub-system penetration.
13.2.5 Lifetime
The lifetime of the TMC integration is assumed to exceed the lifetime of the modelling (which runs to 2030) and therefore is not considered relevant for this section.
14 Assuming a roadside ITS sub-system range of 1km and the number of roadside units deployed in the baseline scenario

Study on the Deployment of C-ITS in Europe: Final Report | 193
Ricardo in Confidence Ref: Ricardo/ED60721/Issue Number 1
Ricardo Energy & Environment
13.3 Personal ITS sub-systems
Personal ITS sub-systems such as mobile phones, tablets, satnav-type personal navigation devices (PNDs), and other handheld devices not attached to the vehicle’s information bus can enable V2I communications along suitably equipped roads. In the future, these devices may also enable V2V communications if equipped to use the correct communications protocols.
The objective of this cost-benefit analysis is to assess the costs and benefits of five realistic C-ITS deployment scenarios during the years 2015-2030 and to compare these to the baseline. To ensure a robust methodology, information for the modelling was drawn from current market trends, data on comparable existing technologies and knowledge of potential business models. Based on our analysis for the baseline scenario and discussions with key stakeholders, it is expected that C-ITS services on personal ITS sub-systems are initially likely to be provided by two major types of devices: mobile phones, and personal navigation devices (PNDs) such as TomTom or Garmin Satnav devices. These two categories of personal ITS sub-systems were therefore selected for modelling in this study and are described in more detail in the sections below.
In the future it is possible that many types of handheld devices will have the potential to support C-ITS services, however during the timeframe considered for this cost-benefit analysis these are likely to account for only a small percentage of personal ITS sub-systems. Furthermore, no cost or performance data exists for these unknown future devices on which to base modelling inputs and they are therefore not modelled in this study.
In the time period considered for the modelling it is likely that personal ITS sub-systems will only support V2I communication, as these devices will not be connected to vehicle information buses. The provision of V2V functionality through personal ITS sub-systems is therefore not considered in the scope of this study.
It is assumed that personal ITS sub-systems are only available in the aftermarket, to any vehicles that are not already equipped with in-vehicle C-ITS sub-systems. Costs are assumed to be consistent across all vehicle categories.
13.3.1 Mobile phones
13.3.1.1 Business model
As with any emerging technology, C-ITS services could be offered via a number of different business models. The method selected is likely to depend on the interaction between key stakeholders in the field and may ultimately vary by Member State, Highways Agency and technology/software provider.
Three options that have been suggested for smartphones are as follows:
Subscription based model: In a subscription based business model, end-users would not be charged to download the application but would pay an annual subscription fee for use of the service. The subscription fee would be used to cover software development costs and enable the end-user to receive updates to the application during the subscription period. Any cellular data usage associated with using the application would be covered by the end-user.
App store/online marketplace based model: On the other hand, in an app store based business model, there would be a one-off fee to download the application, with no additional subscription fees. In this case, the one-off fee would be set at a level sufficient to cover the software development and update costs. Any cellular data usage associated with using the application would be covered by the end-user.
Free model: Alternatively, C-ITS services may be provided for free to smartphone users, for example by national highways agencies. In this business model, an independent app developer is paid by a highways agency/urban transport authority to develop and maintain an application required to enable C-ITS services on the relevant road network. In this business model, cellular data usage will be covered by the end-user, however there will be no upfront fee to download the app and no subscription fees to access the service. The highways agency/transport authority may choose to recoup some of its costs through e.g. allowing advertising within the app.

Study on the Deployment of C-ITS in Europe: Final Report | 194
Ricardo in Confidence Ref: Ricardo/ED60721/Issue Number 1
Ricardo Energy & Environment
Based on discussions with WG1 members and current European pilot projects (such as NordicWay), the most likely business model to be offered for C-ITS services is deemed to be the ‘free’ model described above. It has been therefore been decided to model only the ‘free’ bus iness model in the cost-benefit analysis. As a result, deploying additional C-ITS service bundles which rely on the same underlying communications technology, does not incur any additional costs in the CBA modelling.
13.3.1.2 Summary of inputs to the cost-benefit analysis
A summary of the key assumptions and inputs to the cost-benefit analysis for mobile phones is shown in Box 7 below. A full breakdown of costs is given in Table 13-2. Sections 13.3.1.1 - 13.3.1.5 discuss these aspects in more detail.
Box 7. Summary of key assumptions and inputs to the cost-benefit analysis for mobile phones
Key assumptions:
Personal ITS sub-systems are only available via the aftermarket to existing vehicles that are not already equipped with in-vehicle ITS sub-systems
Costs are assumed to be consistent across all vehicle categories
Mobile phones will only provide V2I services, via the cellular network
Mobile phones are already owned by the user – i.e. no up-front purchase costs are incurred
C-ITS services will be available to the end-user via a free model. Highways agencies will pay software developers an ongoing fee to maintain applications.
Table 13-2. Breakdown of costs for mobile phones
Cost item Input Year Cost owner
Upfront costs Equipment €0 2015 End-user
Mobile phone app cost €0 2015 End-user
Ongoing costs
(per year) Data €2.57 2012 End-user
13.3.1.3 Upfront costs
In the cost-benefit analysis for this project, there are no upfront costs. It is assumed that mobile phones are already owned by the user and that C-ITS services will be developed and provided for free by highways agencies, as described above. This approach is currently being followed by the NordicWay pilot project, which is aiming to deploy cellular based C-ITS services. To cover the cost of application development and maintenance, an ongoing cost has been included for urban and inter-urban standards in each Member State, as discussed in Section 13.2.
13.3.1.4 Ongoing costs
As discussed above, no annual subscription fees are included for use of the C-ITS mobile phone application, as all services are assumed to be provided for free by national Highways Agencies/urban transport authorities.
Use of C-ITS applications in mobile phones will require the user to transmit and receive additional data via the cellular network. To cover this additional data usage, a cost of €2.57 per user per year has been estimated. This is based on estimates of data volumes required to offer C-ITS services (and a price of $4.00/GB) cited in a US DoT NHTSA report on C-ITS applications (NHTSA, 2014).
13.3.1.5 Lifetime
Given the assumptions that C-ITS applications are offered free to the user and that mobile phones are already owner by the end-user, lifetimes are not relevant to mobile phones for the cost-benefit analysis.

Study on the Deployment of C-ITS in Europe: Final Report | 195
Ricardo in Confidence Ref: Ricardo/ED60721/Issue Number 1
Ricardo Energy & Environment
13.3.2 Personal navigation devices (PNDs)
13.3.2.1 Business model
As for smartphones, a variety of business models are feasible for PNDs. Similarly to smartphones, subscription or app store based models are possible for PNDs, where users purchase the device and pay an annual subscription fee or one-off cost for access to C-ITS services. Previous EU cost-benefit analyses in this area have opted to follow a subscription based model (for example, the COBRA study (TNO, 2013)), however a survey of the satnav market today reveals a third, more likely approach.
Although there are differences depending on device and manufacturer, at least one major manufacturer offers premium products with features such as lifetime map updates and lifetime live traffic updates, with all cellular data usage and SIM card costs included in the purchase price of the PND (TomTom, 2015). This choice of business model offers a simple and attractive way for users to readily access these services ‘straight out of the box’.
Based on discussions with WG1 and an assessment of the PND market today, it has been assumed that this relatively simple approach is adopted by manufacturers offering C-ITS services alongside PNDs in the cost-benefit analysis for this study.
13.3.2.2 Summary of inputs to the cost-benefit analysis
A summary of the key assumptions and inputs to the cost-benefit analysis for PNDs is shown in Box 8 below. A full breakdown of costs is given in Table 13-3. Sections 13.3.2.3 - 13.3.2.5 discuss these aspects in more detail.
Box 8. Summary of key assumptions and inputs to the cost-benefit analysis for PNDs
Key assumptions:
PND lifetime: 10 years
PNDs will only provide V2I services, via the cellular network
PNDs will be purchased by the end-user to access C-ITS services – the cost accounted for in the CBA is the price differential between a non-cellular-connected PND and one that has a cellular connection and includes lifetime data
C-ITS applications and cellular data will be included in the purchase price of the PND
Table 13-3. Breakdown of costs for PNDs
Cost item Input Year Cost owner
Upfront costs
Equipment €123.64 2015 End-user
PND app cost €0.00 2015 End-user
App/software development €0.00 2015 Equipment provider
Ongoing costs
(per year)
Data €0.00 2015 End-user
Subscription €0.00 2015 End-user
App development (updates) €0.00 2015 Equipment provider
13.3.2.3 Upfront costs
In the cost-benefit analysis for this project, an upfront cost of €123.64 per PND was used, based on the market research described below. This is the current average price differential between a satnav with no inbuilt cellular connectivity or live traffic updates, and a comparable cellular-connected satnav with lifetime free live traffic updates included the purchase price (Table 13-4).

Study on the Deployment of C-ITS in Europe: Final Report | 196
Ricardo in Confidence Ref: Ricardo/ED60721/Issue Number 1
Ricardo Energy & Environment
It is assumed that all data and application costs for the lifetime of the device are included in this €123.64 upfront differential cost and that end-users will pay this premium over and above the price of a standard non-cellular-connected PND, specifically to gain access to C-ITS services.
To our knowledge, only one manufacturer in the UK (TomTom) currently delivers live traffic updates directly to PNDs via the cellular network15, which is similar to some of the V2I functionality envisaged for the deployment scenarios in this study. To enable this, TomTom and Vodafone have signed a partnership that allows compatible TomTom devices to directly receive information via the cellular network. These PNDs contain a SIM card and all data required for this service is currently included in the initial purchase cost.
Price information was collected from a variety of retailers in the UK to estimate the cost of lifetime data and built-in cellular communications. Table 13-4 compares the TomTom Start 50 (which has no live traffic features) and the TomTom GO 5000 (which contains built in cellular connectivity). The TomTom GO 50 can provide a similar service to the TomTom GO 5000, using a smartphone’s data connection; it is shown in Table 13-4 purely for information. Subtracting the average price at release of the TomTom GO 5000 from the TomTom Start 50 provides an estimate for the cost of on-board equipment/software required to offer cellular connectivity, in addition to the lifetime data usage in accessing these services. This differential equates to approximately £90 (€123.6416).
Table 13-4. Comparison of different PNDs showing costs and key features
TomTom Start 50 TomTom GO 50 TomTom GO 5000
Geographic coverage Full Europe Full Europe Full Europe
Lifetime map updates Yes Yes Yes
Fuel efficient routing Yes No Yes
Screen size 5” 5” 5”
Traffic (via cellular network)
No traffic Smartphone enabled Built-in
Voice recognition No Yes Yes
Current cost range £119.99 - £139.99 £129.99 - £139.99 £179.99 - £229.99
Sources: Price information was collected from a variety of retailers in the UK. At release, price difference between TomTom Start 50 and TomTom GO 5000 was £90 (Trusted Reviews, 2014; Trusted Reviews, 2013).
13.3.2.4 Ongoing costs
As highlighted in the above section, a business model for PNDs has been assumed whereby cellular data costs and C-ITS application costs are included in the purchase price of a PND. Therefore, there are no ongoing costs for the end-user as all C-ITS service costs are included in the purchase price.
13.3.2.5 Lifetime
A lifetime of 10 years is assumed for PNDs in this study, based on the COBRA cost-benefit analysis (TNO, 2013). A replacement cost is therefore applied in the cost-benefit analysis for any devices that are older than 10 years (note this will only occur towards the end of the modelling period (which ends in 2030), given that deployments only begin in 2018 in the scenarios.
15 Without the need for a connection to a smartphone. Many PNDs currently available can be connected to the user’s smartphone and use this data connection to access real-time traffic information. 16 GBP/EUR Exchange rate of 1.3738 (Jan 2015 – October 2015 period average) Source: www.oanda.com/currency/historical-rates/

Study on the Deployment of C-ITS in Europe: Final Report | 197
Ricardo in Confidence Ref: Ricardo/ED60721/Issue Number 1
Ricardo Energy & Environment
13.4 In-vehicle ITS sub-systems
In-vehicle ITS sub-systems can be either fitted by the vehicle manufacturer or retrofitted to the vehicle, and are attached to the vehicle communication buses. These can enable both V2V communications and V2I along suitably equipped roads. Retrofitted vehicle ITS sub-systems are outside the scope of this study, so this chapter only details costs for systems installed in new vehicles. It is assumed that costs are consistent across all vehicle categories.
In the cost-benefit analysis for this project vehicles are divided into two different categories: those capable of delivering only ITS-G5 based services, and those capable of delivering both ITS-G5 based services and cellular based services – the latter being relevant only in the ‘high’ scenario sensitivity, whereby V2I services are exclusively offered via cellular networks.
Wherever possible cost data was defined separately for the three vehicle types modelled in the CBA, i.e. passenger cars, freight vehicles and buses. Where disaggregated data was not available, costs were assumed to be constant across different vehicle types.
13.4.1 Vehicles with ITS-G5 only
13.4.1.1 Business model
A simple business model is adopted in the cost-benefit analysis, whereby costs are only included for the additional equipment/software required to deliver C-ITS services in new vehicles. Additional up-front equipment, integration, installation and software development costs are included at cost price (i.e. OEM costs), whilst a number of additional ongoing costs are incurred by both the OEM and end-user.
No additional subscription or up-front costs are included to access the C-ITS services other than the technology/software that enables them. This is consistent with our assumptions around central and personal ITS sub-systems, whereby it is assumed that C-ITS applications and services are offered free to the end-user, provided they have the equipment required to deliver them.
Clearly a number of the costs assumed to be incurred by the OEMs will eventually be passed on to the consumer through applying a mark-up (for example the NHTSA study assumes a 51% mark-up between OEM cost and consumer price on all vehicle components) (NHTSA, 2014). Whilst this mark-up has not been explicitly modelled in the cost-benefit analysis, it is taken account of in the CBA write-up.
13.4.1.2 Summary of inputs to the cost-benefit analysis
A summary of the key assumptions and inputs to the cost-benefit analysis for vehicles with only ITS-G5 communication is shown in Box 9 below. A full breakdown of costs is given in
Table 13-5. Sections 13.4.1.1-13.4.1.5 discuss these aspects in more detail.
Box 9. Summary of key assumptions and inputs to the cost-benefit analysis for vehicles with ITS-G5 only
Key assumptions:
In-vehicle ITS sub-systems are only available to new vehicles coming off the production line
Costs are assumed to be consistent across all vehicle categories
Only costs associated with the equipment/software required to deliver C-ITS services to vehicles are included, as well as associated integration, testing, software development and ongoing costs
Costs are assumed to be incurred by the vehicle OEM, except for ongoing maintenance and secure communications costs
Two DSRC antennae and transmitter/receivers are assumed necessary, one to send and receive basic safety messages, the other for the security aspects of V2V communication

Study on the Deployment of C-ITS in Europe: Final Report | 198
Ricardo in Confidence Ref: Ricardo/ED60721/Issue Number 1
Ricardo Energy & Environment
Table 13-5. Breakdown of costs for vehicles with only ITS-G517
Cost item Input Year Cost owner
Upfront costs
DSRC transmitter/receiver (for 2)
€101.17 2012 OEMs
DSRC antenna (for 2) €7.78 2012 OEMs
Electronic Control Unit €35.02 2012 OEMs
Wiring €7.00 2012 OEMs
Installation €5.35 2012 OEMs
Development & integration €15.09 2015 OEMs
Vehicle software development
€1.51 2015 OEMs
Ongoing costs
(per year)
Maintenance €7.55 2015 End-user
Secure communications €2.44 2012 End-user
Vehicle software (updates €3.02 2015 OEMs
13.4.1.3 Upfront costs
For the cost-benefit analysis, a total upfront cost per vehicle (to the OEM) of €172.92 was calculated. This is made up of in-vehicle equipment costs (€150.97), installation (labour) costs (€5.35), C-ITS integration/development/testing costs (€15.09), and software development costs (€1.51).
13.4.1.3.1 Equipment and installation costs
To enable C-ITS services based on ITS-G5 communication, a number of in-vehicle components are required, including: two DSRC transmitter/receivers, two DSRC antennas, an electronic control unit and additional wiring. In contrast to the NHTSA study, a cost for an in-vehicle screen has not been included; instead, it is assumed that all vehicles equipped with C-ITS services already have some form of display where C-ITS notifications could be presented. Although GPS is required to deliver C-ITS services, GPS costs (estimated to be c. $9 in 2012) are also not included in this analysis as it is assumed that the majority of new vehicles will already have GPS installed by the time C-ITS services are deployed. NHTSA estimated that over 50% of new passenger cars had GPS installed in 2011, with this percentage expected to rise as navigation systems are installed in more vehicles (NHTSA, 2014).
Two DSRC antennas and transmitter/receivers are assumed to be necessary – one will be used to send and receive basic safety messages, whereas the other will be required for the security aspects of V2V communication, such as receiving certificates and certificate revocation lists (NHTSA, 2014).
The equipment costs used in this study are derived from the U.S. DoT NHTSA Vehicle-to-Vehicle Communications: Readiness of V2V Technology for Application report (NHTSA, 2014), where they are presented as a Day 1 cost per component to the OEM in 2012 dollars. These figures were converted to 2012 Euros to give the values listed in
Table 13-5.
Installing the additional equipment in vehicles also has implications in terms of labour costs. The cost to install the components listed above is estimated to be $6.88, in 2012 US dollars (NHTSA, 2014). This is equal to €5.35 (2012 Euros)18.
17 Development & integration, vehicle software development and vehicle software (updates) costs were calculated separately for freight vehicles and buses. All other costs are assumed to be the same, irrespective of vehicle type. 18 USD/EUR Exchange rate of 0.7781 (January 2012 – December 2012 period average) Source: www.oanda.com/currency/historical-rates/

Study on the Deployment of C-ITS in Europe: Final Report | 199
Ricardo in Confidence Ref: Ricardo/ED60721/Issue Number 1
Ricardo Energy & Environment
The costs in the NHTSA study for ITS-G5 equipment are broadly comparable with EU studies such as CODIA (€150 in 2020, €120 in 2030) and COBRA (€100 - €250, depending on complexity of system and level of driver assistance). The COMeSafety2 (€30-€50 depending on volume, for an ITS-G5 unit integrated in existing telematics control units) and EasyWay studies (€50 in a 100% penetration scenario) suggest slightly lower costs, however it is not clear whether these include two DSRC antennas and two DSRC transmitter/receivers as suggested by the NHTSA study.
13.4.1.3.2 Integration of C-ITS technology, development and testing costs
The cost of integrating new C-ITS services into passenger cars is estimated to cost €15.09 per vehicle. This covers activities such as linking the equipment required to receive and process the signals for C-ITS services to the rest of the vehicle’s safety and other systems, and carrying out all safety and functionality testing required for certification. It is assumed that:
Based on discussions within WG1, the total cost of integrating the equipment required to deliver C-ITS services would be approximately €5mn per vehicle model.
Integration and testing would need to be carried out separately for each of a manufacturer’s vehicle models, with no savings from deploying the service across multiple models.
On average, each manufacturer sells 12 models of passenger car in Europe19, based on an analysis of the top 7 manufacturers operating in Europe (ranked by annual sales).
Each model has a 5 year refresh cycle, which is consistent with the uptake rates used for new vehicles in the cost-benefit analysis
The average number of vehicles sold per model by each manufacturer over the 5 year model lifecycle is c. 350,00020.
The resultant cost per vehicle sold is €5,000,000/350,000 = c. €15 up-front costs
The cost of integrating new C-ITS services into freight vehicles is estimated to cost €49.96 per vehicle. This was calculated using the same methodology as for passenger cars21 but was based on an analysis of the top three LCV (light commercial vehicles, <3.5t), top three CV (commercial vehicles, >3.5t) and top three HCV (heavy commercial vehicles, >16t) manufacturers operating in Europe (ranked by annual sales) (ACEA, 2011 - 2013). The cost of integrating new C-ITS services into buses is assumed to cost the same as for freight vehicles.
13.4.1.3.3 Software development and integration costs
Software development costs have been estimated to be €1.51 per vehicle, based on a 5 year model refresh cycle. This covers the cost of developing the software to support a range of C-ITS services, i.e. the software to process the incoming/outbound signals and to decide what to do with them, before sending further signals to the vehicle’s CAM bus to request responses from various vehicle systems (e.g. displays, avoidance manoeuvres, etc.).
The assumptions used here are as follows:
The initial software development costs would be approximately €1mn per model, based on a team of ten engineers working for a year to develop the software (BMW, 2014).
Software could be shared to some extent across different vehicle models, due to there being significant overlap between the software deployed to different vehicle models from the same OEM. However, the differing complexity of different categories of vehicles (e.g. A-category versus E-category) would mean that individual vehicle models would still incur approximately 50% of the total development costs described above.
This cost can be approximated as detailed below, however for the cost benefit analysis, this was calculated on a per manufacturer basis for the 7 manufacturers with the largest market share in Europe, to give an average cost of €1.51.
19 Based on an analysis of passenger car product ranges of the 7 manufacturers with the largest market share in Europe, in 2015 (SOURCE: ACEA). 20 Based on an analysis of passenger car product ranges of the 7 manufacturers with the largest market share in Europe, in 2015 (SOURCE: ACEA). 21 A 7 year model refresh cycle was assumed for CVs (>3.5t) and HCVs (>16t). For LCVs (<3.5t) a 5 year model refresh cycle was assumed

Study on the Deployment of C-ITS in Europe: Final Report | 200
Ricardo in Confidence Ref: Ricardo/ED60721/Issue Number 1
Ricardo Energy & Environment
o The average number of vehicles sold per model by each manufacturer over the 5 year model lifecycle is c. 350,000.
o The resultant cost per vehicle sold is €1,000,000 x 50% / 350,000 = c. €1.40 up-front costs
This software would need to be maintained by a team of 3-5 individuals full-time – as discussed in the ongoing costs section.
Software development costs have been estimated to be €5.00 per vehicle for freight vehicles. This was calculated using the same methodology as for passenger cars22 but was based on an analysis of the top three LCV, top three CV and top three HCV manufacturers operating in Europe (ranked by annual sales) (ACEA, 2011 - 2013). The software development costs for buses are assumed to cost the same as for freight vehicles.
13.4.1.4 Ongoing costs
Ongoing costs total €13.01 per vehicle and are composed of maintenance, secure communications and OEM maintenance of in-vehicle software:
The additional equipment installed to support C-ITS services in new vehicles is likely to lead to incremental maintenance costs above those that would normally be incurred. A maintenance cost equal to 5% of the capital cost of C-ITS equipment per year is assumed in this study – equivalent to €7.55 per vehicle per year. It is assumed that this cost is borne by the vehicle end-user.
A secure communications management system is necessary for vehicles to provide and receive secure and trusted communications. The cost of secure communications was estimated in the NHTSA report to be $3.14 (2012 dollars) per vehicle, which is equivalent to €2.44 (2012 Euros)23. It is assumed that this cost is borne by the vehicle end-user.
The cost of maintaining in-vehicle software after release, to provide updates where necessary throughout a model’s typical lifecycle was estimated to be €3.02 per passenger car per year. This cost can be approximated as detailed below, however for the cost benefit analysis, this was calculated on a per manufacturer basis for the 7 manufacturers with the largest market share in Europe:
o This has been estimated to require 3-5 full time staff members (at €100k per year) for each vehicle model,
o 50% of these costs are shared between models, as per the up-front vehicle software development costs.
o The average number of vehicles sold per model by each manufacturer is c. 70,000 per year.
o This translates to an annual cost of €400,000 x 50% / 70,000 = c. €2.85 per vehicle. It is assumed that this cost is borne by OEMs, alongside the up-front integration and software development costs.
The cost of maintaining in-vehicle software in freight vehicles and buses was estimated to be €12.70 per freight vehicle per year. This cost was calculated using the same methodology as for passenger cars but was based on an analysis of the top three LCV, top three CV and top three HCV manufacturers operating in Europe (ranked by annual sales) (ACEA, 2011 - 2013). The cost of maintaining in-vehicle software in buses was assumed to cost the same as for freight vehicles.
A number of studies point to the potential effect of C-ITS services on insurance costs (particularly for safety-focused C-ITS services), however due to the lack of data available to support this assertion, these benefits were not included in the analysis.
13.4.1.5 Lifetime
The lifetime of all new vehicles has been estimated to be 12 years, based on the EasyWay and COBRA studies (EasyWay Cooperative Systems Task Force, 2012; TNO, 2013). Given that the lifetime of the
22 A 7 year model refresh cycle was assumed for CVs (>3.5t) and HCVs (>16t). For LCVs (<3.5t) a 5 year model refresh cycle was assumed 23 USD/EUR Exchange rate of 0.7781 (January 2012 – December 2012 period average) Source: www.oanda.com/currency/historical-rates/

Study on the Deployment of C-ITS in Europe: Final Report | 201
Ricardo in Confidence Ref: Ricardo/ED60721/Issue Number 1
Ricardo Energy & Environment
modelling is limited to 2030, with initial deployments starting 2018, it is not necessary to consider replacements within this study.
13.4.2 Vehicles with ITS-G5 and cellular
As discussed above, this additional cost category is only relevant to the ‘high’ scenario sensitivity, whereby all V2I services are assumed to be delivered via cellular networks. In this case, a car must be equipped with both ITS-G5 (for V2V services) and cellular (for V2I services) capability.
13.4.2.1 Business model
The business model assumed for the cellular-based in-vehicle ITS sub-systems is much the same as that for ITS-G5 only-based ITS sub-systems. The only discerning factor is that the end-user would incur an additional data charge associated with the in vehicle ITS sub-system’s use of the cellular network for V2I services.
13.4.2.2 Summary of inputs to the cost-benefit analysis
A summary of the key assumptions and inputs to the cost-benefit analysis for vehicles with ITS-G5 and cellular communication is shown in Box 10 below. A full breakdown of costs given in Table 13-6. Sections 13.4.2.1-13.4.2.5 discuss these aspects in more detail.
Box 10. Summary of key assumptions and inputs to the cost-benefit analysis for vehicles with ITS-G5 and cellular
Key assumptions:
In-vehicle ITS sub-systems are only available to new vehicles coming off the production line
Costs are assumed to be consistent across all vehicle categories
Costs associated with the equipment/software required to deliver C-ITS services to vehicles are included, as well as associated integration, testing, software development and ongoing costs
Additional cellular data costs are incurred in order to access V2I services
Costs are assumed to be incurred by the vehicle OEM, except for ongoing maintenance, secure communications and data costs
Two DSRC antennae and transmitter/receivers are assumed necessary, one to send and receive basic safety messages, the other for the security aspects of V2V communication
Table 13-6. Breakdown of costs for vehicles with ITS-G5 and cellular24
Cost item Input Year Cost owner
Upfront costs
DSRC transmitter/receiver €101.17 2012 OEMs
DSRC antenna €7.78 2012 OEMs
Electronic Control Unit €35.02 2012 OEMs
Wiring €7.00 2012 OEMs
Cellular on-board equipment €7.78 2012 OEMs
Installation €5.35 2012 OEMs
Development & integration €15.09 2015 OEMs
24 Development & integration, vehicle software development and vehicle software (updates) costs were calculated separately for freight vehicles and buses. All other costs are assumed to be the same, irrespective of vehicle type.

Study on the Deployment of C-ITS in Europe: Final Report | 202
Ricardo in Confidence Ref: Ricardo/ED60721/Issue Number 1
Ricardo Energy & Environment
Cost item Input Year Cost owner
Vehicle software development
€1.51 2015 OEMs
Ongoing costs
(per year)
Maintenance €7.55 2013 End-user
Secure communications €2.44 2012 End-user
Vehicle software (updates) €3.02 2015 OEMs
Cellular data €2.57 2012 End-user
13.4.2.3 Upfront costs
A total upfront cost per vehicle (to the OEM) of €180.70 was calculated. This is made up of the same components as vehicles with only ITS-G5, however an additional €7.78 (2012 Euros)25 has been added to cover all onboard cellular equipment (NHTSA, 2014).
13.4.2.4 Ongoing costs
Ongoing costs total €15.97 per year, per vehicle. This is made up of the same components as vehicles with only ITS-G5, however an additional cellular data cost (to access V2I services via the cellular networks) is included. The data cost is based on estimates of data volumes required to offer C-ITS services (and a price of $4.00/GB) cited in a US DoT NHTSA report on C-ITS applications (NHTSA, 2014) The data cost for vehicles is assumed to be the same as for mobile phones (€2.57 per year).
13.4.2.5 Lifetime
As for vehicles with only ITS-G5 technology, the lifetime of all new vehicles has been estimated to be 12 years, based on the EasyWay and COBRA studies (EasyWay Cooperative Systems Task Force, 2012; TNO, 2013).
25 $10 (2012 USD). USD/EUR Exchange rate of 0.7781 (January 2012 – December 2012 period average) Source: www.oanda.com/currency/historical-rates/

Study on the Deployment of C-ITS in Europe: Final Report | 203
Ricardo in Confidence Ref: Ricardo/ED60721/Issue Number 1
Ricardo Energy & Environment
13.5 Roadside ITS sub-systems
Roadside ITS sub-systems such as beacons on gantries, poles etc., allow V2I communications along specific stretches of roads. For the purposes of the cost-benefit analysis, roadside ITS sub-systems for ITS-G5 communication are divided into the following two categories:
Upgrades to existing roadside infrastructure/roadside units to enable the delivery of C-ITS systems via ITS-G5. These are relevant in urban areas only, where it is assumed that roadside ITS sub-systems are provided through upgrading existing traffic light systems.
Installation of new roadside units to provide additional ITS-G5 coverage. These are relevant to inter-urban areas, where it is assumed that the required infrastructure is not already in place and that roadside ITS sub-systems must be installed from scratch.
Note that costs for new roadside ITS sub-systems are only relevant in the ‘low’ and ‘central’ scenario sensitivities, whilst in the ‘high’ sensitivity all inter-urban access to V2I services occurs via the cellular networks.
13.5.1 Upgrades to existing roadside ITS sub-systems
13.5.1.1 Business model
It is assumed that the cost of deploying, running and maintaining upgraded roadside ITS sub-systems is assigned to relevant urban transport authorities. Upgrades occur to existing signalised traffic junctions at a rate determined by the various deployment scenarios. It is assumed that one upgraded system is required per urban signalised junction and that this unit is compatible with all of the urban-related services offered in the scenarios, with no additional costs incurred for deploying additional services.
All costs associated with integrating roadside ITS sub-systems into central traffic management centres (TMCs) and with local traffic controllers, are dealt with separately in the central ITS sub-system category. The costs associated with providing software and applications allowing end-users to access the V2I services that roadside ITS sub-systems facilitate are discussed in the central, personal and in-vehicle ITS sub-system categories.
13.5.1.2 Summary of inputs to the cost-benefit analysis
A summary of the key assumptions and inputs to the cost-benefit analysis for existing roadside infrastructure is shown in Box 11 below. A full breakdown of costs is given in Table 13-7. Sections 13.5.1.1- 13.5.1.5 discuss these aspects in more detail.
Box 11. Summary of key assumptions and inputs to the cost-benefit analysis for upgrades to existing roadside infrastructure
Key assumptions:
Upgraded roadside ITS sub-systems only relevant to urban areas, with a growing percentage of all signalised junctions equipped in the scenarios – this is the case across all sensitivities
One upgraded system is required per upgraded urban signalised junction
Upgraded roadside ITS sub-systems have an additional power consumption of 15 – 20 W
Central ITS sub-system integration costs and software application development costs accounted for separately in Section 13.2.
Upgraded roadside ITS sub-system lifetime: 10 years
Table 13-7. Breakdown of costs for upgraded roadside units
Cost item Input Year Cost owner
Upfront costs Equipment/hardware €3,000.00 2015 Highways Agency
Installation/mounting €1,500.00 2015 Highways Agency
Ongoing costs Regular maintenance €150.00 2015 Highways Agency

Study on the Deployment of C-ITS in Europe: Final Report | 204
Ricardo in Confidence Ref: Ricardo/ED60721/Issue Number 1
Ricardo Energy & Environment
Cost item Input Year Cost owner
(per year) Power consumption €18.40 2014 Highways Agency
Data €200.00 2013 Highways Agency
Secure communications €37.68 2014 Highways Agency
13.5.1.3 Upfront costs
The total upfront cost for upgrading an existing roadside unit to be capable of delivering C-ITS functionality has been estimated to be €4,500 based on a literature review and discussions with industry experts during a teleconference held with relevant WG1 members on 12th October 2015. This is composed of:
An equipment/hardware cost, estimated to be €2,500 to €3,500 for a device such as a plug-in unit, situated on top of an existing pole/gantry and capable of 802.11p wireless communication. This unit includes a box (~2kg), omnidirectional antenna, processor and security chip. An equipment cost of €3,000 has been assumed, which is in the middle of the suggested cost range.
Installation and mounting costs will vary depending on the complexity of installation. A simple installation may cost €500, whereas a more complex installation would be in the region of €2,500. An average value of €1,500 has been assumed.
13.5.1.4 Ongoing costs
The annual ongoing cost per roadside unit used in this study is €406.08, which is broken down as follows:
Regular maintenance is assumed to be 5% of the capital cost per year, which equates to €150 per year. Several studies have cited this percentage for maintenance, such as the COBRA study and US focussed NHTSA US DoT Connected Vehicle Field Infrastructure Footprint Analysis (TNO, 2013; NHTSA, 2014). Regular maintenance will include activities such as realigning the antennas, rebooting hardware, checking system operational status and other routine checks (NHTSA, 2014).
Power consumption: WG1 members advised that power consumption required for C-ITS functionality would be in the range of 15 – 20 W for an upgraded roadside unit. Using the second half of 2014 EU industrial average electricity price of €0.12 per kWh leads to a cost of €18.40 per year per roadside unit (Eurostat, 2015).
Data costs, which were based on the COBRA study and were calculated to be €200 per year, per upgraded roadside unit (TNO, 2013).
Secure communications: An extensive study was carried out by the US DoT to assess the costs of secure communications. It assumes that a security credentials management system will need to be developed and implemented (most likely by a private company) and suggests an annual cost of $50 per roadside unit to keep security credentials up to date (NHTSA, 2014). This is equivalent to €37.68 per year26.
13.5.1.5 Lifetime
A lifetime of 10 years has been assumed for roadside ITS sub-systems. This is in keeping with the EasyWay and COBRA studies (EasyWay Cooperative Systems Task Force, 2012; TNO, 2013). When roadside units reach the end of their lifetime, it is assumed that they are replaced for the purposes of the cost-benefit analysis.
26 USD/EUR Exchange rate of 0.7781 (January 2012 – December 2012 period average) Source: www.oanda.com/currency/historical-rates/

Study on the Deployment of C-ITS in Europe: Final Report | 205
Ricardo in Confidence Ref: Ricardo/ED60721/Issue Number 1
Ricardo Energy & Environment
13.5.2 New roadside ITS sub-systems
13.5.2.1 Business model
It is assumed that the cost of deploying, running and maintaining new roadside ITS sub-systems is assigned to relevant highways agencies. Deployments are made to stretches of different road types at a rate determined by the various deployment scenarios, with one new roadside unit required per 1km of inter-urban road. This distance is greater than that stated in the COBRA and EasyWay studies (TNO, 2013; EasyWay Cooperative Systems Task Force, 2012) but was agreed with industry experts (during a teleconference held with relevant WG1 members on 12th October 2015) as a more appropriate figure to use given recent technological advances27. Each roadside unit is assumed to be compatible with all the C-ITS service bundles deployed, with no additional costs associated with adding additional services.
All costs associated with integrating roadside ITS sub-systems into central traffic management centres (TMCs) and with local traffic controllers, or for providing software and applications allowing end-users to access the V2I services that they facilitate, are dealt with separately in the central, personal and in-vehicle ITS sub-system categories.
13.5.2.2 Summary of inputs to the cost-benefit analysis
A summary of the key assumptions and inputs to the cost-benefit analysis for new roadside infrastructure is shown in Box 12 below. A full breakdown of costs is given in Table 13-8. Sections 13.5.2.1-13.5.2.513.5.2.1 discuss these aspects in more detail.
Box 12. Summary of key assumptions and inputs to the cost-benefit analysis for new roadside infrastructure
Key assumptions:
New roadside ITS sub-systems only relevant to inter-urban areas, with a growing percentage of different road types equipped in the scenarios. This is not the case in the ‘high’ sensitivity, where no inter-urban roadside infrastructure is required due to the near-ubiquitous coverage provided by cellular networks – which are assumed to provide all V2I services in the ‘high’ sensitivity
One new system is required per 1km of road equipped
New roadside ITS sub-systems have an additional power consumption of 30 – 50 W
Central ITS sub-system integration costs and software application development costs accounted for separately in Section 13.2.
New roadside ITS sub-system lifetime: 10 years
Table 13-8. Breakdown of costs for new roadside units
Cost item Input Year Cost owner
Upfront costs Equipment/hardware €6,000.00 2015 Highways Agency
Installation/mounting €7,500.00 2015 Highways Agency
Ongoing costs
(per year)
Regular maintenance €300.00 2015 Highways Agency
Power consumption €42.05 2014 Highways Agency
Data €200.00 2013 Highways Agency
Secure communications €37.68 2014 Highways Agency
27 COBRA assumes one roadside ITS sub-system every 300m and states “the upper bound on range is normally quoted as 1000m based on the
latency requirements, but 300m allows a higher bit rate and a more reliable connection to be achieved, and this is the range often quoted”

Study on the Deployment of C-ITS in Europe: Final Report | 206
Ricardo in Confidence Ref: Ricardo/ED60721/Issue Number 1
Ricardo Energy & Environment
13.5.2.3 Upfront costs
The total upfront cost to install a new roadside unit to be capable of delivering C-ITS functionality has been estimated to be €13,500 based on a literature review and discussions with industry experts during a teleconference held with relevant WG1 members on 12th October 2015. This is composed of:
An equipment/hardware cost: Installation of new base units in areas without previous roadside infrastructure is expected to be more costly than upgrading existing roadside units. The equipment cost for a new roadside ITS sub-system with traffic monitoring sensors is estimated to cost €6,000, as reported in the EasyWay, COBRA studies (EasyWay Cooperative Systems Task Force, 2012; TNO, 2013). This cost was broadly in the range suggested by industry experts and other EU studies such as SAFESPOT ( (BASt et al., 2010).
Installation and mounting costs, which will vary depending on the complexity of installation. Research shows that a number of activities are typically required for RSU installation and that costs will be highly site (and possibly Member State) dependent. A report issued by the US DoT (NHTSA, 2014) suggests that in addition to equipment and installation costs, the following activities must be considered:
o Radio survey per site – to determine optimum placement of the ITS-G5 radio and antenna for maximum coverage
o Map / GID generation – to accurately map the road layout, especially at intersections
o Planning – estimated to be 5% of total cost
o Design – costs related to installation of RSUs in each location
o System integration and licence – administration costs associated with the new RSU
o Traffic control – during installation of the unit, including any safety signage
Industry experts suggest that a simple installation including the above may cost €3,000, whereas a more complex installation would be in the region of €12,000. An average value of €7,500 has been assumed. For reference, an installation cost of €10,000 was assumed in the EasyWay project (EasyWay Cooperative Systems Task Force, 2012).
13.5.2.4 Ongoing costs
The annual ongoing cost per roadside unit used in this study is €579.73, which is broken down into:
Regular maintenance is assumed to be 5% of the capital cost per year, which equates to €300 per year. Several studies have cited this percentage for maintenance, such as the COBRA study and US focussed NHTSA US DoT Connected Vehicle Field Infrastructure Footprint Analysis (TNO, 2013; NHTSA, 2014). Regular maintenance will include activities such as realigning the antennas, rebooting hardware, checking system operational status and other routine checks (NHTSA, 2014).
Power consumption: WG1 members advised that power consumption required for new roadside ITS sub-systems would be in the range of 30 – 50 W. Using a power consumption of 40 W and the second half of 2014 EU industrial average electricity price of €0.12 per kWh, leads to an annual cost of €42.05 per year per roadside unit (Eurostat, 2015).
Data costs, which were based on the COBRA study and were calculated to be €200 per year, per new roadside ITS sub-system (TNO, 2013).
Secure communications: An extensive study was carried out by the US DoT to assess the cost of secure communications. It assumes that a security credentials management system will need to be developed and implemented (most likely by a private company) and suggests an annual cost of $50 per roadside unit to keep security credentials up to date (NHTSA, 2014). This is equivalent to €37.68 per year28.
13.5.2.5 Lifetime
A lifetime of 10 years has been assumed for roadside ITS sub-systems. This is in keeping with the EasyWay and COBRA studies (EasyWay Cooperative Systems Task Force, 2012; TNO, 2013). When roadside units reach the end of their lifetime, it is assumed that they are replaced for the purposes of the cost-benefit analysis.
28 USD/EUR Exchange rate of 0.7781 (January 2012 – December 2012 period average) Source: www.oanda.com/currency/historical-rates/

Study on the Deployment of C-ITS in Europe: Final Report | 207
Ricardo in Confidence Ref: Ricardo/ED60721/Issue Number 1
Ricardo Energy & Environment
14 References
ACEA. (2011 - 2013). New registrations in Europe by manufacturer and vehicle category (Enlarged Europe). Retrieved from http://www.acea.be/statistics/tag/category/by-manufacturer-registrations
ACEA. (2014). The European Automotive Industry. Economic situation & Key challenges. OICA Round table 'The World Auto Industry: Situation and trends'.
ACEM. (2009). MAIDS In-depth investigations of accidents involving powered two wheelers. Final Report 2.0.
Alleven, M. (2015, 05 10). Cisco, automakers to test 'listen, detect and avoid' protocol for auto safety in 5.9 GHz band. FierceWirelessTech. Retrieved from http://www.fiercewireless.com/tech/story/cisco-automakers-test-listen-detect-and-avoid-protocol-auto-safety-59-ghz-b/2015-05-10
Amsterdam Group. (2013). Roadmap between automotive industry and infrastructure organisations on initial deployment of Cooperative ITS in Europe, Version 1.0. Retrieved from Roadmap between automotive industry and infrastructure organisations on initial deployment of Cooperative ITS in Europe Version 1.0
Auerbach, P. M. (1988). An analysis of ambulance accidents in Tennessee. JAMA, 258, 1487-1490.
Austroads. (2011). Evaluation of the potential safety benefits of collision avoidance technologies through V2V DSRC in Australia. Sydney: Austroads Ltd.
Austroads. (2012). Cooperative ITS Strategic Plan. Sydney: Austroads Ltd.
Austroads. (2014a). National ITS Architecture: Context and Vision. Sydney: Austroads Ltd.
Austroads. (2014b). National ITS Architecture: Business Architecture. Sydney: Austroads Ltd.
Austroads. (2015). Cooperative Intelligent Transport Systems (C-ITS) Standards Assessment. Sydney: Austroads Ltd.
Austroads. (2015). Cooperative Intelligent Transport Systems (C-ITS) Standards Assessment. Sydney: Austroads.
Austroads. (2015). Cooperative Intelligent Transport Systems (C-ITS) Standards Assessment, Austroads Research Report by David Green, Charles Karl and Freek Faber.
BASt et al. (2010). SAFESPOT INTEGRATED PROJECT - IST-4-026963-IP. Report on socio-economic, market and financial assessment. Deliverable D6.5.1. Business models, Legal, Aspects, and DEployment.
Blythe, P. (2015). Smart Traffic Management & Cooperative, Autonomous and Driverless cars. Retrieved from http://www.its-uk.org.uk/filelibrary/file/19-3-15ITSonyourdoorstepBlythe.pdf
BMW. (2014). COMeSafety2, Deliverable D2.3 Cost Benefits Analysis & Business Model Elements for Deployment.
C2C-CC. (2007). Manifesto. Retrieved from http://elib.dlr.de/48380/1/C2C-CC_manifesto_v1.1.pdf
C2C-CC. (2011). Memorandum of Understanding for OEMs within the CAR 2 CAR Communication Consortium on Deployment Strategy for cooperative ITS in Europe. Retrieved from https://www.car-2-car.org/index.php?eID=tx_nawsecuredl&u=0&g=0&t=1435663269&hash=42a4abd6a06df5b7836bafcfe9bdca507e85f28c&file=fileadmin/downloads/PDFs/MoU_on_deployment-v40001.02_final.pdf
CAR 2 CAR Communication Consortium. (2015). Press release - 30 October 2015. European vehicle manufacturers work towards bringing Vehicle-to-X Communication onto European roads. Retrieved November 10, 2015, from https://www.car-2-car.org/index.php?eID=tx_nawsecuredl&u=0&g=0&t=1447509103&hash=37cdf2039ad1aafe12fae3967b6b905286dfbdd1&file=fileadmin/downloads/PDFs/CAR_2_CAR_Communication_Consortium_Press_Release_10_2015.pdf

Study on the Deployment of C-ITS in Europe: Final Report | 208
Ricardo in Confidence Ref: Ricardo/ED60721/Issue Number 1
Ricardo Energy & Environment
CARE database, European Commission. (2015). Retrieved from http://ec.europa.eu/transport/road_safety/specialist/statistics/index_en.htm
CEPT. (2015, 03 06). CEPT Report 57: Report A from CEPT to the European Commission inr esponse to the Mandate. Retrieved from http://www.erodocdb.dk/Docs/doc98/official/pdf/CEPTREP057.PDF
C-ITS Corridor. (2013). Flyer: Cooperative ITS Corridor Joint Deployment. Retrieved from http://www.bmvi.de/SharedDocs/EN/Anlagen/VerkehrUndMobilitaet/Strasse/cooperative-its-corridor.pdf?__blob=publicationFile
C-ITS Corridor. (2014). Erster Entwurf "Gesamtarchitektur" - Dokument D 01 der Projektgruppe 1 Systemarchitektur. Retrieved from http://c-its-korridor.de/data/download/Gesamtarchitektur%20C-ITS.pdf
C-ITS Corridor website. (2015). Retrieved from c-its-korridor.de
Clawson, J. M. (1997). The Wake Effect: Emergency Vehicle-Related Collisions. Prehospital and Disaster Medicine, 12 (4). Retrieved from http://www.emergencydispatch.org/articles/wakeeffect1.htm
Co-Cities. (n.d.). Project Overview. Retrieved from http://co-cities.eu/content/project-overview
COMeSafety2. (2013). Flash Report: 9th ITS Conference in Dublin.
COMeSafety2. (2014). D2.3 Cost Benefits Analysis & Business Model Elements for Deployment.
CRF, BASt, ERTICO, VOLVO, Hess-Consult, BMW. (2014). D3.5 Advances in harmonizing the Deployment Approach for C-ITS in Europe. COMeSafety2.
DfT. (2011). Intelligent Transport Systems in the United Kingdom: Initial Report. UK Department for Transport. Retrieved from https://www.gov.uk/government/uploads/system/uploads/attachment_data/file/3734/its-uk-initial-report.pdf
DfT. (2012). Intelligent Transport Systems in the UK. Report on Information on National ITS actions envisaged over a five year period. UK Department for Transport. Retrieved from http://ec.europa.eu/transport/themes/its/road/action_plan/doc/2012-united-kingdom-its-5-year-plan-2012_en.pdf
DfT. (2014). ntelligent Transport Systems in the UK: Progress Report. As required by European Union Directive 2010/40/EU. Retrieved from http://ec.europa.eu/transport/themes/its/road/action_plan/doc/2014_uk_its_report_2014_en.pdf
DfT. (2015). The Pathway to Driverless Cars: detailed review of regulations for automated vehicle technologies. UK Department for Transport. Retrieved from https://www.gov.uk/government/uploads/system/uploads/attachment_data/file/401565/pathway-driverless-cars-main.pdf
DG CONNECT. (2012). Unlocking the ICT growth potential in Europe.
DGITM. (2014). EU Financial Aid Application Form: Technical and financial information. Retrieved from http://www.collaboratif-metier.dgmt.equipement.gouv.fr/IMG/pdf/SCOOP_F_-_Part_1_-_Form_B2_cle1e1b7b.pdf
DGITM. (2015). Project SCOOP Lettre d’info N°2, Avril 2015. Retrieved from http://www.collaboratif-metier.dgmt.equipement.gouv.fr/IMG/pdf/news_scoop_no2_cle5c51d1-2.pdf
Dingus, T. K. (2006). The 100-Car Naturalistic Driving Study, Phase II – Results of the 100-Car Field. U.S. Department of Transportation, National Highway Traffic.
DriveEuropeNews. (2014, September 15). New Efforts to Tackle Wrong Way Driving - New Austria Vignette. Retrieved from DriveEuropeNews: http://driveeuropenews.com/2014/09/15/new-austria-vignette/
E15. (2013, 11 13). ČVUT testuje revoluční systém: auta si budou vzájemně sdělovat údaje. Retrieved from http://zpravy.e15.cz/byznys/doprava-a-logistika/cvut-testuje-revolucni-system-auta-si-

Study on the Deployment of C-ITS in Europe: Final Report | 209
Ricardo in Confidence Ref: Ricardo/ED60721/Issue Number 1
Ricardo Energy & Environment
budou-vzajemne-sdelovat-udaje-1037501#utm_medium=selfpromo&utm_source=e15&utm_campaign=copy
E3MLab. (2014). PRIMES-TREMOVE, Reference Scenario 2014.
EasyWay. (2012). Business case and benefit-cost assessment of EasyWay priority cooperative services.
EasyWay Cooperative Systems Task Force. (2012). Business case and benefit-cost assessment of EasyWay priority cooperative services. EasyWay ICT Infrastructures Expert and Studies Group.
ECo-AT. (2015). Publication Event of Release 1 Documents.
ECo-AT. (2015a). Publication Event of Release 1 Documents. Retrieved from http://ecoattest.anachb.at/downloads-206.html?file=tl_files/dynamic_dropdown/uploads/Presse/Praesentationen/ECo-AT_Publication%20Event%20of%20Release%201%20Documents_20150115.pdf
eImpact. (2008). D6 Cost-Benefit Analyses for stand-alone and co-operative Intel-ligent Vehicle Safety Systems.
Elling, R. (1988). Dispelling myths on ambulance accidents. Journal of Emergency Medical Services, 11, 60-64.
ERTICO - ITS Europe. (2015, 03 18). Guide about technologies for future C-ITS service scenarios. Draft version 0.1. Retrieved from http://www.telematicsvalley.org/assets/Guide-about-technologies-for-future-C-ITS-services-v1-0.pdf
eSafetyForum. (2010). Final Report and Recommendations of the Intelligent Infrastructure Working Group v1.0.
ETSI. (2009). ETSI ES 202 663 V1.1.0 (2009-11). Retrieved from http://www.etsi.org/deliver/etsi_ES/202600_202699/202663/01.01.00_50/es_202663v010100m.pdf
ETSI. (2009). Intelligent Transport Systems (ITS); Vehicular Communications; Basic Set of Applications; Definitions.
European Commission. (2008, 12 16). Brussels, 16.12.2008 COM(2008)Proposal for a DIRECTIVE OF THE EUROPEAN PARLIAMENT AND OF THE COUNCIL laying down the framework for the deployment of Intelligent Transport Systems in the field of road transport and for interfaces with other transport modes. Retrieved from http://eur-lex.europa.eu/legal-content/EN/TXT/PDF/?uri=CELEX:52008PC0887&from=EN
European Commission. (2014). C-ITS Draft Work Programme. Retrieved from http://ec.europa.eu/transport/themes/its/news/doc/c-its-platform-deployment/draft-work-programme.pdf
European Commission. (2014). Commission Decision (EU) 2015/1966 of 9 July 2014 on the State aid SA. 34118 (2012/C ex 2011/N) which Germany is planning to implement in favour of Porsche Leipzig GmbH and Dr Ing. H.c.F. Porsche Aktiengesellschaft. Official Journal of the European Union. Retrieved from http://eur-lex.europa.eu/legal-content/EN/TXT/PDF/?uri=CELEX:32015D1966&from=EN
European Commission. (2014, March 19). Infrastrucure - TEN-T - Connecting Europe. Retrieved from European Commission Mobility and Transport: http://ec.europa.eu/transport/themes/infrastructure/ten-t-guidelines/project-funding/cef_en.htm
European Commission. (2014). Progress Report and review of the ITS action plan.
European Commission. (2014). SCOOP@F - Part 1. Project Fiche. TEN-T Annual Programme. Retrieved from https://ec.europa.eu/inea/sites/inea/files/download/project_fiches/france/fichenew_2013fr92004s_final.pdf
European Commission. (2015). Eurostat HICP (2005 = 100) - annual data (average index and rate of change). European Commission. Retrieved from http://ec.europa.eu/eurostat/statistics-

Study on the Deployment of C-ITS in Europe: Final Report | 210
Ricardo in Confidence Ref: Ricardo/ED60721/Issue Number 1
Ricardo Energy & Environment
explained/index.php?title=Consumer_prices_-_inflation_and_comparative_price_levels&oldid=238875
European Commission C-ITS Platform. (2015). Deployment Draft Work Programme. Retrieved from http://ec.europa.eu/transport/themes/its/news/doc/c-its-platform-deployment/draft-work-programme.pdf
European Environment Agency. (2014). Monitoring of CO2 emissions from passenger cars - Regulation 443/2009.
Eurostat. (2010). Employment (main characteristics and rates) - annual averages (lfsi_emp_a). Total employment (2010) resident population concept - LFS. European Commission. Retrieved from http://ec.europa.eu/eurostat/web/lfs/data/database
Eurostat. (2015, May). Energy price statistics. Retrieved October 16, 2015, from http://ec.europa.eu/eurostat/statistics-explained/index.php/Energy_price_statistics#Electricity_prices_for_industrial_consumers
Eurotransport. (2013). ITS: Das Dreierbündnis. Retrieved from http://www.eurotransport.de/news/das-dreierbuendnis-6526467.html
Fouchal. (2015). SCOOP@F A French C-ITS project. http://docbox.etsi.org/Workshop/2015/201503_ITSWORKSHOP/SESSION02_CITS_Release1andUsageofStandards/SCOOP_Fouchal.pdf.
Gantelet, E., & Lefauconnier, A. (2006). THE TIME LOOKING FOR A PARKING SPACE: STRATEGIES, ASSOCIATED NUISANCES AND STAKES OF PARKING MANAGEMENT IN FRANCE. Paris: Sareco, Association for European Transport.
Geißler. (2013). Roadmap strategy of the Amsterdam Group.
Härri, J., & Kenney, J. (2015). Multi-Channel Operations, Coexistence and Spectrum Sharing for Vehicular Communications. In Vehicular ad hoc Networks. Springer. Retrieved from http://link.springer.com/chapter/10.1007%2F978-3-319-15497-8_7
Hess. (2013). Roadmap strategy of the Amsterdam Group. Retrieved from http://www.comesafety.org/fileadmin/user_upload/PDFs/Praesentation_Hess.pdf
Honda. (2014). PTW Digital Conspiquity for Safety: DRIVE C2X project. Opportunities and Challenges. European Motorcyclists' Forum.
Hungarian Ministry of Foreign Affairs and Trade. (2015). Hungarian foreign trade goals can only be reached with growth of the automotive industry. Retrieved November 12, 2015, from Website of the Hungarian Government, Ministry of Foreign Affairs and Trade: http://www.kormany.hu/en/ministry-of-foreign-affairs-and-trade/news/hungarian-foreign-trade-goals-can-only-be-reached-with-the-growth-of-the-automotive-industry
Hutchens, G. (2013). Australia's ailing car industry in desperate need of a saviour. Retrieved from http://www.drive.com.au/motor-news/australias-ailing-car-industry-in-desperate-need-of-a-saviour-20130412-2hruy
IDRRIM. (2015). Conférence IDRRIM du 28 mai 2015 : Présentation du projet SCOOP. Retrieved from http://www.idrrim.com/actualites-presse/2015-06-04,3582.htm
IEEE Spectrum. (2014, 12 30). Europe’s Smart Highway Will Shepherd Cars From Rotterdam to Vienna. Retrieved from http://spectrum.ieee.org/transportation/advanced-cars/europes-smart-highway-will-shepherd-cars-from-rotterdam-to-vienna
IFSTTAR. (2015). Dossier de Presse, Janvier 2015. Institut français des sciences et technologies des transports, de l'aménagement et des réseaux. Retrieved from http://www.ifsttar.fr/fileadmin/redaction/5_ressources-en-ligne/Communication/Espace_presse/Dossiers_de_presse/Dossier_de_presse_IFSTTAR_janvier_2015.pdf
Intens. (n.d.). Research Activities: Increasing road traffic security by means of car cooperating systems supporting communication of a car with other cars or with intelligent transport infrastructure. Retrieved from http://intens.cz/en/rad.html

Study on the Deployment of C-ITS in Europe: Final Report | 211
Ricardo in Confidence Ref: Ricardo/ED60721/Issue Number 1
Ricardo Energy & Environment
ITS International. (2012a). Car to car communications a step closer.
ITS International. (2013). Amsterdam Group turn ITS theory into practice. Retrieved from http://www.itsinternational.com/categories/utc/features/amsterdam-group-turn-its-theory-into-practice/
ITS Niedersachsen. (2012). CAR 2 CAR Communication Consortium. Retrieved from http://www.its-nds.de/pages/en/projects/car-2-car.php
ITS UK. (n.d.). Connected Vehicle Interest Group. Retrieved from http://www.its-uk.org.uk/interestgroups/group/co-operative-vehicle-highways-systems-cvhs
Jandrisits. (2014). The C-ITS corridor and the interrelation to the Amsterdam Group.
John A. Volpe National Transportation Systems Center. (2008). Vehicle-Infrastructure Integration (VII) Initiative. Benefit-Cost Analysis Version 2.3 (Draft). Intelligent Transportation Systems Joint Program Office, U.S. Department of Transport.
Liljegren, E. (2014). Traffic accidents in connection to road work in Sweden. Paris: Transport Research Arena.
Lotz, C. (2013). Cooperative ITS Corridor Joint Deployment. Retrieved from http://www.comesafety.org/fileadmin/user_upload/PDFs/Praesentation_Lotz.pdf
MEDDE. (2014). SCOOP@F: Test deployment project of cooperative intelligent transport systems. Fact Sheet of May 2014. French Ministry of Ecology, Sustainable Development and Energy. Retrieved from http://www.developpement-durable.gouv.fr/IMG/pdf/49b_DGITM_scoop_GB_2p_def_web.pdf
Mellor, J. (2014). Australia’s Once-Vibrant Auto Industry Crashes in Slow Motion. New York: New York Times.
Ministerstvo dopravy. (2015). Akční plán rozvoje inteligentních dopravních systémů (ITS) v ČR do roku 2020 (s výhledem do roku 2050). Retrieved from http://www.czechspaceportal.cz/3-sekce/its---dopravni-telematika/akcni-plan-rozvoje-its/
Mühlbacher, D. (2013). Ergebnisse Feldversuch – Teil F_2.2.3 Längsführungsassistent. Working Document W43.2. simTD.
National Transport Commission. (2013). Cooperative Intelligent Transport Systems Final Policy Paper. Melbourne: National Transport Commission.
NHTSA. (2014). Vehicle-to-Vehicle Communications: Readiness of V2V Technology for Application. (Report No. DOT HS 812 014). Washington, DC: National Highway Traffic Safety Administration.
ONS. (2014). Type I employment multipliers and effects by SU114 industry and sector (market, government and NPISH). Reference year: 2010. Office for National Statistics.
PREDIM. (2014). Projet SCOOP@F. 12 March 2014. Retrieved from http://www.predim.org/IMG/pdf/predim_-_scoop_f_12_mars_2014.pdf
Ricardo-AEA et al. (2014). Update of the Handbook on External Costs of Transport. European Commission - DG Mobility and Transport.
Ricardo-AEA et al. (2014). Update of the Handbook on External Costs of Transport - Final Report. Retrieved from http://ec.europa.eu/transport/themes/sustainable/studies/doc/2014-handbook-external-costs-transport.pdf
Ricardo-AEA et al. (2014). Update of the Handbook on External Costs of Transport - Final Report. Retrieved from http://ec.europa.eu/transport/themes/sustainable/studies/doc/2014-handbook-external-costs-transport.pdf
SAFESPOT. (2010). SP6 - BLADE - Business models, Legal Aspects, and DEployment. Report on socio-economic, market and financial assessment. BASt, CRF, CSST, MMSE, RWS, TNO, UoC.
Schofield, M. (2015). Surface Transport Technology Forum presentation. Retrieved from http://www.its-uk.org.uk/filelibrary/file/24-6-15LADaySchofield.pdf
Study on the Deployment of C-ITS in Europe: Final Report | 212
Ricardo in Confidence Ref: Ricardo/ED60721/Issue Number 1
Ricardo Energy & Environment
SCOTI. (2012). Policy Framework for Intelligent Transport System in Australia. Canberra: Commonwealth of Australia.
Shi, L., & Sung, K. W. (2014). Spectrum Requirement for Vehicle-to-Vehicle Communication for Traffic Safety, Vehicular Technology Conference (VTC Spring), 2014 IEEE 79th. Retrieved from https://www.metis2020.com/wp-content/uploads/publications/VTCSpring_2014_Shi_etal_SpectrumRequirementForV2VCommunication.pdf
simTD. (2013). simTD: shaping the future of road safety and mobility via car-to-x communication. Retrieved November 2, 2015, from Safe and Intelligent Mobility Test Field Germany: http://simtd.de/index.dhtml/enEN/
Sjöberg, K. (2011). Standardization of Wireless Vehicular Communications within IEEE and ETSI . Retrieved from http://www.hh.se/download/18.16490bf0133abd6557e8000209/1341267475825/WWVC2011Standardization.KS.pdf
Skov Andersen, N. P. (2014). Belgium-UNECE Workshop on Intelligent Transport Systems. Retrieved from http://www.unece.org/fileadmin/DAM/trans/events/2014/Joint_BELGIUM-UNECE_ITS/04_ITS_Nov2014_Niels_Peter_Skov_Andersen__Car2car_Communication_Consortium.pdf
Skov Andersen, N. P. (2014). Belgium-UNECE Workshop on Intelligent Transport Systems. Retrieved from http://www.unece.org/fileadmin/DAM/trans/events/2014/Joint_BELGIUM-UNECE_ITS/04_ITS_Nov2014_Niels_Peter_Skov_Andersen__Car2car_Communication_Consortium.pdf
Skov Andersen, N. P. (2015). C-ITS Acticities in Europe, ICT for Next Generation ITS, 6 March 2015. Retrieved from http://mic-its-conference-2015.net/data/pdf/etsi.pdf
Şoriga, Ş. G. (2012). ITS-G5 AND MOBILE WIMAX PERFORMANCE IN VEHICLE-TO-INFRASTRUCTURE COMMUNICATIONS. UPB Scientific Bulletin, Series C: Electrical Engineering.
TfL, TRL, University of Southampton. (2009). UITP WORKING GROUP: Interaction of buses and signals at road crossings. Deliverable 1. Review of Bus Priority at Traffic Signals around the World.
The Conference Board. (2014). Unlocking the ICT growth potential in Europe: Enabling people and businesses. Using Scenarios to Build a New Narrative for the Role of ICT in Growth in Europe. European Commission DG Communications Networks, Content & Technology. doi:10.2759/37323
TNO. (2009). Impact of Information and Communication Technologies on Energy Efficiency in Road Transport - Final Report. Delft, Netherlands: TNO.
TNO. (2013). COBRA Deliverable 2. Methodology framework, Update. COBRA Consortium.
TNO. (2014). DRIVE C2X Deliverable D11.6. Final Report.
TNO et al. (2014). DRIVE C2X Deliverable D11.4. Impact Assessment and User Perception of Cooperative Systems.
TNO, VTT, Movea, PTV, BASt. (2008). eIMPACT Impact assessment of Intelligent Vehicle Safety Systems. Deliverable D4.
TomTom. (2015). TomTom and Vodafone sign agreement to bring the world's most advanced traffic information service to Portugal. Retrieved from TomTom: http://corporate.tomtom.com/releasedetail.cfm?ReleaseID=352037
Transmax. (2015). South East Queensland: Emergency Vehicle Priority addresses the increasing demand for emergency services. Retrieved 2015, from https://www.transmax.com.au/cms/streams-intelligent-transport-system/case-studies/south-east-queensland
Study on the Deployment of C-ITS in Europe: Final Report | 213
Ricardo in Confidence Ref: Ricardo/ED60721/Issue Number 1
Ricardo Energy & Environment
Transport for NSW. (2015). FAQs: The Cooperative Intelligent Transport Initiative. Retrieved 2015, from http://roadsafety.transport.nsw.gov.au/research/roadsafetytechnology/cits/citi/faqs.html
Transport Network. (2015, 06 04). Professor named DfT's chief scientific adviser. Retrieved from http://www.transport-network.co.uk/Professor-named-DfTs-chief-scientific-adviser/11793
Trusted Reviews. (2013, November 26). TomTom GO 5000 review. Retrieved November 4, 2015, from Trusted Reviews: http://www.trustedreviews.com/tomtom-go-5000-review
Trusted Reviews. (2014, October 1). TomTom Start 50 review. Retrieved November 4, 2015, from Trusted Reviews: http://www.trustedreviews.com/tomtom-start-50-review
Tsiaras, C., Hobi, L., Hofstetter, F., Liniger, S., & Stiller, B. (2015). parkITsmart: Minimization of Cruising for Parking. University of Zurich. Retrieved November 3, 2015, from https://files.ifi.uzh.ch/CSG/staff/tsiaras/Extern/Publications/ICCCN15.pdf
U.S. Department of Transportation. (2014). National Connected Vehicle Field Infrastructure Footprint Analysis. Intelligent Transport Systems/Joint Program Office. American Association of State Highway and Transportation Officials (AASHTO).
U.S. DoT. (2014a). USDOT’s Intelligent Transportation Systems Strategic Plan 2015- 2019. Washington, DC: United States Department of Transportation.
U.S. DoT. (2014b). Vehicle-to-Vehicle Communications: Readiness of V2V Technology for Application. Washington, DC: U.S. DoT.
U.S. DoT. (2014c). Advance notice of proposed rulemaking: Federal Motor Vehicle Safety Standards: V2V Communications [Docket No. NHTSA–2014–0022]. Washington, DC: Federal Register.
U.S. DoT. (2014d). Questions and Answers about DOT's Safety Pilot "Model Deployment". Washington, DC: U.S. DoT. Retrieved from http://www.safercar.gov/staticfiles/safercar/connected/Technical_Fact_Sheet-Model_Deployment.pdf
U.S. DoT. (2015a). Planning for the Future of Transportation: Connected Vehicles and ITS. Washington, DC: U.S. DoT. Retrieved from http://www.its.dot.gov/factsheets/pdf/PlanningFutureTransportation_FactSheet.pdf
U.S. DoT. (2015b). CV Pilots Deployment Project. Retrieved from http://www.its.dot.gov/pilots/cv_pilot_plan.htm
U.S. DoT. (2015c). Intelligent Transport Systems (ITS) Research Program. Retrieved from http://www.its.dot.gov/research.htm
U.S. DoT. (2015d). Connected Vehicle Policy and Institutional Issues. Retrieved from http://www.its.dot.gov/connected_vehicle/connected_vehicle_policy_plan.htm
U.S. DoT. (2015e). Connected Vehicle Technology Standards. Retrieved from http://www.its.dot.gov/connected_vehicle/connected_vehicle_standards.htm
U.S. DoT. (2015f). Federal Business Opportunities Solicitation Number DTFH6115R00003. Retrieved from https://www.fbo.gov/index?s=opportunity&id=4bb15d96ee07527727b95f8eaf606e49
US EPA, NHTSA. (2012). Joint Technical Support Document: Final Rulemaking for 2017-2025 Light-Duty Vehicle Greenhouse Gas Emission Standards and Corporate Average Fuel Economy Standards. United States Environmental Protection Agency, National Highway Traffic Safety Administration. Retrieved from http://www3.epa.gov/otaq/climate/documents/420r12901.pdf
USDoT. (2014). National Connected Vehicle Field Infrastructure Footprint Analysis Final Report.
ViaZONE website. (2014). Retrieved from http://www.viazone.cz/en/
VTT. (2010). iMobility Effects Database. Retrieved from http://www.imobility-effects-database.org/
VTT. (2015). iMobility effects database- Dynamic navigation systems. Retrieved from iMobility effects database: http://www.imobility-effects-database.org/applications_17.html
VTT, TRL. (2008). CODIA Deliverable 5. Final Study report.

Study on the Deployment of C-ITS in Europe: Final Report | 214
Ricardo in Confidence Ref: Ricardo/ED60721/Issue Number 1
Ricardo Energy & Environment
Wall, J. (2013). The CITI Project: Building Australia's first Cooperative Intelligent Transport System test facility for safety applications. Brisbane: Proceedings of the 2013 Australasian Road Safety Research, Policing & Education Conference.

The Gemini Building Fermi Avenue Harwell Didcot Oxfordshire OX11 0QR United Kingdom
t: +44 (0)1235 753000 e: [email protected]
ee.ricardo.com