Market Profiles and Competitiveness Inventory Report—Volume 2

STUDY ON MARKET
COMPETITIVENESS AND
FINANCIAL PATTERNS OF FARMER
PRODUCER ORGANISATIONS
(FPOs) IN TELANGANA AND
KARNATAKA
M.KANDEEBAN B.Sc., (Ag.)
MASTER OF BUSINESS ADMINISTRATION
(AGRIBUSINESS MANAGEMENT)
2015

STUDY ON MARKET COMPETITIVENESS
AND FINANCIAL PATTERNS OF FARMER
PRODUCER ORGANISATIONS (FPOs) IN
TELANGANA AND KARNATAKA
BY
M.KANDEEBAN B.Sc., (Ag)
PROJECT SUBMITTED TO THE
ACHARYA N.G. RANGA AGRICULTURAL UNIVERSITY
IN PARTIAL FULFILMENT OF THE REQUIREMENTS
FOR THE AWARD OF THE DEGREE OF
MASTER OF BUSINESS ADMINISTARTION (AGRIBUSINES MANAGEMENT)
CHAIRPERSON: Smt.Y.PRBHAVATHI
DEPARTMENT OF AGRIBUSINESS MANAGEMENT AGRICULTURAL COLLEGE, TIRUPATI
ACHARYA N.G. RANGA AGRICULTURAL UNIVERSITY
RAJENDRANAGAR, HYDERABAD – 500 030
2015

I
DECLARATION
I, Mr. M.KANDEEBAN, hereby declare that the project entitled “STUDY
ON MARKET COMPETITIVENESS AND FINANCIAL PATTERNS OF
FARMER PRODUCER ORGANISATIONS (FPOs) IN TELANGANA
AND KARNATAKA” submitted to Acharya N.G. Ranga Agricultural
University, Hyderabad for the award of degree of MASTER OF BUSINESS
ADMINISTARTION (ABM) is the result of original research work done by
me. I also declare that no material contained in this project has been published
earlier in any manner.
Place: (M.KANDEEBAN)
Date: I.D No- TMBA- 2013/09

II
CERTIFICATE
Mr. M.KANDEEBAN has satisfactorily prosecuted the course of research
and that the project entitled “STUDY ON MARKET COMPETITIVENESS
AND FINANCING PATTERNS OF FARMER PRODUCER
ORGANISATIONS (FPOs) in TELANGANA AND KARNATAKA”
submitted is the result of original research work and is of sufficiently high
standard to warrant its presentation to the examination. I also certify that
neither the project nor its part thereof has not been previously submitted by him
for a degree of any university.
Date :
(Smt. Y. PRABHAVATHI)
Assistant Professor
Department of Agricultural Business
Management
S.V. Agricultural College,
Tirupati.

III
CERTIFICATE
This is to certify that the project entitled “STUDY ON MARKET
COMPETITIVENESS AND FINANCIAL PATTERNS OF FARMER
PRODUCER ORGANISATIONS (FPOs) IN TELANGANA AND
KARNATAKA” submitted in partial fulfillment of the requirements for the award
of degree of ‘MASTER OF BUSINESS ADMINISTRATION (ABM) to the
Acharya N.G. Ranga Agricultural University, Hyderabad, is a record of the
bonafide research work carried out by Mr. M.KANDEEBAN under our
guidance and supervision. The subject of the project has been approved by the
Student’s Advisory Committee.
No part of the project has been submitted by the student for the award of
any other degree or diploma. The published part has been fully acknowledged.
All assistance and help received during the course of the investigations have been
duly acknowledged by the author of the thesis.
Thesis approved by the Student’s Advisory Committee
Chairperson : Smt. Y. PRABHAVATHI
Assistant Professor
Department of Agricultural Business
Management
S.V. Agricultural college,
Tirupati- 517502, A.P
______________
Member : Dr. B. APARNA
Assistant Professor
Department of Agricultural Economics
S.V. Agricultural college,
Tirupati- 517502, A.P.
______________
Member : Dr. G. MOHAN NAIDU
Assistant Professor and Head
Department of Statistics and
Mathematics
S.V. Agricultural college,
Tirupati- 517502, A.P.
______________
Date of final viva-voce:

IV
ACKNOWLEDGEMENT
There are no proper words to convey my deep gratitude and respect for my Project and research advisor, Smt. Y.PRABHAVATHI. She has inspired me to become an independent researcher and helped me realize the power of critical reasoning.
I am also indebted to Dr. P.RAGHURAM, who has been constant source of encouragement and enthusiasm, not only during this project work but also during the two years of my Masters program.
With deep respect and esteem regards I owe my indebtedness to Dr.I.BHAVANIDEVI, Professor and Head, Department of Agricultural Business Management, S.V. Agricultural College, Tirupati.
Special thanks must go to Professor C.S.SUNDARESAN who taught me the delight of studying farmer producer companies and encouraged me to pursue my interests in farmer producer companies.
I humbly offer my heartfelt thanks to Dr. G.MOHAN NAIDU and Smt. B.APARNA member of my Advisory Committee, for their unstinted help, support, suggestions and whole hearted co-operation during the execution of my research work.
I would like thank all the members of ALC, who constantly welcome me every time I visited their office and helped me all the way throughout my project.
I will never forget all chats and beautiful moments with my classmates. They were fundamental in supporting me during stressful and difficult moments in these two years. CHANDU, ANU, VINEEL, NARAYANA ANNA, PHANI, SHINY. And special thanks to ADHI for his support throughout my stay and especially during this project period.

V
I am very grateful to thank Smt. RAJALAKSHMI madam, Teaching Associate whom always helped in studies and constantly giving me advice which supported me largely. And I also thank Mr. MAHESH and Smt. POOJITHA, Teaching Associate for their strong support during my course period.
I owe my sincere thanks to my juniors PRASANTH, PRADEEP, VASU, ABHI, ANANAD and PRIYANKA for their generous help and unparallel affection.
I further extend my thanks to my seniors and friends in S.V.Agricultural college ARUNODHAYAM SIR, GOVARDHAN SIR,SURYA, SWATANTRA MISHRA,ROUTROY,MADHAN, AMAR, D.V, SOMU ,PEERU, VEDA, NARESH and LOKANATHAN for their constant encouragement and moral support were my strongest assets during the period of my study.
I cannot forget friends who went through hard times together, cheered me on, and celebrated each accomplishment: ANBU, GOKUL, ARTHEE, KANI, PREETHA, TAMIL, AMAR, MANI, KARTHICK SIR, SABARI AND PRASANTH.
I would like to express my gratitude to my love PRIYANGA for her unfailing emotional support. I also thank for heart-warming kindness from the family of my Sister’s GOMATHI, PRABA, KUMAR MAMA, SENTHIL MAMA AND RAJA MAMA.
Finally, my deepest gratitude goes to my parents MARAPPAN and SAKTHI for their unflagging love and unconditional support throughout my life and studies. You made me live the most unique, magic and carefree childhood that have made who I am now!
M.Kandeeban...
VI
CONTENTS
Chapter No. Title Page No.
I INTRODUCTION 1
II REVIEW OF LITERATURE 14
III MATERIAL AND METHODS 22
IV RESULTS AND DISCUSSIONS 36
V SUMMARY AND CONCLUSIONS 75
LITERATURE CITED 84

VII
LIST OF TABLES
Table
No
Title
Page
No
1.1
Difference between PCs and cooperatives
4
3.1
List of the sample FPCs
24
4.1
Volume of red gram sales business done by FPCs for two
years
38
4.2
Analysis of marketing costs under different channels in the
marketing of red gram (Rs/Qn)
45
4.3
Analysis of marketing margins under different channels in the
marketing of red gram (Rs/Qn)
46
4.4
Price spread under different marketing channels in the
marketing of red gram (Rs/Qn)
47
4.5
Indices of marketing efficiency in the selected marketing
channels
48
4.6
Redgram prices in various marketing scenario in Telangana
(2014-15)
55
4.7
Redgram prices in various marketing scenario in Karnataka
(2014-15)
55
4.8
Redgram prices in various marketing scenario in Telangana
(2013-14)
56
4.9
Redgram prices in various marketing scenario in Karnataka
(2013-14)
56
4.10
Capital raised by FPCs from various sources
67
4.11
Financial Ratios of the FPCs for 2013-14 and 2014-15
74

VIII
LIST OF ILLUSTRATIONS
Figure
No
Title
Page
No
4.1
Volumes of red gram sales done by FPCs in 2013
39
4.2
Volumes of red gram sales done by FPCs in 2014
39
4.3
Marketing costs incurred by various intermediaries in
channel I
49
4.4
Marketing costs incurred by various intermediaries in
channel II
50
4.5
Marketing margins earned by various intermediaries in
channel I
51
4.6
Marketing margins earned by various intermediaries in
channel II
52
4.7
Sources of Own Capital
59
4.8
Equity shares of selected FPCs
60
4.9
Sources of grant capital
62
4.10
Source of debt capital
63
4.11
Various schemes to assist FPCs
66

IX
LIST OF ABBREVIATIONS AND SYMBOLS
AFSPC - Angadiraichur Farmers Services Producer Company Limited
ALC - Access Livelihood Consultancy
ALDF - Access Livelihood Development Finance
APMC - Agricultural Produce Marketing Committee
BoD – Board of Director
CIGs - Common Interest Groups
e.g. - Example
EGCGFS - Equity Grant and Credit Guarantee Fund Scheme for Farmer
Producer Companies
et al – And others
FAGs – Farmer Affinity Groups
FAO - Food and Agriculture Organization
FPCs - Farmer Producer Companies
FPOs - Farmer Producer Organisations
GBY - Gramin Bhandaran Yojana
HFSPC - Hasnabad Farmers Services Producer Company Limited
i.e. - That is
JFSPC - Jalwad Farmers Services Producer Company Limited
KFSPC - Kalkeri Farmers Services Producer Company Limited
KOFSPC - Kodangal Farmers Services Producer Company Limited
lkhs – Lakhs
MC - Marketing cost
MDH - Mission for Integrated Development of Horticulture
MM- Marketing margin
MME - Index of Marketing Efficiency

X
MSP - Minimum support price
NABARRD – National Bank for Agriculture and Rural Development
NABFINS - NABARRD finance service limited
NFSM - National Food Security Mission
NGCs - New Generation Cooperatives
NGOs - Non-governmental organisations
PACS – Primary Agricultural Credit Society
PC - Producer Company
PODF - Producer Organisation Development Fund
PRADAN - Professional Assistance for Development Action
Qn – Quintal
ROE- Return on Equity
Rs – Rupees
SFAC - Small Farmers’ Agri-Business Consortium
SHGs - Self-Help Groups
tn – Tonnes
UN - United Nations
UNDP - United Nations Development Programme
VAPCOL - Vasundra Agri-horti Producer Company limited
VCA - Venture Capital Assistance Scheme
VIUC - Vegetable Initiative for Urban Cluster
viz. - Namely

XI
ABSTRACT
Title of the Project : STUDY ON MARKET COMPETITIVENESS
AND FINANCING PATTERNS OF FARMER
PRODUCER ORGANISATIONS (FPOS) IN
TELANGANA AND KARNATAKA
Name of the author : M. KANDEEBAN
Major Advisor : Smt. Y.PRABHAVATHI
Degree to which it is
submitted
: MASTER OF BUSINESS MANAGEMENT
(ABM)
Faculty : AGRICULTURE
Department : AGRIBUSINESS MANAGEMENT
University : Acharya N.G.Ranga Agricultural University
Year of submission : 2015
The present study entitled “Study on Market competitiveness and
Financing Patterns of Farmer Producer Organisations (FPOs) in Telangana and
Karnataka” was intended to examine the value chain, market competitiveness,
financial models and assessment of FPCs.
Two-stage purposive sampling technique was adopted to select the
ultimate sample units. The study was undertaken in five FPCs in Telangana and
Karnataka states. For the present study, Mahabubnagar district of Telangana
state and Bijapur district of Karnataka were selected as these were backward
districts in their respective states. Three FPCs in Telangana state and two FPCs
in Karnataka state were purposively selected since these FPCs were promoted
by the same promoter. Both conventional analysis and financial ratio
techniques were used to analyze the data and arrive at valid conclusions.
All the specified FPCs were involved in direct marketing and handled
single commodity i.e. redgram. In 2013, the maximum and minimum volume

XII
of produce was handled by KOFSPC (190 tonnes) and KFSPC (120 tonnes)
respectively. In 2014, maximum and minimum volume of produce was handled
by AFSPC (136 tonnes) and JFSPC (102 tonnes) respectively. The marketing
channel of redgram currently followed by specified FPCs: Farmers – Farmer
Producer Company - Traders - Miller – Wholesaler – Retailer – Consumer.
The cost incurred in marketing of redgram in channel I (Rs.2732) was
higher than channel II (Rs.2463). The marketing margins earned in marketing
of redgram through channel II (Rs.915) were less than channel I (Rs.948). The
price spread in the case of channel I (Rs.3440) was higher than channel-II
(Rs.3225). The producer’s share in consumer’s rupee (PSCR) in channel II
(64.560 per cent) was more than in channel I (62.198 per cent). The marketing
efficiency of channel I was 1.53 and that of channel II was 1.73. It infers that
channel II was more efficient than channel I.
The prices that are arranged by the five FPCs for redgram in 2013-14
and 2014-15 for the farmer members were relatively on the higher side when
compared to modal price (Tandur market in Telangana state and Gulbarga
market in Karnataka state) and MSP.
The leverage ratios, profitability ratios, debt ratio and earnings per share
of all but one i.e. KFSPC, indicated reasonably good performance of the FPCs
though they were hardly two years old.

CHAPTER I
Introduction

1
Chapter - I
INTRODUCTION
A majority of the world’s poor belong to agricultural based rural
households.Small and marginal farmers constitute the largest group of
cultivators in Indian agriculture. About 85 per cent of the operated holdings are
smaller than two hectares and amongst these holdings 66 per cent are less than
one hectare (Singh, 2012). The increasing number of agricultural suicides
among small and marginal farmers (National Crime Records Bureau, 2011) is
any indication that these farmers are struggling to survive. While indebtedness
is often cited as the immediate reason for distress (Reserve Bank of India 2006
and Satish, 2007), deeper issues are related to vulnerability to risk in
agricultural production. These issues include lower scale of operation, lack of
information, poor communication linkages with the wider markets and
consequent exploitation by intermediaries in procuring inputs and marketing
fresh produce, access to and cost of credit (Dev, 2005) and in isolated cases
aggressive loan recovery practices (Sriram, 2008).
Despite growing market opportunities, there is a danger that small
farmers will be squeezed out, even though they possess some competitive
advantage over larger producers, especially in their low cost in accessing
family labour and intensive local knowledge (Poulton et al., 2005). The
disadvantages they face are high unit transaction costs in almost all non-labour
transactions (Poulton et al., 2005). Furthermore, over the last two decades
structural adjustment programmes have led to a decline in state-funded
agricultural support, with the result that many farmers find it difficult to access
inputs, extension and training.
A variety of approaches have emerged in response to the problems faced
by the small and marginal farmers. The first approach is the facilitation of
collective action by small and marginal farmers. Agricultural cooperatives,
formed under the Co-operative Credit Societies Act, 1904, have long been the
2
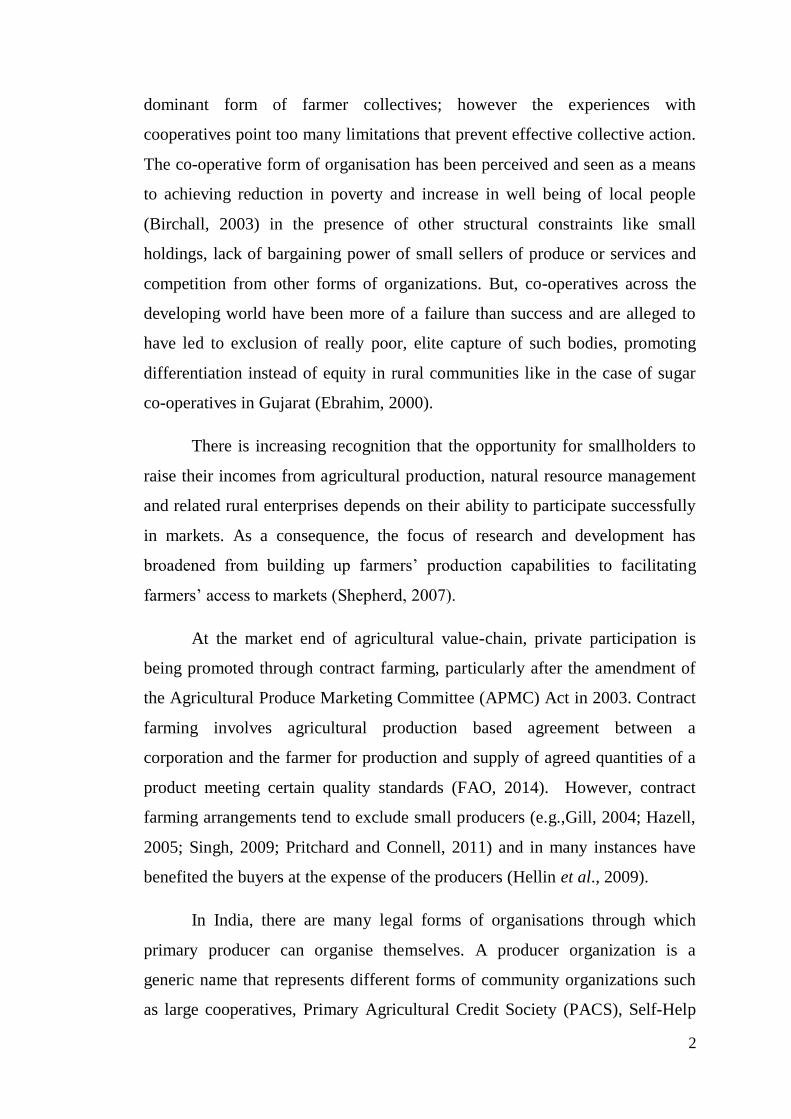
dominant form of farmer collectives; however the experiences with
cooperatives point too many limitations that prevent effective collective action.
The co-operative form of organisation has been perceived and seen as a means
to achieving reduction in poverty and increase in well being of local people
(Birchall, 2003) in the presence of other structural constraints like small
holdings, lack of bargaining power of small sellers of produce or services and
competition from other forms of organizations. But, co-operatives across the
developing world have been more of a failure than success and are alleged to
have led to exclusion of really poor, elite capture of such bodies, promoting
differentiation instead of equity in rural communities like in the case of sugar
co-operatives in Gujarat (Ebrahim, 2000).
There is increasing recognition that the opportunity for smallholders to
raise their incomes from agricultural production, natural resource management
and related rural enterprises depends on their ability to participate successfully
in markets. As a consequence, the focus of research and development has
broadened from building up farmers’ production capabilities to facilitating
farmers’ access to markets (Shepherd, 2007).
At the market end of agricultural value-chain, private participation is
being promoted through contract farming, particularly after the amendment of
the Agricultural Produce Marketing Committee (APMC) Act in 2003. Contract
farming involves agricultural production based agreement between a
corporation and the farmer for production and supply of agreed quantities of a
product meeting certain quality standards (FAO, 2014). However, contract
farming arrangements tend to exclude small producers (e.g.,Gill, 2004; Hazell,
2005; Singh, 2009; Pritchard and Connell, 2011) and in many instances have
benefited the buyers at the expense of the producers (Hellin et al., 2009).
In India, there are many legal forms of organisations through which
primary producer can organise themselves. A producer organization is a
generic name that represents different forms of community organizations such
as large cooperatives, Primary Agricultural Credit Society (PACS), Self-Help

3
Groups (SHGs), Federation of SHGs, Common Interest Groups (CIGs),
Farmers Club, Producer Company, etc. However, a producer company is a
special case of producer organization that is registered under Section IXA of
the companies Act, 1956 (Sukhpal and Tarunvir , 2012).
In this context, there has been a constant search for alternative forms of
collectivization or co-operation to achieve the objectives of development of
poor people though some researchers also differentiate between collectivization
and co-operation in the sense that whereas former refers to organizing to avoid
exploitation in markets and the latter as organising in situations of missing
markets (Shah,1996).Cooperatives concept is one of the options available for
the farmers to get organized themselves to move up in the value-chain and
having business ownership. The below-par performance of cooperatives except
for certain commodities viz, milk and fertilizers, led to the emergence of ‘New
Generation Cooperatives (NGCs)’ with advanced member-friendly profile
(Singh 2008). Difference between cooperatives and PCs was given in Table
1.1.
Ironically, the concept of NGCs too could not overcome certain pulling
factors like preferred share premium, limited rights of members on internal
control mechanism, suitability only to large holders, functioning like closely-
held companies, risk of becoming investor-oriented company, off-market
purchases to meet contract terms, leasing of delivery rights by members and
dependency on non-producer member equity and non-member business.
A producer company (PC) is one such and relatively new legal entity of
the producers of any kind, viz., agricultural produce, forest produce, artisan
products, any other local produce where the members are primary producers.
PC as a legal entity was enacted in 2003 as per section IXA of the Indian
Companies Act 1956. Since the above enactment the PC has been hailed as an
organizational form that will empower and improve the bargaining power, net
income and quality of life of small and marginal farmers/producers in India.

4
Table 1.1: Difference between Co-operatives and Producer Companies
Feature Co-operatives Producer Companies
Registration under Co-operatives act Companies act
Membership Open to any individual or
co-operative
Only to producer
members and their
agencies
Professionals on
Board Not provided Can be co-opted
Area of operation Restricted Throughout India
Relation with other
entities Only transaction based
Can form joint ventures
and alliances
Shares Not tradable Tradable within
membership only
Member stakes No linkage with number of
shares held
Articles of Association
can provide for linking
shares and delivery rights
Voting rights
One person one vote but
Registrar of companies and
government have veto
power
Only one vote for one
member and non-member
can’t vote
Reserves Can be created when made
profit
Mandatory to create
reserves
Profit sharing
Limited divided on capital
Based on patronage but
reserves must and limit on
dividend
Role of government Significant Minimal
Disclosure and audit
requirements Annual report to regulator
Very strict as per the
companies act
Administrative
control
Excessive
None
Dispute settlement Through co-op system Through arbitration

5
While each member in a PC can have only one vote, he/she can
contribute different amounts of share capital to the PC. The shares of the PC
members cannot be transferred outside the membership. A PC should have a
minimum of ten members or two producer entities or a combination thereof. By
virtue of assigning equal voting rights to each member, the issue of
management control by small and marginal producers has been resolved in the
design of PC. In spirit, the current PC design also takes into account the
efficiency of the community of producers rather than the efficiency of
shareholders/financiers of a profit seeking company.
Primary producer’s organisations or collectivities are being argued to be
the only institution which can protect small farmers from ill-effects of
globalization or make them participate successfully in modern competitive
markets (Trebbin and Hassler, 2012).
In the recent years, the focus of the Government of India, state
governments and the various development agencies has been towards producer
companies. The international development agencies including the United
Nations (UN) agencies such as World Bank, United Nations Development
Programme (UNDP) and Food and Agriculture Organization (FAO) have been
showing their interest in investing in these organizations. Many of the non-
governmental organizations (NGOs) in the country had been facilitating
formation of producer organizations and in the recent years and some of them
have graduated to facilitate formation of producer companies on behalf of the
state governments and development funding agencies.
1.1 PROBLEM STATEMENT
Producer’s organization not only help farmers buy or sell better due to
scale benefits but also lowers transaction cost for sellers and buyers besides
providing technical help in production and creating social capital. In
Mozambique, where 80 percent farmers are small holders and only 7.3 percent
were members of farmer organisation in 2005, the membership in farmers’

6
organisations led to 50 percent increase in profits for small farmers from the
crops handled by the organization (Bachke, 2011). It is also argued that co-
operatives or such collectivities are needed for small farmers to help them
realize better output prices and credit terms and thus can help eliminate
interlocking of factor and product markets into which small farmers are
generally trapped (Patibandla and Sastry, 2004).
As on June 2015, there were over 445 PCs in India. The above PCs sell
their produce to any large national and international buyers/processors or to
their promoters. In its attempt to aggregate the produce from the small
producers, the above PC model focuses on the common interest groups (CIGs)
or self-help groups (SHGs) as the basic unit for aggregation with no limit on
the size of membership and size of cluster/operational area.
Farmers’ cooperatives in the erstwhile socialist economies worked
largely to bring together small farmers enabling them to pool their resources
and enhance their output. Currently farmer producer organisations (FPOs) work
in the dynamic and ever evolving market economies and promote the
entrepreneurial spirit. Most of the FPOs are either simple farmer producer
aggregator functioning to increase their share in the consumer price or work to
eliminate one or two intermediaries from the supply chain. Despite several
success stories, marketing still remains a challenge. Against this background, in
present study entitled “Study on Market competitiveness and Financing
patterns of Farmer Producer Organisations (FPOs) in Telangana and
Karnataka” has been undertaken with following specific objectives
1.2 OBJECTIVES OF INVESTIGATION
1. to identify the stage of the FPOs and its market readiness in terms of
products and volumes
2. to map the current value chain with existing FPOs value chain to single
&multi commodity

7
3. to estimate the market competitiveness of the FPOs
4. to identify the capital and credit availability models of the FPOs
5. to examine viability of FPOs in terms of capital and financing patterns
1.3 SCOPE OF THE STUDY
The study attempts to understand the current mode of operation, market
competitiveness and financial viability of the PCs with reference to the small
and marginal farmers/producers in the states of Karnataka and Telangana. This
in turn, helps to review the design of the PC and the amendments and policy
mechanisms that may be necessary to make the PC an effective institutional
arrangement of the small and marginal farmers/producers leading to
development of small producers in rural India.
1.4 LIMITATIONS OF THE STUDY
The study has the limitations of time, fund, other physical facilities
needed for the research and resources at the disposal of investigator. Marketing
information such as price, quantity and cost were obtained and presented in the
study is based on recall memory of different actors. Further financial
information obtained was not at required standard and validity of data in the
statements is also questionable. Besides these, single person research study is
always confronted with various bottlenecks and the present study is no
exception to these limitations. And hence the findings could be generalized to a
limited extent to compare PCs. But exhaustive care has been taken in
collection, analysis and presentation of the data.
1.5 PLAN OF THESIS
The thesis is presented in five chapters. The first chapter describes the
various producer organisations in India along with specific objectives. It also
describes the difference lies between PCs in the state of Karnataka and
Telangana. Within first chapter, the selected five FPCs profile in brief were

8
also discussed. Review of literature on Farmer Producer Companies and
marketing and finance related field is cited in the second chapter. The third
chapter presents the material and methods adopted in this study. The fourth
chapter encompasses a critical analysis of the results and discussion. The
summary and conclusion emerged from the study form the integral part of the
fifth chapter.

9
BREIF PROFILE OF FIVE FPCs
1. Angadiraichur Farmers Services Producer Company (AFSPC)
Angadiraichur Farmers Services Producer Company is located in
Angadiraichur village, Kodangal mandal, Mahabubnagar district of Telangana
state. The company was registered on 14-11-2013 with corporate Id
U01400AP213PT06484891. The producer company is located at a distance of
18 km away from the mandal and is remotely placed with no or less
communication and transportation facilities. The total number of shareholders
of the AFSPC is 503 in number residing in 10 villages namely Chitlapalli,
Angadiraichur, Ravalpalli, Tekulakoderu, Dharmapur, Boipallytanda,
Sangaipalli, Mothkulabanddatanda, Kasturpally and Indanoor.
The company has 10 Board of Director (BoD) members and 62
Representative General Body Leaders (RGB) members associated in 31
Farmers Affinity Groups (FAGs). The authorised capital of the company was
10 lakhs and the issued capital as on 31.03.14 was 2.83 lakhs. All the members
of the company were women farmers. In order to become a member of the
company individual farmer has to purchase a minimum of 50 shares each share
value being Rs.10.
ALC, social enterprise is playing a prominent role both in functioning of
FPC and also in improving the living standards of the farmers. As the district is
totally rainfed, most of the farmers in the study area grow redgram. The main
function of the FPC is procurement and effective marketing of redgram.

10
2. Hasnabad Farmers Services Producer Company (HFSPC)
Hasnabad Farmers Services Producer Company is located in Kodangal
mandal, Mahabubnagar district of Telangana state. The company was
registered on 27.3.2013 with corporate Id U01400AP2013PTC08666. The
producer company is located about 20 Km and 100 Km from Tandur and
Hyderabad respectively. The total number of shareholders of the HFSPC is 834
in number residing in 10 villages namely Hasnabad, Peddanandiganma,
Chinnanandigama, Neetur, Chitlapally, Hussianpur, Kudurumalla, Aledu,
Mysammathanda and Burjukhanpally. The farmers in these villages grow
mainly red gram.
The company has 10 Board of Director (BoD) members and 96
Representative General Body Leaders (RGB) members associated in 48
Farmers Affinity Groups (FAGs). The authorised capital of the company was
15 lakhs and the issued capital as on 31.03.14 was 4.32 lakhs. Only the women
farmers can be members of the company. In order to become a member of the
company individual farmer has to purchase minimum of 50 shares of each
share value being Rs.10.
Access Livelihoods Consulting India Ltd (ALC), a social enterprise,
initiated the farmers to take up and start - farmer producer organisation. With
the empanelment of Small Farmers Agribusiness Consortium (SFAC), ALC
has promoted the farmer producer organisations in Kodangal mandal of
Mahabubnagar district. As the area is majorly rainfed farmers mainly cultivate
redgram. The main function of the FPC is procurement and marketing of
shareholders produce (redgram).
11
3. Kodangal Farmers Services Producer Company (KOFSPC)
Kodangal Farmers Services Producer Company was registered on 3rd
April 2013, with its registered office at Kodangal mandal, Mahabubnagar
district. ALC India ltd, a social enterprise was instrumental in the formation of
KOFSPC. The company’s corporate Id is U01400AP2013P TC086781. In each
and every aspect of the business and operations, ALC has played a crucial role
in its functioning of producer company.
There are around 46 FAGs in KOFSPC and 92 representative general
body leaders with farmer shareholders 915. Most of the FAGs are located in the
villages Kodangal, Bulkapur, Kondareddypally, Regadimailaram,
Ashammakunta, Thandaparsapur and Udimaheshwaram. The farmers in these
villages grow mainly redgram. The authorised capital of the company was 15
lakhs and the issued capital as on 31.03.14 was 4.71 lakhs. As in the other
FPCs only the women farmers can become as member of the company. In order
to become a member of the company individual farmer has to purchase
purchase a minimum of 50 shares each share value being Rs.10.

12
4. Jalwad Farmers Services Producer Company (JFSPC)
Jalwad Farmers Services Producer Company is located in Sindagi taluk,
Bijapur district of Karnataka state. The company was registered on 18.12.2013
with corporate Id U01400KA2013P TC072632. The head office of the
company was located in a village namely Ashki. All the members of the FPC
were women farmers. The district is totally rainfed and the environment is
suitable for growing pulses. The total number of shareholders of the JFSPC is
948 in number residing in 5 villages namely Jalwad, Mannur, Devur, Koravur
and Imbrahimpur.
The company has 10 Board of Director (BoD) members and 102
Representative General Body Leaders (RGB) members associated in 51
Farmers Affinity Groups (FAGs). The authorised capital of the company was
10 lakhs and the issued capital as on 31.03.14 was 4.5 lakhs. Only the women
farmers can be members of the company. In order to become a member of the
company individual farmer has to purchase 50 shares of Rs.10 each.
Access Livelihoods Consulting India Ltd (ALC), a social enterprise,
initiated the farmers to take up and start - farmer producer organisation. With
the empanelment of Small Farmers Agribusiness Consortium (SFAC), ALC
has promoted the farmer producer organisations in Sindagi taluk of Bijapur
district. The main function of the FPC is procurement and marketing of
shareholders produce.

13
5. Kalkeri Farmers Services Producer Company (KFSPC)
Kalkeri Farmers Services Producer Company is located in Sindagi taluk,
Bijapur district of Karnataka state. The company was registered on 20.12.2013
with corporate Id U01400KA2013PTC07247. The producer company is
located about 60 Km and 50 Km from Sindagi and Bijapur respectively. All the
members of the FPC were women farmers. The district is totally rainfed and
suitable for growing pulses. Access Livelihoods Consulting India Ltd (ALC), a
social enterprise, initiated the farmers to take up and start - farmer producer
organisation.
The total number of shareholders of the KFSPC is 1023 in number
residing in 5 villages namely Ashki, Niralgi, Bekinal, Kalkeri and B.B.Jngalgi.
The company has 9 Board of Director members and 116 RGB Leaders
members associated in 58 Farmers Affinity Groups (FAGs). The authorised
capital of the company was 15 lakhs and the issued capital as on 31.03.14 was
4.8 lakhs. Only the women farmers can be members of the company. In order
to become a member of the company individual farmer has to purchase a
minimum of 50 each share value being Rs.10 each.

CHAPTER II
Review of Literature

14
Chapter- II
REVIEW OF LITERATURE
In this Chapter, an attempt has been made to critically review the
literature of the past research work done in relevance to the present study.
Comparatively a fewer number of studies were reported on the market
competitiveness and financial models in general and in FPCs in particular. An
account of previous research work done related to the present study and other
forms of farmer organisations is presented under the following heads,
2.1 Studies on producer organisations
2.2 Studies on marketing channels
2.3 Studies on marketing readiness
2.4 Studies on market competitiveness, and
2.5 Studies on financing of FPCs
2.1 STUDIES ON PRODUCER ORGANISATIONS
Rondot and Collion (2000) defined the producer organizations as formal
rural organizations whose members organized themselves with the objective of
improving farm income through improved production, marketing, and local
processing activities. Producer Organisations deal with policies on issues such
as pricing and export and import of agricultural products; improvement of
agricultural production practices; access to inputs and services, including
agricultural credit; marketing of agricultural production; and local processing
of agricultural production and its marketing.
Bijman and Wollni (2008) defined the producer organization is an
association, a society, a cooperative, a union, a federation, or even a firm that
has been established to promote the interests of farmers. The main goal of the
15
producer organisation was to provide services that support producers in their
farming activities, including the marketing of the farm products.
Shylendra (2009) explained producer company as a new answer to
rectifying the imperfect experiences of cooperatives and to answering the social
requirements of aggregating small and marginal farmers, strengthening their
leverage through collective means, and integrating their livelihoods into
remunerative markets.
Tanguy and David (2009) suggested that the poorest of the poor tended
to be excluded from membership in marketing cooperatives in Ethiopia.
However, they stood to benefit from the positive spillovers generated by some
types of cooperative activities, although these benefits were often limited when
compared to those accruing to members.
Dhakal (2013) concluded that farmers' organizations were collapsed due
to the lack of ownership, group management skill and inability to link with
market. The business skills, technical skills and organizational management
skills of ARC (Agricultural Resource centres) members were not promoted
parallel. Autonomy and adequacy of time given to select the enterprise for
groups has long term impact on ownership development. High level of external
influence lead ARCs for dependency and lack of problem solving ability
among members.
2.2 STUDIES ON MARKETING CHANNELS
Subbarao (1978) concluded that horizontal integration of wholesale
markets did not ensure competitive prices to the farmers. In villages
characterised by low level of infrastructure development coupled with low
staying power of farmers, competitive forces were weakened thus provided
opportunities to millers to make abnormal profit.
Deininger and Sur (2006) concluded that the ability to meet high food
safety and quality standards was lowest in smallholder agriculture because of
the scale economies. The most important reason was the inability of the

16
smallholder dominated production systems to meet the food safety and quality
requirements of the rich country markets.
Urban Poverty and Environment series report (2007) stated that to
minimize the cost of inputs and ensure proper handling of output by middle
men or command higher output prices, group negotiation through producers’
organizations’ was a valuable advantage. It also strengthened experience
sharing, and offered opportunities for inter-change programmes and training.
Gábor and Szabó (2009) proposed that producer-owned organisations
were good examples for the vertical integration based on the horizontal
coordination of farmers as initiators as they proved that by co-operation there
was an opportunity to significantly improve their countervailing power and to
establish ownership for farmers in the upper part of the food chain if they can
secure strict quality requirements, solid financing, loyalty and trust in their
organisations.
Trebbin and Hassler (2012) explained that the concept of producer
companies represented a tool for smallholder farmers to get organized and to
reap benefits - not only from joint action, but also from links to evolving high-
value markets in India's urban centres.
2.3 STUDIES ON MARKETING READINESS
Hellin et al. (2009) have suggested that the benefits of farmer
organization for market access were more evident in the vegetable sector,
characterized by high transaction costs. There was less incentive for farmers
producing an undifferentiated commodity such as maize to organize as the
transaction costs associated with market access were relatively low. Farmer
organizations that sold vegetables secured a very small percentage of the final
consumers’ price. Low volumes of product plus low margins meant that
ongoing subsidies were probably needed to cover operational costs.
The case study of the Vasundhara Agri-Horti Producer Company
(VAPCOL) show that producer companies can help smallholder farmers and

17
underprivileged rural communities to position themselves in a more demanding
market environment and to establish trading relations to modern retail
companies by conducting value adding processes and generate economies of
scale in output marketing. By selling larger quantities to a larger buyer, not
only transaction costs were reduced, but also the marketing risk. (2009)
Berdegué et al. (2008) concluded that for the producer organisations to
become viable, autonomous organizations, three factors seemed to explain their
success. The first was that they must act as vehicles for change. Producer
organizations’ can be effective for farmers who were willing to change their
practices, but not for those who wishes to maintain the status quo in the context
of traditional commodity production systems. The second factor was related to
the producer organisations’ networking capability. Effective organizations were
embedded in dynamic multi-agent networks that link their members to ideas,
resources, incentives and opportunities from beyond their rural communities.
Finally, a system of rules and incentives for the internal allocation of costs and
benefits, both among the members, and between the farmers as a group and the
organization itself, was key to success. With effective and sustainable producer
organisations’, these rules typically transmit undistorted market signals to
individual members, to which the members are able to respond.
Javier and Cavero (2012) argued that group of small producers through
producer organizations were capable of making strategic investments to gain
access to agro industrial markets where their produce was more profitable by
establishing more complex contractual arrangements with potential purchasers.
Lowering transactions costs through promoting producer organizations, will
not only make more likely that the less endowed small farmers enhance their
opportunities to access to agro industrial markets but also increase their net
incomes once they were able to access these markets.
Trebbin and Hassler (2012) concluded that Kabini Organics producer
company has helped farmers for the production of high-quality organic cotton
which was dependent on a seed supply alternative to the Bt cotton mainstream.

18
Getting organized into a producer company has helped these farmers overcome
the seed supply crisis and reach organic certification. The producer company
has been of great service to its members through a row of activities which
helped farmers tap till then unknown or unreachable sources of credit and
funding to stabilize their livelihood situation.
2.4 STUDIES ON MARKET COMPETITIVENESS
Estelle and Danies (2005) reported that competitiveness rests on cost
reduction strategies which can be achieved through economies of scale, either
in terms of input provision, technical assistance or commercial logistic through
farmer’s organization. It also relies on non-price factors such as reputation,
commercial efficiency, or specific quality attributes.
Rondot and Collion (2000) proposed that collective action and farmers’
organizations have gained renewed interest in recent years from governments,
donors and NGOs alike that see them as appropriate institutions for building
capacity among farmers by helping them participate in more competitive and
globalized market environments.
Barham and Chitemi (2009) studied and found that because of small size
of operation, small farmers were not only able to create scale economies, and
had low bargaining power because of low quantities of marketable surplus.
They also lacked capital, knowledge, information and market access, and
suffered from market imperfections, and poor infrastructure and
communications.
Fischer and Qaim (2012) concluded that collective action spurred
innovation through promoting efficient information flows and output price
advantages associated with collective marketing but relatively small in
magnitude.
Tita et al. (2013) argued that the group negotiated better prices
commensurate to the extra efforts made and so that members should be

19
satisfied with such prices. To be successful, producer groups should be able to
increase their bargaining power and one of such means was to have control
over members' produce. One way to do so may be to have access to micro-
credit in order to offer advanced payments to members to withhold produce
while waiting for an agreed market day, so that members are not tempted to sell
out of the group.
Varun Prasad (2013) proposed that the Farmer Producer Organization
(FPO) was the best of the structures, in terms of the express objective of
eliminating the “Moral Economy”, and argued for the same using the tools of
Transaction Cost Economics (TCE). He also argued that the problem of
individual farmers being unable to pursue litigation against corporate would
become less of an issue, because of the financial capacity of the FPO and
farmers, who were previously not exposed to any form of business
organization, have become “experts” in marketing their produce to the public, a
mere six months after their FPO was officially incorporated.
Robert and Peter (2014) inferred that farmer organisations have the
potential to improve services and reduce transaction costs but effective
mechanisms of downward accountability were necessary so that issues such as
poor management and elite capture can be addressed, and farmers are
motivated to invest in actions that have collective benefits. They also suggested
that for farmer organisations (and particularly for large farmer organisations) to
fulfil their potential roles in development, there needed to be a focus on
developing means of legitimising smallholder farmers’ rights, building their
capacity to challenge exclusion and moving from rights to obligations
regarding information provision.
Bernard and David (2015) concluded that many Rural Producer
Organisations (RPOs) still struggled to offer the type of commercialization
services that would lead to higher output prices for their members and it also
argued that trust in leaders’ motives and competence as well as trust in ordinary
members were crucial for successful collective commercialization as a form of
collective action.

20
2.5 STUDIES ON FINANCING OF FPCs
Braun and Immink (1994) proposed that the creation of producer
organizations is the most common solution to share the fixed costs necessary
for small holders to link to dynamic markets as the Rural Producer
Organisations is a form of collective action that improve both the farmers’
access to credit, information, and improved varieties of crops. And he also
stated that economies of scale, be it in production or marketing, producers will
have incentives for collective action, in the form of producer associations.
Bhattacharjee (2010) concluded that producer companies can be made
viable in the long run through provision of adequate support by the donor
agency and supportive environment and relaxing of the capital constraints and
as far as commodity based producer companies were concerned, there were
possibilities of both diversification of business, value addition possibilities and
integration with both input and output markets.
Marzena and Paul (2011) concluded that for the producer company to be
an influential and effective model for improving the livelihoods of small and
marginal producers, it has to overcome its credit constraints either with the help
of supporting policies and with an alteration of its design.
Pustovoitova (2011) proposed that the choice of company format and
business model should not limit farmers’ options, particularly in economic
sense. But, the working capital constraint in the initial stages locked the
producer company and its member farmers into a smaller scale, preventing the
company from engagement in value addition.
Catherine Ragasa (2012) concluded that membership commitment was
highly and positively correlated with performance of rural producer
organisations’ and in order to sustain financial contributions from members and
operations of rural producer organisations’, support will have to focus on the
economic viability and increasing incomes for the members. Marketing training
21
and extension approaches, including training on value chain approaches, is the
important strategy for supporting rural producer organisations’.
Jessop et al. (2012) identified that cooperatives or smallholder groups
can cooperate with public and private financial institutions in the mobilization
of smallholders to have a better education about financial services as well as
effective investments and risk management. Those initiatives from
smallholders’ cooperatives and groups would be crucial and useful for
achieving financial services and expanding their investment.
Bijiman and Wollni (2008) stated that monetary incentive to organise,
professionalise and innovate would support capacity building of producer
organisation. But, such a shift from direct payments to farmers towards
payments to producer associations also had negative aspects like subsidy-
dependence or making life more difficult for existing cooperatives.
Ampaire et al. (2013) suggested that promoting SACCOs as rural
financial institutions to support rural smallholder producers was a timely and
necessary solution to the current lack of credit in Uganda. He also suggested
policies guiding the establishment and loaning conditions should be reviewed
to match rural producers’ economic status.

CHAPTER III
Methodology
22
Chapter-III
METHODOLOGY
This chapter presents procedural details in selection of samples, method
of data collection and analytical techniques employed in attaining the stated
objectives of the study. The contents of the chapter are presented under the
following heads:
3.1. SAMPLING DESIGN
3.2. COLLECTION OF DATA
3.3. METHODS OF COMPUTATION
3.4. TOOLS OF ANALYSIS and
3.5. CONCEPTS AND TERMS USED IN THE STUDY
3.1. SAMPLING DESIGN
Two-stage purposive sampling technique was adopted to select the
ultimate sample units.
3.1.1. SELECTION OF STATE
Telangana and Karnataka states of Southern India were purposively
selected for the study as the producer companies located in these states are in
nascent stage.
3.1.2. SELECTION OF DISTRICT
Farmer Producer Companies (FPCs) prevailing in Mahabubnagar
district of Telangana and Bijapur district of Karnataka were selected
purposively for two reasons
The selected districts were backward compared to other districts in
respective states. (Source - Public Release: University of Hyderabad)

23
The existing FPCs in the above district were being promoted by single
promoter namely Access Livelihood Consultancy India Ltd (ALC).
3.1.3 SELECTION OF FPC
A list of 445 producer companies including cooperatives were identified
based on secondary data available from Small Famers Agribusiness
Consortium (SFAC) website. From the data obtained, producer companies are
classified based on the various promoters involved in it. There were totally 8
FPC’s in the state of Karnataka and 9 in the state of Telangana promoted by
several promoters. Taking into consideration of time and resources five FPCs
(two FPCs in Bijapur district of Karnataka state and three FPCs in
Mahabubnagar district of Telangana state) were purposively selected. The state
wise names of the selected FPCs were given in Table 3.1.
3.2 COLLECTION OF DATA
A set of pre-tested schedules were used to collect pertinent data from
farmer shareholders, FPC staff members, promoting agencies, other
stakeholders of FPC, other farmers, commission agents, traders , processors
and retailers. To examine the viability of FPCs secondary data were collected
from the annual financial statements maintained by each FPC. Other secondary
data includes collection of Minimum Support Price (MSP) of redgram from
Ministry of Agriculture website; modal prices of Tandur (Telangana) and
Gulbarga (Karnataka) market for redgram were collected from
agmark.net.nic.in. The data for the present study pertained to the financial year
2013-14.

24
Table 3.1: List of the sample FPCs
District
Name of the FPCS
Bijapur
(Karnataka)
1. Kalkeri Farmers services producer company
2. Jalwad Farmers services producer company
Mahabubnagar
(Telangana)
1. Angadiraichur Farmers services producer company
2. Hasnabad Farmers services producer company
3. Kodangal Farmers services producer company
25
3.3 METHODS OF COMPUTATION
The detailed procedure followed in computing the concepts is described
below.
3.3.1 Marketing costs
Marketing costs are the actual expenses incurred in bringing goods and
services from the producer to the consumers. The marketing costs normally
include
(i) Handling charges by various agencies involved
(ii) Assembling charges
(iii) Transport and storage costs
(iv) Expenses on secondary services like financing, risk taking and
market intelligence.
3.3.2 Marketing margin
Marketing margin is the summation of share earned by various market
intermediaries for moving the particular quantity of produce from producer to
consumer in particular marketing channel. And it includes
(i) Commission earned by commission agents
(ii) Margin earned by wholesaler
(iii) Margin earned by retailer
(iv) Margin earned by processor
3.3.3 Modal Price
Modal price is the price at which maximum quantity of produce has
been sold in a particular day in the particular market.
3.3.4 Price spread
It is the difference between the price paid by the consumer and the price
received by the producer for an equivalent quantity of the produce.

26
3.3.5 Producer’s share in consumer’s rupee
The percentage of amount that producer gets from the total amount paid
by consumer.
3.3.6 Inventories
Inventories include fertilizers, plant protection chemicals and unsold
produce maintained by FPC.
3.3.7 Trade receivables
These include the cash & cash equivalents to be received from the
farmer shareholders with in one accounting period.
3.3.8 Trade payables
These include the cash to be paid by the FPC to the input companies in
one accounting period.
3.3.9 Long term borrowings
These are loans availed by FPC to purchase fixed assets.
3.3.10 Short term borrowings
These are loans availed by FPC to meet working capital requirements.
3.3.11 Total Debt
Total Debt includes long-term borrowings and short-term borrowings.
3.3.12 Net worth
These include share capital, reserves and surplus.
3.3.13 Net assets
Net assets include net fixed assets and net current assets.
27
3.3.14 Net fixed assets
Fixed assets maintained by FPC minus depreciation.
3.3.15 Net current assets
It is current assets minus current liabilities
3.3.16 Other operating expenses
Other operating expenses include employee benefit expenses and other
selling and administrative expenses.
3.3.17 Cost of Goods sold
These include cost of materials consumed, purchase of stock-in-trade
and changes in inventories of finished goods, work in progress and stock-in-
trade.
3.3.18 Sales
The Company is making sales not only by selling fertilizers and
pesticide to farmers’ shareholders but also receiving commission by selling
members produce.
3.3.19 Gross profit
It is sales minus cost of goods sold by the FPC.
3.3.20 Net Profit
It is obtained when operating expenses, interest and taxes are subtracted
from the gross profit.
3.3.21 Number of shares outstanding
Total number of shares multiplied by number of shares each
shareholder is holding.

28
3.4. TOOLS OF ANALYSIS
3.4.1 Financial concepts utilized in the study
3.4.1.1 Balance sheet
In financial accounting, a balance sheet or statement of financial
position is a summary of a person's or organization's balances. A balance sheet
is often described as a snapshot of a company's financial condition. It
summarizes a company's assets, liabilities and shareholders' equity at a specific
point in time. These three balance sheet segments give investors an idea as to
what the company owns and owes, as well as the amount invested by the
shareholders. Of the four basic financial statements, the balance sheet is the
only statement which applies to a single point in time.
A company balance sheet has three parts: assets, liabilities and
ownership equity. The main categories of assets are usually listed first and are
followed by the liabilities. The difference between the assets and the liabilities
is known as equity or the net assets or the net worth or capital of the company.
It's called a balance sheet because the two sides balance out.
3.4.1.2 Current ratio
Current assets
Current ratio =
Current liabilities
It measures the liquidity position of a firm. A firm with a higher ratio
has better liquidity. A ratio of 2:1 is considered safe.
3.4.1.3 Quick ratio
Quick assets
Acid test or Quick ratio =
Current liabilities
29
It is an important index of firms’ liquidity. A ratio of 1:1 is considered
safe.
3.4.1.4 Debt ratio
Total debt
Debt ratio =
Net assets
It measures the share of the total assets financed by outside lenders. A
low ratio is desirable for creditors.
3.4.1.5 Debt- equity ratio
Total debt
Debt-equity ratio =
Net worth
This ratio indicates the relative proportion of debt and equity in
financing the assets of a firm. A ratio of 1:1 is considered safe.
3.4.1.6 Profit & loss statement
Income statement, also called profit and loss statement (P&L) or
statement of operations is financial statement that summarizes the revenues,
costs and expenses incurred during a specific period of time - usually a fiscal
quarter or year. These records provide information that shows the ability of a
company to generate profit by increasing revenue and reducing costs. The
purpose of the income statement is to show managers and investors whether the
company made or lost money during the period being reported. The important
thing to remember about an income statement is that it represents a period of
time. This contrasts with the balance sheet, which represents a single moment
in time.

30
3.4.1.7 Capital assets turnover ratio
Sales
Capital assets turnover ratio =
Net current assets
It measures the share of sales revenue from the net current assets. A high
ratio is better for creditors.
3.4.1.8 Operating expenses ratio
Cost of goods sold + other operating Expenses
Operating expenses ratio =
Sales
It measures the part of sales revenue consumed for meeting cost of
goods sold plus other operating expenses.
3.4.1.9 Gross profit margin ratio
Sales- cost of goods sold
Gross profit margin =
Sales
It measures the profit in relation to sales. The gross profit margin
reflects the efficiency with which FPCs produces each unit of produce. A high
gross profit margin is a good sign of investment and a low gross profit margin
reflects the higher cost of the goods sold.
3.4.1.10 Net profit margin ratio
Profit after tax
Net profit margin =
Sales
It measures the net profit of a firm with respect to sale. It indicates
management efficiency in manufacturing, administrating and selling the

31
produce. A firm with high net profit margin will survive in adverse economic
conditions.
3.4.1.11 Return on equity
Profit after Tax
Return on equity (ROE) =
Net worth
This indicates the share of owners’ profit from the total net profit.
Maximum value indicates maximum returns to the equity share holders.
3.4.1.12 Earnings per share ratio
Profit after tax
Earnings per share (EPS) =
Number of shares outstanding
It measures the profit available to the equity holders on a per share basis.
3.4.2 Marketing concepts utilized in the study
3.4.2.1 Marketing cost
The Marketing cost was estimated with the help of following formula
C = CF + Cm1 + Cm2 + Cm3 + .................. + Cmi
Where,
C = Total cost of marketing (Rs/Qn)
CF = Cost paid by the producer (Rs/Qn)
Cmi = Cost incurred by the ith
middle in the process of marketing (Rs/Qn)
3.4.2.2 Marketing efficiency
The Marketing efficiency of different Marketing channels considered
under the study was estimated by Acharya and Agarwal’s Approach
32
ME = FP / (MC + MM)
Where,
ME = Index of marketing efficiency
FP = Price received by the farmer
MC = Total marketing costs
MM = Net marketing margins
3.4.2.3 Producers share in consumers’ rupee
It is the price received by the produce expressed as percentage of the
retail price (price paid by the consumer). If Pr is the retail price and Pf is the
producers’ price, then the producers’ share in consumers’ rupee (Ps) may be
worked out as follows;
Ps = (Pf / Pr) * 100
Where,
Ps = Producers’ share in consumers’ rupee
Pf = Price received by the producer
Pr = Price paid by the consumer
3.5 CONCEPTS AND TERMS USED IN THE STUDY
3.5.1 Market competitiveness
It is the ability of a firm to offer products and services that meet the
quality standards of the local and world markets at prices that are competitive
and provide adequate returns on the resources employed.
33
3.5.2 Marketing channel
It is the path which a commodity is passed through from producer to the
ultimate consumer.
3.5.3 Marketing efficiency
Marketing efficiency is the measure of availability of information to all
the participants in a market that provides maximum opportunities to buyers and
sellers to effect transaction with minimum transaction costs.
3.5.4 Transaction costs
The costs associated with exchange of goods or services and incurred in
overcoming market imperfections.
3.5.5 Producer
One who actually produces the product by cultivating the land and
brings the surplus to the market to dispose and by their earn cash income.
3.5.6 Processor
Processor is the one who adds value to the produce by doing required set
of activities.
3.5.7 Wholesaler
One who makes the buying activity in large quantity and sell the goods
to the retailers in required quantities.
3.5.8 Retailer
Retailer is the one who finally disposes the produce to the consumer
after purchasing at the wholesale market.
34
3.5.9 Consumer
One who actually buy and utilises the produce.
3.5.10 Price spread
It is the difference between the price paid by the consumer and the price
received by the producer for an equivalent quantity of the produce.
3.5.11 Marketing costs
The total marketing cost is summation of cost involved in moving the
particular quantity of produce from producer to consumer
3.5.12 Marketing margin
The total marketing margin is summation of share earned by various
market intermediaries for moving the particular quantity of produce from
producer to consumer in particular marketing channel.
3.5.13 Current assets
Current assets are cash and other assets expected to be converted to
cash, sold, or consumed either in a year or in the operating cycle. These assets
are continually turned over in the course of a business during normal business
activity.
3.5.14 Current liabilities
Current liabilities are short-term financial obligations that are paid off
within one year or one current operating cycle. These liabilities are reasonably
expected to be liquidated within a year.

35
3.5.15 Long-Term liabilities
Liabilities that are not paid off within a year, or within a business's
operating cycle, are known as long-term or non-current liabilities. These
liabilities are reasonably expected not to be liquidated within a year.
3.5.16 Turnover
The main source of income for a company is its turnover, primarily
comprised of sales of its products and services to third-party customers.
3.5.16 Sales
Sales are normally accounted for when goods or services are delivered
and invoiced, and accepted by the customer, even if payment is not received
until sometime later, even in a subsequent trading period.

CHAPTER IV
Results & Discussion

36
Chapter - IV
RESULTS AND DISCUSSION
In attempt is made in this chapter to discuss critically the results
obtained from the study. The important findings of the study along with
relevant discussion are presented under the following heads in accordance with
the objectives of the study.
4.1 Market readiness of farmer producer companies in terms of products and
volumes
4.2 Mapping channels of farmer producer companies
4.3 Marketing efficiency of farmer producer companies
4.4 Market competitiveness of farmer producer companies
4.5 Credit availability models farmer producer companies and
4.6 Financial assessment of farmer producer companies
4.1 Market readiness of FPCs in terms of products and volumes
The market readiness of FPCs provides comprehensive understanding of
FPCs ability to capture market opportunities and to address changing market.
This section furnishes data on products handled; volume and size of business
made by FPCs in addition to addressing changing market needs are also
discussed.
4.1.1 Products Handled
Since all the FPCs are promoted by the same non-governmental
organisation (Access Livelihood Consultancy) the major decisions taken were
quite similar in all FPCs. The common crops cultivated in the study area during
kharif under rain fed condition are redgram, groundnut, sunflower, pearl millet,
maize and castor.

37
Though there are 4 to 5 major crops cultivated in the study area during
kharif season, FPCs limited their operation to redgram. This is because most of
the farmers in the study area are growing redgram due to prevailing rainfed
condition. This in turn shifted farmers towards growing redgram.
Presently, redgram is the major farm produce procured and sold by all
the selected FPCs. The other reason for FPC handling a single commodity is
the fact that it is in the initial stage of establishment. It is quite obvious that it is
difficult to handle many commodities which require huge capital and man
power.
The other reason behind single commodity business is the risk that lies
behind maintaining quality of the produce like groundnut and cotton which
needs specialised structures to store and maintain quality. Compared to the
other crops, red gram procurement involves less risk coupled with greater
volume of output which helps to have links with other market with relative
ease.
4.1.2 Volume of business
Market readiness of the farmers through FPCs exhibited different
scenarios. Normally, the presence of FPCs provides a particular mechanism
while procuring and arranging for sale. So the farmers were convinced about
the probable benefits they are going to receive once they become members of
FPCs. It is only two years since the FPCs have been registered; the data shows
certainly that there is an element of enthusiasm by members to sell their
produce through the FPCs.
From Table 4.1 we can observe that in 2013, produce of redgram that was
brought to FPCs was of 180 tonnes, 190 tonnes, 180 tonnes, 127 tonnes and
120 tonnes for Angadiraichur Farmers Services Producer Company Limited
(AFSPC), Kodangal Farmers Services Producer Company Limited (KOFSPC),
Hasnabad Farmers Services Producer Company Limited (HFSPC),

38
Table: 4.1 Volume of redgram sales business done by FPCs for two years
Year
AFSPC KOFSPC HFSPC JFSPC KFSPC
Qn
(tn)
Amnt
(lkhs)
Qn
(tn)
Amnt
(lkhs)
Qn
(tn)
Amnt
(lkhs)
Qn
(tn)
Amnt
(lkhs)
Qn
(tn)
Amnt
(lkhs)
2013
180
77.40
90
38.70
180
77.40
127
54.61
120
51.60
2014
136
73.49
127
69.97
107
56.67
102
53.92
110
58.15

39
Figure 4.1 Volumes of redgram sales done by FPCs in 2013
Figure 4.2 Volumes of redgram sales done by FPCs in 2014

40
Jalwad Farmers Services Producer Company Limited (JFSPC) and Kalkeri
Farmers Services Producer Company Limited (KFSPC) respectively. Volume
of quantities handled in the year 2013 has been illustrated in Figure 4.1.
In the following year i.e., 2014 there was a uniform reduction in the
quantities that was brought for the sale with the reference to all FPCs barring
Kodangal farmers services producer company limited. Volume of quantities
handled in the year 2013 has been illustrated in Figure 4.2. The same trend
could be noticed in value of produce a well. During the survey, it is understood
that only15 percent – 30 percent of the redgram grown by farmer share holders
of the companies only being brought their produce to the FPCs, others
preferred to dispose the produce on their own. The financial commitments of
the farmers to the non institutional financing agencies like money lenders,
relatives might have compelled them to do so. The same continued in the 2014
as well.
Another sound reason was the price line that prevailed in 2014 was
similar to that are in 2013 which was not all that encouraging leading to the
reduction in area. A point to be highlighted here is that all the farmer members
were well convinced about the role that FPCs played in their lives but yet that
those initial hiccups played their role that could be observed from the
percentage of produce brought to the FPCs as detailed in Table 4.1.This
scenario will be changed once the farmers get to used to this new system in the
coming years and strongly believe that they are the best market after natives for
them. However, the FPCs must redefine their products for the market, taking as
the role of market leader rather than just a follower of established marketing
practices.

41
4.1.3 Addressing Changing Market
FPCs have helped to enhance farmers’ competitiveness and gave them a
level playing field in emerging market and prevented exploitation by
middlemen. It was a challenge to overcome the competition by traditional
middlemen and brokers in this business by offering a more competitive price
and fair procurement than the prevailing market conditions.
FPCs through their ability to respond market dynamics and flexibility to
address changing needs helped shareholders to get more prices for their
produce than the other farmers. Its vast external linkage helped in finding
external marketing opportunities.
It could be observed from the Table 4.8 and Table 4.9 in the year 2013-
14 red gram open market prices was only Rs.3979.84/quintal and Rs.3975.17/
quintal in Telangana and Karnataka states respectively. But FPC made
arrangements to sell the produce through small farmers’ agribusiness
consortium (SFAC) at MSP of Rs.4300/quintal. And also it could be observed
from the Table 4. 6 and Table 4.7 in the year 2014-15 redgram was sold by
FPC at a price of Rs.5323.33/ quintal in the state of Telangana and at
Rs.5321.6/ quintal in the state of Karnataka which is more than that of open
market price (Rs.5233.37/quintal and 5287.21/ quintal in Telangana and
Karnataka states respectively – Table 4.6 and Table 4.7) to traders as FPC
ensures quality of produce.
4.2 Mapping channels of FPC
This study provides detailed information regarding flow of redgram
through different channels in the study area.
Channels of Marketing:
The important link in the marketing of redgram is the regulated market.
Most of the crop output is sold either directly by the farmers or with the help of
village traders, produce flows to millers through the regulated market. Village

42
traders were also found to have a lot of variation in their mode of operation. In
some cases, they were approaching the farmers, while in others they were
operating through their own collection centres i.e. local private markets.
As redgram is consumed in the dal (split) form; the millers have an
important presence in the marketing of the pulses. In order to ensure smooth
supply of raw material for the dal mill, some of the millers have vertically
expanded their operations by participating in the marketing of pulses as traders.
Though there are many marketing channels exist in the study only few
were operating efficiently.
(i). Farmers – Commission Agent – Trader – Miller – Wholesaler – Retailer –
Consumer
(ii). Farmers – Farmer Producer Company - Traders - Miller – Wholesaler –
Retailer – Consumer
Since most of the produce was found to be flowing through channel I
and channel II only these two channels have been considered for the detailed
analysis of marketing costs and margins.
4.3 Marketing efficiency of FPC
This chapter provides understanding regarding availability of
information that provides maximum opportunities to buyers and sellers to
effect transactions with minimum transaction costs. In this section, marketing
costs, marketing margins, producer’s share in consumer’s rupee and marketing
efficiency are discussed. Five FPCs identified in the study area are selling the
produce to a single processor. Moreover, the data collected and analysed were
quite similar to all the FPCs in the study area the results presented in the Table
4.2 represents to all FPCs identified for the study.

43
4.3.1 Marketing cost
It is observed from Table 4.2 that total marketing cost incurred for
redgram in channel I was Rs. 2732 per quintal and in channel II was Rs. 2463
per quintal. Thus the cost incurred in marketing of redgram in channel I
(Rs.2732) was higher than channel II (Rs.2463). It implies that farmers who
disposed the produce on their own incurred relatively more costs compared to
the FPC shareholder farmers. Within the channel, marketing cost incurred by
the processor was more compared to other market functionaries.
Comparing the total marketing the costs incurred by different
intermediaries in the marketing of redgram are concerned; the highest cost was
incurred by the processor followed by retailer, trader, wholesalers and
commission agents. Nearly half of the total marketing costs were incurred by
the processors. The costs incurred by different intermediaries in channel I are
illustrated in Figure 4.3 and in channel II are illustrated in Figure 4.4
4.3.2 Marketing margin
The analysis of marketing margins, presented in Table 4.3 revealed that
comparatively higher margins were retained by various functionaries operating
under FPC channel compared to farmer’s marketing channel. It is revealed
from the Table 4.3 that the margins earned in marketing of redgram through
channel II (Rs.915) was less than channel I (Rs.948). It implies, when the
farmer is selling his produce to FPC, marketing margins earned by market
functionaries is minimized.
Most of the functionaries involved in the marketing of red gram earned
margins in proportion to the cost incurred by them except for processors and
retailers. Compared to total marketing margins, margins earned by processors,
traders, wholesalers and retailers are comparatively more in channel II
compared to channel I.

44
The margins earned by different intermediaries of channel I is given in
Figure 4.5 and channel II is given in Figure 4.6. Within the channel, processors
marketing margin is higher compared to other functionaries (42 per cent and 43
per cent in channel I and channel II respectively) followed by retailers backed
by commission agents in channel I and wholesalers in channel II.
4.3.3 Price spread analysis
In the marketing of agricultural commodities, the difference between the
price paid by the consumer and price received by the producer for an
equivalent quantity of the farm produce is often known as farm retail price
spread or price spread. Sometimes it is also known as marketing margin .The
total margin includes the cost involved in moving the produce from the point of
production to the point of consumption. i.e., the cost of performing various
marketing functions and the profits of various market functionaries involved in
moving the produce from the point of production till it reaches the ultimate
consumer.
The price spreads under two prominent channels i.e., channel I (Farmer
Marketing) and channel II (FPC Marketing) in the marketing of redgram has
been presented in Table 4.4. Table 4.4 revealed that the price spread in the case
of channel I was Rs.3440 (37.80 per cent) which was higher than channel-II
Rs.3225 (35.44 per cent).
Since price spread is directly proportional to the number of
intermediaries involved in the marketing of a produce, the channel-II where
producer was directly approaching the market through FPC, was found to have
less price spread when compared to farmer marketing (channel I).
The producer’s share in consumer’s rupee (PSCR) in channel II (64.56
per cent) was more than in channel I (62.19 per cent). The producer’s share in
consumer’s rupee in channel II is 64.56 per cent which means 64 per cent of
the consumer price was received by the farmer/producer, whereas in channel I
it was only 62.19 per cent which means that farmers’ share was only 62 per

45
Table 4.2 Analysis of marketing costs under different channels in the
marketing of red gram (Rs/Qn)
S. No
Functionaries
Marketing Costs (Rs/Qn)
Farmer
Marketing
(Channel I)
FPC
(Channel II)
1
Producer – Farmer
240
(8.78)
25
(1.1)
2
Commission Agent
102
(3.73)
0
3
Farmer Producer Company
0
38
(1.54)
4
Trader
190
(6.95)
190
(7.71)
5
Processor
1805
(66.06)
1805
(73.28)
6
Wholesaler
185
(6.77)
185
(7.51)
7
Retailer
210
(7.68)
210
(8.53)
8
Total
2,732 (100)
2,463 (100)
Figures in parentheses indicate the percentages to total costs incurred
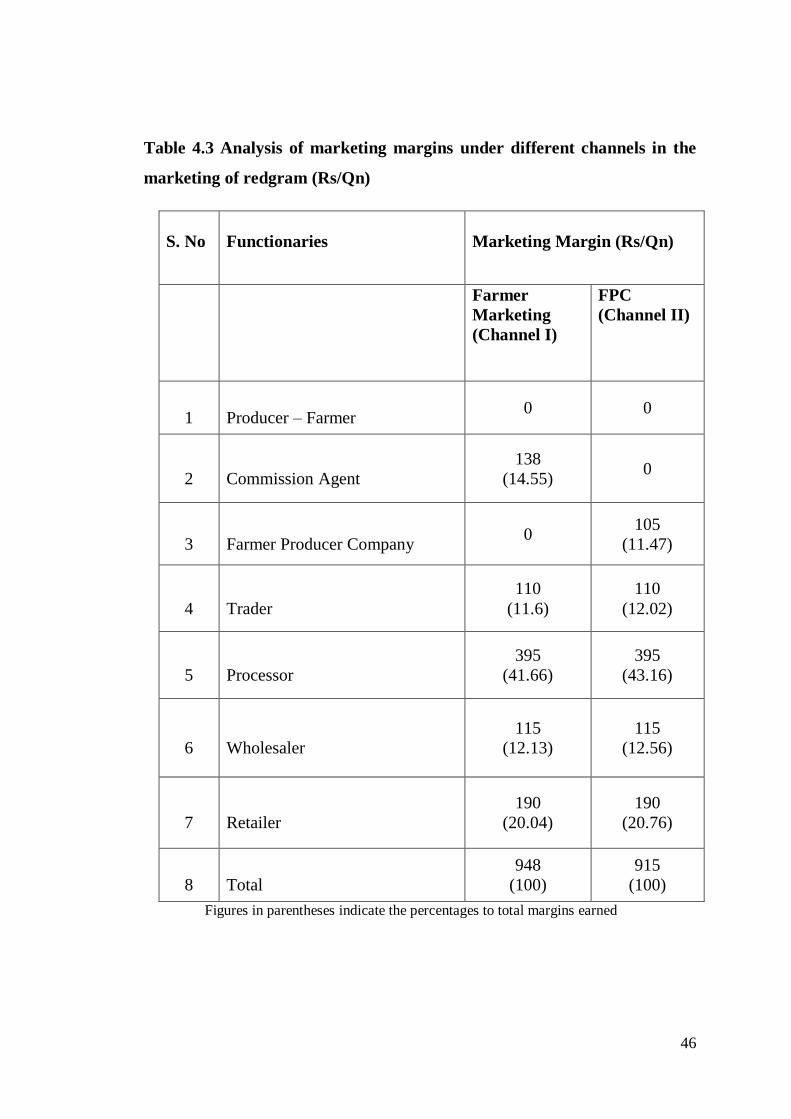
46
Table 4.3 Analysis of marketing margins under different channels in the
marketing of redgram (Rs/Qn)
S. No
Functionaries
Marketing Margin (Rs/Qn)
Farmer
Marketing
(Channel I)
FPC
(Channel II)
1
Producer – Farmer 0 0
2
Commission Agent
138
(14.55) 0
3
Farmer Producer Company 0
105
(11.47)
4
Trader
110
(11.6)
110
(12.02)
5
Processor
395
(41.66)
395
(43.16)
6
Wholesaler
115
(12.13)
115
(12.56)
7
Retailer
190
(20.04)
190
(20.76)
8
Total
948
(100)
915
(100)
Figures in parentheses indicate the percentages to total margins earned

47
Table 4.4: Price spread under different marketing channels in the
marketing of redgram (Rs/Qn)
S. No
Items
Farmer
Marketing
(Channel I)
FPC
(Channel II)
1
Producer’s net price
5660
(62.19)
5875
(64.56)
2
Producer’s market price
5900
(64.83)
5900
(64.83)
3
Commission agent’s selling
price
5900
(64.83) 0
4
Farmer producer company’s
selling price
0 5900
(64.83)
5
Trader’s selling price
6200
(68.13)
6200
(68.13)
6
Processor’s selling price
8400
(92.30)
8400
(92.30)
7
Wholesaler’s selling price
8700
(95.60)
8700
(95.60)
8
Retailer’s selling price
9100
(100)
9100
(100)
9
Price spread
3440
(37.80)
3225
(35.44)
10
Producer’s share in
consumer’s rupee
62.198
64.56
Figures in parentheses indicate the percentages to the retail price (consumer’s price)

48
Table 4.5: Indices of marketing efficiency in the selected marketing
channels
S. No
Particulars Farmer
marketing
(Channel I)
Farmer
producer
company
(Channel II)
1
Price received by the farmer
5660
5875
2
Marketing costs + Marketing
margins (MC+MM)
3680
3378
3
Index of Marketing Efficiency
(MME)
1.53
1.73

49
Figure 4.3 Marketing costs incurred by various intermediaries in channel I

50
Figure 4.4 Marketing costs incurred by various intermediaries in channel II

51
Figure 4.5 Marketing margins earned by various intermediaries in channel I
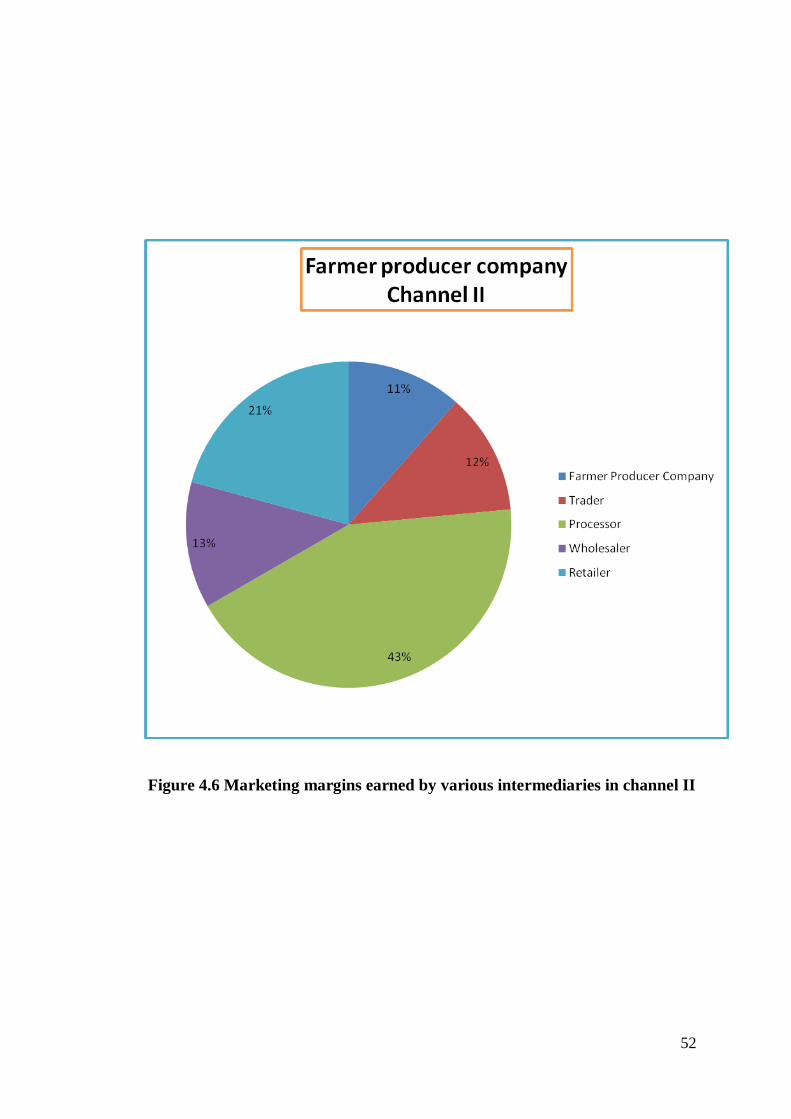
52
Figure 4.6 Marketing margins earned by various intermediaries in channel II

53
cent of consumer’s purchase price. Due to more number of market
functionaries in channel I, producer share in consumer’s rupee has decreased
compared to channel II. FPC channel is helping the farmers to have a better
producer’s share in consumer’s rupee by preventing exploitation of middlemen.
4.3.4 Marketing Efficiency
The marketing efficiency was computed using Acharya’s method and
the results presented in Table 4.5. The marketing efficiency of channel I was
1.53 and channel II was 1.73. It infers that channel II is more efficient that
channel I.
The total of marketing cost and marketing margin of channel I
(Rs.3680/quintal) was more than channel II (Rs.3378/quintal). This implies that
more the numbers of intermediaries in the existing channel lesser the marketing
efficiency of the particular channel compared with other channel with less
number of intermediaries. Moreover, FPC is taking the initiative of grading the
produce; the price received by farmer in channel II is comparatively on higher
side compared to channel I.
Due to better price received by farmer and low marketing cost and
marketing margin of channel II is higher than channel I. Farmer despite taking
all the risks in arranging his produce to sell directly, he is exploited by market
intermediaries at some stages.
4.4 Market Competitiveness
In this section, marketing competitiveness of FPC over other farmers
was discussed taking into consideration Minimum support price (MSP), FPC
selling price and open market price for redgram. Marketing costs for redgram
was analysed for Karnataka and Telangana states separately and results were
discussed below.

54
4.4.1 Market Competitiveness of FPCs
The redgram procured by FPC from it members is again graded to have
better price in the market. This is clearly evidenced from Table 4.6.
The prices that are arranged by the FPCs for the farmer members when
compared against the MSP and modal prices are relatively on the higher side.
It is observed from the Table 4.6 that FPCs selling price
(Rs.5323.33/Qn) in the state of Telangana was higher than that of both MSP
(Rs.4350/Qn) and average modal price of Tandur market (Rs.5233.37/Qn)
taken in the period. The prices prevailing in Tandur market for redgram is
taken as it is major market for redgram in the state of Telangana.
It is observed from the Table 4.7 that both MSP (Rs.4350/Qn) and
average modal price of Gulbarga market (Rs.5287.21/Qn) was lesser than that
of FPC selling price (Rs.5321.6/Qn) the state of Karnataka in the period. The
prices prevailing in Gulbarga market for redgram is taken as it is major market
for redgram in the state of Karnataka.
Though the market committee ensures care to grade the produce brought
for sale by the farmers, yet the system has some limitations, which does not
reflect truly on the quality of the produce. Such limitations are overcome in the
FPCs in which the farmers were rewarded with better price for their produce.
The year 2014-15 incidentally happens to be a bright year for pulses in
general. The price received by the farmers is quite encouraging. But it was not
the same story in the year 2013-14, during which period the redgram prices
were more often less than the MSP. This could be observed from the Table 4.8
and Table 4.9 the price of redgram in open market was less compared to MSP.
This problem was fixed to certain extent by the involvement of FPCs
through SFAC, which procured the members produce at MSP. This is also

55
Table 4.6 Redgram prices in various marketing scenario in Telangana
(2014-15)
Month/ Market MSP
(Rs/Qn)
FPC selling price
(Rs/Qn)
Modal price
(Rs/Qn)
December 4350 5472 4997.73
January 4350 5323 4847.98
February 4350 5172 5854.41
Average 4350 5323.33 5233.37
Table 4.7 Redgram prices in various marketing scenario in Karnataka
(2014-15)
Month/ Market MSP
(Rs/Qn)
FPC selling price
(Rs/Qn)
Modal price
(Rs/Qn)
December 4350 5470.1 4874.64
January 4350 5322.5 5151.70
February 4350 5172.2 5831.29
Average 4350 5321.6 5287.21

56
Table: 4.8 Redgram prices in various marketing scenario in Telangana
(2013-14)
Month/ Market MSP
(Rs/Qn)
Average FPC price
(Rs/Qn)
Modal price
(Rs/Qn)
December 4300 4300 3784.37
January 4300 4300 4167.30
February 4300 4300 3990.85
Total 4300 4300 3979.84
Table: 4.9 Redgram prices in various marketing scenario in Karnataka
(2013-14)
Month/ Market MSP
(Rs/Qn)
Average FPC price
(Rs/Qn)
Modal price
(Rs/Qn)
December 4300 4300 3894.28
January 4300 4300 4030.38
February 4300 4300 4000.85
Total 4300 4300 3975.17
57
could be put forth on the positive side because the price received in the open
market was very discouraging.
4.5 Credit Availability Models of FPC:
This section clearly presents the way and means of raising capital from
various sources by the FPCs. Capital is very much essential for establishment
of fixed assets and meeting the working capital requirements of the producer
companies. The discussion regarding credit availability models presented
below represents to all five FPCs in common.
4.5.1 Sources of own capital
Various sources of own capital for FPC has been explained below
and financing sources of own capital has been illustrated in Figure 4.7 below.
4.5.1.1 Equity shares
Farmers to become members of FPC farmer have to purchase minimum
of 50 shares with share value of Rs. 10 each. This amount raised by the
company in the form of capital is equity capital. It is the net worth used for
carrying the operations by the company. This capital raised initially either will
be constant or increases over the period. It never decreases because the member
who wants to move out of the company has to mandatory sell her shares to
other members of the company and not to outsiders. The equity capital of five
FPCs has been illustrated in Figure 4.8 below
Among the identified FPCs Kodangal farmer service producer company
raised the highest equity capital amount of Rs. 4.31 lakhs and the lowest
amount raised by Angadiraichur farmer service producer company amount to
Rs.2.72 lakhs. This implies Kodangal farmer service producer company has
more farmer shareholders compares to other four FPCs.

58
4.5.1.2 Reserves and surplus
This is the money that Producer company (PC) has ready to access need not
have to pay any interest. It may be sourced from the reserve and surpluses of
previous years. This is the easiest (but not the best) way to finance the business.
However, in the case of a new PC this opportunity will not be there. The
reserves and surplus of each FPC can be observed from the Table 4.10
4.5.1.3 Credit capital
The producers who sell their products to the PC would not hesitate in
giving credit period to the PC if convinced about the soundness of the business
idea.
On the other hand the PC can get part payment in advance from
prospective buyers of certain agricultural produce with a condition that PC has
made a deal to supply. It gets agriculture inputs from agro dealers on credit
basis. But mostly this type of finance is not available for start-up businesses or
a new venture.
Currently none of the five FPCs are getting credit from any financial
institutes but advances from president of the respective FPCs have been taken
by Angadiraichur farmer services producer company and Kodangal farmer
services producer company to an amount Rs.8865 and Rs.23840 respectively
4.5.2 Equity financing
Equity financing does not require the business to directly repay the
money lent or invested by the investors. In the case of PC, the equity comes
from the members and no external financier can participate in the equity
investment. Being a small producers’ company the equity contribution is
generally less and therefore it can not contribute significantly to the total fund
required for establishing a PC. Various equity financing sources have been
illustrated in Figure 4.9 above

59
Figure: 4.7 Sources of Own Capital

60
Figure 4.8 Equity shares of selected FPCs

61
4.5.2.1 Donation
It could be observed from the Table 4.10 that Angadiraichur
farmer service producer company got donation of Rs.25000. Equity capital of
FPCs as on 31.03.2015 can also be observed from the Table 4.10
4.5.2.2 Equity grants
Equity grants are given by SFAC to encourage and support FPCs.
Equity grants obtained by the Kodangal farmer service producer company and
Hasnabad farmer service producer company 4.69 lakhs and 4.71 lakhs
respectively.
4.5.3 Debt financing
This is the most preferred way of financing a new business. Here it is a
direct obligation to pay the interest on the money lent by the financier. The
biggest advantage is that the financier does not have control over the business
as opposed to equity financing. The important point to be noted in this is the
rate of interest charged. However, it is not easy to raise debt financing for a
producers company without collateral. Various sources of debt financing have
been illustrated in Figure 4.10 above.
4.5.3.1 Access Livelihood Development Finance
It could be observed from the Table 4.10 Kodangal Famers services
Producer Company and Hasnabad Farmers services Producer Company has
availed loan from Access Livelihood Development Finance (ALDF) amounting
to Rs.20 lakhs each at 16 per cent rate of interest.
4.5.3.2 Banks
Since all this FPCs are at the initial stage of establishment and
business none of the five FPC was having collateral for keeping surety in
banks. So banks are not ready to give loan for the FPCs currently.

62
Figure 4.9 Sources of grant capital

63
Figure 4.10 Source of debt capital

64
4.5.3.3 NABFINS
NABARRD finance service limited provides credit and other
facilities for promotion, expansion, commercialization and modernization of
FPCs. It avails loan to the FPCs at the interest rate of 16 per cent.
4.5.4 Government of India Initiatives
The PC being a small holder’s organization may seek working capital
support from the government under certain government schemes and from
other development agencies.
NABARD has been financing FPOs since 2011 under the Producer
Organisation Development Fund (PODF).
Given the limited investment capacity of the small and marginal
farmers, limited contributions are made by individual farmers to raise the FPOs
equity which often cannot sustain the operations of the FPOs. In order to
augment the equity base of the FPOs, the Union Budget, 2013-14 announced
major initiatives by providing matching equity grants. The equity grant fund of
Rs. 50 corers was sanctioned by government of India for the year 2013-14 and
is being managed by SFAC. The equity grant fund enables eligible FPCs to
receive a grant equivalent in amount to the equity contribution of their
shareholder members in the FPC, thus enhancing the overall capital base of the
FPC. The scheme supports the nascent and emerging FPCs, which have paid up
capital not exceeding Rs.30 lakhs as on the date of application.
4.5.4.1 Schemes to assist FPOs
The Government of India has promoted many schemes to assist FPC for
their development and it could be observed from Figure 4.9 illustrated below
1. Equity Grant and Credit Guarantee Fund Scheme for Farmer
Producer Companies (EGCGFS)
2. Venture Capital Assistance Scheme (VCA)

65
3. National Food Security Mission (NFSM)
4. Mission for Integrated Development of Horticulture (MDH)
5. Vegetable Initiative for Urban Cluster (VIUC)
6. Gramin Bhandaran Yojana (GBY)

66
Figure 4.11 various schemes to assist FPCs
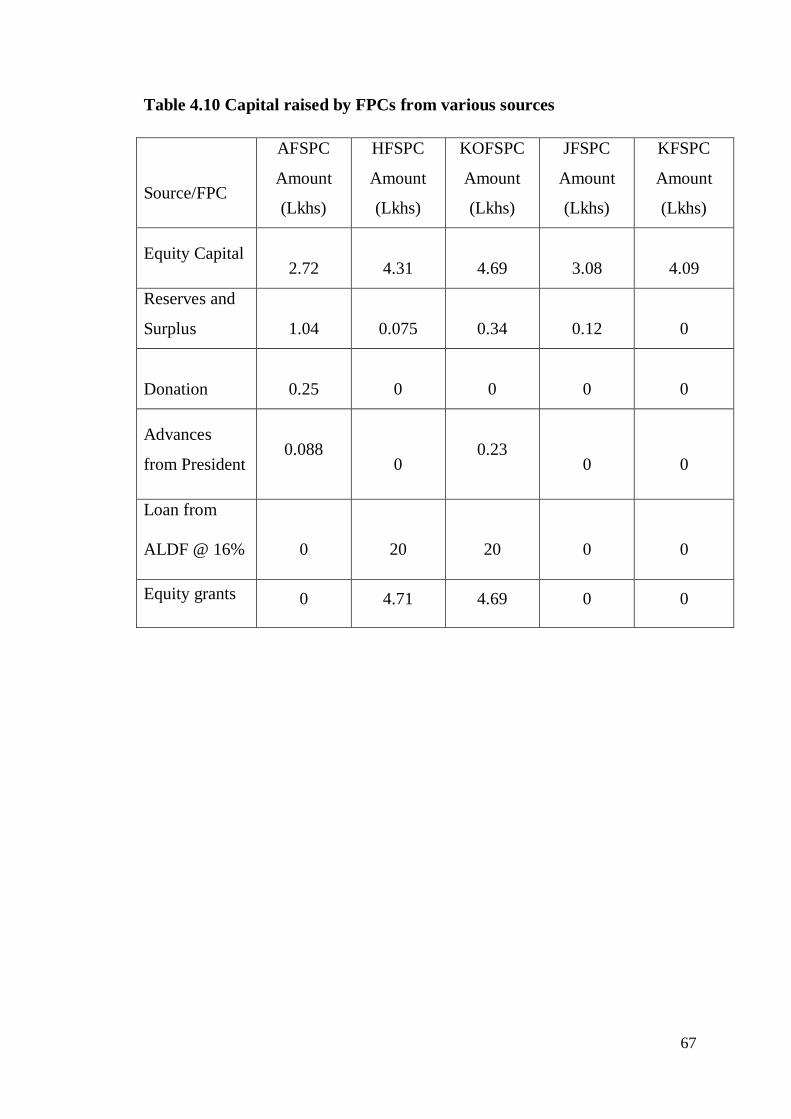
67
Table 4.10 Capital raised by FPCs from various sources
Source/FPC
AFSPC
Amount
(Lkhs)
HFSPC
Amount
(Lkhs)
KOFSPC
Amount
(Lkhs)
JFSPC
Amount
(Lkhs)
KFSPC
Amount
(Lkhs)
Equity Capital
2.72
4.31
4.69
3.08
4.09
Reserves and
Surplus
1.04
0.075
0.34
0.12
0
Donation
0.25
0
0
0
0
Advances
from President
0.088
0
0.23
0
0
Loan from
ALDF @ 16%
0
20
20
0
0
Equity grants 0 4.71 4.69 0 0

68
4.6 Financial assessment of FPCs
The FPCs in the study area have registered under companies act in the
year 2002. Though it is difficult to analyses the data less than three years care
has been taken to make decisions. The companies are maintaining the financial
statements for the periods 2013-14 & 2014-15, the ratio analysis is carried out
with the data available from the balance sheet and profit loss accounts
maintained by the companies. For all the FPCs, financial ratios are presented in
Table 4.11
4.6.1 Angadiraichur Farmers Services Producer Company
As the above FPC was newly registered and due to some constraints it
could not able to maintain the financial accounts for the period 2013-14, but
streamlined the process in the financial year 2014-15.Several ratios are derived
by taking various parameters available from financial statements and is
represented in the Table 4.11
Current ratio was not computed as the company was not having any
current liabilities. Hence, all current assets available with the company are
company’s working capital which can be further invested either in purchasing
fixed assets or raising the net worth.
Debt ratio of the company was 0.062 which infers that lenders
contribution was only 0.062 per cent of the total assets maintained by the
company. Debt equity ratio is 0.066 implying lenders contribution is only 0.066
times the owner’s contribution. Thus the leverage ratios worked out implied
that the solvency position of the company was very good.
As it was newly established and presently doing trading business the
company does not own any fixed assets. Hence turn over with respect to
current assets is worked out to be 0.422. This infers that for every one rupee
invested by the company in the current assets it is going to generate sales
revenue of Rs. 0.422 which is a good sign of investment.
69
The profitability ratios of the company indicate that, the FPC was
generating a gross profit of one and net profit of 0.344.This implies that for a
rupee invested by the company it was generating a sales revenue of 0.344 (net
profit), which is above the bank rate we can infer the company is doing well.
The operating expense ratio of 0.344 indicates the company’s operating
expenses are satisfactory minimum level which is above the bank rate we can
infer the company is doing well. The operating expense ratio of 0.344 indicates
the company’s operating expenses are satisfactory minimum level.
The FPC has both owners and lenders contribution it is very much
essential to know the increase in owner’s contribution. A very good sign of
investment for the outsiders or creditors can be known from the investment
ratios derived. Though company is in very nascent stage the ROE generated by
the company is 0.152 a good sign for future investment for the lenders. The
EPS in the financial year 2014 was 2.11 which indicate that wealth of each
shareholder value in the company has increased by 2.11.
4.6.2 Hasnabad Farmers Service Producer Company
The ratios are derived by taking various parameters available from
financial statements and is represented in the Table 4.11
The liquidity ratios namely current ratio and quick ratio for the company
for the financial year 2013 was 2.228. This indicates that there are no
inventories lying with the company. The company was meeting its current
obligation with cash and cash equivalents; whereas for the financial year 2014-
15 the company was having only current assets and no current liabilities hence
computation of liquidity ratios was not done.
The debt ratio of the company for the financial year 2013-14 and 2014-
15 was 0.047 and 0.819 respectively. The lenders contribution on the assets has
increased because in the financial year 2014-15 company has availed external
borrowings to expand the business.
70
Similarly debt equity ratio for the financial year 2013-14 and 2014-15
was 0.81 and 4.81 respectively. This implies that extent of debt financing used
in the business was more in financial year 2014-15 compared to 2013-14. As
the company is in nascent stage it is more relying on external finance to run the
business.
Current assets turnover ratio of the company for the financial year 2013-
14 and 2014-15 was 0.04 and 0.13 respectively. The company has increased the
sales revenue for a rupee invested in current assets in the financial year 2014-
15 compared to 2013-14. This indicates that the current assets are more
efficiently utilized in the financial year 2014-15.
It was evidenced from the profitability ratios that the net profit margin
of the company has decreased from 0.224 in the financial year 2013-14 to
0.106 in the year 2014-15. This is because the operating expense of the
company has increased in the financial year 2014-15 (0.98) compared to
2013(0.775).
Return on equity and earnings per share figures of the company in
financial year 2013-14 and 2014-15 was0.1, 0.101 and 0.012, 0.131
respectively. This indicates that the increase in share holders’ net worth and
share value were quite negligible as the company started the business only two
years before.
4.6.3 Kodangal Farmers Service Producer Company
The ratios are derived by taking various parameters available from
financial statements and is represented in the Table 4.11
The current liability of the company in financial year 2013-14 and 2014-
15 were quite negligible. Hence liquidity ratios are not computed.
The debt ratio of the company for the financial year 2013-14 and 2014-
15 was 0.055 and 0.8 respectively. The lenders contribution on the assets has

71
increased because in the financial year 2014-15 company has availed external
borrowings to expand the business.
Similarly debt equity ratio for the financial year 2013-14 and 2014-15
was 0.058 and 4.022 respectively. This implies that extent of debt financing
used in the business was more in the financial year 2014-15 compared to the
financial year 2013-14. As the company is in nascent stage it is more relying on
external finance to run the business.
The current assets turnover ratio for the financial year 2013-14 and
2014-15 was 0.04 and 0.07 respectively. This indicates that the efficiency of
utilisation of current assets by the company was increased.
The gross profit margin and net profit margin for the financial year
2013-14 and 2014-15 was 0.44, 0.135 and 1, 0.629 respectively. And the
operating expense figures for the financial year 2013-14 and 2014-15 was
0.308 and 0.86 respectively. The company’s gross profit margin and net profit
margin has increased in financial year 2014-15 compared to 2013-14. This is
because the company not only increased the efficiency of utilisation of assets
but also kept the operating expense at a minimum level.
The return on equity of the company for the financial year 2013-14 and
2014-15 was 0.026 and 0.047. This implies that due to increase in profits of the
company the shareholders’ net worth comparatively increased in 2014-15 than
in financial year 2013-14.
The earnings per share of the company for the financial year 2013-14
and 2014-15 were 0.272 and 0.511. As the shareholder net worth has increased
the earnings per share of each share holder has also increased.
4.6.4 Jalwad Farmers Services Producer Company
Jalwad FPC was newly registered and due to some constraints it could
not able to maintain the financial accounts for the period 2013-14, but
streamlined the process in the financial year 2014-15. So the ratios were not

72
computed for the year 2013-14. The ratios are derived by taking various
parameters available from financial statements and is represented in the Table
4.11
Liquidity ratios were not computed as the company was not having any
current liabilities. Hence, all current assets available with the company are
company’s working capital which can be further invested either in purchasing
fixed assets or raising the net worth.
Debt ratio and debt equity ratio of the company was not computed for
the financial year 2013-14 and 2014-15 has the company as no any borrowings.
As it was newly established and presently doing trading business the
company does not own any fixed assets. Hence turn over with respect to
current assets is worked out to be 0.111. This infers that for every one rupee
invested by the company in the current assets it is going to generate sales
revenue of Rs. 0.111.
The profitability ratios of the company indicate that, the FPC was
generating a gross profit of one and net profit of 0.328.This implies that for a
rupee invested by the company it was generating a sales revenue of 0.328 (net
profit), which is above the bank rate and hence the company is doing well. The
operating expense ratio of 0.671 indicates the company’s operating expenses
are satisfactory kept at a minimum level.
A very good sign of investment for the outsiders or creditors can be
known from the investment ratios derived. Though company is in very nascent
stage the ROE generated by the company was 0.383 a good sign for future
investment for the lenders. The EPS in the financial year 2014-15 was 0.398
which indicate the increase in share value as quite negligible.
4.6.5 Kalkeri Farmers Services Producer Company
Kalkeri FPC was newly registered and due to some constraints it could
not able to maintain the financial accounts for the period 2013-14, but

73
streamlined the process in the financial year 2014-15. The ratios are derived by
taking various parameters available from financial statements and is
represented in the Table 4.11
Current ratio was not computed as the company was not having any
current liabilities. Hence, all current assets available with the company are
company’s working capital which can be further invested either in purchasing
fixed assets or raising the net worth.
Debt ratio of the company was 0.011 which infers that lenders
contribution was only 0.011 per cent of the total assets maintained by the
company. Debt equity ratio is 0.011 implying lenders contribution is only 0.011
times the owner’s contribution. Leverage ratios indicate the solvency position
of the company was quite good.
The current assets turnover ratio computed was 0.14. This infers that for
every one rupee invested by the company in the current assets it is going to
generate sales revenue of Rs. 0.14 which is a good sign of investment.
The profitability ratios of the company indicate that, the FPC was
generating a gross profit of one and net profit of -0.0694.This implies that for a
rupee invested by the company it was incurring loss of Rs.-0.0694.The
operating expense ratio of 1.694 indicates the company’s operating expenses
are at maximum level which reduces the profit margin and hence the company
is running in loss.
The return on equity and earnings per share of the company was -0.098
and -0.89. It is quite obvious as the company was incurring huge operating
expenses which not only reduce the profit margin but also the wealth of each
shareholder value in the company by -0.89.

74
Table 4.11 Financial Ratios of the FPCs for 2013 and 2014
Ratios/FPC AFSPC HFSPC KOFSPC JFSPC KFSPC
2013
2014
2013
2014
2013
2014
2013
2014
2013
2014
Current Ratio
/
0
2.228
*
*
*
/
*
/
*
Quick Ratio
/
0
2.228
*
*
*
/
*
/
*
Debt Ratio
/
0.062
0.447
0.819
0.055
0.8
/
0
/
0.011
Debt Equity Ratio
/
0.066
0.81
4.817
0.058
4.022
/
0
/
0.011
Current Assets Turn
Over Ratio
/
0.422
0.044
0.134
0.04
0.07
/
0.111
/
0.14
Gross Profit Margin
/
1
1
0.166
0.44
1
/
1
/
1
Net Profit Margin
/
0.344
0.224
0.106
0.135
0.629
/
0.328
/
-0.0694
Operating Expenses
Ratio
/
0.344
0.775
0.98
0.308
0.86
/
0.671
/
1.694
Return on Equity /
0.152
0.1
0.012
0.026
0.047
/
0.383
/
- 0.098
Earnings per Share
/
2.11
0.101
0.131
0.272
0.511
/
0.398
/
-0.89
/ - Company has not maintained records for the year 2013-14.
* - Current liabilities were negligible so computation of ratios was not done.

CHAPTER V
Summary and Conclusions

75
Chapter-V
SUMMARY AND CONCLUSIONS
The present study entitled “Study on Market competitiveness and
Financing patterns of Farmer Producer Organisations (FPOs) in Telangana and
Karnataka” was intended to examine the value chain, market competitiveness,
financial models and assessment of viability of FPCs.
5.1 OBJECTIVES OF INVESTIGATION
6. to identify the stage of the FPOs and its market readiness in terms of
products and volumes
7. to map the current value chain with existing FPOs value chain to single
&multi commodity
8. to estimate the market competitiveness of the FPOs
9. to identify the capital and credit availability models of the FPOs and
10. to examine viability of FPOs in terms of capital and financing patterns
Two-stage purposive sampling technique was adopted to select the
ultimate sample units. The study was undertaken in five FPCs in Telangana and
Karnataka states. For the present study Mahabubnagar district of Telangana
state and Bijapur district of Karnataka state were selected as these were
backward districts in their respective states. Three FPCs in the state of
Telangana and two FPCs in the state of Karnataka were purposively selected
since these FPCs are promoted by same promoter.
The data were analyzed to attain the stated objectives by using
conventional analysis and financial ratios techniques.

76
5.2 MAJOR FINDINGS OF THE STUDY
The market readiness of FPCs in terms of products and volumes
revealed that all the selected FPCs were doing direct marketing and single
commodity business. They handled only redgram as their business because
most of the farmers in the study area are growing red gram due to prevailing
rainfed condition.
The study also revealed that the volume of produce handled by
Angadiraichur farmer service producer company, Hasnabad farmer service
producer company, Kodangal farmer service producer company, Jalwad farmer
service producer company and Kalkeri farmer service producer company in the
year 2013 was 180 tonnes, 127 tonnes, 90 tonnes, 127 tonnes and 120 tonnes
respectively and in 2014 it was 136 tonnes, 127 tonnes, 107 tonnes, 102 tonnes
and 110 tonnes.
In addressing changing market needs in 2013-14 redgram open market
prices was only Rs.3979.84/quintal and Rs.3975.17/ quintal in the states of
Telangana and Karnataka respectively. But FPCs made arrangements to sell the
produce through small farmers’ agribusiness consortium (SFAC) at MSP of
Rs.4300/quintal whereas in 2014-15 FPCs made arrangement to sell the
produce through traders. In the same year redgram was sold by FPC at a price
of Rs.5323.33/ quintal in the state of Telangana and at Rs.5321.6/ quintal in the
state of Karnataka which were more than that of open market price
(Rs.5233.37/quintal and 5287.21/ quintal in Telangana and Karnataka
respectively
The study on mapping of marketing channels of redgram in the study
area revealed that only few channels were operating efficiently. They were
(i). Farmers – Commission Agent – Trader – Miller – Wholesaler – Retailer –
Consumer

77
(ii). Farmers – Farmer Producer Company - Traders - Miller – Wholesaler –
Retailer – Consumer.
The total marketing costs incurred for marketing of redgram in farmer
marketing channel (channel I) were Rs. 2732 per quintal and in farmer
producer company channel (channel II) they were Rs. 2463 per quintal.
The total marketing margins earned in marketing of redgram through
farmer producer company channel (channel II) were Rs.915/quintal and in
farmer marketing channel (channel I) were Rs.948/quintal.
Price spread of the farmer marketing channel for redgram (channel I)
was found to Rs.3440 (37.80 per cent) and of the farmer producer company
channel (channel II) the same was Rs.3225 (35.44 per cent).
The producer’s share in consumer’s rupee of farmer marketing channel
(channel I) was found to be 62.19 per cent and in the case of farmer producer
company channel (channel II) it was 64.56 per cent.
The marketing efficiency of farmer marketing channel (channel I) was
1.53 and for farmer producer company channel (channel II) it was 1.73 infers
that channel II is more efficient than channel I.
The study on market competitiveness of FPCs revealed that the
Telangana FPCs selling price of redgram was Rs.5323.33/Qn, MSP was
Rs.4350/Qn and average modal price of Tandur market was Rs.5233.37/Qn
during the months of December, January and February in 2014-15. The
Karnataka FPCs selling price of redgram was Rs.5321.6/Qn; MSP was
Rs.4350/Qn and average modal price of Gulbarga market was Rs.5287.21/Qn
during the same period.
In the year 2013-14 FPCs sold the produce at the MSP. FPCs selling
price and MSP of redgram during this period were Rs. 4300/quintal in
Telangana and Karnataka states. During the same period average modal price
78
of Tandur market in Telangana was Rs. 3979.84/quintal was average modal
price of Gulbarga market in Karnataka was Rs.3975.17/ quintal.
The study on sources of capital of FPCs revealed that the equity shares
of Angadiraichur farmer service producer company was Rs.2.72 lakhs,
Hasnabad farmer service producer company was Rs. 4.31 lakhs, Kodangal
farmer service producer company was Rs.4.69, Jalwad farmer service producer
company was Rs. 3.08 lakhs and of Kalkeri farmer service producer company it
was Rs. 4.09 lakhs.
The reserves and surplus of FPCs were Rs.1.04 lakhs, Rs. 075 lakhs,
Rs.0.34 lakhs and Rs. 0.12 lakhs for Angadiraichur farmer service producer
company, Hasnabad farmer service producer company, Kodangal farmer
service producer company and Jalwad farmer service producer company
respectively. Angadiraichur farmer service producer company has received a
donation of amount Rs.25000.
The study also showed that Angadiraichur farmer service producer
company and Hasnabad farmer service producer company have taken advances
from president of the FPCs amounting Rs.8800 and Rs.23000 respectively.
Hasnabad farmer service producer company and Kodangal farmer
service producer company availed loan amounting Rs.20 lakhs each from
ALDF at the interest rate of 16 per cent. Both this FPCs also got equity grants
of Rs.4.69 lakhs and Rs.4.71 lakhs respectively from SFAC.
The financial ratios for Angadiraichur farmer service producer company
(AFSPC), Jalwad farmer service producer company (JFSPC), Kalkeri farmer
service producer company (KFSPC) were computed only for the financial year
2014-15 as there were constraints in maintenance of financial statements in
2013-14.
Liquidity ratios of the above three FPCs for the financial year 2014-15
were not computed as there were no current liabilities. Debt ratio and debt

79
equity ratio for the JFSPC was not computed as there was no borrowings for
the company. The same ratios for the AFSPC computed as 0.062 and 0.066
respectively. For the KFSPC the debt ratio and debt equity ratio was 0.011 and
0.011 respectively.
Current assets turnover ratio of AFSPC, JFSPC and KFSPC was 0.422,
0.111 and 0.14 respectively. The gross profit margin for all three FPCs was 1
and net profit margin for the same was 0.334, 0.328, -0.0694 respectively.
Operating expenses for the year 2014 was computed as 0.344, 0.671 and
1.694 for AFSPC, JFSPC and KFSPC respectively. The return on equity and
earnings per share for the same FPCs were calculated as 0.152, 0.383, -0.098
and 2.11, 0.398, -0.89 respectively.
The current ratio and quick ratio of Hasnabad farmers’ service producer
company (HFSPC) for the financial year 2013-14 was computed as 2.228. As
there was negligible amount of current liabilities for the company in the year
2014-15 leverage ratios were not computed for the same year. Debt ratio of the
company for the financial year 2013-14 and 2014-15 was computed as 0.447
and 0.819 respectively. Debt equity ratio of the company was 0.81 and 4.817
for the financial year 2013-14 and 2014-15. The gross profit margin of the
company was 1 and 0.166 in 2013-14 and 2014-15. Net profit margin for the
year 2013-14 and 2014-15 was computed as 0.224 and 0.106 respectively.
Operating expenses stood as 0.775 and 0.98 the financial year 2013-14 and
2014-15. Return on equity and earnings per share for the company in 2013-14
were computed as 0.1 and 0.101 respectively. The same ratios for the year
2014-15 were 0.012 and 0.131 respectively.
As the current liabilities of the Kodangal farmers’ service producer
company (KOFPSC) in the financial year 2013-14 and 2014-15 were
negligible, leverage ratios of the company for the same years was not
computed. Debt ratio of the company for the the financial year 2013-14 and
2014-15 was computed as 0.055 and 0.8 respectively. Debt equity ratio of the

80
company was 0.058 and 4.022 for the financial year 2013-14 and 2014-15
respectively. The gross profit margin of the company was 0.44 and 1 in 2013-
14 and 2014-15. Net profit margin for the financial year 2013-14 and 2014-15
was computed as 0.135 and 0.629 respectively. Operating expenses of the
company stood as 0.308 and 0.86 for the financial year 2013-14 and 2014-15
respectively. Return on equity and earnings per share for the company in 2013-
14 were computed as 0.026 and 0.272 respectively. The same ratios for the
financial year 2014-15 were 0.272 and 0.511 respectively.

81
CONCLUSIONS
1. All the FPCs identified in the study area were doing direct marketing
and handled single produce. They handled only redgram as their
business because most of the farmers in the study area were growing red
gram due to prevailing rainfed condition.
2. In 2013, maximum and minimum volume of produce was handled by
Kodangal farmers’ services producer company limited (190 tonnes) and
Kalkeri farmers’ services producer company Limited (120 tonnes)
respectively.
3. In 2014, maximum and minimum volume of produce was handled by
Angadiraichur farmers’ services producer company limited (136 tonnes)
and Jalwad farmers’ services producer company Limited (102 tonnes)
respectively.
4. Only15 percent – 30 percent of the redgram grown by farmer share
holders of the companies brought their produce to the FPCs, others
preferred to dispose the produce on their own.
5. In the year 2013-14 FPCs have sold the shareholders redgram at MSP
(Rs.4300/quintal) more than that open market price of
Rs.3979.84/quintal and Rs.3975.17/ quintal in Telangana and Karnataka
states respectively.
6. In the year 2013-14 FPCs have sold the produce at Rs.5323.33/quintal in
the state of Telangana and Rs.5321.6/ quintal in Karnataka state which is
more than that of open market price (Rs.5233.37/quintal and 5287.21/
quintal in the state of Telangana and Karnataka respectively.
7. The marketing channel of redgram currently followed by specified
FPCs: Farmers – Farmer Producer Company - Traders - Miller –
Wholesaler – Retailer – Consumer.
8. The cost incurred in marketing of redgram in channel I (Rs.2732) was
higher than channel II (Rs.2463). It implies that farmers who disposed
the produce on their own incurred relatively more costs compared to the
82
FPC shareholder farmers. Within the channel, marketing cost incurred
by the processor was more compared to other market functionaries.
9. The marketing margins earned in marketing of redgram through channel
II (Rs.915) was less than channel I (Rs.948). It implies, when the farmer
was selling his produce to FPC, marketing margins earned by market
functionaries were minimized.
10. The price spread in the case of channel I Rs.3440 (37.80 per cent) was
higher than channel-II Rs.3225 (35.44 per cent). Since price spread is
directly proportional to the number of intermediaries involved in the
marketing of a produce, the channel-II (farmer producer company) was
found to have less price spread when compared to farmer marketing
channel I (farmer marketing).
11. The producer’s share in consumer’s rupee (PSCR) in channel II (64.560
per cent) was more than in channel I (62.198 per cent). Due to more
number of market functionaries in channel I, producer’s share in
consumer’s rupee has decreased compared to channel II. FPC channel
was helping the farmers to have a better producer’s share in consumer’s
rupee by preventing exploitation of middlemen.
12. The marketing efficiency of channel I was 1.53 and channel II was 1.73.
It infers that channel II is more efficient that channel I.
13. The prices that are arranged by the FPCs in 2013 for the farmer
members (Rs.4300/quintal in the state of Telangana and Karnataka)
were relatively on the higher side when compared against modal price
(Rs.3979.84/quintal in Telangana and Rs.3975.17/quintal in Karnataka
state). The prices that were arranged by the FPCs in 2014 (Rs.
5323.33/quintal in Telangana state and Rs.5321.6/quintal in Karnataka
state) for the farmer members when compared against the MSP and
modal prices (Rs.5233/quintal in Telangana state and Rs.5287.21/quintal
in Karnataka state) are relatively on the higher side.

83
14. Kodangal farmers’ service producer company has maximum equity
share value of Rs.4.69 lakhs and Angadiraichur farmers’ service
producer company has minimum equity share value of Rs.2.72 lakhs.
15. The solvency and current assets turnover ratio of Kalkeri farmers service
producer company for the financial year 2014-15 was quite good. But
still the company was running at losses because the operating expense of
the company was very high. The shareholder wealth was also decreased
due to losses incurred by the company.
16. The Hasnabad farmers service producer company and Kodangal farmers
service producer company has plans to expand the business and hence
the extent of debt financing used by the company was increased in the
financial year 2014-15 compared the financial year 2013-14. Despite the
company running at profits the increase in shareholders wealth was quite
negligible.
17. There is an increase in solvency position of Angadiraichur farmers
service producer company and Jalwad farmers service producer
company for the financial year 2014-15 compared to 2013-14. Both
these companies are running in profits and operating expenses are kept
at a minimum level. There is increase in shareholders networth it is a
good sign for future investment for the lenders.

Literature Cited

84
LITERATURE CITED
Ampaire, E. L., Machethe, C. L, and Birachi, E. 2013. The role of rural
producer organizations in enhancing market participation of smallholder
farmers in Uganda: Enabling and disabling factors. African Journal of
Agricultural Research. 8(11): 963-970.
Barham, J and Chitemi, C.2009. Collective action initiatives to improve
marketing performance: Lessons from farmer groups in Tanzania. Food
Policy.34 (1): 53-59.
Berdegue, J. A., Biénabe, E and Peppelenbos, L. 2008. Innovative practice in
connecting small-scale producers with dynamic markets. Re-governing
Markets Small-scale producers in modern agrifood markets. Sustainable
Markets Group Publishing. Londan.1-48.
Bernard, T and Devid, J. S. 2009. Agricultural marketing cooperatives in
Ethiopia. Food Policy. 34 (1): 60–69.
Bhattacharjee, S. 2010. Experience of Producer Organisations a Case Study of
Five Producer Companies . Financing Agriculture. 42 (7): 12-21.
Bijman, J. and Wollni M. 2008. Producer organizations and vertical
coordination: an economic organization theory perspective. Paper
presented at the International Conference on Cooperative Studies
(ICCS). Köln. October, 2008. 1-17.
Birchall, J. 2003. Rediscovering the co-operative advantage: poverty reduction
through self-help, International Labour Organization publishing.
Geneva.
Braun, V. J and Immink, M. D. C. 1994. Non traditional Vegetable Crops and
Food Security among Smallholder Farmers in Guatemala. Economic
Development. Johns Hopkins University Press.
Catherine, R and Jennifer, G. 2012. The Role of Rural Producer Organizations
for Agricultural Service Provision in Fragile States. In Selected Paper
prepared for presentation at the Agricultural & Applied Economics
85
Association’s, 2012, International Food Policy Research Institute
(IFPRI), Washington.
Chetna Organic Farmers Association (COFA). Organic Cotton Intervention
Project: Improving livelihood options for smallholding cotton growers
in rain fed regions of India through socio-technical extension services
and collective marketing interventions. Annual report for the period
from January to December, 2010.
http://www.chetnaindia.org/Annual%20report-10%20for%20website-
2.pdf
Deininger, U.D. and Sur, M. 2006. Food Safety in a Globalizing World:
Opportunities and Challenges for India. Paper presented at the
International Association of Agricultural Economists Conference,
August, Gold Coast Australia.
Dev, S. M. 2005 'Agriculture and rural employment in the budget'. Economic
and Political Weekly. 40(14): 1410-1418.
Dhakal, S. 2013. Seed Producer Organization of Farmer an experience of
Western Terai, Nepal. Agronomy Journal of Nepal. 3: 1-12.
Dr. Gábor and G. Szabó. Successful Producer Owned Marketing Organisations
in a Transition Country: Two Case Studies from Hungarian
Agribusiness. Paper prepared for presentation at the 113th
EAAE
Seminar “A resilient European food industry and food chain in a
challenging world, 3 - 6 September 2009, Chania, Greece.
Ebrahim, A. 2000. Agricultural co-operatives in Gujarat, India: agents of equity
or differentiation. Development in Practice. 10(2): 178-188.
Estelle, B and Denis, S. 2005. The role of small scale producer organisations to
address market access. Centre de Cooperation Internationale en
86
Recherché Agronomique pour le Developpment, CIRD TERA. 1 (60/5):
73
FAO. 2014. Contract Farming Resource Centre.13 May 2014.
http://www.fao.org/ag/ags/contract-farming/faq/en/
Financial Management: I.M.Pandey, 4th Edition.
Fischer, E and Qaim, M. 2012. Linking Smallholders to Markets: Determinants
and Impacts of Farmer Collective Action in Kenya. World Development.
40(6):1255–1268.
Gill, S. S. 2004. Small farmers and Markets. Book review, Economic and
Political Weekly. 39(23): 2356-2358.
Hazell, P. B. 2005. Is there a future for small farms. Agricultural Economics.
32(s1): 93-101.
Hellin, J., Lundy, M and Meijer, M. 2009. Farmer organization, collective
action and market access in Meso-America. Food Policy. 34(1): 16-22.
Javier A. Escobal and Cavero, D. 2012. Transaction Costs, Institutional
Arrangements and Inequality Outcomes: Potato Marketing by Small
Producers in Rural Peru.World Development.40 (2): 329–341.
Jessop, R., Diallo, B., Duursma, M., Mallek, A., Harms, J and Manen, B. V.
2012. Creating Access to Agricultural Finance: Based on a horizontal
study of Cambodia, Mali, Senegal, Tanzania, Thailand and Tunisia.
Agence Francaise de Développement. A Saviour publication.France.
Kumar, B L. 1990. Gambhira Co-operative farming society: a successful
experiment in collective efforts. Indian Journal of Agricultural
Economics. 45(3): 362-366.
Marzena and Paul, P. 2011. - Producer Companies and their Partnered
Institutions, Owned by Small and Marginal Producers in India. M.sc
thesis submitted to Lunds University. August, 2011.
87
Murray, E.V. 2008. Producer company model: Opportunities for bank finance.
Proceedings of the Pradhan Workshop on Producer Companies. 46-51.
National Crime Records Bureau. 2011. Accidental Death and Suicides in India.
Ministry of Home Affairs, Government of India.
Patibandla, M and Sastry, T. 2004. Capitalism and Co-operation: co-operative
institutions in a developing economy. Economic and Political Weekly.
July 3: 2997-3004.
Perspectives and Problems of Primary Producers Companies. 2009. Case study
of Indian Organic Farmers Producer Company Limited, Kochi, Kerala -
National Rainfed Area Authority, New Delhi, India.
Poulton, C., Dorward, A and Kydd, J. 2010. The future of small farms: New
directions for services, institutions, and intermediation. World
Development. 38(10): 1413-1428.
PRADAN . 2007. Linking Small Producers to Markets through Producer
Companies. A note for the workshop held on December 20, at IHC, New
Delhi.
Pritchard, B. and Connell, J. 2011. Contract farming and the remaking of
agrarian landscapes: Insights from South India's chilli belt. Singapore
Journal of Tropical Geography. 32(2): 236-252.
Purushotham, P. 2012. Seminar Paper - Small producer companies’
participation in retail and commodity markets: A case study of poor
farmers. CESS, Hyderabad. September 21-22.
Pustovoitova, N. 2011. Producer Company as an Institutional Option for Small
Farmers in India. M.sc thesis submitted to Lunds University. August,
2011.

88
Reserve Bank of India. 2006. Report of the Working Group to Suggest
Measures to Assist Distressed Farmers.02 June 2014.
http://rbidocs.rbi.org.in/rdocs/PublicationReport/Pdfs/78889.pdf
Robert, M. M and Peter, D. 2014. Privatisation, empowerment and
accountability: What are the policy implications for establishing
effective farmer organisations. Land Use Policy. 36: 285– 295.
Rondot, P and Collion, M. H. 2000. Agricultural Producer Organizations: Their
Contribution to Rural Capacity Building and Poverty Reduction. Report
of a Workshop, Washington, D.C., June 28-30, 1999:81.
Roslynne, G. G and Bill, S. 2006. Agricultural producer cooperative as
strategic alliances International Food and Agribusiness Management
Association (IAMA) Review, 9 (4): 26-44.
Satish, P. 2007. Agricultural credit in the post-reform era: A target of
systematic policy coarctation. Economic and Political Weekly: 2567-
2575.
Shah, T. 1996.Catalysing co-operation- design of self-governing organisations,
Sage publications. New Delhi. 1- 315.
Shepherd, A. 2007. Approaches to linking producers to markets: A review of
experiences to date. 02 June 2014.
ftp://ftp.fao.org/docrep/fao/010/a1123e/a1123e00.pdf
Shylendra, H. S. 2009. New Governance and Development, Challenges of
Addressing Poverty and Inequality. Academic Foundation, New Delhi.
Singh, S and Singh, T. Producer Companies in India: A study of organization
and performance. CMA Publication - 246.
Singh, S. 2008. Producer companies as new generation cooperatives. Economic
and Political Weekly. 43(20): 22-24.

89
Singh, S. 2009. Organic Produce Supply Chains in India: Organisation and
Governance: Allied Publishers.
Singh, S. 2012. New markets for smallholders in India–Exclusion, policy and
mechanisms. Economic and Political Weekly, 47: 95-105.
Sriram, M. 2008. Agrarian distress and rural credit: Peeling the onion. State of
India's Livelihoods: The 4 P Report, Access Development Services.
New Delhi: 177-188.
Subbarao K. 1978. Rice Marketing System and Compulsory Levies in Andhra
Pradesh: A Study of Public Intervention in Food grain Marketing,
Allied, Bombay.
Tanguy, B and David, J. S. 2009.Reaching the rural poor through rural
producer organizations? A study of agricultural marketing cooperatives
in Ethiopia. Food Policy. 34: 60–69.
Tita, D.F., D'Haese, M., Degrandeb, A., Tchoundjeu, Z and Damme, P.V.
2011. Farmers' satisfaction with group market arrangements as a
measure of group market performance: A transaction cost analysis of
Non Timber Forest Products' producer groups in Cameroon. Forest
Policy and Economics. 13: 545–553.
Trebbin, A and Hassler, M. 2012. Collective action for cotton alternatives −
Producer companies as local solutions to counteract India’s Bt cotton
mainstream. The Geographical Journal. Eingereicht.
Trebbin, A and Hassler, M. 2012. Farmers producer companies in India: a new
concept for collective action. Environment and Planning. 44: 411-427.
Urban and Peri-urban Agriculture. 2007. Synthesis Paper - Towards a better
understanding of low-income producers’ organizations. Urban Poverty
and Environment Series Report, 2005-07.

90
Varun Prasad. 2013. CCS working Paper 293 - Contract Farming through
Farmer Producer Organizations (FPOs) in India. July, 2013. 1-46.
Venkattakumar, R and Sontakki, S.B. 2012. Producer companies in India:
Experience and Implications. Indian Research Journal of Extension
Education. 1: 154-160.