NuScale Plant Market Competitiveness &...
16
Non-Proprietary © 2015 NuScale Power, LLC © 2015 NuScale Power, LLC TM NuScale Plant Market Competitiveness & Financeability Jay Surina Chief Financial Officer NuScale Exposition August 20-21, 2015
Transcript of NuScale Plant Market Competitiveness &...
Non-Proprietary © 2015 NuScale Power, LLC
© 2015 NuScale Power, LLC
TM
NuScale Plant Market Competitiveness & Financeability
Jay Surina Chief Financial Officer
NuScale Exposition August 20-21, 2015
Non-Proprietary © 2015 NuScale Power, LLC
SMR Market Potential
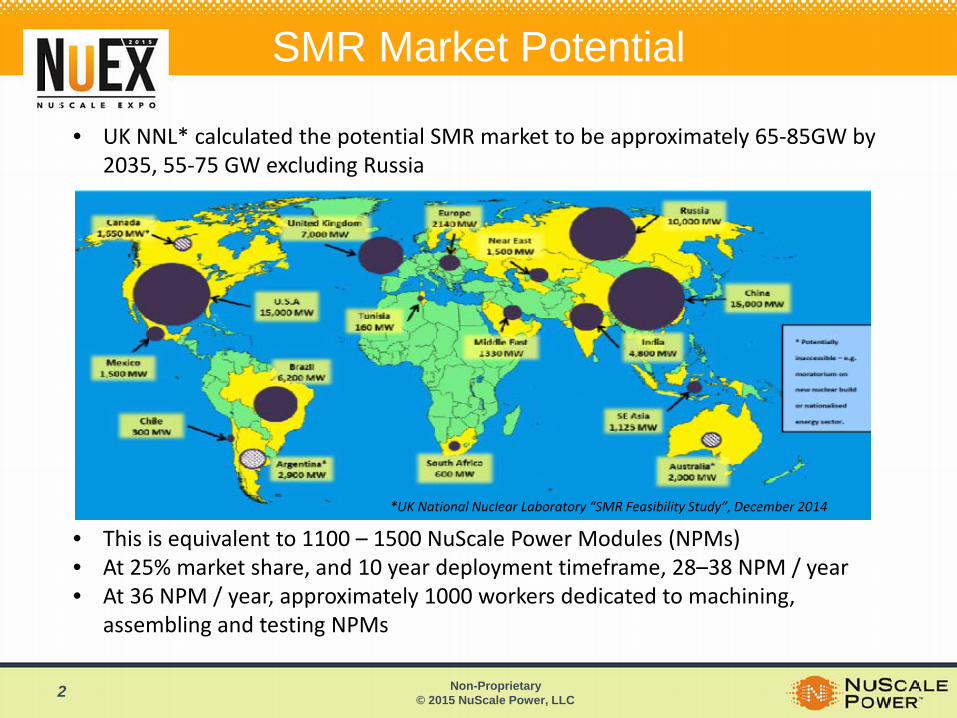
• UK NNL* calculated the potential SMR market to be approximately 65-85GW by 2035, 55-75 GW excluding Russia
• This is equivalent to 1100 – 1500 NuScale Power Modules (NPMs) • At 25% market share, and 10 year deployment timeframe, 28–38 NPM / year • At 36 NPM / year, approximately 1000 workers dedicated to machining,
assembling and testing NPMs
*UK National Nuclear Laboratory “SMR Feasibility Study”, December 2014
2
Non-Proprietary © 2015 NuScale Power, LLC
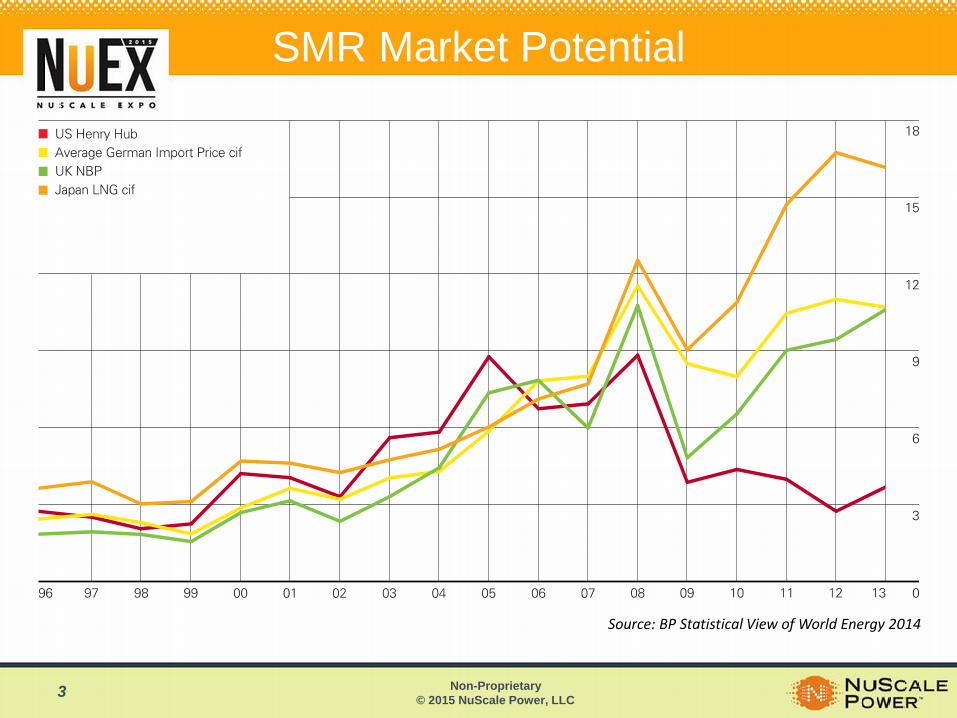
SMR Market Potential
Source: BP Statistical View of World Energy 2014
3
Non-Proprietary © 2015 NuScale Power, LLC
SMRs & the Clean Power Plan (CPP)
TM 4
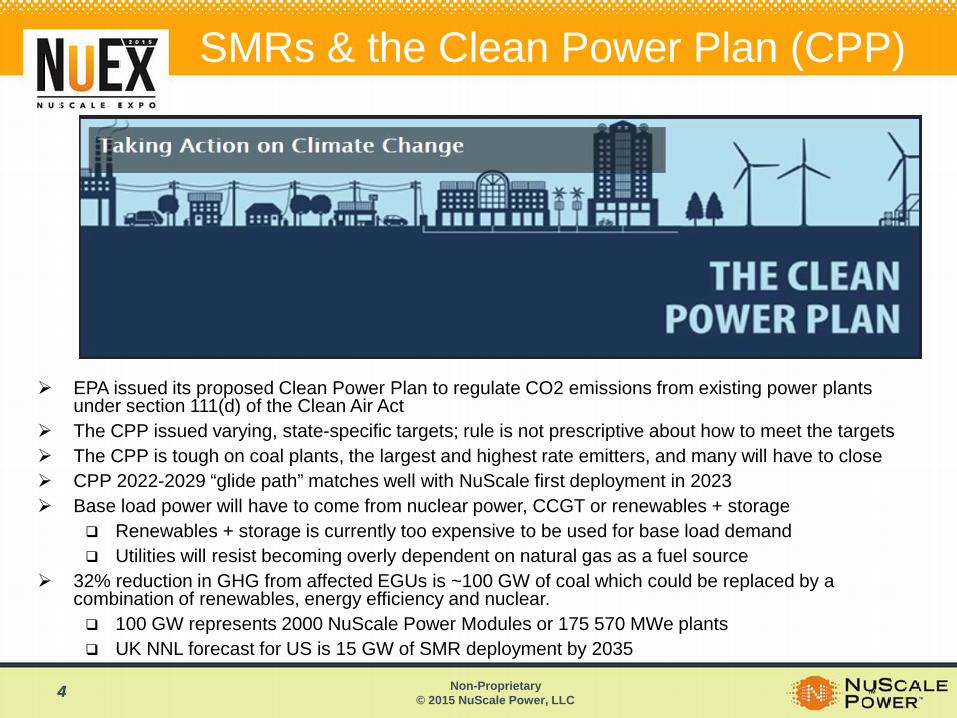
EPA issued its proposed Clean Power Plan to regulate CO2 emissions from existing power plants under section 111(d) of the Clean Air Act
The CPP issued varying, state-specific targets; rule is not prescriptive about how to meet the targets The CPP is tough on coal plants, the largest and highest rate emitters, and many will have to close CPP 2022-2029 “glide path” matches well with NuScale first deployment in 2023 Base load power will have to come from nuclear power, CCGT or renewables + storage
Renewables + storage is currently too expensive to be used for base load demand Utilities will resist becoming overly dependent on natural gas as a fuel source
32% reduction in GHG from affected EGUs is ~100 GW of coal which could be replaced by a combination of renewables, energy efficiency and nuclear. 100 GW represents 2000 NuScale Power Modules or 175 570 MWe plants UK NNL forecast for US is 15 GW of SMR deployment by 2035
4
Non-Proprietary © 2015 NuScale Power, LLC 5
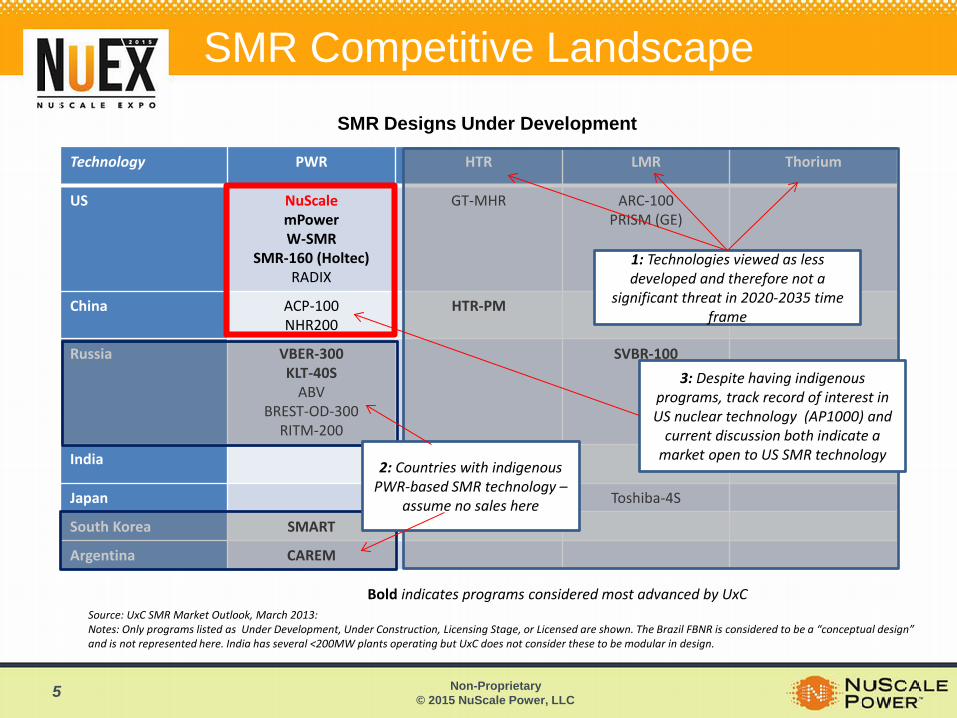
SMR Competitive Landscape
Technology PWR HTR LMR Thorium
US NuScale mPower W-SMR
SMR-160 (Holtec) RADIX
GT-MHR ARC-100 PRISM (GE)
China ACP-100 NHR200
HTR-PM
Russia VBER-300 KLT-40S
ABV BREST-OD-300
RITM-200
SVBR-100
India AHWR
Japan GTHTR Toshiba-4S
South Korea SMART
Argentina CAREM
SMR Designs Under Development
Source: UxC SMR Market Outlook, March 2013: Notes: Only programs listed as Under Development, Under Construction, Licensing Stage, or Licensed are shown. The Brazil FBNR is considered to be a “conceptual design” and is not represented here. India has several <200MW plants operating but UxC does not consider these to be modular in design.
Bold indicates programs considered most advanced by UxC
1: Technologies viewed as less developed and therefore not a
significant threat in 2020-2035 time frame
2: Countries with indigenous PWR-based SMR technology –
assume no sales here
3: Despite having indigenous programs, track record of interest in US nuclear technology (AP1000) and
current discussion both indicate a market open to US SMR technology
Non-Proprietary © 2015 NuScale Power, LLC
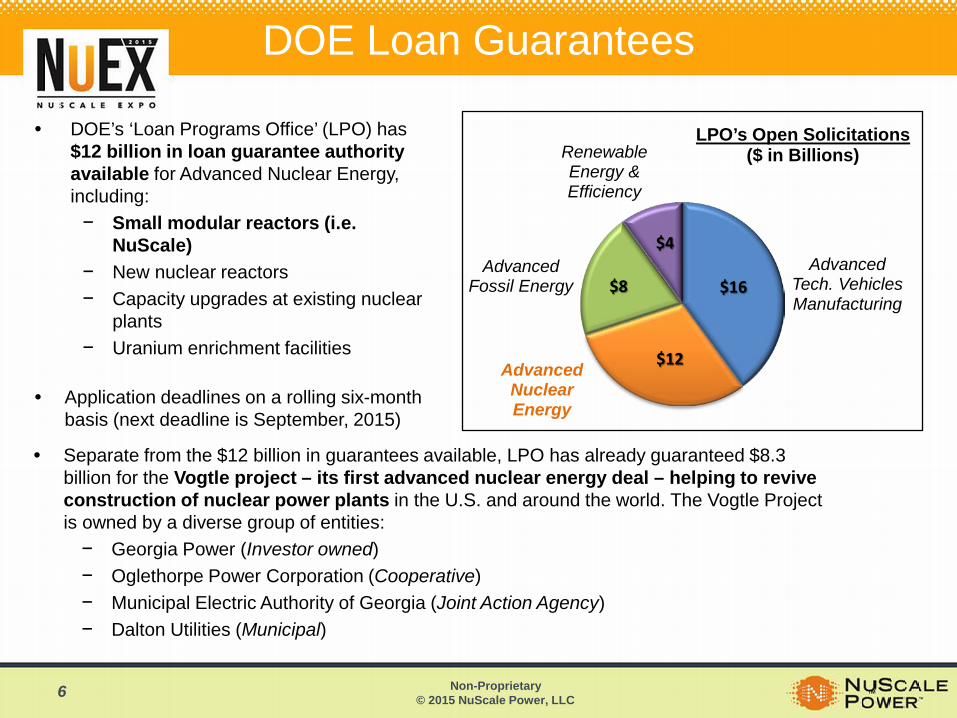
• DOE’s ‘Loan Programs Office’ (LPO) has $12 billion in loan guarantee authority available for Advanced Nuclear Energy, including: − Small modular reactors (i.e.
NuScale) − New nuclear reactors − Capacity upgrades at existing nuclear
plants − Uranium enrichment facilities
• Application deadlines on a rolling six-month
basis (next deadline is September, 2015)
DOE Loan Guarantees
TM 6
• Separate from the $12 billion in guarantees available, LPO has already guaranteed $8.3 billion for the Vogtle project – its first advanced nuclear energy deal – helping to revive construction of nuclear power plants in the U.S. and around the world. The Vogtle Project is owned by a diverse group of entities: − Georgia Power (Investor owned) − Oglethorpe Power Corporation (Cooperative) − Municipal Electric Authority of Georgia (Joint Action Agency) − Dalton Utilities (Municipal)
Advanced Tech. Vehicles Manufacturing
Advanced Nuclear Energy
Advanced Fossil Energy
Renewable Energy & Efficiency
LPO’s Open Solicitations ($ in Billions)
$12
$16
$4
$8
Non-Proprietary © 2015 NuScale Power, LLC
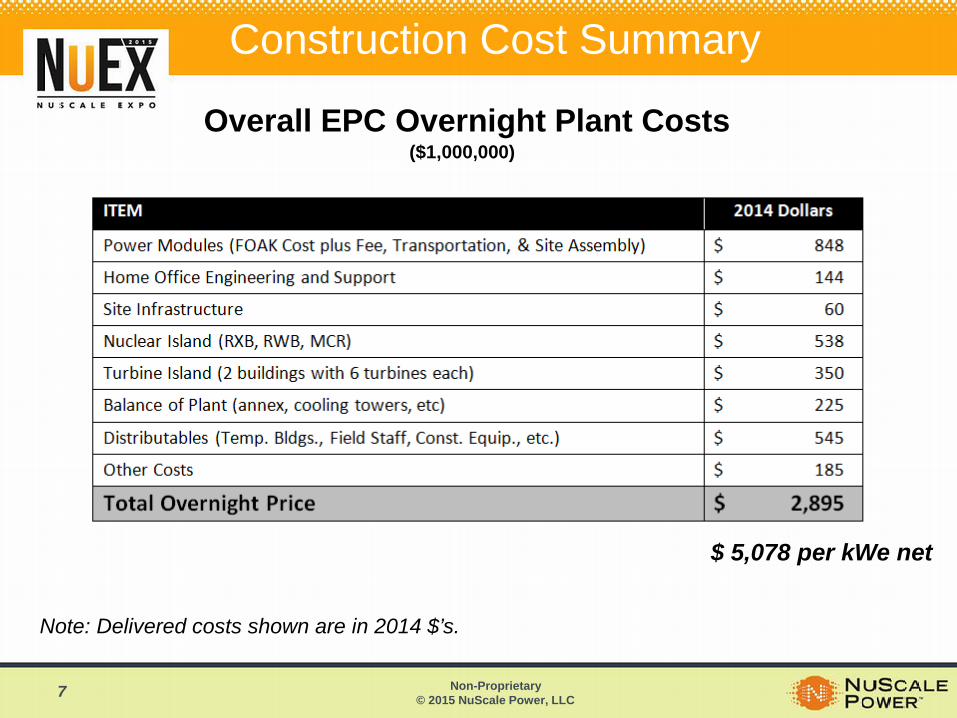
Construction Cost Summary
Overall EPC Overnight Plant Costs ($1,000,000)
Note: Delivered costs shown are in 2014 $’s.
$ 5,078 per kWe net
7
Non-Proprietary © 2015 NuScale Power, LLC
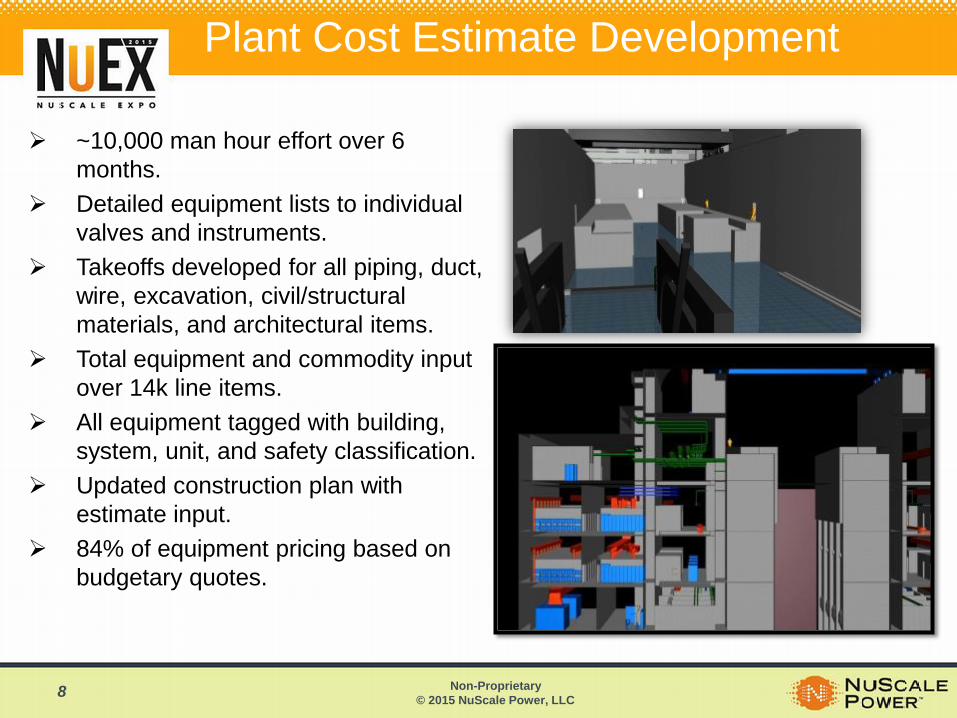
~10,000 man hour effort over 6 months.
Detailed equipment lists to individual valves and instruments.
Takeoffs developed for all piping, duct, wire, excavation, civil/structural materials, and architectural items.
Total equipment and commodity input over 14k line items.
All equipment tagged with building, system, unit, and safety classification.
Updated construction plan with estimate input.
84% of equipment pricing based on budgetary quotes.
Plant Cost Estimate Development
8
Non-Proprietary © 2015 NuScale Power, LLC
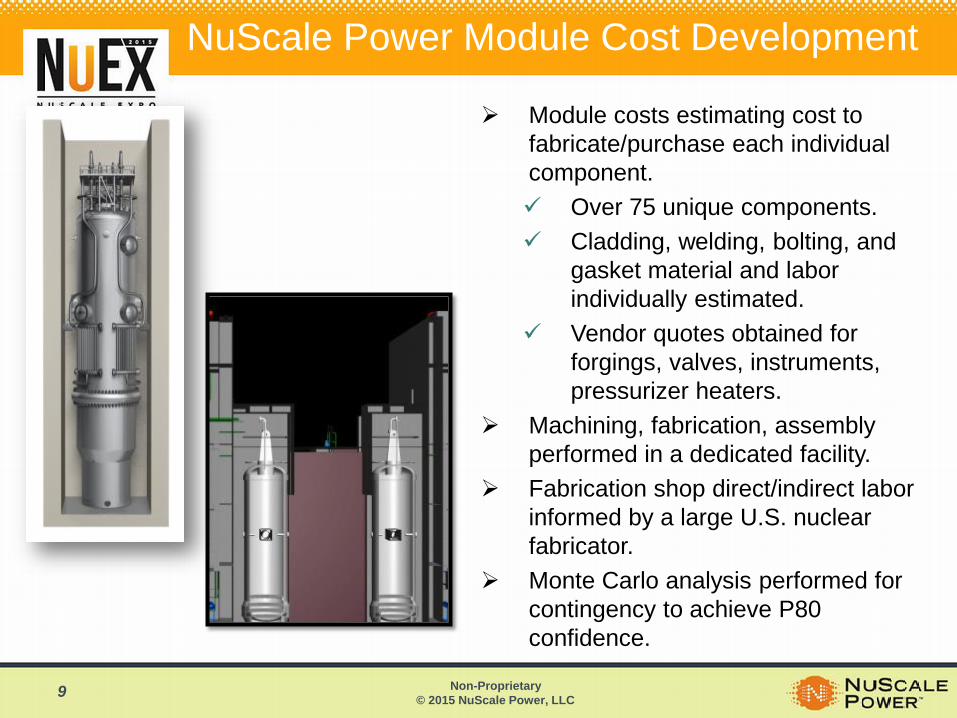
Module costs estimating cost to fabricate/purchase each individual component. Over 75 unique components. Cladding, welding, bolting, and
gasket material and labor individually estimated.
Vendor quotes obtained for forgings, valves, instruments, pressurizer heaters.
Machining, fabrication, assembly performed in a dedicated facility.
Fabrication shop direct/indirect labor informed by a large U.S. nuclear fabricator.
Monte Carlo analysis performed for contingency to achieve P80 confidence.
NuScale Power Module Cost Development
9
Non-Proprietary © 2015 NuScale Power, LLC
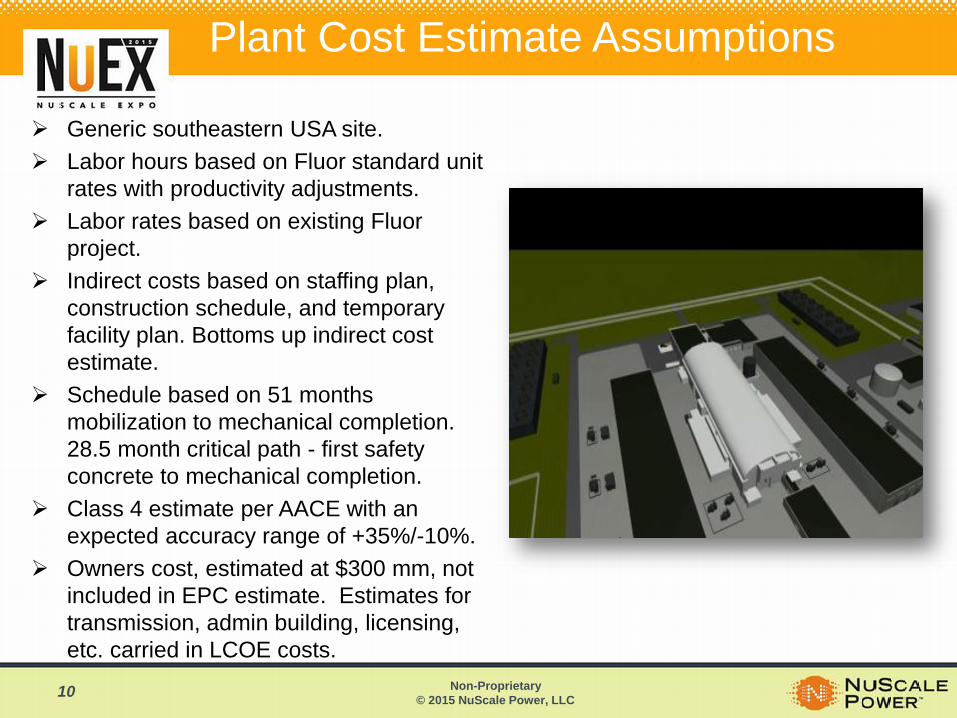
Plant Cost Estimate Assumptions
Generic southeastern USA site. Labor hours based on Fluor standard unit
rates with productivity adjustments. Labor rates based on existing Fluor
project. Indirect costs based on staffing plan,
construction schedule, and temporary facility plan. Bottoms up indirect cost estimate.
Schedule based on 51 months mobilization to mechanical completion. 28.5 month critical path - first safety concrete to mechanical completion.
Class 4 estimate per AACE with an expected accuracy range of +35%/-10%.
Owners cost, estimated at $300 mm, not included in EPC estimate. Estimates for transmission, admin building, licensing, etc. carried in LCOE costs. 10
Non-Proprietary © 2015 NuScale Power, LLC
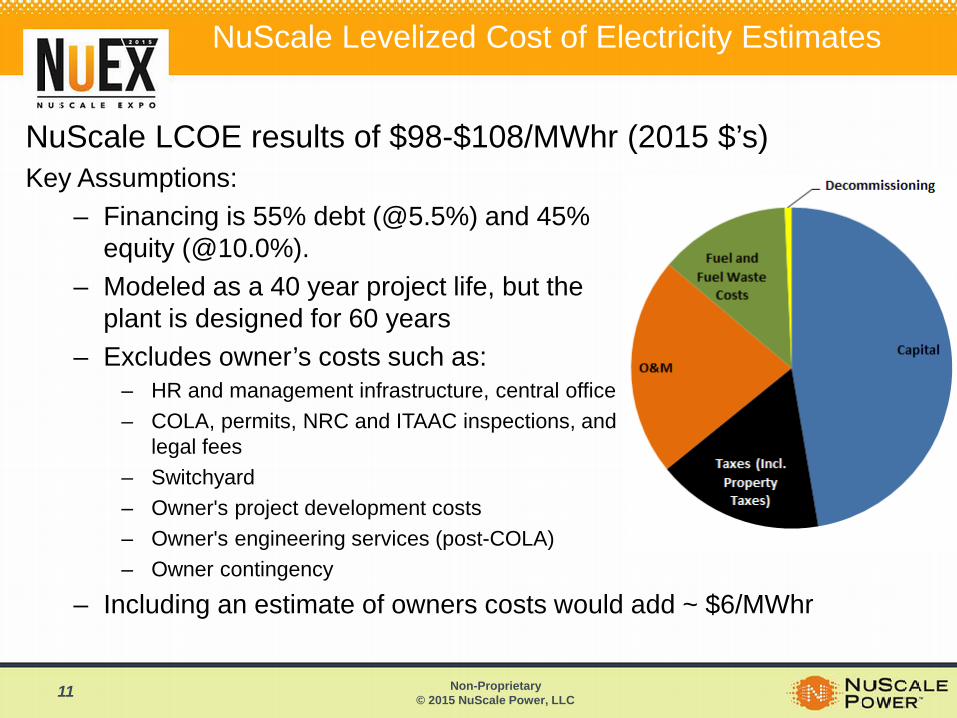
NuScale LCOE results of $98-$108/MWhr (2015 $’s) Key Assumptions:
– Financing is 55% debt (@5.5%) and 45% equity (@10.0%).
– Modeled as a 40 year project life, but the plant is designed for 60 years
– Excludes owner’s costs such as: – HR and management infrastructure, central office – COLA, permits, NRC and ITAAC inspections, and
legal fees – Switchyard – Owner's project development costs – Owner's engineering services (post-COLA) – Owner contingency
– Including an estimate of owners costs would add ~ $6/MWhr
NuScale Levelized Cost of Electricity Estimates
11
Non-Proprietary © 2015 NuScale Power, LLC
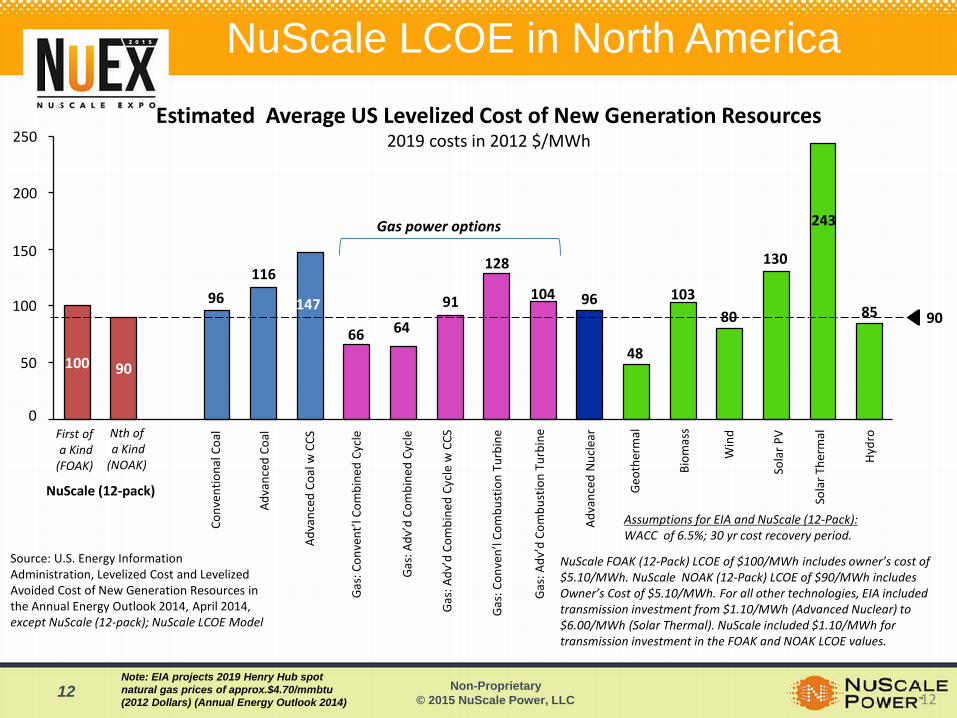
NuScale LCOE in North America
90
100 90
96 116
147
66 64
91
128
104 96
48
103 80
130
243
85
Gas:
Adv
’d C
ombi
ned
Cycl
e w
CCS
Gas:
Adv
’d C
ombi
ned
Cycl
e
Gas:
Con
vent
’l Co
mbi
ned
Cycl
e
Adva
nced
Coa
l w C
CS
Adva
nced
Coa
l
Conv
entio
nal C
oal
250
200
150
100
50
0
Hydr
o
Sola
r The
rmal
Sola
r PV
Win
d
Biom
ass
Geot
herm
al
Adva
nced
Nuc
lear
Gas:
Adv
’d C
ombu
stio
n Tu
rbin
e
Gas:
Con
ven’
l Com
bust
ion
Turb
ine
NuScale (12-pack)
First of a Kind (FOAK)
Gas power options
Source: U.S. Energy Information Administration, Levelized Cost and Levelized Avoided Cost of New Generation Resources in the Annual Energy Outlook 2014, April 2014, except NuScale (12-pack); NuScale LCOE Model
Estimated Average US Levelized Cost of New Generation Resources 2019 costs in 2012 $/MWh
NuScale FOAK (12-Pack) LCOE of $100/MWh includes owner’s cost of $5.10/MWh. NuScale NOAK (12-Pack) LCOE of $90/MWh includes Owner’s Cost of $5.10/MWh. For all other technologies, EIA included transmission investment from $1.10/MWh (Advanced Nuclear) to $6.00/MWh (Solar Thermal). NuScale included $1.10/MWh for transmission investment in the FOAK and NOAK LCOE values.
Assumptions for EIA and NuScale (12-Pack): WACC of 6.5%; 30 yr cost recovery period.
12 Note: EIA projects 2019 Henry Hub spot natural gas prices of approx.$4.70/mmbtu (2012 Dollars) (Annual Energy Outlook 2014)
Nth of a Kind (NOAK)
12
Non-Proprietary © 2015 NuScale Power, LLC
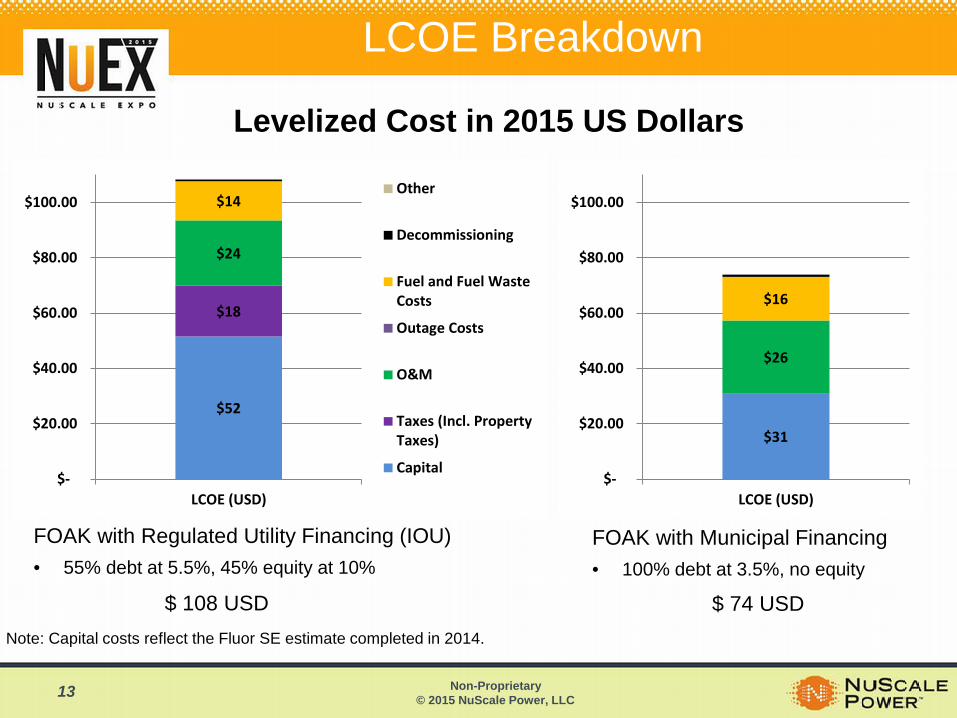
LCOE Breakdown
FOAK with Regulated Utility Financing (IOU) • 55% debt at 5.5%, 45% equity at 10%
FOAK with Municipal Financing • 100% debt at 3.5%, no equity
$ 108 USD $ 74 USD
Levelized Cost in 2015 US Dollars
Note: Capital costs reflect the Fluor SE estimate completed in 2014.
$52
$18
$24
$14
$-
$20.00
$40.00
$60.00
$80.00
$100.00
LCOE (USD)
Other
Decommissioning
Fuel and Fuel WasteCosts
Outage Costs
O&M
Taxes (Incl. PropertyTaxes)
Capital
$31
$26
$16
$-
$20.00
$40.00
$60.00
$80.00
$100.00
LCOE (USD)
13
Non-Proprietary © 2015 NuScale Power, LLC
47 32
46 63
28 22 17 16
24 8 16 11 9 4 8
24
20
25
40
15 13 21
13
21
20 9 7 6 10 18
11
0
10
20
30
40
50
60
70
80
90
100
110
SO EXC D DUK PCG EIX FE ETR PPL NRG DTE AEE SCG DYN CPN
$ in
Bill
ions
Remaining Enterprise ValueMarket Cap
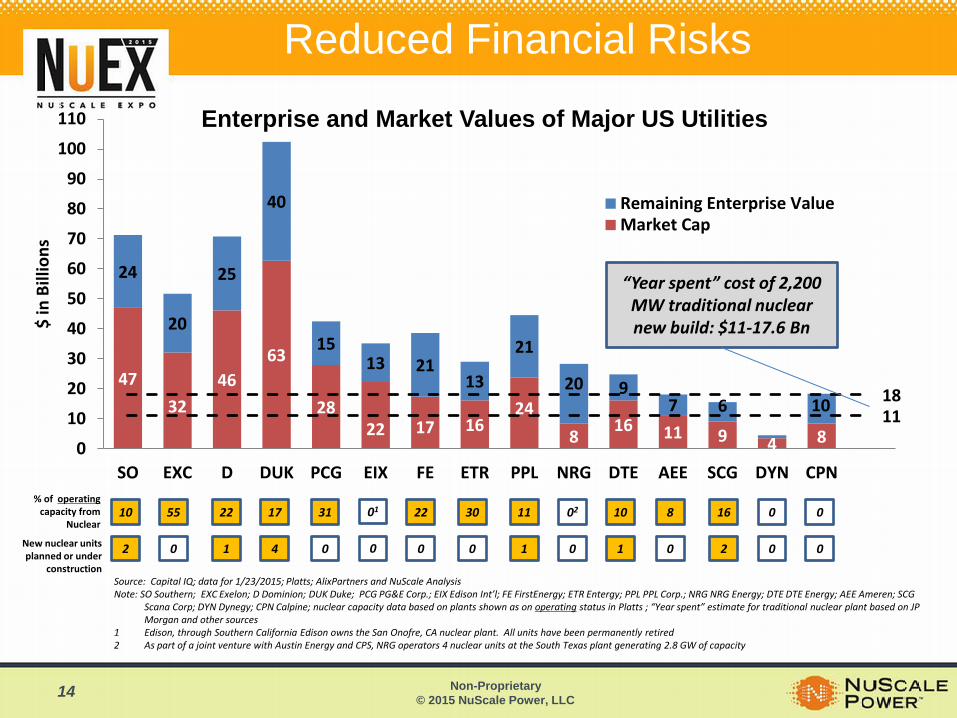
Reduced Financial Risks
Source: Capital IQ; data for 1/23/2015; Platts; AlixPartners and NuScale Analysis Note: SO Southern; EXC Exelon; D Dominion; DUK Duke; PCG PG&E Corp.; EIX Edison Int’l; FE FirstEnergy; ETR Entergy; PPL PPL Corp.; NRG NRG Energy; DTE DTE Energy; AEE Ameren; SCG
Scana Corp; DYN Dynegy; CPN Calpine; nuclear capacity data based on plants shown as on operating status in Platts ; “Year spent” estimate for traditional nuclear plant based on JP Morgan and other sources
1 Edison, through Southern California Edison owns the San Onofre, CA nuclear plant. All units have been permanently retired 2 As part of a joint venture with Austin Energy and CPS, NRG operators 4 nuclear units at the South Texas plant generating 2.8 GW of capacity
Enterprise and Market Values of Major US Utilities
10 55 22 17 31 01 22 30 11 02 10 0 8 16 0 % of operating
capacity from Nuclear
New nuclear units planned or under
construction
2 0 1 4 0 0 0 0 1 0 1 0 0 2 0
“Year spent” cost of 2,200 MW traditional nuclear new build: $11-17.6 Bn
14
Non-Proprietary © 2015 NuScale Power, LLC
The Element of Nu
Jay Surina Chief Financial Officer [email protected] www.nuscalepower.com