Study of structural, successional and spatial patterns in ...
22
Ecological Modelling 124 (1999) 233 – 254 Study of structural, successional and spatial patterns in tropical rain forests using TROLL, a spatially explicit forest model Je ´ro ˆ me Chave * Ser6ice de Physique de l’Etat Condense ´ , DRECAM CEN Saclay, l’Orme des Merisiers, F -91191 Gif sur Y6ette, France Accepted 15 June 1999 Abstract Competition for light, treefall gap formation and recruitment are the critical phenomena in the genesis of tropical rain forests. These aspects are taken into account to build a new spatially explicit forest growth model called TROLL. Competition for light is modelled by calculating exactly the three-dimensional field of photosynthetically active radiation in the forest understorey. Typically, 10 6 light intensities are computed per hectare at each time step. This light field controls the growth of each tree and establishment/death events. Seed dispersal, dormancy and establish- ment success as well as a model of treefalls are also included. A special care is paid to the justification and to the validation of each of these modules. The TROLL model is parameterized for a Neotropical rain forest in French Guiana using 12 functional groups of species. Using this model the vertical canopy structure and the tree diametric distribution are investigated. The role of treefalls in maintaining pioneer species is also evidenced. A forest succession scenario is simulated and compared to field data. The model is then used to simulate the recolonization of a previously sterilized area by a rain forest plant community. This scenario is interpreted using information available from palaeorecords over the Holocene period and their validity is discussed. It is suggested that this model could be used to study mosaic-like patterns in rain forests, installation of slowly dispersing species, speciation hypotheses and landscape scale dynamics of rain forests. © 1999 Elsevier Science B.V. All rights reserved. Keywords: Tropical rain forest; Simulation; Individual-based model; Parallel processing; Canopy gaps; Spatial patterns www.elsevier.com/locate/ecolmodel 1. Introduction A tropical forest naturally regenerates under several constraints such as light interception (Can- ham et al., 1990), treefall gap dynamics (van der Meer et al., 1994) and seed dispersal patterns (van der Pijl, 1982; Ribbens et al., 1994), all of them being crucial for the sylvigenesis (Halle ´ et al., 1978; Richards, 1996; Whitmore, 1998). A firm understanding of all these processes and of their coupling is a challenge for ecology because tropi- cal ecosystems are currently under threat of * Present address: Department of Ecology and Evolutionary Biology, Princeton University, Princeton, NJ 08544, USA. Fax: +33-1-6908-8786. E-mail address: [email protected] (J. Chave) 0304-3800/99/$ - see front matter © 1999 Elsevier Science B.V. All rights reserved. PII:S0304-3800(99)00171-4
Transcript of Study of structural, successional and spatial patterns in ...

Ecological Modelling 124 (1999) 233–254
Study of structural, successional and spatial patterns intropical rain forests using TROLL, a spatially explicit forest
model
Jerome Chave *Ser6ice de Physique de l’Etat Condense, DRECAM CEN Saclay, l’Orme des Merisiers, F-91191 Gif sur Y6ette, France
Accepted 15 June 1999
Abstract
Competition for light, treefall gap formation and recruitment are the critical phenomena in the genesis of tropicalrain forests. These aspects are taken into account to build a new spatially explicit forest growth model called TROLL.Competition for light is modelled by calculating exactly the three-dimensional field of photosynthetically activeradiation in the forest understorey. Typically, 106 light intensities are computed per hectare at each time step. Thislight field controls the growth of each tree and establishment/death events. Seed dispersal, dormancy and establish-ment success as well as a model of treefalls are also included. A special care is paid to the justification and to thevalidation of each of these modules. The TROLL model is parameterized for a Neotropical rain forest in FrenchGuiana using 12 functional groups of species. Using this model the vertical canopy structure and the tree diametricdistribution are investigated. The role of treefalls in maintaining pioneer species is also evidenced. A forest successionscenario is simulated and compared to field data. The model is then used to simulate the recolonization of apreviously sterilized area by a rain forest plant community. This scenario is interpreted using information availablefrom palaeorecords over the Holocene period and their validity is discussed. It is suggested that this model could beused to study mosaic-like patterns in rain forests, installation of slowly dispersing species, speciation hypotheses andlandscape scale dynamics of rain forests. © 1999 Elsevier Science B.V. All rights reserved.
Keywords: Tropical rain forest; Simulation; Individual-based model; Parallel processing; Canopy gaps; Spatial patterns
www.elsevier.com/locate/ecolmodel
1. Introduction
A tropical forest naturally regenerates underseveral constraints such as light interception (Can-
ham et al., 1990), treefall gap dynamics (van derMeer et al., 1994) and seed dispersal patterns (vander Pijl, 1982; Ribbens et al., 1994), all of thembeing crucial for the sylvigenesis (Halle et al.,1978; Richards, 1996; Whitmore, 1998). A firmunderstanding of all these processes and of theircoupling is a challenge for ecology because tropi-cal ecosystems are currently under threat of
* Present address: Department of Ecology and EvolutionaryBiology, Princeton University, Princeton, NJ 08544, USA.Fax: +33-1-6908-8786.
E-mail address: [email protected] (J. Chave)
0304-3800/99/$ - see front matter © 1999 Elsevier Science B.V. All rights reserved.
PII: S 0 3 0 4 -3800 (99 )00171 -4

J. Cha6e / Ecological Modelling 124 (1999) 233–254234
strong anthropogenic disturbances. This rapid de-forestation could in turn have a strong influenceon the global climate of the next century (Phillipset al., 1998). A related issue is to understand howtropical trees communities can have recolonizedlarge areas after the end of the last glacial stage(Servant et al., 1993; Bush, 1994; Schwartz et al.,1996; Charles-Dominique et al., 1998) in order tobetter predict how rain forests could recover ifconservation policies were adopted. Such issuescan be addressed through modelling techniques asit is shown in the present article.
It has long been recognized that the most cru-cial step in the sylvigenetic cycle is the formationof natural canopy openings. This observation hasmotivated the ‘gap model’ approach (Botkin etal., 1972; Shugart, 1984; Prentice and Leemans,1990; Schenk, 1996) where forest patches of size0.1–0.4 ha, (or eco-unit, after Oldeman, 1990)have their own dynamics. KIAMBARAM(Shugart et al., 1980; Shugart, 1984) and FOR-MOSAIC (Liu and Ashton, 1998) are two exam-ples of gap models applied to rain forests. Thegap model approach turns out to give reliableresults for assessing short term scenarios. Never-theless several problems result from thisapproach.
Firstly, it often avoids the mechanistic mod-elling of tree interactions by incorporating com-plicated descriptions of tree growth withinteraction indexes (however, see Kohler andHuth, 1998). The gap size is fixed and thereforesmall-scale light fluctuations (sun flecks) cannotbe modelled, although they are of crucial impor-tance in dense forest understoreys. Moreovertreefalls are not modelled mechanistically butpatches are usually cleared randomly. Secondly,seed dispersal is generally modelled only by as-suming that seeds are always present. Recent fieldwork has shown that seed dispersal limitation iscrucial for maintaining species diversity (Hubbellet al., 1999) thus confirming the winning-by-for-feit scenario (Hurtt and Pacala, 1995). Thirdly,spatial effects are difficult to reproduce sinceneighbouring patches are not interacting in mostgap models. Bossel and Krieger (1994) and Lis-chke et al. (1996) have attempted to resolve thisdifficulty by introducing nearest neighbour
patches interactions. A direct consequence of thislack of spatialization is that gap models mustresort to a sampling over several simulations(Monte-Carlo average) to get statistically signifi-cant results. In the presence of spatial correla-tions, averaging over a statistical sample ofindependent plots smaller than the correlationlength of the system under study is not equivalentto taking one large plot. Here, seed dispersallimitation implies a correlation length greaterthan 100 m. The two-dimensional model ofcanopy crown due to Moravie et al. (1997) shouldbe mentioned as an interesting direction to over-come this problem.
Due to the increasing power of computers it isnow possible to model directly the trees and theirinteractions, avoiding aggregation procedures. Agood example of this approach is the SORTIEmodel (Pacala et al., 1996; Deutschman et al.,1997) in which many important aspects of dy-namic processes in a temperate forest are individ-ually modelled and precisely parameterized(growth, mortality, dissemination). NonethelessSORTIE requires a large number of data to befully parameterized and, except for a few welldocumented plots such as Barro Colorado Island(Panama), Mudumalai (India) or Pasoh(Malaysia), this program is difficult to apply inrain forests. As Vanclay (1995) remarks, ‘Thechallenge is to provide sufficient physiological andecological basis to ensure realistic predictions un-der a variety of sites and stand conditions, evenwhen empirical data for calibration are limited’.Hence we are in the need of simple, mechanistic-based approaches for tropical forests. Moreoverexisting models cannot account for large-scalespatial patterns such as the migrations of plantcommunities observed in palaeorecords since thelast glacial maximum.
In the present work we describe and we useTROLL, a new succession model which attemptsto overcome both difficulties. The sub-models ofcompetition for light, dispersion and treefall gapsare all built on simple mechanistic and physio-logic hypotheses (Section 2). The number ofparameters is reduced as much as possible tomake the parameterization easier (Section 3).Thanks to a powerful parallel computer, large
J. Cha6e / Ecological Modelling 124 (1999) 233–254 235
forest stands are simulated and the Monte-Carlosampling is avoided. TROLL is shown to repro-duce structural (diametric distributions) and suc-cessional patterns of a tropical rain forest with agood agreement. In addition a rain forest invasionis simulated and it is compared to available infor-mation of the forest migrations in the Holoceneperiod. Discussions and perspectives are gatheredin Section 5.
2. Description of the model
TROLL simulates the growth of trees locatedon a study plot of variable size. In one time stepa discrete three-dimensional field (voxel field) ofleaf density is computed, trees are grown or killedin function of the local light availability (or bytreefalls), and the seed bank is updated by thedispersion of seeds produced by fruiting trees. Thedynamics is discrete in time and the time step isfixed to 1 year. This choice is easily generalized toshorter time steps which should be taken whenmodelling seasonal effects such as rainfall fluctua-tions. In the present work, we assume a constantclimate (temperature, rainfall, duration of the dry
period), therefore a time discretisation into stepsof 1 year provides a detailed enough descriptionof the dynamics.
Only woody plants of more than 1 cm diameterat breast height (dbh) are considered. Due tospace exclusion of stems and root systems, aminimal surface is necessary for a tree to survive.This fixes a minimal nearest neighbour distancewhich is called l. In this study the value l=1 mwas taken. The maximal stem number is therefore10 000 stems per hectare, which is roughly twicemore than those counted in field studies (Hubbelland Foster, 1990; Condit, 1995b). The study areais discretised into squares of edge l in which onlyone tree can grow. This assumption saves com-puter memory and avoids population blow-ups.
2.1. Tree description
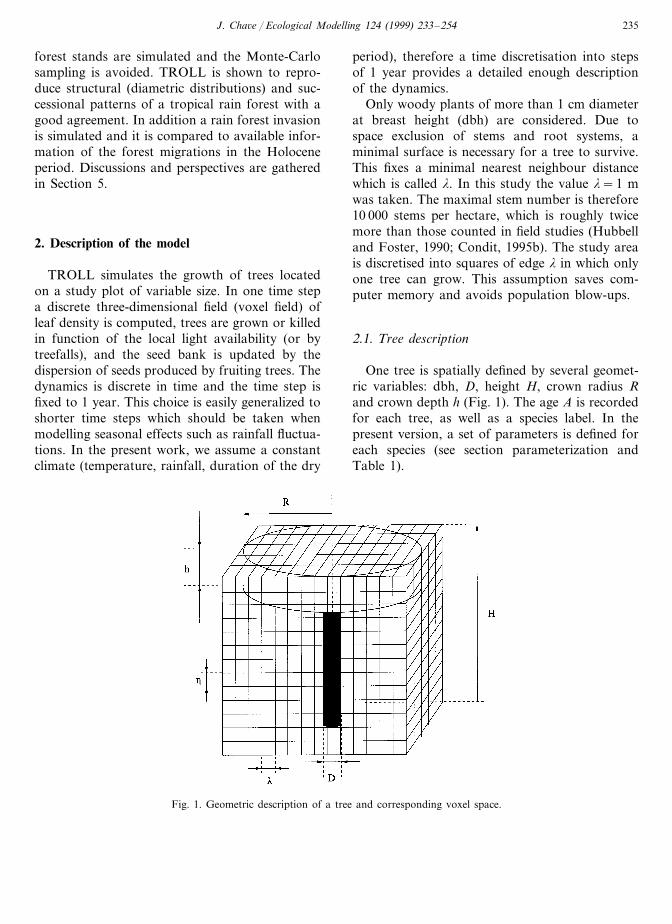
One tree is spatially defined by several geomet-ric variables: dbh, D, height H, crown radius Rand crown depth h (Fig. 1). The age A is recordedfor each tree, as well as a species label. In thepresent version, a set of parameters is defined foreach species (see section parameterization andTable 1).
Fig. 1. Geometric description of a tree and corresponding voxel space.

J. Cha6e / Ecological Modelling 124 (1999) 233–254236
Table 1Average species parameters
Value
Geometric parameters1 cmD0 Initial dbh
Dmax 150 cm Maximal dbh
H0 Initial tree height1 mHmax 40 m Maximal tree height
SH 150 Initial H/D ratioInitial crown radius0.5 mR0
7.0SR (Crown radius/dbh) slopeInitial crown depth0.5 mh0
0.1Sh (Crown depth/tree height) slope
Growth parametersGrowth rate5 mm year−1g
3 m2/m3D Leaf densityMinimal p.n.a.P0 0.2Minimal light level10−2fc
1% per yearM Mortality rateHc Critical crown depth (see text)1 m
Mechanical parameters2000C0 Average of Cc
C1 0.3C0 Variance of Cc
Fruiting/dispersion parametersMaturation ageAm 10 yearsFruiting periodicity1 yearTf
Ns Potential seedlings per year30 seeds year−1
Dispersal distancer 40 m
1983; Moravie et al., 1997). Neither ecological northeoretical arguments can provide a firm justifica-tion for the choice of one of these models. Fur-thermore, the quantitative difference betweenthese curves is much smaller than the uncertaintyon field measurements. Finally, no severe differ-ence for these various choices are observed insimulation results. The hyperbolic law was usedbecause it does not involve any transcendentfunction
1H(D)
=1
Hmax
+1sH
Dmax−DD
(2.2)
sH is the slope of the curve H(D) around D=0.Gazel (1983) gives Hmax=49 m, and sH=196 fora forest stand of French Guiana. Maximal treeheights range from 2 to 60 m depending on thespecies. Most rainforest trees have a flat crownarchitecture of the Troll type (Halle et al., 1978),probably due to their strategy of optimal lightinterception. Therefore, we assume that h�Hand we take
h(H)=h0+shH (2.3)
h0 and sh being new parameters. We are thereforeleft with only one variable, D, and simple rela-tionships (2.1), (2.2) and (2.3) relating D to theother geometric variables of the tree.
2.2. Light a6ailability
The computation of light availability is a criti-cal step in TROLL since recruitment is mainlylimited in the understorey by the fraction of thephotosynthetically active radiation (p.a.r.).
Computing the local light level is all the moreso complex because rain forest architecture ishighly heterogeneous. A three-dimensional de-scription of the light is proposed. The stand isdiscretised into volume cells, or 6oxels (Fig. 1), inwhich the leaf density is computed. In this ap-proach light competition is not modelled via com-petition indices, but rather through the effectivelocal light availability. If one wished to inspectevery possible interaction among crowns directlyone would have to perform more than 600 opera-tions per tree. In TROLL the light field is com-puted first. Then this field is used in the tree
The dbh D is the natural quantity availablefrom field datasets. It is thus chosen in mostindividual based models as the basic descriptor ofthe tree growth. The dbh at age 0, D0 is fixed at 1cm. Other quantities should be related to Dthrough simple relationships. As proposed byRollet (1973) a linear crown radius–dbh relation-ship is chosen
R(D)=R0+aRD (2.1)
Parameters R0 and aR are species-dependent andare obtained from field data. The height–diameterrelationship is widely documented for variousforest types. Amongst the most used relationshipsare the quadratic law (Shugart, 1984) the expo-nential law (Prentice and Leemans, 1990; Pacalaet al., 1996), the hyperbolic law (Kira, 1978;Gazel, 1983) and the power law (Lescure et al.,

J. Cha6e / Ecological Modelling 124 (1999) 233–254 237
growth sub-model. This requires about 100 timesless operations per tree than in the first method.
The basal area of each voxel is l2 so that thevoxel space corresponds to the discretisation ofthe study area. However, the voxel height h is notnecessarily equal to l : vertical and horizontaldiscretisations are independent. It is suitable totake h lower than the minimal crown depth h0. Aleaf density d (leaf area per cubic meter) is definedfor each species and measures the effective lightinterception capacity of a leaf layer. Field valuesgive typically from 0.5 to 5 m2 m−3 (Ashton,1978) with a sharp decrease of the leaf densitybelow the top of the crown. The effective leafdensity d(z) at a distance 0BzBh below the topof the crown is simply modelled by an exponentialrelation (Fig. 2)
d(z)=d. exp�
−zhc
�(2.4)
where hc is the critical crown depth and is to becompared to the maximal crown depth as definedin (2.3).
Let d(x,y,z) be the sum of all the leaf densitiesfor the trees found in the voxel of label (x,y,z).The leaf area index (l.a.i.) at point (x,y) integratedup to height z, L(x,y,z). is thus simply defined by
L(x,y,z)= %Hmax
z%=z
d(x,y,z %) (2.5)
Assuming a Beer–Lambert extinction law onefinds that the light flux F(x,y,z) available justabove the cell (x,y,z) is
F(x,y,z)=Fac exp [−k(L(x,y,z)−d)] (2.6)
F is usually measured in moles of photons persecond per square meter. An average value of theabove canopy flux is Fac=2200 mmol s−1 per m2.For the sake of simplicity it is normalised toFac=1. k is the absorption rate per unit leafdensity (0.65k51.0). This definition embodiesthe description of crown interactions. F(x,y,z) isused to compute trees light availability in thestand. Assume that (x,y,z) is a voxel in the crownof a given tree. If the tree fills the voxel alone thend(x,y,z)=d so that there is no self-shading. How-ever if two or more trees fill this cell thend(x,y,z)\d. In this latter case each tree sees alower light intensity, therefore yielding a two-sided light competition. The average p.a.r. f in-tercepted by a tree is computed on a tree withtrunk located a point (x,y) from the field F, asshown in Fig. 2.
f(x,y)=1
pR2 %(x%−x)2+ (y%−y)2BR 2
F(x %,y %,H) (2.7)
so that 05f(x,y)51.
Fig. 2. Left: competition for light between trees. Complex shading patterns are shown. Right: light interception of the flux F andinteraction with another crown (dashed). This crown lowers the flux f intercepted by the tree. The leaf density decrease below thetop of the crown (2.4) is also illustrated.
J. Cha6e / Ecological Modelling 124 (1999) 233–254238
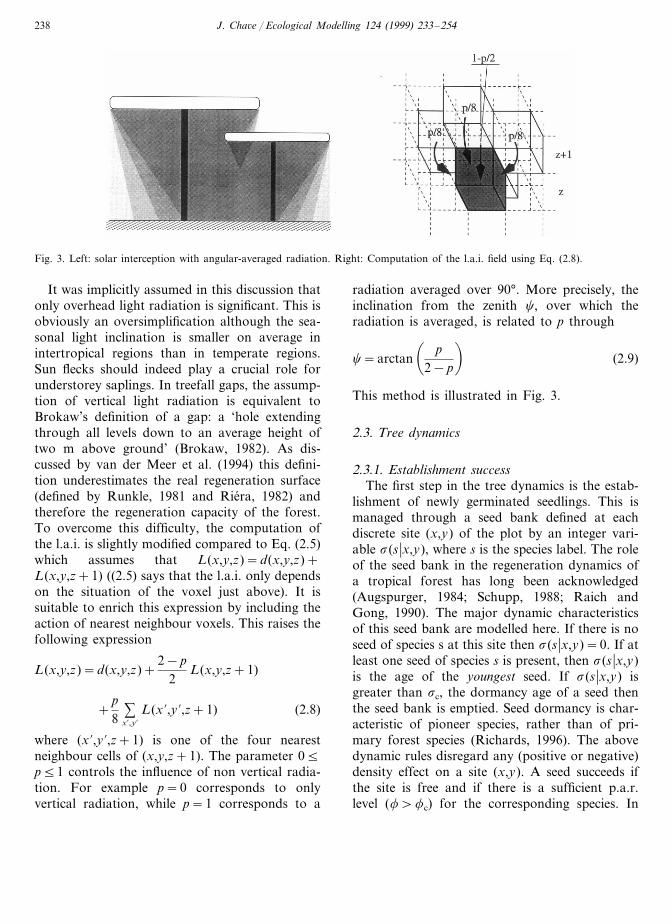
Fig. 3. Left: solar interception with angular-averaged radiation. Right: Computation of the l.a.i. field using Eq. (2.8).
It was implicitly assumed in this discussion thatonly overhead light radiation is significant. This isobviously an oversimplification although the sea-sonal light inclination is smaller on average inintertropical regions than in temperate regions.Sun flecks should indeed play a crucial role forunderstorey saplings. In treefall gaps, the assump-tion of vertical light radiation is equivalent toBrokaw’s definition of a gap: a ‘hole extendingthrough all levels down to an average height oftwo m above ground’ (Brokaw, 1982). As dis-cussed by van der Meer et al. (1994) this defini-tion underestimates the real regeneration surface(defined by Runkle, 1981 and Riera, 1982) andtherefore the regeneration capacity of the forest.To overcome this difficulty, the computation ofthe l.a.i. is slightly modified compared to Eq. (2.5)which assumes that L(x,y,z)=d(x,y,z)+L(x,y,z+1) ((2.5) says that the l.a.i. only dependson the situation of the voxel just above). It issuitable to enrich this expression by including theaction of nearest neighbour voxels. This raises thefollowing expression
L(x,y,z)=d(x,y,z)+2−p
2L(x,y,z+1)
+p8
%x%,y%
L(x %,y %,z+1) (2.8)
where (x %,y %,z+1) is one of the four nearestneighbour cells of (x,y,z+1). The parameter 05p51 controls the influence of non vertical radia-tion. For example p=0 corresponds to onlyvertical radiation, while p=1 corresponds to a
radiation averaged over 90°. More precisely, theinclination from the zenith c, over which theradiation is averaged, is related to p through
c=arctan� p
2−p�
(2.9)
This method is illustrated in Fig. 3.
2.3. Tree dynamics
2.3.1. Establishment successThe first step in the tree dynamics is the estab-
lishment of newly germinated seedlings. This ismanaged through a seed bank defined at eachdiscrete site (x,y) of the plot by an integer vari-able s(s �x,y), where s is the species label. The roleof the seed bank in the regeneration dynamics ofa tropical forest has long been acknowledged(Augspurger, 1984; Schupp, 1988; Raich andGong, 1990). The major dynamic characteristicsof this seed bank are modelled here. If there is noseed of species s at this site then s(s �x,y)=0. If atleast one seed of species s is present, then s(s �x,y)is the age of the youngest seed. If s(s �x,y) isgreater than sc, the dormancy age of a seed thenthe seed bank is emptied. Seed dormancy is char-acteristic of pioneer species, rather than of pri-mary forest species (Richards, 1996). The abovedynamic rules disregard any (positive or negative)density effect on a site (x,y). A seed succeeds ifthe site is free and if there is a sufficient p.a.r.level (f\fc) for the corresponding species. In

J. Cha6e / Ecological Modelling 124 (1999) 233–254 239
this case, the seedling must grow up to the mini-mal dbh of 1 cm before being taken into account.The mortality rate is usually very high in the earlylife of trees and this assumption simplifies a lotthe model. Several distinct biological phenomena(seed banks, seed dormancy, germination, earlyage growth), which all contribute to recruitment,are thus considered together in the establishmentstage. The residence time in this early life stagecould be very long especially for understorey spe-cies and therefore this residence time is introducedin the model.
If more than one species has seeds on the samesite, the winning species is chosen at randomamong the possible ones. This does not mean thatall species have the same recruitment rate since astrong competition occurs among trees in theirearly years. The recruitment rate is therefore con-trolled by environmental conditions.
2.3.2. GrowthThe dynamics of a tree is related to the p.a.r.
availability f through the carbon potential netassimilation (p.n.a.) P. Typically, for C3 plants,the p.n.a. saturates around Pmax=25 mmol s−1
per m2 for f\2000 mmol s−1 per m2 with somedifferences between pioneer and climax species.Here, P is adimensionned so that Pmax=1. P andf are usually related by the Monod law
P(f)=f−fc
f+fc/P0
(2.10)
P0 is the net respiration loss. fc is the compensa-tion flux, that is the minimal light flux such thatthe photosynthetic fixation balances the photores-piration. fc is roughly related to the maximalvalue of the l.a.i., through fc#exp(−kLmax). Atypical value of fc ranges from 1 to 3%, andP0#0.2. Note that values PB0 are possible cor-responding to a tree below the compensationpoint (fBfc) or with a strong water deficit. Asmuch as 12% of trees above 30 cm dbh can havenegative size increments (Swaine et al., 1987a).The survival probability of such trees is very low(see below).
P(f) is the net increment per unit time and perleaf area of the total biomass B. A very simpledbh growth equation was used
dDdt
=P(f)g�
1−D
Dmax
�(2.11)
where g is the dbh growth rate. This equation is avery good approximation of more complicatedequations as long as the extreme values of D arenot reached. Several other equations were testedin the form D %(t)=D(t)a(1−D(t)b) but they didnot yield a markedly different behaviour for a=0, 1 and b=1,2,3.
2.3.3. DeathThe mortality is a probabilistic event related to
the same external conditions as those ruling thegrowth, that is light availability. A simple way ofaccounting these environmental factors is to cor-relate the death rate m to the potential net assim-ilation P. Practically, a random variable m
distributed uniformly on [0, 1] is compared to thethreshold
meff=m− (P+P0)/(1+P0) (2.12)
where m is the residual mortality rate. A tree dieswith probability m if P is maximal (i.e. P=1).The tree dies if mBmeff. As expected meff�1 asP�−P0 and therefore a tree dies with a highprobability as the minimal p.n.a. is reached. Asimilar growth-dependent mortality rule was pro-posed for the SORTIE model (Pacala et al., 1996)and for the FORMIND model (Kohler and Huth,1998) but the possibility of negative increments(PB0) was not taken into account. Anothercause of mortality is the phenomenon of treefallsthe discussion of which is postponed to Section2.5.
2.4. Seed dispersal
Fruiting strategies are highly variable in rainforests (Howe, 1983; Sabatier, 1985). Some specieshave periodic fruiting, others fruit only after ex-ternal shocks such as a very dry season or in thesenescent stage. Some species produce seeds onlyonce in their lifespan, usually just before dying(monocarpic species). Finally, some species seemto present erratic fruiting patterns. To modelthese strategies, it is convenient to define somefundamental parameters such as the age of sexualmaturity Am, the fruiting periodicity Tf, the aver-

J. Cha6e / Ecological Modelling 124 (1999) 233–254240
age number of produced seeds Ns and a probabil-ity distribution function for the dispersion length.These parameters are discussed below.
The maturity age Am is discussed in Liebermanet al. (1985b). From their data, it is possible toestimate the time to grow from 1 cm dbh to thedbh at maturity, using the maximal estimated dbhincrement. This yields a maturation age between20 and 100 years which is only a rough estimateof Am. Pioneer species can produce seeds at ayounger age while some understorey species canwait more than 100 years before entering themature stage (Charles-Dominique et al., in prepa-ration). It was observed that fruiting events areseasonally correlated in some rain forests (Sa-batier, 1985). Thus most trees fruit at least once ayear (Tf=1). However, this is far from being astrong rule.
Each mature tree produces a number of seedswhich are dispersed in the neighbourhood, bydifferent mechanisms (Charles-Dominique et al.,1981; Van der Pijl, 1982; Augspurger, 1984; vanRoosmalen, 1985; Ribbens et al., 1994). The num-ber of seeds per fruiting Ns varies from very fewfor understorey species to a huge number forpioneer species: for the pioneer Cecropia sp., asmuch as 10 seeds m−2 per day are dispersed bybats. The seed bank sub-model of TROLL as-sumes one seed per species and per space unit, theyoungest one, since at most one tree can establishon this space unit. Ns is in fact the number ofpotentially established seedlings rather than thenumber of produced seeds. Therefore, field valuesshould be lowered and Ns is in the range 1–100 inpractice (one tree produces at most 100 offspringsper time step).
The average dissemination length from the par-ent tree is r+R, where r is the unique parameterhere (R is the crown radius). The probability of aseed to be transported at the distance r from itsparent tree follows a Gaussian distribution. Theangle of dissemination is drawn uniformly be-tween 0 and 2p. In two dimensions, the probabil-ity density for the distance r is
Proba(r)=2r
(r+R)2 exp�
−r2
(r+R)2
�(2.13)
This choice is the simplest and the most natural.Indeed, the Central Limit Theorem insures thatthe Gaussian law becomes asymptotically validfor a large number of trials. Moreover rain forestsare characterized by the low number of speciesdisseminating their seeds by the wind (anemo-chorous transport) compared to small distancedissemination modes (zoochorous or autochoroustransport). Actually more than 80% of Neotropi-cal species are dispersed by animals (Estrada andFleming, 1986). Although zoochorous dispersalcan create rare events of an exceptional length, itis commonly assumed that the a6erage dissemina-tion length r is rarely more than 40 m (Dalling etal., 1998, reported a significant decrease for allspecies types beyond values of 30–60 m). For thedistribution (2.13), 99% of the seeds fall at adistance less than 2.14(r+R) of the parent tree.
To model long distance dispersion modes, anonlocal, density-dependent effect is also consid-ered. The total number of mature trees of a givenspecies is computed. The number of non-locallydispersed seeds is then proportional to the num-ber of mature trees. These seeds are distributedrandomly on the environment with no distancelimitation. Both modes of dispersion are used toupdate the seed field s(s �x,y).
2.5. Treefalls
Treefalls are basically due to the falling of onetree but they can involve a large number of treesand they can cause strong perturbations locally(van der Meer et al., 1994). A simple method todescribe treefall events consists in felling a tree atrandom. This method reproduces quite well ob-served statistics but it hides the basic mechanismsat their origin. Living trees can fall for at leastthree reasons. First, they are destabilized by theirown architecture or because their roots are notwell held (structural treefall). For example, theycan be affected by wet soils (which loosen thehold of roots) and by steep slopes. Second, neigh-bouring trees may exert a destabilizing mechanicalforce (induced treefall). Third, they may be up-rooted by a strong and sudden climatic perturba-tion like a storm, a hurricane or a landslide(external treefall). Felling a tree at random is
J. Cha6e / Ecological Modelling 124 (1999) 233–254 241
equivalent to considering only the first cause oftreefall. Here, a sub-model is developed whichencompasses the influence of neighbouring treesand takes into account climatic perturbations.
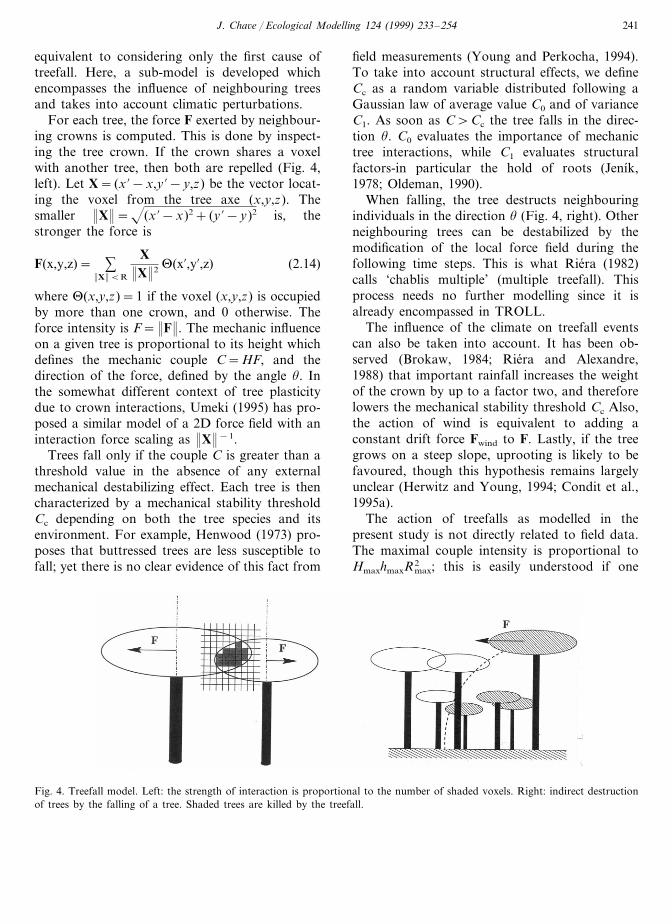
For each tree, the force F exerted by neighbour-ing crowns is computed. This is done by inspect-ing the tree crown. If the crown shares a voxelwith another tree, then both are repelled (Fig. 4,left). Let X= (x %−x,y %−y,z) be the vector locat-ing the voxel from the tree axe (x,y,z). Thesmaller X =(x %−x)2+ (y %−y)2 is, thestronger the force is
F(x,y,z)= % X BR
X X 2 U(x%,y%,z) (2.14)
where U(x,y,z)=1 if the voxel (x,y,z) is occupiedby more than one crown, and 0 otherwise. Theforce intensity is F= F . The mechanic influenceon a given tree is proportional to its height whichdefines the mechanic couple C=HF, and thedirection of the force, defined by the angle u. Inthe somewhat different context of tree plasticitydue to crown interactions, Umeki (1995) has pro-posed a similar model of a 2D force field with aninteraction force scaling as X −1.
Trees fall only if the couple C is greater than athreshold value in the absence of any externalmechanical destabilizing effect. Each tree is thencharacterized by a mechanical stability thresholdCc depending on both the tree species and itsenvironment. For example, Henwood (1973) pro-poses that buttressed trees are less susceptible tofall; yet there is no clear evidence of this fact from
field measurements (Young and Perkocha, 1994).To take into account structural effects, we defineCc as a random variable distributed following aGaussian law of average value C0 and of varianceC1. As soon as C\Cc the tree falls in the direc-tion u. C0 evaluates the importance of mechanictree interactions, while C1 evaluates structuralfactors-in particular the hold of roots (Jenık,1978; Oldeman, 1990).
When falling, the tree destructs neighbouringindividuals in the direction u (Fig. 4, right). Otherneighbouring trees can be destabilized by themodification of the local force field during thefollowing time steps. This is what Riera (1982)calls ‘chablis multiple’ (multiple treefall). Thisprocess needs no further modelling since it isalready encompassed in TROLL.
The influence of the climate on treefall eventscan also be taken into account. It has been ob-served (Brokaw, 1984; Riera and Alexandre,1988) that important rainfall increases the weightof the crown by up to a factor two, and thereforelowers the mechanical stability threshold Cc Also,the action of wind is equivalent to adding aconstant drift force Fwind to F. Lastly, if the treegrows on a steep slope, uprooting is likely to befavoured, though this hypothesis remains largelyunclear (Herwitz and Young, 1994; Condit et al.,1995a).
The action of treefalls as modelled in thepresent study is not directly related to field data.The maximal couple intensity is proportional toHmaxhmaxR2
max; this is easily understood if one
Fig. 4. Treefall model. Left: the strength of interaction is proportional to the number of shaded voxels. Right: indirect destructionof trees by the falling of a tree. Shaded trees are killed by the treefall.
J. Cha6e / Ecological Modelling 124 (1999) 233–254242
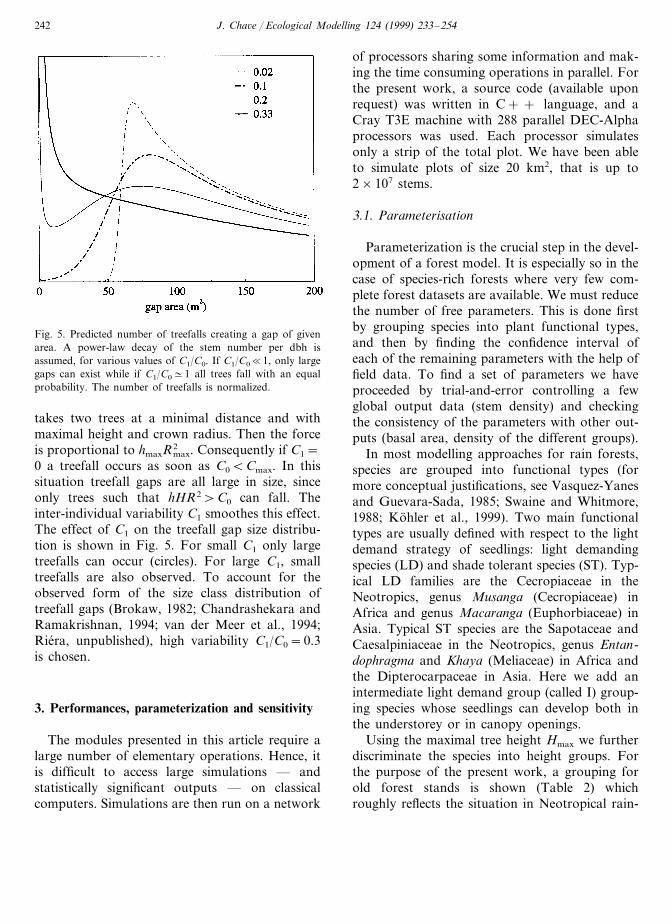
Fig. 5. Predicted number of treefalls creating a gap of givenarea. A power-law decay of the stem number per dbh isassumed, for various values of C1/C0. If C1/C0�1, only largegaps can exist while if C1/C0#1 all trees fall with an equalprobability. The number of treefalls is normalized.
of processors sharing some information and mak-ing the time consuming operations in parallel. Forthe present work, a source code (available uponrequest) was written in C+ + language, and aCray T3E machine with 288 parallel DEC-Alphaprocessors was used. Each processor simulatesonly a strip of the total plot. We have been ableto simulate plots of size 20 km2, that is up to2×107 stems.
3.1. Parameterisation
Parameterization is the crucial step in the devel-opment of a forest model. It is especially so in thecase of species-rich forests where very few com-plete forest datasets are available. We must reducethe number of free parameters. This is done firstby grouping species into plant functional types,and then by finding the confidence interval ofeach of the remaining parameters with the help offield data. To find a set of parameters we haveproceeded by trial-and-error controlling a fewglobal output data (stem density) and checkingthe consistency of the parameters with other out-puts (basal area, density of the different groups).
In most modelling approaches for rain forests,species are grouped into functional types (formore conceptual justifications, see Vasquez-Yanesand Guevara-Sada, 1985; Swaine and Whitmore,1988; Kohler et al., 1999). Two main functionaltypes are usually defined with respect to the lightdemand strategy of seedlings: light demandingspecies (LD) and shade tolerant species (ST). Typ-ical LD families are the Cecropiaceae in theNeotropics, genus Musanga (Cecropiaceae) inAfrica and genus Macaranga (Euphorbiaceae) inAsia. Typical ST species are the Sapotaceae andCaesalpiniaceae in the Neotropics, genus Entan-dophragma and Khaya (Meliaceae) in Africa andthe Dipterocarpaceae in Asia. Here we add anintermediate light demand group (called I) group-ing species whose seedlings can develop both inthe understorey or in canopy openings.
Using the maximal tree height Hmax we furtherdiscriminate the species into height groups. Forthe purpose of the present work, a grouping forold forest stands is shown (Table 2) whichroughly reflects the situation in Neotropical rain-
takes two trees at a minimal distance and withmaximal height and crown radius. Then the forceis proportional to hmaxR
2max. Consequently if C1=
0 a treefall occurs as soon as C0BCmax. In thissituation treefall gaps are all large in size, sinceonly trees such that hHR2\C0 can fall. Theinter-individual variability C1 smoothes this effect.The effect of C1 on the treefall gap size distribu-tion is shown in Fig. 5. For small C1 only largetreefalls can occur (circles). For large C1, smalltreefalls are also observed. To account for theobserved form of the size class distribution oftreefall gaps (Brokaw, 1982; Chandrashekara andRamakrishnan, 1994; van der Meer et al., 1994;Riera, unpublished), high variability C1/C0=0.3is chosen.
3. Performances, parameterization and sensitivity
The modules presented in this article require alarge number of elementary operations. Hence, itis difficult to access large simulations — andstatistically significant outputs — on classicalcomputers. Simulations are then run on a network

J.C
ha6e/
Ecological
Modelling
124(1999)
233–
254243
Table 2Main parameters for the species grouping in French Guiana
Species Am (year) Ns r (m) g (mm yr−1)Species typea Dmax (m)L.a.i.c max Hmax (m) Rmax (m)P.n.a. min M(% per year)numberb
150 60 2.24 0.074.8 50.08 1.7621LD1 4 5120 50LD2 4104 0.2 15 3.54.8 0.08 2.5 10105 40 6.4 0.4 2515 6.12LD3 52 5 0.08
75 40 9.6 0.6 40LD4 7.744 5 0.1 2 2060 40 1.76 0.1 512 2.1I1 2.20.12613
72 20 50 40 2.46 0.22 14 3.585.8 0.12I2 1.440 40 4.48 0.4 2325 5.3I3 1.40.125.68324 40 8.96 0.8 40I4 6.996 6.4 0.12 1.4 4032 20 3.36 0.3 520 5.3ST1 1.40.22815116ST2 20148 4.8 0.5 15 7.57 0.2 1.2 3010 20 7.2 0.9 2540 11.31ST3 116 7 0.2
8ST4 20122 9.6 1.2 50 10.17 0.2 1 50
a LD, light demanding; I, intermediate; ST, shade tolerant.b Number of species in each group for the French Guiana rain forest.c L.a.i. max. is related to the minimal light availability fc through fc#exp(−kLmax) and the minimal p.n.a. is noted P0 in the text.
J. Cha6e / Ecological Modelling 124 (1999) 233–254244
forests of French Guiana where the light demandtype and maximal height have been collected formore than 1000 tree species (Chave et al., inpreparation).
The present species grouping uses three lightdemand types (LD, I and ST) and four heightclasses (0–5 m, 6–15 m, 15–25 m and 25–50 m)as shown in Table 2.
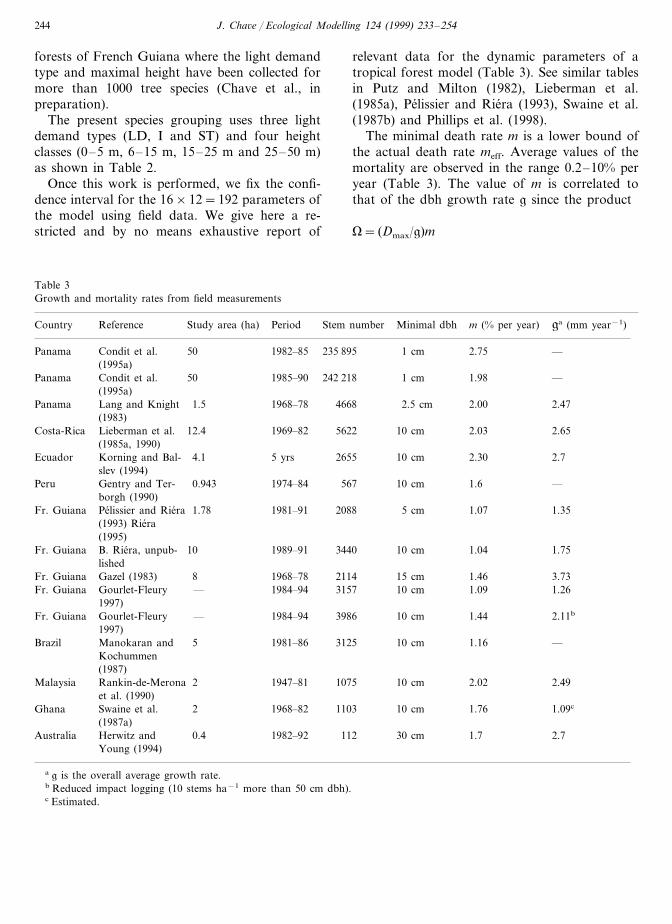
Once this work is performed, we fix the confi-dence interval for the 16×12=192 parameters ofthe model using field data. We give here a re-stricted and by no means exhaustive report of
relevant data for the dynamic parameters of atropical forest model (Table 3). See similar tablesin Putz and Milton (1982), Lieberman et al.(1985a), Pelissier and Riera (1993), Swaine et al.(1987b) and Phillips et al. (1998).
The minimal death rate m is a lower bound ofthe actual death rate meff. Average values of themortality are observed in the range 0.2–10% peryear (Table 3). The value of m is correlated tothat of the dbh growth rate g since the product
V= (Dmax/g)m
Table 3Growth and mortality rates from field measurements
Country Reference ga (mm year−1)Study area (ha) m (% per year)Minimal dbhStem numberPeriod
Condit et al. 2.75 —50 1982–85 235 895Panama 1 cm(1995a)
1 cm 1.98 —Panama Condit et al. 50 1985–90 242 218(1995a)Lang and Knight 2.00 2.471.5 1968–78 4668Panama 2.5 cm(1983)
2.65Costa-Rica 2.0310 cm56221969–8212.4Lieberman et al.(1985a, 1990)
26555 yrs4.1 2.30Korning and Bal-Ecuador 2.710 cmslev (1994)Gentry and Ter- —0.943 1974–84Peru 567 10 cm 1.6borgh (1990)
1.351.075 cm20881981–91Fr. Guiana 1.78Pelissier and Riera(1993) Riera(1995)B. Riera, unpub- 344010Fr. Guiana 1989–91 1.751.0410 cmlished
1.46 3.73Fr. Guiana Gazel (1983) 8 1968–78 2114 15 cm31571984–94 1.26— 10 cmGourlet-FleuryFr. Guiana 1.09
1997)10 cmFr. Guiana Gourlet-Fleury 1.44— 2.11b1984–94 3986
1997)3125 —1.1610 cm5 1981–86Brazil Manokaran and
Kochummen(1987)Rankin-de-Merona 10752Malaysia 2.491947–81 2.0210 cmet al. (1990)
1.09cGhana Swaine et al. 2 1968–82 1103 10 cm 1.76(1987a)
Australia 2.7Herwitz and 0.4 1982–92 112 30 cm 1.7Young (1994)
a g is the overall average growth rate.b Reduced impact logging (10 stems ha−1 more than 50 cm dbh).c Estimated.

J. Cha6e / Ecological Modelling 124 (1999) 233–254 245
should be roughly constant. Otherwise, TROLLwould overestimate the number of large trees inthe case V�1 or only small trees with D�Dmax
in the case V�1. Both situations should beavoided and the lifespan of a tree is related to itsgrowth time. Thus higher dbh growth rates corre-spond to higher mortality rates. It is observed thatg shows a large interspecific variability (from 0.3to 15 mm year−1 on average) and a size depen-dence. This is evidenced on average growth rateswhich are systematically higher when small indi-viduals are discarded. For trees below 5 cm dbh,one has gB1 mm year−1, while for trees above30 cm dbh, g is often more than 5 mm year−1
(with a decrease in the senescent stage). Thisobservation is consistent with the criterion V�1.In practice, the optimal growth rate g — that iswithout the limiting effect of shading — is takenin the range 1–20 mm year−1.
These data are used to construct a first dataset.Then, a series of runs are performed to scan theallowed region of the parameter space. The lists ofparameters raising compatible results in terms ofnumber of trees above 1, 10 and 30 cm, and interms of basal area are kept. The classically re-ported field data for the total basal area areusually between 25 and 65 m2 ha−1. Theystrongly depend on the number of large trees inthe stand. The number of large trees per hectare isalso frequently reported since it is quite easy tomeasure in the field. The number of trees above10 cm dbh ranges usually between 400 and 700stems ha−1 and the number of stems above 30 cmdbh ranges between 60 and 150 stems ha−1. Themortality rate is roughly of 1% per year (treesabove 10 cm dbh) half of which is due to treefalls.Table 2 is one of these lists.
3.2. Sensiti6ity analysis
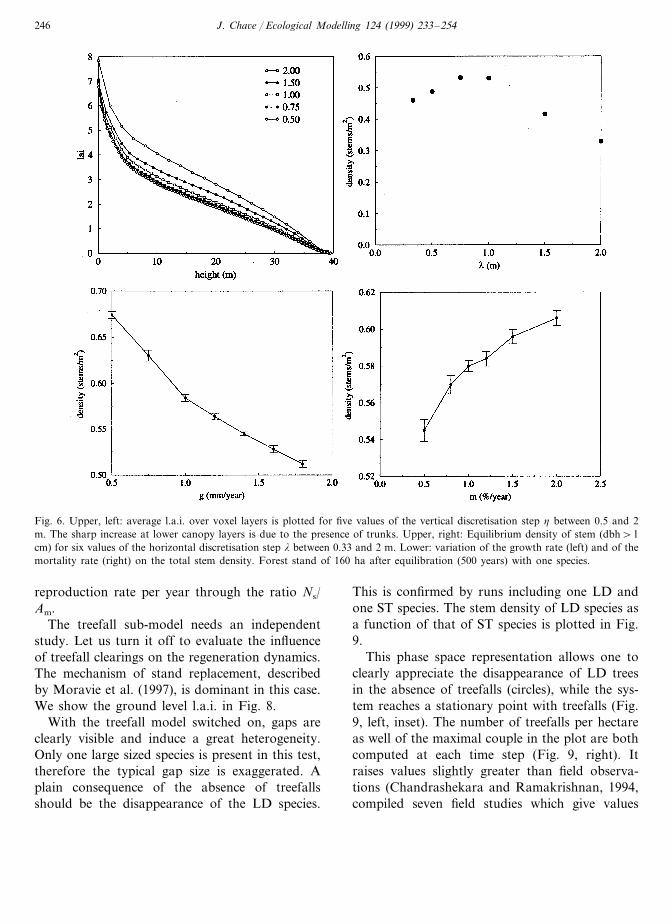
A preliminary set of runs was performed to testthe different modules of the code. A special carewas taken in quantifying the influence of lightfield discretisation in both horizontal and verticaldirections. Figure 6 (upper, left) shows the effectof varying the vertical step h on the average l.a.i.at various heights above the ground. The use of afiner mesh grid increases the quality of the result,
especially for lower canopy layers. However thecomputation time increases too.
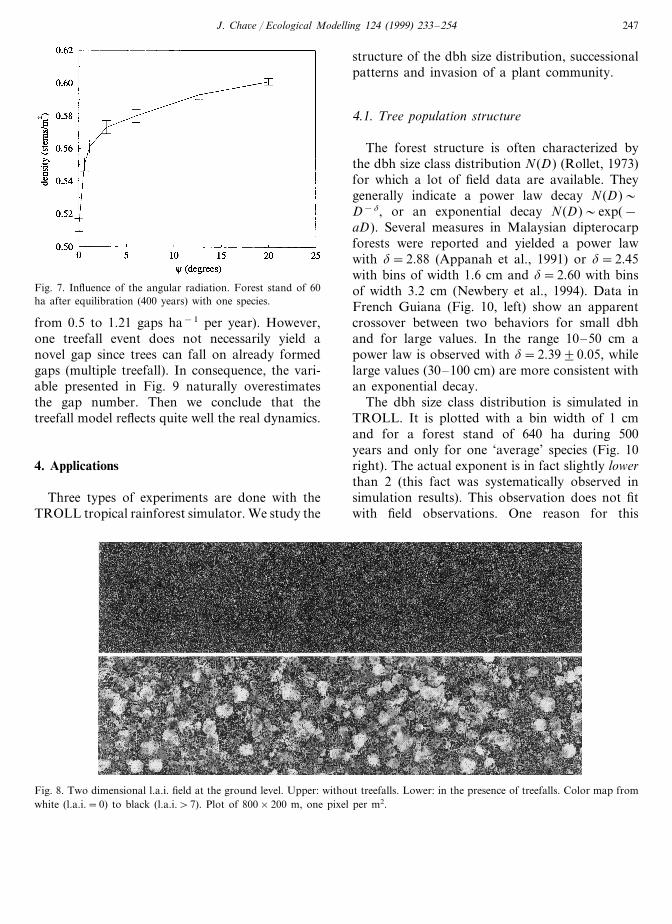
Figure 6 (upper, right), one observes that thedynamics of TROLL is not drastically modifiedby the variation of the horizontal mesh grid l.The stem density decreases at small l due tosmall-scale treefalls. Conversely, large l valuesyield larger discretisation errors which also de-crease the stem density. It is thus reasonable topreserve l=1 m. age as well as the seed produc-tion are therefore tuned quit precisely in Table 2for example. The influence of non vertical lightincidence was also tested. The result on the den-sity of stems above 1 cm dbh is given as afunction of the maximal light incidence angle(Fig. 7).
A singular behavior is observed for c#0 (seeEq. (2.9)); the stem density scales approximatelyas c1/4). However, the non-equilibrium dynamicsis not modified and choosing c\0 results merelyin shifting the stem density upwards.
As pointed out by Vanclay and Skovsgaard(1997), validating each module of a forest growthmodel is not sufficient. Even simplified guidelinesuch as analytic solutions is not available. In allthe tests we prepared an equilibrium state andthen we varied some parameters in order to con-trol the resilience of this equilibrium. Startingwith one species group from the average valuespresented on Table 1, the parameters were inde-pendently varied. The results of these tests are notreproduced here, but the variation of the stemdensity with growth rate g and the mortality ratem (Fig. 6) are shown. Figure 6 supports theconsistency requirement V�1 since increasing g
looks equivalent as decreasing m. Increasing themortality increases the stem density because itfavours the establishment of a large number ofyoung trees.
It is observed in these runs that the resultssmoothly depend on the growth/death parametersand on the geometric parameters (maximal height,maximal dbh, …). We have also observed that theresults are very sensitive to the parameters of theregeneration module. This is not surprising be-cause regeneration is the crucial step in the main-taining of a species group. The age of maturationand the seed production both control the maximal
J. Cha6e / Ecological Modelling 124 (1999) 233–254246
Fig. 6. Upper, left: average l.a.i. over voxel layers is plotted for five values of the vertical discretisation step h between 0.5 and 2m. The sharp increase at lower canopy layers is due to the presence of trunks. Upper, right: Equilibrium density of stem (dbh\1cm) for six values of the horizontal discretisation step l between 0.33 and 2 m. Lower: variation of the growth rate (left) and of themortality rate (right) on the total stem density. Forest stand of 160 ha after equilibration (500 years) with one species.
reproduction rate per year through the ratio Ns/Am.
The treefall sub-model needs an independentstudy. Let us turn it off to evaluate the influenceof treefall clearings on the regeneration dynamics.The mechanism of stand replacement, describedby Moravie et al. (1997), is dominant in this case.We show the ground level l.a.i. in Fig. 8.
With the treefall model switched on, gaps areclearly visible and induce a great heterogeneity.Only one large sized species is present in this test,therefore the typical gap size is exaggerated. Aplain consequence of the absence of treefallsshould be the disappearance of the LD species.
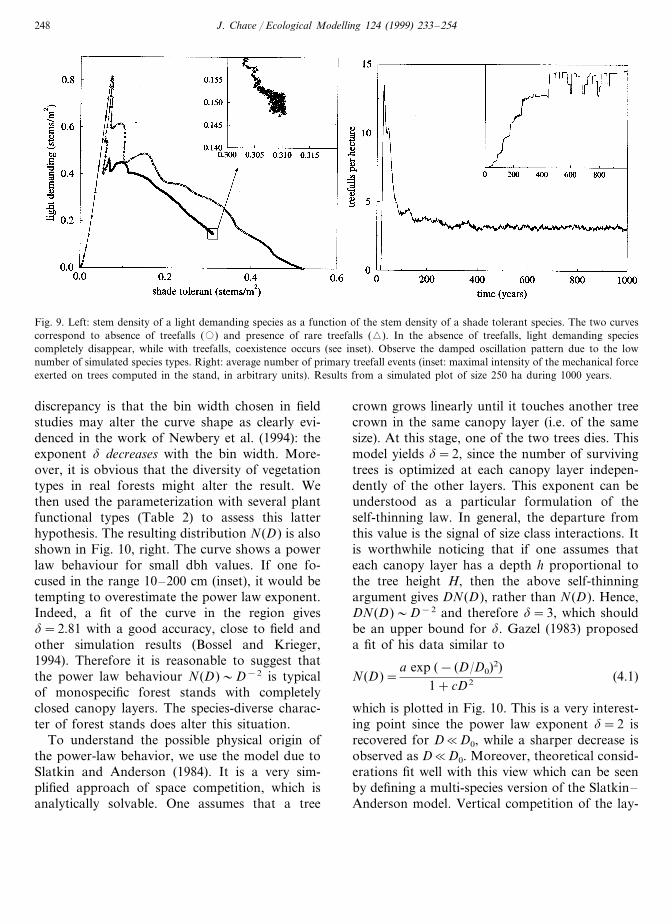
This is confirmed by runs including one LD andone ST species. The stem density of LD species asa function of that of ST species is plotted in Fig.9.
This phase space representation allows one toclearly appreciate the disappearance of LD treesin the absence of treefalls (circles), while the sys-tem reaches a stationary point with treefalls (Fig.9, left, inset). The number of treefalls per hectareas well of the maximal couple in the plot are bothcomputed at each time step (Fig. 9, right). Itraises values slightly greater than field observa-tions (Chandrashekara and Ramakrishnan, 1994,compiled seven field studies which give values
J. Cha6e / Ecological Modelling 124 (1999) 233–254 247
Fig. 7. Influence of the angular radiation. Forest stand of 60ha after equilibration (400 years) with one species.
structure of the dbh size distribution, successionalpatterns and invasion of a plant community.
4.1. Tree population structure
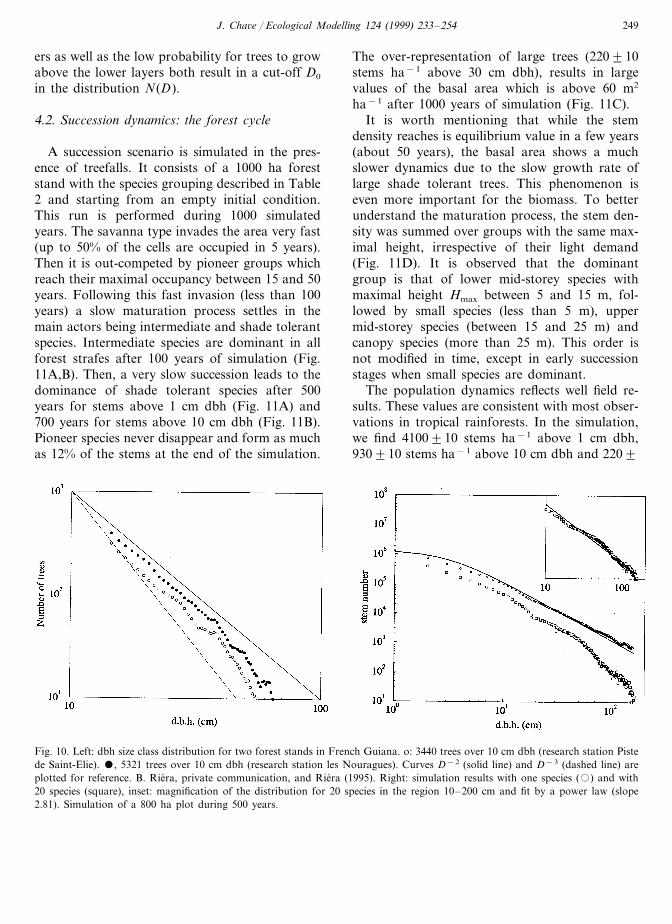
The forest structure is often characterized bythe dbh size class distribution N(D) (Rollet, 1973)for which a lot of field data are available. Theygenerally indicate a power law decay N(D)�D−d, or an exponential decay N(D)�exp(−aD). Several measures in Malaysian dipterocarpforests were reported and yielded a power lawwith d=2.88 (Appanah et al., 1991) or d=2.45with bins of width 1.6 cm and d=2.60 with binsof width 3.2 cm (Newbery et al., 1994). Data inFrench Guiana (Fig. 10, left) show an apparentcrossover between two behaviors for small dbhand for large values. In the range 10–50 cm apower law is observed with d=2.3990.05, whilelarge values (30–100 cm) are more consistent withan exponential decay.
The dbh size class distribution is simulated inTROLL. It is plotted with a bin width of 1 cmand for a forest stand of 640 ha during 500years and only for one ‘average’ species (Fig. 10right). The actual exponent is in fact slightly lowerthan 2 (this fact was systematically observed insimulation results). This observation does not fitwith field observations. One reason for this
from 0.5 to 1.21 gaps ha−1 per year). However,one treefall event does not necessarily yield anovel gap since trees can fall on already formedgaps (multiple treefall). In consequence, the vari-able presented in Fig. 9 naturally overestimatesthe gap number. Then we conclude that thetreefall model reflects quite well the real dynamics.
4. Applications
Three types of experiments are done with theTROLL tropical rainforest simulator. We study the
Fig. 8. Two dimensional l.a.i. field at the ground level. Upper: without treefalls. Lower: in the presence of treefalls. Color map fromwhite (l.a.i.=0) to black (l.a.i.\7). Plot of 800×200 m, one pixel per m2.
J. Cha6e / Ecological Modelling 124 (1999) 233–254248
Fig. 9. Left: stem density of a light demanding species as a function of the stem density of a shade tolerant species. The two curvescorrespond to absence of treefalls (�) and presence of rare treefalls (�). In the absence of treefalls, light demanding speciescompletely disappear, while with treefalls, coexistence occurs (see inset). Observe the damped oscillation pattern due to the lownumber of simulated species types. Right: average number of primary treefall events (inset: maximal intensity of the mechanical forceexerted on trees computed in the stand, in arbitrary units). Results from a simulated plot of size 250 ha during 1000 years.
discrepancy is that the bin width chosen in fieldstudies may alter the curve shape as clearly evi-denced in the work of Newbery et al. (1994): theexponent d decreases with the bin width. More-over, it is obvious that the diversity of vegetationtypes in real forests might alter the result. Wethen used the parameterization with several plantfunctional types (Table 2) to assess this latterhypothesis. The resulting distribution N(D) is alsoshown in Fig. 10, right. The curve shows a powerlaw behaviour for small dbh values. If one fo-cused in the range 10–200 cm (inset), it would betempting to overestimate the power law exponent.Indeed, a fit of the curve in the region givesd=2.81 with a good accuracy, close to field andother simulation results (Bossel and Krieger,1994). Therefore it is reasonable to suggest thatthe power law behaviour N(D)�D−2 is typicalof monospecific forest stands with completelyclosed canopy layers. The species-diverse charac-ter of forest stands does alter this situation.
To understand the possible physical origin ofthe power-law behavior, we use the model due toSlatkin and Anderson (1984). It is a very sim-plified approach of space competition, which isanalytically solvable. One assumes that a tree
crown grows linearly until it touches another treecrown in the same canopy layer (i.e. of the samesize). At this stage, one of the two trees dies. Thismodel yields d=2, since the number of survivingtrees is optimized at each canopy layer indepen-dently of the other layers. This exponent can beunderstood as a particular formulation of theself-thinning law. In general, the departure fromthis value is the signal of size class interactions. Itis worthwhile noticing that if one assumes thateach canopy layer has a depth h proportional tothe tree height H, then the above self-thinningargument gives DN(D), rather than N(D). Hence,DN(D)�D−2 and therefore d=3, which shouldbe an upper bound for d. Gazel (1983) proposeda fit of his data similar to
N(D)=a exp (− (D/D0)2)
1+cD2 (4.1)
which is plotted in Fig. 10. This is a very interest-ing point since the power law exponent d=2 isrecovered for D�D0, while a sharper decrease isobserved as D�D0. Moreover, theoretical consid-erations fit well with this view which can be seenby defining a multi-species version of the Slatkin–Anderson model. Vertical competition of the lay-
J. Cha6e / Ecological Modelling 124 (1999) 233–254 249
ers as well as the low probability for trees to growabove the lower layers both result in a cut-off D0
in the distribution N(D).
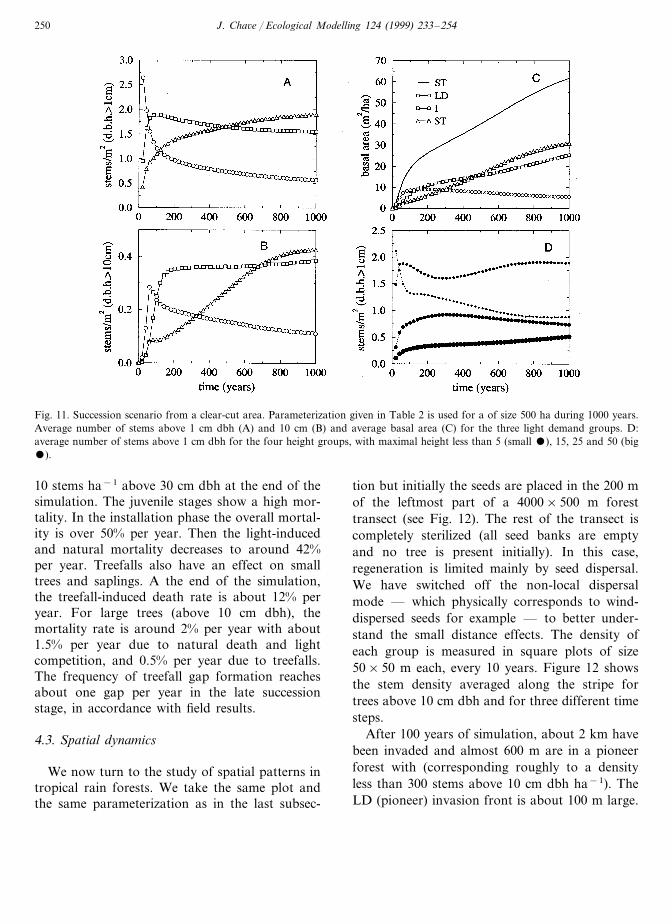
4.2. Succession dynamics: the forest cycle
A succession scenario is simulated in the pres-ence of treefalls. It consists of a 1000 ha foreststand with the species grouping described in Table2 and starting from an empty initial condition.This run is performed during 1000 simulatedyears. The savanna type invades the area very fast(up to 50% of the cells are occupied in 5 years).Then it is out-competed by pioneer groups whichreach their maximal occupancy between 15 and 50years. Following this fast invasion (less than 100years) a slow maturation process settles in themain actors being intermediate and shade tolerantspecies. Intermediate species are dominant in allforest strafes after 100 years of simulation (Fig.11A,B). Then, a very slow succession leads to thedominance of shade tolerant species after 500years for stems above 1 cm dbh (Fig. 11A) and700 years for stems above 10 cm dbh (Fig. 11B).Pioneer species never disappear and form as muchas 12% of the stems at the end of the simulation.
The over-representation of large trees (220910stems ha−1 above 30 cm dbh), results in largevalues of the basal area which is above 60 m2
ha−1 after 1000 years of simulation (Fig. 11C).It is worth mentioning that while the stem
density reaches is equilibrium value in a few years(about 50 years), the basal area shows a muchslower dynamics due to the slow growth rate oflarge shade tolerant trees. This phenomenon iseven more important for the biomass. To betterunderstand the maturation process, the stem den-sity was summed over groups with the same max-imal height, irrespective of their light demand(Fig. 11D). It is observed that the dominantgroup is that of lower mid-storey species withmaximal height Hmax between 5 and 15 m, fol-lowed by small species (less than 5 m), uppermid-storey species (between 15 and 25 m) andcanopy species (more than 25 m). This order isnot modified in time, except in early successionstages when small species are dominant.
The population dynamics reflects well field re-sults. These values are consistent with most obser-vations in tropical rainforests. In the simulation,we find 4100910 stems ha−1 above 1 cm dbh,930910 stems ha−1 above 10 cm dbh and 2209
Fig. 10. Left: dbh size class distribution for two forest stands in French Guiana. o: 3440 trees over 10 cm dbh (research station Pistede Saint-Elie). , 5321 trees over 10 cm dbh (research station les Nouragues). Curves D−2 (solid line) and D−3 (dashed line) areplotted for reference. B. Riera, private communication, and Riera (1995). Right: simulation results with one species (�) and with20 species (square), inset: magnification of the distribution for 20 species in the region 10–200 cm and fit by a power law (slope2.81). Simulation of a 800 ha plot during 500 years.
J. Cha6e / Ecological Modelling 124 (1999) 233–254250
Fig. 11. Succession scenario from a clear-cut area. Parameterization given in Table 2 is used for a of size 500 ha during 1000 years.Average number of stems above 1 cm dbh (A) and 10 cm (B) and average basal area (C) for the three light demand groups. D:average number of stems above 1 cm dbh for the four height groups, with maximal height less than 5 (small ), 15, 25 and 50 (big).
10 stems ha−1 above 30 cm dbh at the end of thesimulation. The juvenile stages show a high mor-tality. In the installation phase the overall mortal-ity is over 50% per year. Then the light-inducedand natural mortality decreases to around 42%per year. Treefalls also have an effect on smalltrees and saplings. A the end of the simulation,the treefall-induced death rate is about 12% peryear. For large trees (above 10 cm dbh), themortality rate is around 2% per year with about1.5% per year due to natural death and lightcompetition, and 0.5% per year due to treefalls.The frequency of treefall gap formation reachesabout one gap per year in the late successionstage, in accordance with field results.
4.3. Spatial dynamics
We now turn to the study of spatial patterns intropical rain forests. We take the same plot andthe same parameterization as in the last subsec-
tion but initially the seeds are placed in the 200 mof the leftmost part of a 4000×500 m foresttransect (see Fig. 12). The rest of the transect iscompletely sterilized (all seed banks are emptyand no tree is present initially). In this case,regeneration is limited mainly by seed dispersal.We have switched off the non-local dispersalmode — which physically corresponds to wind-dispersed seeds for example — to better under-stand the small distance effects. The density ofeach group is measured in square plots of size50×50 m each, every 10 years. Figure 12 showsthe stem density averaged along the stripe fortrees above 10 cm dbh and for three different timesteps.
After 100 years of simulation, about 2 km havebeen invaded and almost 600 m are in a pioneerforest with (corresponding roughly to a densityless than 300 stems above 10 cm dbh ha−1). TheLD (pioneer) invasion front is about 100 m large.

J. Cha6e / Ecological Modelling 124 (1999) 233–254 251
The old growth forest takes place in the first 200m, and between 200 and 900 m, a mixed foresttype (above 300 stems ha−1 but below 500 stemsha−1) is encountered. One hundred years later,the pioneer front have moved rightwards to 3700m from the origin, the mixed forest front is at2000 m but the old growth forest front is only at350 m. Thus, the invasion speed of the pioneerforest is about 20 m year−1, that of the mixedforest is about 10 m year−1, but for the oldgrowth forest, this value drops to c.a. 1.5 myear−1.
5. Discussion
The TROLL model reproduces the structuralproperties of a rain forest stand. Due to the largenumber of simulated trees we can compare thetheoretical diametric distribution due to Slatkinand Anderson and that obtained with our moredetailed approach. Trees below 10 cm dbh followtheoretical predictions and the singularity D−2 isclearly evidenced the simulation results. The suc-
cession scenario presented here deserves a furtherdiscussion. Kohler and Huth (1998) have recentlyproposed simulation results of a primary diptero-carp forest of Sabah, Malaysia (Borneo) during500 years using the FORMIND model. Startingfrom a clear-cut as in the present work, they findthat an equilibrium state is reached after about200 simulated years. This is in conflict with thesimulation using TROLL, where a fast invasionphase of about 50–100 years, with a significantnumber of pioneer trees, is followed by a matura-tion phase with much slower trends reflecting thecompetition between the different plant functionaltypes. This difference comes from the presence ofa feedback due to seed bank limitations which areabsent in FORMIND. The mature phase stronglydepends on the recruitment capacity of shadetolerant species. Whether this slow dynamics ismeaningful or whether it is negligible compared tothe influence of climatic perturbations over sev-eral centuries is still a questionable issue.
In regard of the very rapid spread of treecommunities in temperate regions after the lastglacial maximum, the velocity of the pioneer front(�20 m per year) seems underestimated in oursimulation results. Two distinct theories resolvethis issue. Eq. (2.13) should be replaced by along-range (Levy-like) probability distributionfunction to account for long distance dispersal.Alternatively the preservation of micro-refugesduring arid or cooler past periods could havesignificantly enhanced the spread speed. While thefirst hypothesis is the most probable in borealregions—it is difficult to figure out how a micro-refuge could have persisted in the last Ice Age inthe Northern part of Europe — the situation ismuch less obvious in inter-tropical regions. Thelarge size of tropical plant seeds and the possibil-ity for relict forests to persist along rivers bothplead for the second hypothesis.
The slow migration of shade tolerant species canbe detected in the field. For example, severalGuianan species with heavy seeds, mostly scatter-hoarded by rodents, such as Eperua falcata, Eperuagrandifora, Vouacapoua americana Caesalpini-aceae, (Forget, 1988) or Astrocaryum sciophilumArecaceae (Charles-Dominique et al., in prepara-tion) present a clustered spatial distribution which
Fig. 12. Simulation of a tropical rain forest invasion front. Thestem density above 10 cm dbh is used as an indicator of theforest type. Three fronts are clearly present corresponding(from right to left) to the pioneer forest front, the mixed forestfront and the old growth forest front.

J. Cha6e / Ecological Modelling 124 (1999) 233–254252
may result from the influence of past dry events inthis region (ECOFIT project; Servant et al., 1993;Bush, 1994; Charles-Dominique et al., 1998).TROLL is a new way to study such slowly dispers-ing species, which is almost impossible with othermodels. In the present simulation, the predictedvalue of 1.5 m per year for the old-growth forestinvasion front is consistent with d13C dating in theMayombe forest, Congo (Schwartz et al., 1996;Chave et al., in preparation) and with the spreadvelocity of the palm Astrocaryum sciophilum inFrench Guiana (Charles-Dominique et al., inpreparation). A related issue is that of small-scalespeciation phenomena (Gentry, 1989; Bush, 1994).Since trees are both individually modelled andphysically located in large stands, cross-pollinationsub-models and genetic drifts can be incorporatedas done in the work of Doligez and Joly (1998).
In conclusion, this model provides rich and newresults. It is able to reproduce the structural prop-erties of homogeneous plots and spatial migrationsof forest communities. Therefore, it is an efficienttool for understanding the long term dynamics oftropical rain forests from a theoretical viewpointbut also for assessing rain forest managementscenarios.
Acknowledgements
I warmly thank Kyle E. Harms, Andreas Huth,Peter Kohler, Marc-A. Dubois, Helene Muller-Landau and Radim Vocka for helpful discussionsand for critical reading of the manuscript. I amdeeply indebted to Bernard Riera for technicalassistance and for a constant support. The compu-tations were performed on the Cray T3E super-computer of the CEA, Centre d’Etudes Nucleairesde Grenoble. This work is part of the ECOFITprogram (ECOsytemes et paleoecosystemes desForets InterTropicales).
References
Appanah, S., Weinland, G., Bossel, H., Krieger, H., 1991. Aretropical forests non-renewable? An enquiry through mod-elling. J. Trop. Forest Sci. 2, 331–348.
Ashton, P.S., 1978. Crown characteristics of tropical trees. In:Tomlinson, P.B., Zimmermann, M.H. (Eds.), TropicalTrees as Living Systems. Cambridge University Press, pp.591–615.
Augspurger, C.K., 1984. Seedling survival of tropical treespecies: interactions of dispersal distance, light-gaps, andpathogens. Ecology 65, 1705–1712.
Bossel, H., Krieger, H., 1994. Simulation of multi-speciestropical forest dynamics using a vertically and horizontallystructured model. Forest Ecol. Manage. 69, 123–144.
Botkin, D.B., Janak, J.F., Wallis, J.R., 1972. Some ecologicalconsequences of a computer model of forest growth. J.Ecol. 60, 849–872.
Brokaw, N.V.L., 1982. The definition of treefall gap and itseffect on measures of forest dynamics. Biotropica 14, 158–160.
Brokaw, N.V.L., 1984. Treefalls: frequency, timing, and conse-quences. In: Leigh, E.G., Rand, A.S., Windsor, D.M.(Eds.), The Ecology of a Tropical Forest: SeasonalRhythms and Long Term Changes. Oxford UniversityPress, pp. 101–108.
Bush, M.B., 1994. Amazonian speciation: a necessarily com-plex model. J. Bio-geog. 21, 5–17.
Canham, C.D., Denslow, J.S., Platt, W.J., Runckle, J.R.,Spies, T.A., White, P.S., 1990. Light regimes beneathclosed canopies and tree-fall gaps in temperate and tropicalforests. Can. J. Forest Res. 20, 620–631.
Chandrashekara, U.M., Ramakrishnan, P.S., 1994. Vegetationand gap dynamics of a tropical wet evergreen forest in thewestern Ghats of Kerala, India. J. Trop. Ecol. 10, 337–354.
Charles-Dominique, P., Atramentowicz, M., Charles-Do-minique, M., Gerard, H., Hladik, A., Hladik, C.M., Pre-vost, M.F., 1981. Les mammiferes frugivores arboricolesnocturnes d’une foret guyanaise: inter-relations plantes-an-imaux. Rev. Ecol. (Terre & Vie) 35, 341–434.
Charles-Dominique, P., Blanc, P., Larpin, D., Ledru, M.-P.,Riera, B., Sarthou, C., Servant, M., Tardy, C., 1998.Forest perturbations and biodiversity during the last tenthousand years in French Guiana. Acta Oecol. 19, 295–302.
Condit, R., Hubbell, S.P., Foster, R.B., 1995a. Mortality ratesof 205 Neotropical tree and shrub species and the impactof a severe drought. Ecol. Monogr. 65, 419–439.
Condit, R., 1995b. Research in large, long-term tropical forestplots. Trends Ecol. Evol. 10, 18–22.
Dalling, J.W., Hubbell, S.P., Silvera, K., 1998. Seed dispersal,seedling establishment and gap partitioning among tropicalpioneer trees. J. Ecol. 86, 674–689.
Deutschman, D.H., Levin, S.A., Devine, C., Buttel, L.A.,1997. Scaling from trees to forests: analysis of a complexsimulation model. Science Online, available online at http://www.sciencemag.org.
Doligez, A., Joly, H.I., 1998. Fine-scale spatial genetic struc-ture with nonuniform distribution of individuals. Genetics148, 905–919.
Estrada, A., Fleming, T.H. (Eds.), 1986. Frugivorous and SeedDispersal. Junk, Dordrecht.
J. Cha6e / Ecological Modelling 124 (1999) 233–254 253
Forget, P.-M., 1988. Dissemination et regeneration naturellede huit especes d’arbres en foret guyanaise, PhD report,Universite Paris VI, 245 pp.
Gazel, M., 1983. Croissance des Arbres et Productivite desPeuplements en Foret Dense Equatoriale de Guyane.Office National des Forets, Direction Regionale deGuyane.
Gentry, A.H., 1989. Speciation in tropical forests. In: Holm-Nielsen, L.B., Nielsen, I.C., Balslev, H. (Eds.), TropicalForests: Botanical Dynamics, Speciation and Diversity.Academic Press, pp. 113–124.
Gentry, A.H., Terborgh, J., 1990. Composition and dynamicsof the Cocha Cashu ‘mature’ floodplain forest. In: Gentry,A. (Ed.), Four Neotropical Forests. Yale University Press,pp. 542–564.
Gourlet-Fleury, S., 1997. Modelisation individuelle spatiale-ment explicite de la dynamique d’un peuplement de foretdense tropicale humide, PhD report, Universite ClaudeBernard Lyon I, 274 pp+ann.
Halle, F., Oldeman, R.A.A., Tomlinson, P.B., 1978. TropicalTrees and Forests. An Architectural Analysis. Springer,Berlin.
Henwood, K., 1973. A structural model of forces in buttressedtropical rain-forest trees. Biotropica 5, 83–93.
Herwitz, S.R., Young, S.S., 1994. Mortality, recruitment, andgrowth rates of montane tropical rain forest canopy treeson mount Bellenden-Ker, Northeast Queensland, Aus-tralia. Biotropica 26, 350–361.
Howe, H.F., 1983. Annual variation in a Neotropical seed-dis-persal system. In: Sutton, S.L., Whitmore, T.C., Chadwick,A.C. (Eds.), Tropical Rain Forest: Ecology and Manage-ment. Blackwell Scientific, pp. 211–227.
Hubbell, S.P., Foster, R.B., 1990. Structure, dynamics, andequilibrium status of old-growth forest on Barro ColoradoIsland. In: Gentry, A. (Ed.), Four Neotropical Forests.Yale University Press, pp. 522–541.
Hubbell, S.P., Foster, R.B., O’Brien, T.S., Harms, K.E., Con-dit, R., Wechsler, B., Wright, S.J., Loo de Lao, S., 1999.Light-gap disturbances and recruitment limitation and treediversity in a Neotropical forest. Science 283, 554–557.
Hurtt, G.C., Pacala, S.W., 1995. The consequences of recruit-ment limitation: reconciling chance, history and competi-tive differences between plants. J. Theor. Biol. 176, 1–12.
Jenık, J., 1978. Roots and root systems in tropical trees:morphologic and ecologic aspects. In: Tomlinson, P.B.,Zimmermann, M.H. (Eds.), Tropical Trees as Living Sys-tems. Cambridge University Press, pp. 323–349.
Kira, T., 1978. Community architecture and organic matterdynamics in tropical lowland rain forests of Southeast Asiawith special reference to Pasoh Forest, West Malaysia. In:Tomlinson, P.B., Zimmermann, M.H. (Eds.), TropicalTrees as Living Systems. Cambridge University Press, pp.561–590.
Kohler, P., Huth, A., 1998. The effects of tree species groupingin tropical rain forest modelling-Simulations with the indi-vidual based model FORMIND. Ecol. Model. 109, 301–321.
Kohler, P., Huth, A., Ditzer, T., 1999. Concepts for theaggregation of tropical tree species into functional typesand the application on Sabah’s dipterocarp lowland rainforests. J. Trop. Ecol. (submitted).
Korning, J., Balslev, H., 1994. Growth rates and mortalitypatterns of tropical lowland tree species and the relation toforest structure in Amazonian Ecuador. J. Trop. Ecol. 10,151–166.
Lang, G.E., Knight, D.H., 1983. Tree growth, mortality,recruitment, and canopy gap formation during a 10-yearperiod in a tropical moist forest. Ecology 64, 1075–1080.
Lescure, J.-P., Puig, H., Riera, B., Leclerc, D., Beekman, A.,Beneteau, A., 1983. La phytomasse epigee d’une foretdense en Guyane Francaise. Acta Ecol. 4, 237–251.
Lieberman, D., Lieberman, M., Peralta, M., Hartshorn, G.S.,1985a. Mortality patterns and stand turnover rates in wettropical forest in Costa Rica. J. Ecol. 73, 915–924.
Lieberman, D., Lieberman, M., Hartshorn, G.S., Peralta, M.,1985b. Growth rates and age-size relationships of tropicalwet forest trees in Costa-Rica. J. Trop. Ecol. 1, 97–109.
Lieberman, D., Hartshorn, G.S., Lieberman, M., Peralta, M.,1990. Forest dynamics at La Selva biological station,1969–1985. In: Gentry, A. (Ed.), Four NeotropicalForests. Yale University Press, pp. 509–521.
Lischke, H., Loffler, T.J., Fischlin, A., 1996. Aggregation ofindividual trees and patches in forest succession models.preprint ETHZ 28, 1996.
Liu, J., Ashton, P.S., 1998. FORMOSAIC: an individual-based spatially explicit model for simulating forest dynam-ics in landscape mosaics. Ecol. Model. 106, 177–200.
Manokaran, N., Kochummen, K.M., 1987. Recruitment,growth and mortality of tree species in a lowland Diptero-carp forest in peninsular Malaysia. J. Trop. Ecol. 3, 315–330.
van der Meer, P.J., Bongers, F., Chatrou, L., Riera, B., 1994.Defining canopy gaps in a tropical rain forest: effects ongap size and turnover time. Acta Ecol. 15, 701–714.
Moravie, M.-A., Pascal, J.-P., Auger, P., 1997. Investigatingcanopy regeneration process through spatial individual-based models: application to a wet evergreen forest. Ecol.Model. 104, 241–260.
Newbery, D.C., Campbell, E.J.F., Lee, Y.F., Risdale, C.E.,Still, M.J., 1994. Primary lowland Dipterocarp forest atDanum Valley, Sabah, Malaysia: structure, relative abun-dance and family composition. Phil. Trans. Royal Soc.London B 335, 341–356.
Oldeman, R.A.A., 1990. Forests: Elements of Silvology.Springer, Berlin.
Pacala, S.W., Canharn, C.D., Saponara, J., Silander, J., Kobe,R., Ribbens, E., 1996. Forest models defined by fieldmeasurements: II. Estimation, error analysis and dynamics.Ecol. Monogr. 66, 1–44.
Pelissier, R., Riera, B., 1993. Dix ans de dynamique d’uneforet dense humide de Guyane Francaise. Rev. Ecol. (Terre& Vie) 48, 21–33.

J. Cha6e / Ecological Modelling 124 (1999) 233–254254
Phillips, O.L., Malhi, Y., Higuchi, N., Laurance, W.F., Nunez,P.V., Vasquez, R.M., Laurance, S.G., Ferreira, L.V., Stern,M., Brown, S., Grace, J., 1998. Change in the carbon balanceof tropical forests: evidence from long-term plots. Science282, 439–442.
van der Pijl, L., 1982. The Principles of Dispersal in HigherPlants, 3rd. Springer, Berlin.
Prentice, I.C., Leemans, R., 1990. Pattern and process and thedynamics of forest structure: a simulation approach. J. Ecol.78, 340–355.
Putz, F.E., Milton, K. Jr., 1982. Tree mortality rates on BarroColorado Island. In: Leigh, E.G. Jr., Rand, A.S., Windsor,D.M. (Eds.), The Ecology of a Tropical Forest: SeasonalRhythms and Long Term Changes. Smithsonian InstitutionPress, Washington, pp. 95–100.
Raich, J.W., Gong, W.K., 1990. Effects of canopy openings ontree seed germination in a Malaysian Dipterocarp forest. J.Trop. Ecol. 6, 203–217.
Rankin-de-Merona, J.M., Hutchings, R.W., Lovejoy, T.E.,1990. Tree mortality and recruitment over a five-year periodin undisturbed upland rainforest of the Central Amazon. In:Gentry, A.H. (Ed.), Four Neotropical Forests. Yale Univer-sity Press, pp. 573–584.
Ribbens, E., Silander, J.A. Jr., Pacala, S.W., 1994. Seedlingrecruitment in forests: calibrating models to predict patternsof tree seedling dispersion. Ecology 75, 1794–1806.
Richards, P.W., 1996. The Tropical Rain Forest, 2nd edn.,Cambridge University Press, 575 pp.
Riera, B., 1982. Observations sur les chablis. Piste de Saint-Elie,Guyane. Bulletin de Liaison de Groupe de Travail surl’Ecosysteme Forestier Guyanais, ORSTOM. Cayenne 6,165–183.
Riera, B., Alexandre, D.Y., 1988. Surface des chablis et tempsde renouvellement en foret dense tropicale. Acta Ecol. 9,211–220.
Riera, B., 1995. Role des perturbations actuelles et passees dansla dynamique et la musique forestiere. Revue d’Ecologie(Terre e Vie) 9, 209–222.
Rollet, B., 1973. L’Architecture des Forets Denses HumidesSempervirentes de Plaine. Centre Technique Forestier Trop-ical, Nogent-sur-Marne, France.
van Roosmalen, M.G.M., 1985. Fruits of the Guiana Flora.Institute of Systematics and Botany, Utrecht.
Runkle, J.R., 1981. Gap regeneration in some old-growth forestsof the Eastern United States. Ecology 62, 1041–1051.
Sabatier, D., 1985. Saisonnalite et determinisme du pic defructification de foret Guyanaise. Rev. Ecol. (Terre & Vie)40, 289–320.
Schenk, H.J., 1996. Modelling the effects of temperature ongrowth and persistence of tree species: a critical review oftree population models. Ecol. Model. 92, 1–32.
Schupp, E.W., 1988. Factors affecting post-dispersal and seedsurvival in a tropical forest. Ecologia 76, 525–530.
Schwartz, D., de Foresta, H., Mariotti, A., Balesdent, J.,Massimba, J.P., Girardin, C., 1996. Present dynamics of thesavanna-forest boundary in the Congolese Mayombe: apedological, botanical and isotopic (13C and 14C) study.Oecologia 106, 516–524.
Servant, M., Maley, J., Turcq, B., Absy, M.L., Brenac, P.,Fournier, M., Ledru, M.P., 1993. Tropical rain forestchanges during the late quaternary in African and SouthAmerican lowlands. Global Planet. Change 7, 25–40.
Shugart, H.H., Hopkins, M.S., Burgess, I.P., Mortlock, A.T.,1980. The development of a succession model for subtropicalrain forest and its application to assess the effects of timberharvest at Wiangaree State Forest, New South Wales. J.Environ. Manage. 11, 243–265.
Shugart, H.H., 1984. A Theory of Forest Dynamics. Springer,New-York.
Slatkin, M., Anderson, D.J., 1984. A model of competition forspace. Ecology 65, 1840–1845.
Swaine, M.D., Hall, T.B., Alexander, I.J., 1987a. Tree popula-tion dynamics at Kade, Ghana. J. Trop. Ecol. 3, 331–345.
Swaine, M.D., Lieberman, D., Putz, F.E., 1987b. The dynamicsof tree populations in tropical forest: a review. J. Trop. Ecol.3, 359–366.
Swaine, M.D., Whitmore, T.C., 1988. On the definition ofecological species groups in tropical forests. Vegetation 75,81–86.
Umeki, K., 1995. Modeling the relationship between the asym-metry in crown display and local environment. Ecol. Model.82, 11–20.
Vanclay, J.K., 1995. Growth models for tropical forests: asynthesis of models and methods. Forest Sci. 41, 7–42.
Vanclay, J.K., Skovsgaard, J.P., 1997. Evaluating forest growthmodels. Ecol. Model. 98, 1–12.
Vasquez-Yanes, C., Guevara-Sada, S., 1985. Caracterizacion delos grupos ecologicos de arboles de la selva humeda.Regeneracion de Selvas II, Compania Editorial Continental,Mexico, pp. 67–78.
Whitmore, T.C., 1998. An Introduction to Tropical RainForests, 2nd edn, Oxford University, Oxford, 282 pp.
Young, T.P., Perkocha, V., 1994. Treefalls, crown asymmetryand buttresses. J. Ecol. 82, 319–324.
.