Study of Passive Optical Network (PON) System and Devices
127
STUDY OF P ASSIVE OPTICAL NETWORK (PON) SYSTEM AND DEVICES
Transcript of Study of Passive Optical Network (PON) System and Devices

STUDY OF PASSIVE OPTICAL NETWORK (PON)
SYSTEM AND DEVICES

STUDY OF PASSIVE OPTICAL NETWORK (PON)
SYSTEM AND DEVICES
By
QINGYI GUO, M. A. Sc., B. Sc.
A Thesis
Submitted to the School of Graduate Studies
in Partial Fulfillment of the Requirements
for the Degree
Doctor of Philosophy
McMaster University
© Copyright by Qingyi Guo, December 2013

ii
DOCTOR OF PHILOSOPHY (2013) McMaster University
(Electrical & Computer Engineering) Hamilton, Ontario
TITLE: Study of Passive Optical Network (PON)
System and Devices
AUTHOR: Qingyi Guo,
M. A. Sc. (McMaster University, Canada)
B. Sc. (Peking University, China)
SUPERVISOR: Dr. Wei-Ping Huang, Professor
CO-SUPERVISOR: Dr. Xun Li, Professor
NUMBER OF PAGES: xiii, 113

iii
Abstract
The fiber-to-the-x (FTTX) has been widely investigated as a leading access
technology to meet the ever growing demand for bandwidth in the last mile. The passive
optical network (PON) provides a cost-effective and durable solution. In this thesis, we
investigate different aspects of the PON, in the search for cost-effective and high-
performance designs of link system and devices.
In Chapter 2, we propose a novel upstream link scheme for optical orthogonal
frequency division multiplexing (OOFDM)-PON. The colorless laser diodes are used at
the optical network units (ONUs), and the overlapped channel spectrum of orthogonal
subcarrier multiplexing provides high spectral efficiency. At the optical line terminal
(OLT), optical switch and all optical fast Fourier transform (OFFT) are adopted for high
speed demultiplexing. The deterioration caused by the laser perturbation is also
investigated.
In Chapter 3, we design a novel polarization beam splitter (PBS), which is one of
the most important components in polarization-controlled optical systems, e.g. the next-
generation PON utilizing polarization multiplexing. Our PBS is built on a slab waveguide
platform where the light is vertically confined. Planar lenses are formed to collimate and
refocus light beam by converting the phase front of the beam. A planar subwavelength
grating of a wedge shape induces the form birefringence, where the transverse electric
(TE) and transverse magnetic (TM) waves have different effective refractive indices, and
are steered to distinct directions. This design provides low insertion loss (< 0.9 dB) and

iv
low crosstalk (< -30 dB) for a bandwidth of 100 nm in a compact size, and can be
realized by different material systems for easy fabrication and/or monolithic integration
with other optical components.
In Chapter 4, we study the mode partition noise (MPN) characteristics of the
Fabry-Perot (FP) laser diode using the time-domain simulation of noise-driven multi-
mode laser rate equation. FP laser is cheaper than the widely used distributed feedback
(DFB) laser diode in PON, but its MPN is the major limiting factor in an optical
transmission system. We calculate the probability density functions for each longitudinal
mode. We also investigate the k-factor, which is a simple yet important measure of MPN.
The sources of the k-factor are studied with simulation, including the intrinsic source of
the laser Langevin noise, and the extrinsic source of the bit pattern.

v
Acknowledgements
I would like to express my highest appreciation to my supervisor, Dr. Wei-Ping
Huang, and my co-supervisor, Dr. Xun Li, whose guidance, support and encouragement
made it possible for this work to be completed. Their diverse insights and pivotal ideas
lead me to the frontier of photonics; from them, I have learnt the creativity and
rigorousness in research.
I greatly appreciate the assistance I received from my committee members, Dr.
Shiva Kumar, Dr. Chih-Hung (James) Chen and Dr. Chang-Qing Xu. Their constructive
criticism and valuable advice on numerical and physical modeling helped me a lot in this
study.
I would like to give many thanks to my colleagues in the Photonic Research
Group for their friendship and fruitful discussions. I would also like to thank Ms. Cheryl
Gies and other administrative staffs in the Department of Electrical and Computer
Engineering for their tireless efforts and helpful attitudes.
Last but not least, I would like to thank my parents, Shucheng Guo and Kezhen
Zhang, for their endless love and support in my whole life.

vi
Table of Contents
Abstract ............................................................................................................................. iii
Acknowledgements ........................................................................................................... v
Table of Contents ............................................................................................................. vi
List of Figures ................................................................................................................... ix
List of Tables .................................................................................................................. xiii
Chapter 1. Introduction ................................................................................................... 1
1.1 Background ............................................................................................................... 1
1.2 Thesis Outline ........................................................................................................... 5
Chapter 2. A Novel Upstream Link Scheme for OOFDM-PON .................................. 8
2.1 Introduction ............................................................................................................... 8
2.2 Architecture and Working Principle ....................................................................... 11
2.3 Link Simulation and Results ................................................................................... 17
2.4 Summary ................................................................................................................. 26
Chapter 3. Planar Waveguide Polarization Beam Splitter Based on the Form
Birefringence ................................................................................................................... 27
3.1 Introduction ............................................................................................................. 27
3.2 Structure and Working Principle ............................................................................ 31
3.2.1 Structure ........................................................................................................... 31

vii
3.2.2 Form Birefringence .......................................................................................... 31
3.2.3 Diffractive Optics............................................................................................. 38
3.3 Design Procedure .................................................................................................... 39
3.3.1 Material Indices ............................................................................................... 39
3.3.2 Effective Indices .............................................................................................. 41
3.3.3 Lens Design ..................................................................................................... 49
3.3.4 Wedge and Waveguide Design ........................................................................ 50
3.4 Simulation ............................................................................................................... 51
3.4.1 Simulation Setup of 2-D Beam Propagation Method (BPM) .......................... 51
3.4.2 Simulation Results at the Wavelength of 1.55 μm........................................... 54
3.4.3 Band Performance ............................................................................................ 56
3.5 Summary ................................................................................................................. 59
Chapter 4. Investigation of Mode Partition Noise in Fabry-Perot Laser Diode ....... 60
4.1 Introduction ............................................................................................................. 60
4.2 Noise-driven Multi-mode Laser Rate Equation ...................................................... 69
4.3 Mode Probability Density Function and k-factor ................................................... 72
4.4 Simulation ............................................................................................................... 74
4.4.1 Simulation Setup .............................................................................................. 74
4.4.2 Mode pdf Results ............................................................................................. 76
4.4.3 k-factor Results ................................................................................................ 79
4.5 Summary ................................................................................................................. 94

viii
Chapter 5. Summary and Future Work ....................................................................... 95
5.1 Contributions of the Thesis ..................................................................................... 95
5.2 Future Work ............................................................................................................ 97
References ........................................................................................................................ 99

ix
List of Figures
Figure 2-1 A typical configuration of WDM-PON system [19]. ........................................ 9
Figure 2-2 Spectra for (a) WDM signal and (b) OFDM signal. ......................................... 9
Figure 2-3 The conceptual diagram for OOFDM-PON. ................................................... 12
Figure 2-4 Baseband waveforms of the information signals at ONUs, at points A and B.
............................................................................................................................... 19
Figure 2-5 Baseband waveforms of the information signals at ONUs, after MZMs at
points C and D. ..................................................................................................... 20
Figure 2-6 Baseband waveform of the information signals after the coupler, at point E. 21
Figure 2-7 Transmitted optical spectrum for 10 Gbit/s for 4 ONUs................................. 21
Figure 2-8 Transmitted optical spectrum for 2.5 Gbit/s for 16 ONUs.............................. 22
Figure 2-9 Baseband waveforms of the information signals in OLT, at points F and G. . 23
Figure 2-10 Baseband waveforms of the output signals after OFFT at the OLT, at points
H and I (blue lines). The input waveforms are also shown for comparison in black
lines at points A and B. ......................................................................................... 24
Figure 2-11 BER as a function of the central frequency shift of the laser diodes in ONUs.
............................................................................................................................... 25
Figure 3-1 Schematic structure of the proposed PBS. Inset: Cross section view of the slab
waveguides for different areas. ............................................................................. 32
Figure 3-2 Structure of the subwavelength grating........................................................... 33

x
Figure 3-3 (a) The subwavelength grating wedge. (b) The TM and (c) the TE field
distributions for a plane wave incident on the wedge. The high and low strip
widths of the wedge are 300 nm and 75 nm, respectively. ................................... 37
Figure 3-4 The refractive index of amorphous Si [46]. .................................................... 40
Figure 3-5 Slab waveguide structure of SOI..................................................................... 41
Figure 3-6 Mode profile for a SOI slab waveguide with cladding layer thickness of 0.5
μm, guiding layer thickness of 0.5 μm, at the wavelength of 1.55 µm. (a) TM
mode. (b) TE mode. .............................................................................................. 42
Figure 3-7 Effective TM and TE mode indices of SOI slab waveguide as a function of Si
guiding layer thickness. ........................................................................................ 44
Figure 3-8 Difference of the effective TM and TE mode indices of SOI slab waveguide as
a function of Si guiding layer thickness. ............................................................... 45
Figure 3-9 The effective index of the etched low index wedge area as a function of the
etching depth from the background, at the wavelength of 1.55 μm. .................... 47
Figure 3-10 Schematic diagram of a lens structure. ......................................................... 49
Figure 3-11 The 2-D structure of the polarization splitter. ............................................... 52
Figure 3-12 Top view field distribution by 2-D BPM simulation for (a) the TM and (b)
TE polarizations at 1.55 µm. ................................................................................. 53
Figure 3-13 Insertion loss and crosstalk of the PBS in the band 1.5 μm - 1.6 μm. .......... 58
Figure 4-1 Average longitudinal mode spectrum under pulsed modulation. Modulation
frequency is 2.2 GHz, Ibias = 1.05 × Ith, Ipulse = 0.45 × Ith. This is the average over
the sampled data of 1024 pulses of bits ‘1’. .......................................................... 77

xi
Figure 4-2 Probability density functions for (a) the total photon output Stot, (b) the central
mode S0, and a few side modes (c) S-2, (d) S2, (e) S-4, (f) S4. The blue dots are pdf
calculated from counting the sample numbers in bins, and the red solid lines are
the fitted curve to the analytical formulas. ............................................................ 78
Figure 4-3 The waveform for total photon number and major modes. All bits are ‘1’s, and
without Langevin noise. (a) Laser diode output. (b) After the low-pass filter. .... 81
Figure 4-4 The sampled waveform for total photon number and major modes. All bits are
‘1’s, without Langevin noise................................................................................. 82
Figure 4-5 The waveform for total photon number and major modes. All bits are ‘1’s,
with Langevin noise. (a) Laser diode output. (b) After the low-pass filter. ......... 83
Figure 4-6 The sampled waveform for total photon number and major modes. All bits are
‘1’s, with Langevin noise. ..................................................................................... 84
Figure 4-7 k-factor for each mode. All bits are ‘1’s, with Langevin noise. ...................... 84
Figure 4-8 The waveform for total photon number and major modes. The bit pattern is De
Bruijn sequence, without Langevin noise. (a) Laser diode output. (b) After the
low-pass filter........................................................................................................ 85
Figure 4-9 The sampled waveform for total photon number and major modes. The bit
pattern is De Bruijn sequence, without Langevin noise. ...................................... 86
Figure 4-10 k-factor for each mode. The bit pattern is De Bruijn sequence, without
Langevin noise. ..................................................................................................... 86

xii
Figure 4-11 The waveform for total photon number and major modes. The bit pattern is
De Bruijn sequence, with Langevin noise. (a) Laser diode output. (b) After the
low-pass filter........................................................................................................ 87
Figure 4-12 The sampled waveform for total photon number and major modes. The bit
pattern is De Bruijn sequence, with Langevin noise. ............................................ 88
Figure 4-13 k-factor for each mode. The bit pattern is De Bruijn sequence, with Langevin
noise. ..................................................................................................................... 88
Figure 4-14 The total k-factor for four simulation conditions. The modulation current
Ipulse is kept constant as 0.45 × Ith, and bias current Ibias is varied at {0.95, 1.05,
1.5, 2.0} × Ith. ........................................................................................................ 91
Figure 4-15 The total k-factor for four simulation conditions. The bias current Ibias is kept
constant as 1.05 × Ith, while the modulation current Ipulse is varied at {0.45, 0.75,
1.05} × Ith. ............................................................................................................. 92
Figure 4-16 The total k-factor for four simulation conditions. The average injection
current is kept as a constant. ................................................................................. 93

xiii
List of Tables
Table 3-1 Comparison between the proposed PBS and previously reported PBSs. ......... 29
Table 3-2 Comparison between the proposed PBS and references of integrated PBSs. .. 30
Table 3-3 Material indices of Si and SiO2 in the optical band of 1.5 μm to 1.6 μm. ........ 40
Table 3-4 Device structure parameters at 1.55 μm ........................................................... 48
Table 3-5 Device characteristic parameters ...................................................................... 56
Table 3-6 Material indices and effective indices for different areas in the polarization
splitter in the optical band of 1.5 μm to 1.6 μm. ................................................... 57
Table 4-1 Laser parameters [101] ..................................................................................... 75

Ph.D. Thesis – Qingyi Guo; McMaster University – Electrical & Computer Engineering
1
Chapter 1. Introduction
1.1 Background
High speed communication is always what people desire [1], [2]. Since the
invention of optical fiber and erbium-doped fiber amplifier (EDFA), the optical data
transmission link has advanced to the GHz regime. For the flow of information, each
component in the loop has to provide a broad band in order to achieve the fast
performance.
In general, there are two categories of optical communication network. One is
long-haul network, which includes the submarine system, regional network and metro
network. The primary factor in the long-haul network design is the overall performance
of the system – high data rate, long reach and network stability to name a few. The other
category is the access network, where the primary consideration factor in the network
design is the overall cost of the system while aiming for better performance.
The last-mile connection of the network has been the bottleneck in a
communication link due to the limited bandwidth [3]. Optical access technologies are
considered to be the ideal solution to this problem, because they can offer the largest
bandwidth over a maximum distance [4]. The fiber access network is often referred to as
the fiber-to-the-x (FTTX), where X stands for the location of the fiber termination, e.g. H

Ph.D. Thesis – Qingyi Guo; McMaster University – Electrical & Computer Engineering
2
for home, C for curb, and B for building. Instead of point-to-point architectures, the
passive optical network (PON) utilizes point-to-multiple-point architecture. The optical
line terminal (OLT) is at the central office, and the optical network unit (ONU) is at each
subscriber node. Thus, the PON provides a cost-effective, bandwidth-management
flexible, scalable and durable solution to the ever growing demand for bandwidth in the
last mile.
There are several different schemes to utilize the PON architecture: time division
multiplexing (TDM)-PON [5], [6], wavelength division multiplexing (WDM)-PON [7],
[8], optical code division multiplexing (OCDM)-PON [9], [10], subcarrier multiplexing
(SCM)-PON [11], [12], orthogonal frequency division multiplexing (OFDM)-PON [13],
[14], etc.
Among these schemes, TDM-PON and WDM-PON are regarded as the
mainstream realizations of the optical access network, and have been employed
commercially.
There are a few TDM-PONs standardized by IEEE and ITU-T. Based on the
IEEE 802.3ah standard, gigabit Ethernet PON (EPON) supports downstream and
upstream speeds of up to 1.2 Gbit/s and up to 32 ONUs, with a maximum distance of 20
km [15]. Based on the ITU-T G.984 standard, gigabit-capable PON (G-PON) offers
asymmetrical service with 2.5 Gbit/s downstream transmission and 1.25 Gbit/s upstream,
and supports for up to 64 ONUs and a maximum distance of 60 km [16]. Recently, 10
Gbit/s PON systems have been standardized, including the 10G EPON by IEEE 802.3av
standard [17], and XG-PON by ITU-T G.987 standard [18]. In these systems, the

Ph.D. Thesis – Qingyi Guo; McMaster University – Electrical & Computer Engineering
3
downstream speed can achieve 10 Gbit/s, and the upstream speed has options from 1
Gbit/s or 2.5 Gbit/s, and 10 Gbit/s. TDM is used as the multiplexing scheme between the
OLT and ONUs in these systems. WDM is used in the gigabit-class and 10 gigabit-class
PON systems for directional multiplexing and service multiplexing, e.g. to multiplex
upstream and downstream signals, and to multiplex video signals onto data signals [19].
WDM is also used to multiplex different PON systems, such as to split and combine
GPON and 10 Gbit/s GPON.
New WDM related PON systems have been studied for the next generation
scalable and flexible PONs [19]. One category is WDM-PON, where each ONU uses a
unique wavelength in each direction to communicate with the OLT. The other category is
combined WDM/TDM-PON, where several wavelengths are used to communicate
between OLT and ONUs, and each wavelength is shared by a few ONUs by TDM. WDM
related PON systems not only can offer higher speed than TDM-PONs, but also can excel
in scalability and information security. However, they are more costly compared to
TDM-PONs.
Optical orthogonal frequency division multiplexing emerged recently for its high
speed and spectral efficiency compared with TDM and WDM, and extreme robustness
against chromatic dispersion and polarization mode dispersion [20], [21]. Therefore,
OFDM-PON has been proposed and investigated intensively [22], [23].
Advanced PON architectures have been actively pursued to achieve a high
transmission rate. A recent PON architecture utilizing OFDM, polarization multiplexing
(POLMUX), 16- quadrature amplitude modulation (QAM) scheme and direct detection

Ph.D. Thesis – Qingyi Guo; McMaster University – Electrical & Computer Engineering
4
enables 108 Gbps data rate on a single wavelength for 20 km transmission [24]. This
architecture combines several different multiplexing and modulation schemes, and is
regarded as an attractive candidate for next-generation optical access network.
In the markets of FTTX, the emphasis on technologies includes two aspects:
“farther and faster”, and “more and cheaper”. Intensive research and development efforts
have been carried out to pursue high-volume and low-cost components such as optical
transceivers, multiplexers/demultiplexers, and splitters/combiners.
The conventional optical modules are based on optical subassemblies, which are
made of discrete chips [4]. For example, chips of distributed feedback (DFB) laser diodes
and PIN photo diodes are packaged into TO-cans, which are assembled into optical
subassemblies, and mounted onto printed circuit boards (PCBs) with other
microelectronic chips to form an optical transceiver module. New hybrid and
monolithical integration technologies have emerged to reduce the discrete components,
thus to increase the production throughput and reduce the overall cost. The chip-level
integration is the ultimate goal, where the photonic devices are connected monolithically
or hybridly to form a single and rugged photonic integrated circuit. Different material
platforms will be appropriate for different purposes: InP for optical only integration;
GaAs for both the optical and electronic components/circuitry; and Si-based platform if
lighted externally.
The laser diode is the key element used at both OLTs at the central office and
ONUs at each subscriber’s premises. Due to the serious dispersion-related impairments,
costly narrow-linewidth lasers, such as DFB laser diodes, are needed. Much attention has

Ph.D. Thesis – Qingyi Guo; McMaster University – Electrical & Computer Engineering
5
been paid to find the low-cost alternative to the DFB laser, e.g. a single mode Fabry-Perot
(FP) laser made by etching a few shallow slots on the ridge [25]. Conventional FP lasers
are also studied for the application in 10 Gbit/s transmission uplinks. An InGaAlAs
multi-quantum-well (MQW) FP laser is experimentally shown for 4 km transmission at
10 Gbit/s over a temperature range from 0 to 85 °C [26]. In another scheme, forward-
error correction (FEC) can offer an effective optical gain higher than 2.7 dB for a 1.25
Gbit/s burst-mode GPON uplink using FP laser, and the reach is equivalently over 12 km
[27].
1.2 Thesis Outline
In this thesis, I will explore different aspects of the PON, in the search for cost-
effective and high-performance designs of link system and devices.
In Chapter 2, we propose a novel optical orthogonal frequency division
multiplexing (OOFDM)-PON upstream link scheme. We first review the advantages and
disadvantages of WDM and OFDM in the introduction section. The architecture of our
proposed link and its working principle are demonstrated in the second section. At the
ONUs, orthogonal subcarrier multiplexing is used to realize colorless ONU and high
spectral efficiency. At the OLT, the optical switch and all optical FFT are applied to
achieve high speed demultiplexing. In the third section, numerical simulations are
conducted with two configurations: 10 Gbit/s bit rate for 4 ONUs, and 2.5 Gbit/s bit rate
for 16 ONUs. According to the Monte-Carlo simulation results of the BER, the tolerance

Ph.D. Thesis – Qingyi Guo; McMaster University – Electrical & Computer Engineering
6
of the laser diode central wavelength shift in ONUs for 10 Gbit/s link is higher than that
for the 2.5 Gbit/s link. The last section summarizes this chapter.
In Chapter 3, we design a novel polarization beam splitter (PBS) on a slab
waveguide platform where the light is vertically confined. In the introduction section, we
review and compare state-of-the-art PBS designs. In the second section, the structure of
our proposed PBS and its fundamental working principle are described, with a brief
explanation of form birefringence and diffractive optics. Planar lenses are formed to
collimate and refocus light beam by converting the phase front of the beam. A planar
subwavelength grating of a wedge shape induces the form birefringence, where the
transverse electric (TE) and transverse magnetic (TM) waves have different effective
refractive indices, and are steered to distinct directions. In the third section, the detailed
design procedure and considerations are provided, including the calculation of material
and effective indices, lens design, wedge and waveguide design. In the fourth section, the
simulation setup and results are shown. This design provides low insertion loss (< 0.9 dB)
and low crosstalk (< -30 dB) for a bandwidth of 100 nm in a compact size, and can be
realized by different material systems for easy fabrication and/or monolithic integration
with other optical components. Finally, a summary concludes this chapter in the fifth
section.
In Chapter 4, we investigate the mode partition noise (MPN) characteristics of
Fabry-Perot laser diode using the time-domain simulation of noise-driven multi-mode
laser rate equation. In the introduction section, the previous works on the study of MPN
are reviewed, including the theoretical analysis, experimental measurements, and

Ph.D. Thesis – Qingyi Guo; McMaster University – Electrical & Computer Engineering
7
suppression schemes of MPN. In the second section, the model of multimode rate
equations with Langevin noise terms is illustrated. The mode probability density
functions (pdfs) and k-factors are briefly described in the third section. In the fourth
section, we demonstrate the numerical simulation setup, and show the simulation results
for the mode pdfs and k-factors. The sources of the k-factor are studied, including the
intrinsic source of the laser Langevin noise, and the extrinsic source of the bit pattern.
The fifth section summarizes this chapter.
Finally, I will give the summary of this thesis, and discuss possible future works
in Chapter 5.

Ph.D. Thesis – Qingyi Guo; McMaster University – Electrical & Computer Engineering
8
Chapter 2.
A Novel Upstream Link Scheme for OOFDM-PON
2.1 Introduction
As reviewed in Chapter 1, fiber-to-the-x (FTTX) has been widely investigated as
a leading access technology to meet the ever growing demand for bandwidth in the last
mile, and PON is regarded as a cost-effective and durable solution.
WDM-PON is a promising candidate for the next-generation access network due
to its high speed, scalability in terms of bandwidth and wavelengths, flexibility and
security. Figure 2-1 shows a typical configuration of WDM-PON system. A simple way
to realize WDM-PON is to employ a different laser with a specific wavelength in each
ONU. However, this increases the inventory and maintenance burden of the network
operation [19]. Therefore, how to implement colorless ONU, where wavelength is
independent, has been a major issue and research focus [28], [29]. Another inherent
problem with WDM-PON is that the channels are non-overlapped with guard bands in
between, as shown in Figure 2-2 (a), leading to a wider bandwidth than actually required.
And at the receiver end, tuned analog filters are needed to separate the subcarriers.

Ph.D. Thesis – Qingyi Guo; McMaster University – Electrical & Computer Engineering
9
Figure 2-1 A typical configuration of WDM-PON system [19].
Figure 2-2 Spectra for (a) WDM signal and (b) OFDM signal.

Ph.D. Thesis – Qingyi Guo; McMaster University – Electrical & Computer Engineering
10
Orthogonal frequency division multiplexing (OFDM) has been used vastly in
broadband wireless and wired communication systems [30], [31], and has attracted
intensive research interest in optical communications [32]-[38]. It is one class of multi-
carrier modulation (MCM) [21], but information data are carried on orthogonal
subcarriers with overlapped spectrum, as shown in Figure 2-2 (b). The input serial data is
first converted to parallel data streams, where the symbol period is longer, and then
transmitted on a number of different frequencies. The subcarriers can utilize conventional
modulation schemes, such as on-off keying (OOK), phase-shift keying (PSK), and
quadrature amplitude modulation (QAM).
One advantage of OFDM is the high spectral efficiency as compared with WDM,
as shown in Figure 2-2. The orthogonality of subcarriers over one OFDM symbol period
guarantees that the signal can be recovered without inter-channel interference (ICI) at the
demodulator. And the modulation and demodulation can be implemented by inverse
discrete Fourier transform (IDFT) and discrete Fourier transform (DFT) [39], and these
can be efficiently implemented by fast Fourier transform (FFT) with the digital electronic
circuits. Another advantage of OFDM is that it can mitigate the inter-symbol interference
(ISI) and ICI induced by chromatic dispersion and polarization mode dispersion (PMD),
because of the longer symbol period and the added cyclic prefix [30], [40].
One drawback of OFDM is that it is sensitive to frequency offset and phase noise,
because this would affect the orthogonality of subcarriers and lead to ICI and ISI. OFDM
can have a high peak-to-average power ratio (PAPR) when the independently modulated
subcarriers add up constructively at a certain time. The high PAPR may suffer from the

Ph.D. Thesis – Qingyi Guo; McMaster University – Electrical & Computer Engineering
11
nonlinearity in the optical link, e.g. fiber nonlinearity [42]-[46], and this would
deteriorate the subcarrier orthogonality. Therefore, OFDM is a promising technique for
high data rate transmission over a short range, where nonlinearity is negligible. As an
example, at the wavelength of 1.55 μm, for standard telecommunication fibers, the
nonlinear effect is negligible for a fiber length of 50 km if the pulse width is 100 ps and
peak launch power is 1 mW [47]. PON is an access network with negligible nonlinearity,
thus suitable for OFDM application. OFDM-PON has a better performance than TDM-
PON, and is cheaper than WDM-PON.
In this chapter, we propose a novel upstream link scheme for optical orthogonal
frequency division multiplexing (OOFDM)-PON. The architecture and working principle
of the proposed scheme is illustrated in the second section. The colorless laser diodes are
used at the optical network units (ONUs), and the overlapping channel spectrum of
orthogonal subcarrier multiplexing provides high spectral efficiency. At the optical line
terminal (OLT), optical switch and all optical fast Fourier transform (OFFT) are adopted
for high speed demultiplexing. Numerical simulations for two link configurations, i.e. 10
Gbit/s bit rate for 4 ONUs, and 2.5 Gbit/s bit rate for 16 ONUs, are shown and analyzed
in the third section. The chapter is summarized in section 4.
2.2 Architecture and Working Principle
Figure 2-3 shows the conceptual diagram for our proposed scheme for the
upstream link of the OOFDM-PON.

Ph.D. Thesis – Qingyi Guo; McMaster University – Electrical & Computer Engineering
12
Fig
ure
2-3
The
con
ceptu
al d
iagra
m f
or
OO
FD
M-P
ON
.

Ph.D. Thesis – Qingyi Guo; McMaster University – Electrical & Computer Engineering
13
At the ONUs, the orthogonal subcarrier multiplexing is utilized. The signal
carried on each subcarrier is the information bits from each ONU, instead of the parallel
data streams converted from one serial input data stream in the traditional OFDM
architecture. The information bit train 1,2,k scc k N , , where scN is the total
number of ONUs, is mixed by a subcarrier frequency kf in the electronic domain. The
continuous wave from the single-mode laser diodes (LDs), e.g. distributed feedback
(DFB) LDs, are modulated by the electrical signal via the Mach-Zehnder modulator
(MZM) module, and a simple optical coupler combines optical signals from each ONU.
The external modulation of DFB LD using MZM can also be replaced with a directly-
modulated DFB LD, which will further reduce the cost.
The transmitted signal can be expressed as [21]
1
scN
ki k s
i k
s t c s t iT
(2.1)
where kic is the i-th information bit on the k-th subcarrier, sT is the symbol period, and ks
is the waveform of the k-th subcarrier:
exp 2k ks t t j f t (2.2)
Here t is the pulse shaping function. In this chapter, we simply use non-return-to-
zero (NRZ) coding and square pulses, and then t is the gate function:
1, 0
0, 0,
s
s
t Tt
t t T
(2.3)

Ph.D. Thesis – Qingyi Guo; McMaster University – Electrical & Computer Engineering
14
The inner product of two subcarriers can be written as
*
0 0
1 1exp 2
exp sinc
s sT T
k l k l
s s
k l s k l s
s s t j f f t tT T
j f f T f f T
(2.4)
If the subcarriers are spaced at frequencies that are multiples of the inverse of the bit
duration
1
, is integerk l
s
f f m mT
(2.5)
Eq. (2.4) becomes zero, and the two subcarriers are orthogonal. Here we place the
subcarrier frequencies at:
1
k
s
kf
T
(2.6)
At the OLT, an optical switch allocates sequentially the corresponding time slots
of the pulses to each channel. The duration of each time slot is
s
sc
Tdt
N (2.7)
This is equivalent to sampling the received signal at every interval of dt. For the simple
back-to-back case, the received signal is the transmitted signal, and its i-th symbol is
is t . The m-th sample of the i-th symbol can be written as

Ph.D. Thesis – Qingyi Guo; McMaster University – Electrical & Computer Engineering
15
1
1
1
1exp 2
1 1 exp 2
sc
sc
Ns
im ki k
k sc
N
ki
k sc
ki
m Ts c j f
N
k mc j
N
F c
(2.8)
where 1F is the inverse Fourier transform, and m = 1, 2, …, Nsc. Therefore, the
demultiplexer in the form of Fourier transform can recover the input information symbols
perfectly. If the transmission has chromatic dispersion and/or polarization mode
dispersion, the addition of cyclic prefix can mitigate the problem, and the above analysis
still holds.
From the DFT expression, we can see that it is actually just controlled phase
delays and power couplers. Therefore, the optical FFT (OFFT) components have been
implemented using star couplers and phase adjustments [45]. An OFFT circuit design
combining optical delays and phase shifters was applied to a 4×25 Gbit/s transmission
using numerical simulations [46]. A simpler implementation of OFFT device was
realized by combining the serial to parallel (S/P) conversions and optical delays and
couplers into one, and by re-ordering the delays and re-labeling the outputs [48], [49]. By
encoding 4 odd channels with differential phase-shift keying (DPSK) data at 28 GBd and
5 even channels with differential quadrature phase shift keying (DQPSK) data, a 392
Gbit/s OFDM signal transmission is realized.
The OFFT differs from the electronic FFT that it operates continuously; thus, all
the Nsc time samples in one symbol period Ts must be fed simultaneously into the OFFT

Ph.D. Thesis – Qingyi Guo; McMaster University – Electrical & Computer Engineering
16
circuit. Therefore, at the OLT, the sampled pulses in the time slot dt at each channel are
delayed by 1 , 2 , ..., 1 , 0sc scN dt N dt dt dt , respectively. Then the pulses are fed to
an all optical fast Fourier transform (OFFT) processor for demultiplexing, and finally
received by photo diodes (PDs).
The merit of using OFFT device instead of electronic FFT is that the
demultiplexing of the OFDM subcarriers can be done optically with high speed, and only
the subcarrier signal processing is to be done in the electronic domain. Thus, the speed
limit imposed by the capabilities of the electronic receivers is greatly relaxed to the
subcarrier data rate.
In our proposed scheme of OOFDM-PON, the laser diodes of the ONUs are
colorless, and therefore, they are interchangeable and cost-effective. The demultiplexing
by OFFT is operated in the optical domain; thus, a higher symbol rate can be achieved
compared to demultiplexing in the electronic domain. The reason why we do not use
optical inverse FFT (OIFFT) for multiplexing at the ONUs is that, in order to combine
the pulse train from each ONU, the pulse width has to be dt, which not only put a
stringent requirement for the lasers, but also increases greatly the baseband bandwidth
[46].

Ph.D. Thesis – Qingyi Guo; McMaster University – Electrical & Computer Engineering
17
2.3 Link Simulation and Results
We numerically simulate the 1310 nm upstream link for two configurations:
nominal bit rates of 2.5 Gbit/s for 16 ONUs, and 10 Gbit/s for 4 ONUs. NRZ pulses are
used as the baseband waveform. We consider linear fiber in the PON.
The illustrative points in the OOFDM-PON architecture are marked with letters A
to I in Figure 2-3, and the baseband waveforms at those points for the configuration of 10
Gbit/s for 4 ONUs are shown in the corresponding figures. Figure 2-4 shows the
waveform of the information bits directly from the 1st and Nsc-th home, at points A and B.
Figure 2-5 shows the waveform after the MZMs in the 1st and Nsc-th ONUs, at points C
and D. Figure 2-6 is the waveform of the combined signals from all the ONUs at point E,
and Figure 2-7 illustrates its optical spectrum. As shown, the spectra of subcarriers
overlap with each other, and are orthogonal so that the subcarriers have no impact on
others. Figure 2-9 shows the waveforms in the OLT, after the optical switch and proper
delays, at points F and G. Figure 2-10 shows the waveforms after the OFFT in blue lines,
i.e. the outputs of the demultiplexer, at points H and I. Also shown is the input bit trains
from the subscribers at points A and B in black lines. We can see that the information bits
are recovered at the end of the link system, and the pulse durations are shortened to 1/Nsc
of the original symbol period. Figure 2-8 illustrates the transmitted overlapping optical
spectrum for the configuration of 2.5 Gbit/s with 16 ONUs.
The major performance degradation of the proposed OOFDM-PON comes from
the frequency shift and phase noise of the laser diodes in ONUs. Here, the bit error rate

Ph.D. Thesis – Qingyi Guo; McMaster University – Electrical & Computer Engineering
18
(BER) is studied as a function of the central frequency shift of the laser diodes in ONUs
by Monte-Carlo method. The frequency shift is modeled by a Gaussian distribution with
zero mean and standard deviation of f
, while the initial phase of the laser diodes is
uniformly distributed between 0 and 2 . The BER results are shown in Figure 2-11.
The central frequency shift of the laser diodes deteriorates the orthogonality of the
subcarriers; therefore, the configuration with higher bit rate can tolerate a larger
frequency shift of laser diodes. As shown in Figure 2-11, for the same amount of the
central frequency shift, the 10 Gbit/s link has a lower BER than the 2.5 Gbit/s link. For
the forward error correction (FEC) limit of 10-3
, the standard deviations of laser central
frequency are approximately 0.2 GHz for 2.5 Gbit/s configuration, and 0.6 GHz for 10G
bit/s configuration. Besides, the splitting loss of the optical coupler for 16 ONUs is larger
than that for 4 ONUs. Therefore, the configuration of 10 Gbit/s link with 4 ONUs has a
better overall performance than the 2.5 Gbit/s link with 16 ONUs.

Ph.D. Thesis – Qingyi Guo; McMaster University – Electrical & Computer Engineering
19
A
B
Figure 2-4 Baseband waveforms of the information signals at ONUs, at points A and B.
0 0.2 0.4 0.6 0.8 1 1.2 1.4 1.60
0.2
0.4
0.6
0.8
1
1.2
time (ns)
Information Bit Train for 1st Home
0 0.2 0.4 0.6 0.8 1 1.2 1.4 1.60
0.2
0.4
0.6
0.8
1
1.2
time (ns)
Information Bit Train for Nsc-th Home

Ph.D. Thesis – Qingyi Guo; McMaster University – Electrical & Computer Engineering
20
C
D
Figure 2-5 Baseband waveforms of the information signals at ONUs, after MZMs at
points C and D.
0 0.2 0.4 0.6 0.8 1 1.2 1.4 1.60
0.2
0.4
0.6
0.8
1
1.2
time (ns)
Transmitted Base-band Time Signal for 1st ONU
0 0.2 0.4 0.6 0.8 1 1.2 1.4 1.60
0.2
0.4
0.6
0.8
1
1.2
time (ns)
Transmitted Base-band Time Signal for Nsc-th ONU

Ph.D. Thesis – Qingyi Guo; McMaster University – Electrical & Computer Engineering
21
E
Figure 2-6 Baseband waveform of the information signals after the coupler, at point E.
Figure 2-7 Transmitted optical spectrum for 10 Gbit/s for 4 ONUs.
0 0.2 0.4 0.6 0.8 1 1.2 1.4 1.6-2
-1.5
-1
-0.5
0
0.5
1
1.5
2
2.5
3
time (ns)
Transmitted Time Signal (total)
-20 -10 0 10 20 30 40 50-400
-200
0
200
400
600
800
1000
1200
Frequency (GHz)
Am
plit
ude (
a.
u.)

Ph.D. Thesis – Qingyi Guo; McMaster University – Electrical & Computer Engineering
22
Fig
ure
2-8
Tra
nsm
itte
d o
pti
cal
spec
trum
for
2.5
Gbit
/s f
or
16 O
NU
s.
-10
01
02
03
04
05
0012345678
Fre
quency (
GH
z)
Amplitude (a. u.)

Ph.D. Thesis – Qingyi Guo; McMaster University – Electrical & Computer Engineering
23
F
G
Figure 2-9 Baseband waveforms of the information signals in OLT, at points F and G.
0 0.2 0.4 0.6 0.8 1 1.2 1.4 1.6-1.5
-1
-0.5
0
0.5
1
1.5
2
2.5
3
time (ns)
0 0.2 0.4 0.6 0.8 1 1.2 1.4 1.6-1.5
-1
-0.5
0
0.5
1
1.5
2
2.5
3
time (ns)

Ph.D. Thesis – Qingyi Guo; McMaster University – Electrical & Computer Engineering
24
H
I
Figure 2-10 Baseband waveforms of the output signals after OFFT at the OLT, at points
H and I (blue lines). The input waveforms are also shown for comparison in black lines at
points A and B.
0 0.2 0.4 0.6 0.8 1 1.2 1.4 1.60
0.2
0.4
0.6
0.8
1
1.2
1.4
time (ns)
Received Signal for 1st Home
Output
Input
0 0.2 0.4 0.6 0.8 1 1.2 1.4 1.60
0.2
0.4
0.6
0.8
1
1.2
1.4
time (ns)
Received Signal for Nsc-th Home
Output
Input

Ph.D. Thesis – Qingyi Guo; McMaster University – Electrical & Computer Engineering
25
Fig
ure
2-1
1 B
ER
as
a fu
nct
ion o
f th
e ce
ntr
al f
req
uen
cy s
hif
t of
the
lase
r dio
des
in O
NU
s.
00
.51
1.5
22
.51
0-1
2
10
-10
10
-8
10
-6
10
-4
10
-2
Sta
ndard
devia
tio
n o
f LD
centr
al f
requency s
hift
f (G
Hz)
BER
2.5
Gb
it/s
10
Gb
it/s

Ph.D. Thesis – Qingyi Guo; McMaster University – Electrical & Computer Engineering
26
2.4 Summary
A novel OOFDM-PON upstream link scheme is proposed and numerically
simulated with two configurations: 10 Gbit/s bit rate for 4 ONUs, and 2.5 Gbit/s bit rate
for 16 ONUs. At the ONUs, orthogonal subcarrier multiplexing is used to realize
colorless ONU and high spectral efficiency. At the OLT, the optical switch and all optical
FFT are applied to achieve high speed demultiplexing. According to the Monte-Carlo
simulation results of the BER, the tolerance of the laser diode central wavelength shift in
ONUs for 10 Gbit/s link is higher than that for the 2.5 Gbit/s link.

Ph.D. Thesis – Qingyi Guo; McMaster University – Electrical & Computer Engineering
27
Chapter 3.
Planar Waveguide Polarization Beam Splitter Based on
the Form Birefringence
3.1 Introduction
Polarization beam splitters (PBSs) are one of the most important components in
polarization-controlled optical systems, e.g., polarization multiplexed long-haul fiber-
optic communication systems, and next-generation passive optical network (PON) based
on polarization multiplexing [24].
There are two categories of PBSs. One is discrete PBS, and some of the examples
are conventional PBS such as Wollaston prism, and form-birefringent PBS [50], [51].
These designs can be broadband with low loss and low crosstalk, but cannot be easily
integrated with other optical components. The other category is integrated PBS, which
can be further classified into the interference type [52]-[55] and the mode evolution type
[56]. Devices based on interference effect [52]-[55] have short device lengths and low
loss, but their extinction ratio (ER) is relatively low and the bandwidth is usually small. A
variety of waveguide structures that these PBSs are built on provide potential
compatibility with different optical components. Devices based on mode evolution
suppress mode coupling, thus have a broadband with low loss and high ER in a compact

Ph.D. Thesis – Qingyi Guo; McMaster University – Electrical & Computer Engineering
28
size [56], but they are not directly integratable with planar waveguide based devices.
In this chapter, we propose a novel PBS design that has features comparable to
the state-of-the-art devices. Besides, our device is based on a planar waveguide platform,
and therefore can be monolithically integrated with other optical components built on the
same platform [57], [58]. The form birefringence provides an enlarged effective index
difference between the TM and TE polarizations over a broad bandwidth. The device
shown in this letter is based on a silicon-on-insulator (SOI) material system. Simulation
results show that, with a size of 300 μm × 80 μm, its crosstalk can be less than -30 dB
with insertion loss under 0.9 dB for a wavelength range from 1.5 μm to 1.6 μm.
Comparison between the suggested structure and the previously reported beam
splitters can be made in terms of compatibility (for monolithic integration), insertion loss,
crosstalk or extinction ratio, size, and bandwidth. The comparison can be summarized in
Table 3-1, and the details of the references of the integrated PBSs [52]-[56] are
summarized in Table 3-2.
In this chapter, we first describe the structure of our proposed PBS and its
fundamental working principle, with a brief explanation of form birefringence and
diffractive optics. Next, we provide the detailed design procedure and considerations,
including the calculation of material and effective indices, lens design, wedge and
waveguide design. Then, we describe briefly the simulation setup, and show the
simulation results of field distribution, insertion loss and crosstalk. The PBS performance
in the band between 1.5 μm and 1.6 μm is studied. Finally, a summary concludes this
chapter.

Ph.D. Thesis – Qingyi Guo; McMaster University – Electrical & Computer Engineering
29
Table 3-1 Comparison between the proposed PBS and previously reported PBSs.
Type Insertion
Loss
Crosstalk Bandwidth Size Integration
Discrete
Integrated:
Interference
Integrated:
Mode
Evolution
Proposed

Ph.D. Thesis – Qingyi Guo; McMaster University – Electrical & Computer Engineering
30
Table 3-2 Comparison between the proposed PBS and references of integrated PBSs.
Ref # Size Insertion
Loss
Extinction Ratio Bandwidth Structure
[52] length =
46.7μm
~ 0 22 dB 18 nm:
ER > 20 dB
two horizontally
slotted waveguide
(SOI)
[53] 7 μm ×
16 μm
< 0.5 dB 15 dB (single),
> 20 dB
(double)
1.5 - 1.6 μm:
ER > 12 dB (TE),
ER > 6 dB (TM)
silicon wire
[54] length =
200 μm
3 dB
(TM)
15 dB at 1.31 and 1.55
μm, ER > 15 dB
tapered metal line
[55] 20 μm ×
7 μm
Transmission: 30% TM,
10% TE
1.25 – 1.3 μm planar photonic
crystal
[56] length =
200 μm
~ 0 > 30 dB (at
1.63μm)
1.45 – 1.75 μm
ER > 22 dB
two high-index-
contrast dielectric
waveguide
Pro-
posed
300 μm ×
80 μm
< 0.9 dB Crosstalk
< -30 dB
1.5 - 1.6 μm planar waveguide
platform, form
birefringence

Ph.D. Thesis – Qingyi Guo; McMaster University – Electrical & Computer Engineering
31
3.2 Structure and Working Principle
3.2.1 Structure
A schematic structure of our proposed PBS design is shown in Figure 3-1. The
light is vertically confined (along the x direction) by the SOI slab waveguide in the x-y
plane [57]. By three etching steps, the top layer can be etched with different thicknesses,
as shown in the inset of Figure 3-1. Mesas with different heights are formed, where large
heights provide high effective refractive indices. In Figure 3-1, area D is the platform
background. Area A’s are input – output waveguides. Area B’s are lenses designed to
collimate and refocus light beams. Area C is a wedge constructed by a subwavelength
grating, where two strip mesas with effective refractive indices nh and nl are stacked
along the y direction.
3.2.2 Form Birefringence
From the effective medium theory, when the subwavelength grating period Λ is
much smaller than the light wavelength λ, the grating can act as homogeneous
birefringent material [59]. For the TM polarized wave, the electric field E is along the x
axis, and is continuous at the grating boundaries. Thus, the effective refractive index of
the grating area is simply the weighted average of the high-part index and low-part index
for the TM wave. For the TE wave, E is along the y axis, and the displacement field n2E
is continuous at the grating boundaries. Compared to the TM wave, a larger portion of the
TE wave’s electric field resides in the low-index part; therefore, the effective refractive
index of the TE wave is lower than that of the TM wave in the grating area.

Ph.D. Thesis – Qingyi Guo; McMaster University – Electrical & Computer Engineering
32
Fig
ure
3-1
Sch
emat
ic s
truct
ure
of
the
pro
pose
d P
BS
. In
set:
Cro
ss s
ecti
on v
iew
of
the
slab
wav
eguid
es f
or
dif
fere
nt
area
s.

Ph.D. Thesis – Qingyi Guo; McMaster University – Electrical & Computer Engineering
33
In this chapter, we also use X-polarization (X-pol) to indicate the TM mode, and
Y-polarization (Y-pol) to indicate the TE mode.
Here is a simple derivation for the form birefringence. As shown in Figure 3-2,
the subwavelength grating is composed of alternating strips of high index medium and
low index medium, whose dielectric constants are h and l , respectively. is the strip
width of the high index medium. is the grating period. The light is incident from the
left to the right, whose wave vector k is along the z-axis. The electric field E has x-
direction and y-direction components.
xE
zk
yE
h
l
…
Figure 3-2 Structure of the subwavelength grating.

Ph.D. Thesis – Qingyi Guo; McMaster University – Electrical & Computer Engineering
34
If the grating period , we can treat any incident wave as a plane wave.
Along the x-direction, the E-field is continuous; hence we have the average displacement
along this direction:
[ ( ) ] /
[ (1 ) ]
x hx x lx x
hx lx x
D E E
E
(3.1)
where / is the grating duty cycle.
Along the y-direction, the displacement is continuous, hence we have the average E-field
along this direction:
[ / ( ) / ] /
[ / (1 ) / ]
y y hy y ly
hy ly y
E D D
D
(3.2)
Therefore, we find the 0th
order approximation as:
(1 )x hx lx (3.3)
and
1/ / (1 ) /y hy ly (3.4)
or
/ [ (1 ) ]y hy ly ly hy (3.5)
This will introduce a form birefringence with:
2
[ (1 ) ][ (1 ) ]
(1 )
(1 )( )
(1 )
x y
hx lx ly hy hy ly
ly hy
h l
l h
f f
f f
(3.6)

Ph.D. Thesis – Qingyi Guo; McMaster University – Electrical & Computer Engineering
35
Letting 0f
, we find
max ( 1)(1 )h l
h l
l h
(3.7)
if
h h l hopt
h l h l
nf
n n
(3.8)
or
1h l l
opt
h l
f
(3.9)
Therefore, if we want to make max as large as possible, we need to
(1) enlarge the ratio between h and l ;
(2) enlarge the product of h and l ;
(3) choose f as optf .
In the real device design, it is not necessary to utilize the largest index difference
max always, but this analytical formula provides a guideline for the maximum form
birefringence effect that we can possibly achieve.
The effective refractive indices for the TM and TE polarized waves can be written
as:
1/22 2
1/22 2
1
1/ 1/ 1
TM h TM l TM
TE h TE l TE
N n n
N n n
(3.10)

Ph.D. Thesis – Qingyi Guo; McMaster University – Electrical & Computer Engineering
36
where α is the grating duty cycle, i.e., the ratio of the width of a high effective index strip
to the period of the grating.
If Λ/λ > 1/10, Eq. (3.10) loses accuracy, but such form birefringence still exists as
verified by experiments [59] and the finite-difference time-domain (FDTD) simulations
[60], [61]. As an example, Figure 3-3 (a) is a subwavelength grating wedge, and the
FDTD-simulated field patterns are shown with a plane wave incident on it and deflected
to different angles for (b) the TM and (c) the TE polarizations. The top angle of the
wedge is 30 degrees. The high and low strip widths of the wedge are 300 nm and 75 nm,
respectively. The refractive indices of the background are 3.147 for TM wave and 3.273
for TE wave. The refractive indices of the high strip are 3.447 for TM wave and 3.452 for
TE wave. The refractive indices of the low strip are 1.062 for TM wave and 1.589 for TE
wave. These parameters and indices are chosen to be consistent with our PBS design. We
can see clearly that the incident TM and TE plane waves are deflected into different
directions by this wedge, demonstrating the different effective refractive indices for TM
and TE waves induced by the form birefringence.

Ph.D. Thesis – Qingyi Guo; McMaster University – Electrical & Computer Engineering
37
Fig
ure
3-3
(a)
The
subw
avel
ength
gra
ting w
edg
e. (
b)
The
TM
and (
c) t
he
TE
fie
ld d
istr
ibuti
ons
for
a pla
ne
wav
e
inci
den
t on t
he
wed
ge.
The
hig
h a
nd l
ow
str
ip w
idth
s of
the
wed
ge
are
300 n
m a
nd 7
5 n
m, re
spec
tiv
ely
.

Ph.D. Thesis – Qingyi Guo; McMaster University – Electrical & Computer Engineering
38
3.2.3 Diffractive Optics
We can design the preliminary layout structure by the diffractive optics-based
analysis in the y-z plane. As depicted in Figure 3-1, the incoming light with both
polarizations is coupled to the input ridge waveguide, with the guided mode profile fm (y).
The light beam then expands into the y-z plane to the first lens in area B, and is
collimated to a wide plane wave like beam at the exit. For an ideal system, lenses act as a
space Fourier transformer. Thus, after the first lens, the field profile fL1 (y) is the Fourier
transform of fm (y). The TM- and TE-collimated beams are further deflected by the wedge
to different directions. The field profile after the wedge, fw (y), is obtained by multiplying
fL1 (y) with a linear phase shift p (y) along the y axis
1 exp
exp 2
w L
m
f y f y jp y
F f y j C pol y
(3.11)
where F[·] indicates the Fourier transform, and C(pol) is a polarization dependent
coefficient approximated by
0 // tan / , for TM/TE modeTM TE wC TM TE n N (3.12)
Here n0 is the effective index of the platform, and θw is the top angle of the wedge. The
TM and TE waves are then refocused by the second lens to different positions along the y
axis. At this focal line, the field profile fL2 (y) is the inverse FT of fw (y)
1
2 exp 2
L m
m
f y F F f y j C pol y
f y C pol
(3.13)

Ph.D. Thesis – Qingyi Guo; McMaster University – Electrical & Computer Engineering
39
where F-1
[·] indicates the inverse Fourier transform. Finally, the output waveguides
collect the polarized beams at separate locations.
To sum up for this section, this planar PBS design can be realized by different
material systems, and is compatible with other slab waveguide based optical components.
The device only involves phase changes at the wave front; hence it inherently has a low
insertion loss.
3.3 Design Procedure
We choose SOI as the material platform, i.e., crystalline silicon as the substrate,
fused silica as the cladding, and amorphous silicon as the guiding layer. If desired, our
PBS design can be implemented on other material systems. The effect of the intrinsic
material anisotropy of the silicon guiding layer is not considered.
3.3.1 Material Indices
We adopt the Si and SiO2 material indices in [62]-[64]. The dispersion curve of
amorphous Si is shown in Figure 3-4. The material indices of Si and SiO2 in the optical
band of 1.5 μm to 1.6 μm are shown in Table 3-3.

Ph.D. Thesis – Qingyi Guo; McMaster University – Electrical & Computer Engineering
40
Figure 3-4 The refractive index of amorphous Si [64].
Table 3-3 Material indices of Si and SiO2 in the optical band of 1.5 μm to 1.6 μm.
λ(µm) n(SiO2) n(Si)
1.5 1.445 3.486
1.525 1.444 3.483
1.55 1.444 3.480
1.575 1.444 3.477
1.6 1.443 3.473

Ph.D. Thesis – Qingyi Guo; McMaster University – Electrical & Computer Engineering
41
3.3.2 Effective Indices
The SOI slab waveguide structure is shown in Figure 3-5. We use the transfer-
matrix method (TMM) to calculate the TE and TM mode profiles and effective indices
for the SOI slab waveguide [65], [66].
Figure 3-6 shows the mode profiles for the SOI slab waveguide with cladding
layer thickness of 0.5 μm, guiding layer thickness of 0.5 μm, at the wavelength of 1.55
µm. (a) is the mode profile for TM mode, and (b) is for TE mode.
Cover: Air
Guiding layer: Si
Cladding layer: SiO2
Substrate: Si
Figure 3-5 Slab waveguide structure of SOI.

Ph.D. Thesis – Qingyi Guo; McMaster University – Electrical & Computer Engineering
42
(a)
(b)
Figure 3-6 Mode profile for a SOI slab waveguide with cladding layer thickness of
0.5 μm, guiding layer thickness of 0.5 μm, at the wavelength of 1.55 µm.
(a) TM mode. (b) TE mode.
-0.5 0 0.5 1 1.50
0.1
0.2
0.3
0.4
0.5
0.6
0.7
0.8
0.9
1TM mode profile, =1.55m
Norm
aliz
ed a
bs(E
y)
Transverse Length (um)
-0.5 0 0.5 1 1.50
0.1
0.2
0.3
0.4
0.5
0.6
0.7
0.8
0.9
1TE mode profile, =1.55m
Norm
aliz
ed a
bs(E
y)
Transverse Length (um)
Substrate:
Si
Cladding:
SiO2 Guiding:
Si
Cover:
Air
Substrate:
Si
Cladding:
SiO2 Guiding:
Si
Cover:
Air

Ph.D. Thesis – Qingyi Guo; McMaster University – Electrical & Computer Engineering
43
As can be seen from Figure 3-6, the majority of the mode profile is concentrated
in the Si guiding layer, and the intensity of the mode quickly decays in the cladding and
cover layers. Therefore, the guiding layer thickness controls the effective mode index.
We then study the effective indices of the fundamental TM and TE mode as a function of
the Si guiding layer thickness, as shown in Figure 3-7. The difference of the effective
indices between the TM and TE mode is shown in Figure 3-8.
For the etched area in the wedge, shown as area C low in Figure 3-1, the Si
guiding layer is very thin or does not even exist. Therefore, no guided mode is supported
in this area. We can obtain its approximate effective index by calculating the mode
profile in the background, i.e. area D in Figure 3-1, weighted by the index profile in the
etched low index area of the wedge.
For TE mode,
2
2 y
eff
y
n x E x dxn
E x dx
(3.14)
For TM mode,
2
2
y
eff
y
H x dxn
H xdx
n x
(3.15)
where Ey and Hy are the mode profiles in the background for TE and TM, respectively;
n(x) is the index profile for the etched low index area of the wedge.

Ph.D. Thesis – Qingyi Guo; McMaster University – Electrical & Computer Engineering
44
Figure 3-7 Effective TM and TE mode indices of SOI slab waveguide as a function of Si
guiding layer thickness.
0.2 0.4 0.6 0.8 1 1.2 1.4 1.6 1.81.5
2
2.5
3
3.5
Thickness of Si Guiding Layer (m)
Effe
ctive
In
de
x o
f F
un
da
me
nta
l M
od
e
TM mode
TE mode

Ph.D. Thesis – Qingyi Guo; McMaster University – Electrical & Computer Engineering
45
Figure 3-8 Difference of the effective TM and TE mode indices of SOI slab waveguide as
a function of Si guiding layer thickness.
0.2 0.4 0.6 0.8 1 1.2 1.4 1.6 1.80
0.2
0.4
0.6
0.8
1
1.2
1.4
Thickness of Si Guiding Layer (m)
Diffe
ren
ce
in
Effe
ctive
In
de
x o
f F
un
da
me
nta
l M
od
e
Neffs(TE-TM)

Ph.D. Thesis – Qingyi Guo; McMaster University – Electrical & Computer Engineering
46
Using Si guiding layer with a thickness of 0.5 μm as the background, we can
calculate the effective index of the etched low index wedge area as a function of the
etching depth from the background, shown in Figure 3-9, at the wavelength of 1.55 μm.
Two factors must be considered when choosing the proper thickness of the Si
guiding layer for different areas in the PBS: 1) Different areas must have enough
difference in the effective refractive indices, so that each area can manipulate light wave
effectively as a functional block. Thus, the Si guiding layer in each area would require a
different thickness. 2) For TM and TE wave, the different behavior should come from the
wedge of the form birefringence. For the other parts of the PBS, the difference in the
refractive indices for TM and TE waves should not be too large, since the other parts are
supposed to function the same for TM and TE waves, and we want a similar PBS
performance for TM and TE waves.
Therefore, the thickness of each layer for different areas is designed as: the
cladding layer 0.5 μm; the guiding layer 0.52 μm for area A, 1.6 μm for B and C high, 0.1
μm for C low, and 0.5 μm for D.
To sum up for the effective index calculation: Using TMM, we can extract the
effective refractive indices of the corresponding slab waveguide in the vertical direction
for different areas in Figure 3-1. We then calculate the effective indices in the wedge
grating area using Eq. (3.10) for the TM and TE waves, respectively. Those effective
indices obtained are listed in Table 3-4 for the wavelength of 1.55 μm.

Ph.D. Thesis – Qingyi Guo; McMaster University – Electrical & Computer Engineering
47
Figure 3-9 The effective index of the etched low index wedge area as a function of the
etching depth from the background, at the wavelength of 1.55 μm.
0 0.1 0.2 0.3 0.4 0.5 0.6 0.7 0.8 0.9 11
1.5
2
2.5
3
3.5
Etch Depth of the Background (m)
Effe
ctive
In
de
x
TM mode
TE mode

Ph.D. Thesis – Qingyi Guo; McMaster University – Electrical & Computer Engineering
48
Table 3-4 Device structure parameters at 1.55 μm
TM (X-pol) TE (Y-pol)
Platform effective refr. index n0 3.147 3.273
Waveguide effective refr. index 3.172 3.285
Lens effective refr. index
High strips of wedge effective refr. index nh
3.447
3.447
3.452
3.452
Low strips of wedge effective refr. index nl 1.062 1.589
Duty cycle of wedge grating α 0.8
Wedge effective refr. index N 3.119 2.614
Wedge top angle θw (degrees) 30
Lens aperture (μm) 50
Lens major radius to minor radius ratio 3.14
Lens 1 (collimating) focal length (μm) 115.0
Lens 2 (refocusing) focal length Lf2 (μm) 80.5 156.5
Lens 2 major axis rotate anglea (degrees) 4.0
Output beam deflecting anglea (degrees) 0.8 6.0
Input waveguide width (μm) 3.8
Output waveguide width (μm) 1.8 3.8
Device width (μm)
Device length (μm)
80
300
Note that refr. stands for refractive. aAngles are measured with respect to z-axis.

Ph.D. Thesis – Qingyi Guo; McMaster University – Electrical & Computer Engineering
49
3.3.3 Lens Design
The lenses’ shapes are derived to be elliptical [57]. A schematic diagram of a lens
structure with an aperture D is shown in Figure 3-10.
Figure 3-10 Schematic diagram of a lens structure.
The refractive indices inside and outside the lens structure are denoted by n2 and
n1, respectively. According to the ray optics theory [67], the lens should be shaped in
such a way that the collimated light coming from the left to the right is focused at the
point f or vice versa, i.e. optical paths of the rays in the collimated beam should be all
equal. This is shown in Eq. (3.16).
2 2
2 1 0 2 0 0( ) [ ( )]n f n l x n f l x x (3.16)
This can be rewritten in the following form

Ph.D. Thesis – Qingyi Guo; McMaster University – Electrical & Computer Engineering
50
2 2
0 0
2 2
[ ( ) ]1
l x a x
a b
(3.17)
where
2
1 2
2 1
1 2
n fa
n n
n nb f
n n
(3.18)
We can see that the lens takes an elliptical shape with a as the long axis and b as
the short axis. This provides a guideline to our lens design, while the parameters need to
be adjusted with the field distribution calculated by BPM.
The TM and TE beams have different effective indices throughout the device;
therefore the focal length of the second lens needs to be adjusted separately for each
polarization. Since the focal length for the TE wave is larger, we design the second lens
according to the TE wave, cut out the excess part from the TM focal line, and place the
output waveguide for the TM wave. Increasing the distance between the two lenses will
slightly degrade the performance of the PBS, and also unnecessarily enlarge its length.
We choose this distance to be 24 μm in order to fit in the wedge.
3.3.4 Wedge and Waveguide Design
For the wedge, a proper beam splitting angle must be obtained by controlling nl, α
and θw. If the splitting angle is too small, a large portion of the TM and TE beam profiles
are overlapped, and therefore the crosstalk and insertion loss are high. If the splitting
angle is too big, it requires further etching down of the layers to get a small nl, and the

Ph.D. Thesis – Qingyi Guo; McMaster University – Electrical & Computer Engineering
51
scattering loss for the TE wave is high since its deflected angle is large. The grating duty
cycle α was chosen to be slightly offset from the value generating the largest index
difference between the two polarizations in order to make the deflected angle and thus,
loss of the TE wave, smaller.
The widths of the input and output waveguides are designed to minimize the
insertion loss and crosstalk. The input waveguide width is 3.8 μm, and supports 2 modes
for both TM and TE polarizations. For the output waveguide, the TE output port is 3.8
μm in width, where 2 modes can exist. In this way, more lightwave can be collected for
TE mode, so that the insertion loss of the device can be reduced. The waveguide of TM
output port is 1.8 μm in width, supporting only 1 mode. As can be seen in the field
distribution in Figure 3-12 (b), the TM polarization is well re-focused by the second lens
into a narrow profile, thus the output waveguide of a small width can guarantee a small
insertion loss for TM mode, and a small crosstalk at the same time.
With all the considerations in mind, the structure is designed with its parameters
summarized in Table 3-4 for the operating wavelength of 1.55 μm.
3.4 Simulation
3.4.1 Simulation Setup of 2-D Beam Propagation Method (BPM)
We use the wide-angle 2-D beam propagation method (BPM) with eight perfectly
matched layers (PMLs) [68] to numerically simulate the field distribution. The structure
setup for 2-D BPM is shown in Figure 3-11.

Ph.D. Thesis – Qingyi Guo; McMaster University – Electrical & Computer Engineering
52
Fig
ure
3-1
1 T
he
2-D
str
uct
ure
of
the
pola
riza
tion s
pli
tter
.

Ph.D. Thesis – Qingyi Guo; McMaster University – Electrical & Computer Engineering
53
Fig
ure
3-1
2 T
op v
iew
fie
ld d
istr
ibuti
on b
y 2
-D B
PM
sim
ula
tion f
or
(a)
the
TM
and (
b)
TE
pola
riza
tions
at 1
.55 µ
m.
(a)
(b)

Ph.D. Thesis – Qingyi Guo; McMaster University – Electrical & Computer Engineering
54
The BPM algorithm here does not need to deal with large index variations, since
we adopted low effective-index contrast in the design for low reflection and scattering.
The scheme factor is set to 0.5, and the wide-angle Pade order is 2.
Since we adopted low effective-index contrast, the loss due to the Fresnel
reflection on the interfaces is not very significant. Assume that the reflective indices of
two medium are n1 and n2, respectively. The loss due to the interface reflection between
these two medium can be roughly estimated by the power reflectivity for normal
incidence using [(n1-n2)/(n1+n2)]2, since the deflected angle is 6 degrees or less in our
PBS. By cascading the interface reflection throughout the device, this loss is calculated to
be 0.033 dB for TM and 0.121 dB for TE. Therefore, we did not count in the Fresnel
reflection loss.
3.4.2 Simulation Results at the Wavelength of 1.55 μm
The corresponding fields (top view) for the TM and TE polarizations are shown in
Figure 3-12 (a) and (b), respectively, at the wavelength of 1.55 μm.
The insertion loss and crosstalk are calculated from the optical powers measured
at the input and output ports. At the input port, the fundamental mode is launched. For
TM output port, only one mode is supported. For the TE output port, two modes are
supported.
The insertion loss can be calculated as the ratio of the output power to input
power for TM and TE modes, respectively, as shown below

Ph.D. Thesis – Qingyi Guo; McMaster University – Electrical & Computer Engineering
55
modes
10 10
2
10log 10log2
outout
inin
AP
ILP
A
(3.19)
where is the amplitude of modesA .
The crosstalk is defined as the ratio of the power measured at the undesired output
port to the power measured at the desired output port.
1010log undesired
desired
PCT
P
(3.20)
For TM mode, we launch TM (X-pol) mode at the input waveguide, and measure
the power at the TE output port X TEP
and the power at the TM output port X TMP
. The
crosstalk can be calculated as
2 2
1 2
10 10 210log 10log X TE X TEX TE
X pol
X TM X TM
A APCT
P A
(3.21)
where the subscript 1X TE denotes that the input is the fundamental TM mode (X-
pol), and the output is the fundamental TM mode measured at the TE output port (TE1).
The 2TE in the subscript denotes that the output is the second order TM mode measured
at the TE output port.
For TE mode, we launch TE (Y-pol) mode at the input waveguide, and measure
the power at the TM output port Y TMP
and the power at the TE output portY TEP
.
Similarly, the crosstalk can be calculated as
2
10 10 2 2
1 2
10log 10log Y TMY TM
Y pol
Y TE Y TE Y TE
APCT
P A A
(3.22)

Ph.D. Thesis – Qingyi Guo; McMaster University – Electrical & Computer Engineering
56
The results at the wavelength of 1.55 μm are summarized in Table 3-5.
3.4.3 Band Performance
The optical band performance of the PBS relies on the material dispersion and
waveguide dispersion. Here we summarize the material indices (indicated by n) and
effective indices (indicated by N) in Table 3-6. d_Si denotes the thickness of the Si
guiding layer.
We calculate the insertion loss and crosstalk in the optical band from 1.5 μm to
1.6 μm, and plot the results in Figure 3-13. We can see that our PBS has a good band
performance with insertion loss less than 0.9 dB and crosstalk below -30 dB in this
optical band.
Table 3-5 Device characteristic parameters
Simulated performance at 1.55 μm Value (dB)
Insertion loss of the TM polarization 0.283
Insertion loss of the TE polarization
Crosstalk of the TM polarization
0.595
-32.1
Crosstalk of the TE polarization -32.2

Ph.D. Thesis – Qingyi Guo; McMaster University – Electrical & Computer Engineering
57
Table 3-6 Material indices and effective indices for different areas in the polarization
splitter in the optical band of 1.5 μm to 1.6 μm.
λ(µm) n(SiO2) n(Si) Background
(Area D)
d_Si
= 0.5 µm
Waveguide
(Area A)
d_Si
= 0.52 µm
Lens and
Wedge high
(Area B)
d_Si
= 1.6 µm
Wedge
low
(Area C)
d_Si
= 0.1 µm
Wedge
(α =0.8)
1.5 1.445 3.486 N(TM):
3.175
N(TM):
3.198
N(TM):
3.455
N(TM):
1.061
N(TM):
3.126
N(TE):
3.290
N(TE):
3.301
N(TE):
3.459
N(TE):
1.589
N(TE):
2.616
1.525 1.444 3.483 N(TM):
3.161
N(TM):
3.185
N(TM):
3.451
N(TM):
1.062
N(TM):
3.123
N(TE):
3.281
N(TE):
3.293
N(TE):
3.456
N(TE):
1.589
N(TE):
2.615
1.55 1.444 3.480 N(TM):
3.147
N(TM):
3.172
N(TM):
3.447
N(TM):
1.062
N(TM):
3.119
N(TE):
3.273
N(TE):
3.285
N(TE):
3.452
N(TE):
1.589
N(TE):
2.614
1.575 1.444 3.477 N(TM):
3.133
N(TM):
3.159
N(TM):
3.443
N(TM):
1.063
N(TM):
3.116
N(TE):
3.265
N(TE):
3.277
N(TE):
3.448
N(TE):
1.590
N(TE):
2.613
1.6 1.443 3.473 N(TM):
3.118
N(TM):
3.145
N(TM):
3.438
N(TM):
1.063
N(TM):
3.112
N(TE):
3.255
N(TE):
3.268
N(TE):
3.443
N(TE):
1.590
N(TE):
2.612

Ph.D. Thesis – Qingyi Guo; McMaster University – Electrical & Computer Engineering
58
Figure 3-13 Insertion loss and crosstalk of the PBS in the band 1.5 μm - 1.6 μm.
1.5 1.51 1.52 1.53 1.54 1.55 1.56 1.57 1.58 1.59 1.60
0.2
0.4
0.6
0.8
1
Wavelength (m)
Inse
rtio
n L
oss (
dB
)
TM mode
TE mode
1.5 1.51 1.52 1.53 1.54 1.55 1.56 1.57 1.58 1.59 1.6-40
-35
-30
-25
-20
Wavelength (m)
Cro
ssta
lk (
dB
)
TM mode
TE mode
Ph.D. Thesis – Qingyi Guo; McMaster University – Electrical & Computer Engineering
59
The most sensitive thickness of the guiding silicon layer in this PBS design is that
of area A, the input and output waveguides. At the operating wavelength of 1.55 μm, a
(+/-) 10 nm variation of the guiding layer thickness will only increase the insertion loss
by less than 0.17 dB, and the crosstalk remains below -30 dB. This submicron etching
accuracy on SOI can be achieved by using the inductively coupled plasma reactive ion
etching (ICP-RIE) with proper gas chemicals [69].
3.5 Summary
We have designed and numerically simulated a newly proposed PBS device based
on a planar waveguide platform. A wedge made of a subwavelength grating utilizes the
form birefringence to enlarge the effective refractive index difference between the TM
and TE polarizations, and splits the two polarization beams to different directions. The
insertion loss is less than 0.9 dB for the designed operating wavelength band of 1.5 μm to
1.6 μm. The crosstalk between the two polarizations is below -30 dB. The whole device
size is 300 μm × 80 μm, and can potentially be further reduced by improving the lens
design. This PBS device can be readily fabricated by lithography and etching, and can be
monolithically integrated with other optical components on the same platform. This
design can also be extended to other material systems and other wavelength bands to
meet the required specifications.

Ph.D. Thesis – Qingyi Guo; McMaster University – Electrical & Computer Engineering
60
Chapter 4.
Investigation of Mode Partition Noise in Fabry-Perot
Laser Diode
4.1 Introduction
As stated in the earlier chapters, the passive optical network (PON) is a cost-
efficient solution to the last-mile bottleneck in optical communication networks. And to
further reduce the cost per subscriber, a Fabry-Perot (FP) laser diode (LD) is preferred as
the transmitter at the optical network units (ONUs) because of its lower cost compared to
distributed feedback (DFB) LD. However, the mode partition noise (MPN) associated
with the multi-longitudinal-mode FP-LD becomes the limiting factor in the network.
Here we review the previous works on the study of MPN, including the
theoretical analysis, experimental measurements, and suppression schemes of MPN.
The instantaneous power of each longitudinal mode in the laser diode fluctuates
even though the total power of laser diode remains relatively constant. This is caused by
the mode competition in the laser cavity where various modes compete for a common
injected carrier population. This phenomenon is called the mode partition noise (MPN).
In the absence of fiber dispersion, MPN would be negligible as all the modes propagate
synchronously. However, when chromatic dispersion is present, different modes travel at

Ph.D. Thesis – Qingyi Guo; McMaster University – Electrical & Computer Engineering
61
slightly different speeds along the fiber, leading to the distortions at the decision instant.
MPN can even cause the bit error rate (BER) floor, where the system performance will
not improve even though the received power increases. In this case, MPN becomes the
dominant limiting factor in an optical transmission system. Therefore, it is necessary to
pay more attention to the effects of MPN in laser transmission systems, especially for 2.5
Gbit/s and 10 Gbit/s high-speed transmission application with multi-mode FP-LD,
because the fiber dispersion penalty will be significantly enhanced when MPN is
remarkable.
A simple mathematical model of MPN was derived by Okano et al. in 1980 [70],
in which the Q-factor and power penalty caused by MPN were formulated, and infinite
power penalty was presented. However, in the derivation of MPN model, the joint
probability distribution of the powers of various longitudinal modes was assumed known,
while in practice it is hard to obtain the knowledge of the probability characteristic of
laser modes. A more general and practical model of MPN was proposed by Ogawa in
1982 [71], [72], and MPN was evaluated by calculating or measuring the mode partition
coefficient, k-factor, that indicates the degree of mode fluctuation. This method avoids
using the knowledge of probability distribution of longitudinal modes, and the critical
assumption of this model is that all the modes are contributed by stimulated emission
only. A close-form of variance of MPN was also presented by supposing the use of
cosine waveform for each longitudinal mode [71]. The mode-resolved distributions were
shown both for the main mode and the side modes by Ogawa in 1984 [73], and the
probability of the side modes to carry a significant portion of the total optical power was

Ph.D. Thesis – Qingyi Guo; McMaster University – Electrical & Computer Engineering
62
studied. In Ogawa's works, the statistics of longitudinal mode powers were considered
only within the symbol duration. Campbell studied the correlations between the mode
powers for different symbol periods [74], and he further completed the mathematical
model of MPN.
D. Marcuse developed the numerical simulation method of solving the Langevin
noise driven rate equations for a single-cavity laser diode, and presented the probability
distribution of each longitudinal mode obtained from photon counting statistics in 1984
[75], [76]. Marcuse showed that the photon probability distribution narrows with
increasing gain saturation parameter, decreasing cavity distributed loss, increasing bias
current, increasing output power, and decreasing laser length. Besides, if two modes are
symmetrically located at either side of the gain peak, they will compete for optical power,
resulting in a wide flat photon probability distribution for these two modes. Thus,
decreasing the gain peak offset from the central longitudinal mode can narrow the photon
probability distribution. It was also noticed that when the injection current is modulated
with pulses, multi-modes will be present at the turn-on transient, and the central mode
may carry less power than one of its neighboring mode if the pulse is very short. Nguyen
followed this approach, and used a noise-driven 21-mode rate equation laser model for
simulations [77]. He showed that increasing the gain compression factor, also noted as
self-saturation, can suppress MPN, and the central modes would have Gaussian
probability distribution regardless of the material gain peak offset from the cavity modes.
He also showed that asymmetric nonlinear gain alters the mode distributions, but its
effect on MPN is weaker than that of the self-saturation.

Ph.D. Thesis – Qingyi Guo; McMaster University – Electrical & Computer Engineering
63
In the past ten years, several groups have investigated on the mode hopping (or
switching) dynamics for semiconductor lasers. M. Ahmed and M. Yamada performed
extensive simulations of noise-driven multi-mode rate equations, and classified the laser
operation into four regimes, i.e. stable single mode, jittering single mode, stable multi-
mode, and hopping multi-mode [78]. They found that the laser operation regime depends
on the injection current and the linewidth enhancement factor (α). When the injection
current is slightly above the threshold current, the laser operates in the stable multi-mode
regime. If both the injection current and the α-factor are large, the laser will most likely
to operate in the hopping multi-mode regime. This regime is featured with periodic
rotation of four lasing modes even without laser Langevin noise, with a repeating
frequency in the 10 megahertz range. The lasing mode follows the switching sequence
from the blue to red, and then restarts from the bluest mode. The Langevin noise causes
the instant power fluctuations, and slightly modulated the rotation frequency. And the
Langevin noise can also stimulate the mode rotation even when the deterministic
simulation shows stable multi-mode operation, as shown for the case of an InGaAsP laser
with α-factor of 4 and injection current twice the threshold. Time-dependent experiment
measurements proved this periodic multi-mode switching behavior [79]-[81]. The origin
of this periodic mode switching is the large spectral asymmetry in the cross-saturation
coefficient due to the asymmetric material gain spectrum. This asymmetry can be
induced by a large linewidth enhancement factor, and/or a large differential material gain
coefficient [78]-[81]. The quantum-well lasers are more prone to this mode switching
dynamics than the bulk lasers [81].

Ph.D. Thesis – Qingyi Guo; McMaster University – Electrical & Computer Engineering
64
With the increasing demand for data rate in fiber-optic communications, the effect
of fiber dispersion on the performance of lightwave systems using multimode
semiconductor laser becomes a challenging issue for long-distance transmission in optical
communications. The presence of MPN in laser transmission systems with dispersive
fibers leads to remarkable performance degradation. Many important researches have
been carried out in the past thirty years to study the interaction of MPN with fiber
dispersion. G. P. Agrawal investigated the dispersion penalty for a 1300-nm lightwave
system with multimode semiconductor laser [82], and presented a more general
expression of variance of MPN based on cosine waveforms as compared to that given by
Ogawa in [71]. In his study, the acceptable range of wavelength deviation to the zero-
dispersion wavelength was calculated for different values of k. He also stated that the
numerical value of k is relatively uncertain and depends on many parameters such as bit
rate, modulation depth and the spectral width. So, he assigned the typical k values in the
range of 0.5 to 1.0, as suggested by the experimental measurements in his calculations of
MPN. MPN-induced impairments were extensively studied in different ways. Cheung et
al. developed an empirical formula that relates the bit rate and distance for a dispersion-
limited system when MPN was considered, in which the multimode InAsGaP/InP laser
was operating at 1500 nm [83]. Wentworth et al. presented theoretical expressions for the
MPN spectra for the light from a nearly single-mode or strongly multimode
semiconductor laser after passing through a length of dispersive fiber [84]. The
relationship between the mode partition constants presented by Okano [70] and laser
diode characteristic was clarified using rate equations by Iwashita and Nakagawa [85].

Ph.D. Thesis – Qingyi Guo; McMaster University – Electrical & Computer Engineering
65
They showed that the mode partition noise is independent of the wavelength and the
structure of the Fabry-Perot type laser diodes. MPN is also studied for single-mode lasers.
Shen and Agrawal analyzed the mode partition noise in single-frequency semiconductor
lasers by relating the variance of MPN with mode suppression ratio (MSR), and they
claimed that MPN in single-frequency lasers may not be an issue when a large MSR is
achievable (> 1000) [86]. It was also demonstrated by Lathi et al. that suppressing the
side modes can reduce both MPN and the total noise [87]. The effect of MPN is also
determined by the number of longitudinal modes, which was studied by Wang and Chan
[88]. They presented that to achieve error-free transmission at 1 Gbit/s with free-running
gain-switched FP laser, a sufficiently large number of modes should be generated. In
their work, at least 9 modes in laser can guarantee the error-free performance.
Among those studies, J. C. Cartledge did a complete research on MPN and its
performance implications in the link using both statistical formula model and rate
equation simulations for directly modulated nearly-single-longitudinal-mode lasers [89]-
[91]. He demonstrated that the floor in the probability of error curve for MPN is
dependent upon a variety of laser and link parameters, as summarized below:
a) Laser parameters.
Threshold gain difference between the lasing mode and the dominant
side mode.
Gain compression factor.
Spontaneous emission coefficient.
Mode wavelength separation, i.e. mode spacing.

Ph.D. Thesis – Qingyi Guo; McMaster University – Electrical & Computer Engineering
66
b) Modulation characteristics.
Laser bias current and modulation current pulse shape.
Encoding format, i.e. non-return-to-zero (NRZ) and return-to-zero
(RZ).
Bit pattern, particularly for the NRZ.
Bit rate.
c) Fiber dispersion and length.
d) Clock recovery in the receiver, i.e. sampling time.
We can see that a) and b) relate to the transmitter, where a) is the intrinsic laser
parameter, and b) is the operating condition. c) is the fiber characteristic, and d) is at the
receiver end. Thus, the MPN impact in a network really depends on the whole link.
In addition, MPN in wavelength-division multiplexing (WDM) systems was
investigated. Clarke analyzed the MPN caused by the sharp cut-off optical filters
employed in demultiplexers, and presented that low-power modes made significant
contribution to MPN [92]. Another work on MPN in WDM systems by Anandarajah et al.
was focused on the cross-channel interference introduced by MPN. In a 2-channel WDM
system spaced by 10 nm, the cross-channel interference was observed and the system
performance was degraded when the side mode suppression ratio of one of the sources
decreased [93]. The MPN in fiber lasers was also experimentally demonstrated by Liao
and Agrawal [94], and a numerical model was developed using the Langevin rate
equations. In one study that discussed the parameters affecting MPN in laser transmission
systems, it was shown that BER varies periodically when accumulated dispersion

Ph.D. Thesis – Qingyi Guo; McMaster University – Electrical & Computer Engineering
67
increases [95]. However, in other works, BER monotonously increases with the
accumulated fiber dispersion [96].
There are some literatures discussing about the suppression of MPN using the
reflective semiconductor optical amplifier (RSOA). RSOA enables a cost effective
transmitter in which the colorless amplification and signal modulation can be
implemented simultaneously [97]. This attractive feature makes it a strong candidate for
WDM-PON because the use of RSOA avoids the need of tunable laser sources at the
customer premises. Another important characteristic of SOA is its gain saturation effect,
which has been utilized to reduce the MPN. In a study completed by Sato and Toba, they
presented how to use a semiconductor optical amplifier (SOA) to reduce MPN with
mode-locked FP-LD [98]. In their work, the relative intensity noise (RIN) of the filtered
output from arrayed waveguide grating (AWG) showed an extreme increase of mode
partition noise at low frequencies. The SOA acted as a high-pass filter. After passing
through SOA, the MPN of the output signal at low frequencies was significantly
suppressed. Another implementation of SOA for the reduction of MPN was demonstrated
by Kim et al. In their work, simultaneous wired and wireless WDM radio-over-fiber (RoF)
transmission using FP-LD was presented, and RSOA was used both for the modulation of
certain channel data and for the reduction of MPN [99]. The simplest method to reduce
MPN was presented in the study by Mandridis et al. [100]. It was shown that the
correlated electrical mode partition noise of periodic electrical signal can be suppressed
when the electrical signal is first up-converted to optical domain, and then passes through
a photodiode (PD). PD acts as an optical frequency mixer, such that the output of PD is

Ph.D. Thesis – Qingyi Guo; McMaster University – Electrical & Computer Engineering
68
the mixing of all the neighboring components of the optical spectrum, leading to the
cancellation of MPN.
The MPN impact of FP-LD in PON technology has also been explored, as well as
using forward error correction (FEC) to effectively mitigate it. Yi et al. studied the MPN
in a 1.25 Gb/s burst-mode gigabit passive optical network (GPON), and they showed via
simulations and experimental measurements that FEC can provide a 2.7 dB effective
optical gain when MPN dominates [27]. Pato et al.’s work in 2007 investigated the
impact of MPN on the performance of upstream transmission of 10 Gb/s Ethernet passive
optical networks (EPON) with FP-LDs in optical network units (ONU) [101]. They have
shown that a 1.5 dB gain from FEC is achieved at the BER of 10-12
. The conclusion was
made that if commercially available FP-LDs are employed, to enable up to 20 km
transmission, one must reduce the source spectral width and fiber dispersion. However, if
FEC is applied, the achieved receiver power gain can be translated to less stringent
requirement for source spectral width and/or fiber dispersion.
In this chapter, we will investigate the MPN characteristics of FP laser diode
using the time-domain simulation of noise-driven multi-mode laser rate equation. The
probability density functions are calculated for each mode. The k-factor is a simple yet
important measure for the noise power, and it is related with the power penalty of MPN
in analytical formulas. However, it is usually a fitted or assumed value in the penalty
simulations. In this chapter, the sources of the k-factor are studied with simulation,
including the intrinsic source of the laser Langevin noise, and the extrinsic source of the
bit pattern.

Ph.D. Thesis – Qingyi Guo; McMaster University – Electrical & Computer Engineering
69
4.2 Noise-driven Multi-mode Laser Rate Equation
Jensen et al. used a set of multimode rate equations with Langevin noise terms to
model the FP laser [102], and we follow their model in our simulation.
i i N
i
dNJ R N G N S F t
dt (4.1)
21ii i i i
p
dSG N S BN F t
dt
(4.2)
Here N is the carrier number, iS is the photon number in the i-th longitudinal mode, J
is the pump in the unit of electrons/second, R N is the total spontaneous recombination
rate, is the mode confinement factor, p is the photon lifetime, i is the fraction of
spontaneous emission coupled into mode i, B is the band-to-band recombination
coefficient. NF t and iF t are Langevin noise terms.
The gain iG N is modeled as homogenous broadening with a parabolic spectral
dependence, and it is linearly dependent on the carrier number.
2
0 1 2 Di N
G
G N G N N i
(4.3)
where NG is a gain coefficient, 0N is the carrier number at transparency, D is the
longitudinal mode spacing, and G is the full width at half maximum (FWHM) of the
gain curve. The assumption here is that the central mode is located at the gain maximum,

Ph.D. Thesis – Qingyi Guo; McMaster University – Electrical & Computer Engineering
70
and the wavelength shift with carrier number is neglected. Also the gain width is assumed
to be constant.
The recombination rate R N is modeled as
2 3R N AN BN CN (4.4)
where the constants A, B, and C represent the recombination via traps or surface states,
band-to-band recombination, and Auger recombination, respectively. Only the band-to-
band recombination is radiative, and this term is included in Eq. (4.2).
The spontaneous emission coefficient i for i-th mode is modeled as
2
21
i
D
S
i
(4.5)
where
4
0
2 28 g r Sn n V
(4.6)
Here S is the FWHM width of the spontaneous emission spectrum, 0 is the central
wavelength, gn is the group refractive index, rn is the refractive index, and V is the
mode volume. We assume that the peak of the spontaneous emission is at the same
wavelength as the gain spectrum.
The Langevin noise source terms NF t and iF t are assumed to be Gaussian
random variables [75]. In the Markov approximation, their autocorrelation and cross
correlation functions can be expressed as

Ph.D. Thesis – Qingyi Guo; McMaster University – Electrical & Computer Engineering
71
2' '' ' ''N N NF t F t V t t (4.7)
2' '' ' ''i i i ijF t F t V t t (4.8)
' '' ' ''N i i N iF t F t rV V t t (4.9)
where ij is the Kronecker delta, and ' ''t t is the Dirac delta function. 2
NV and 2
iV
are the variances of NF and iF , respectively. ir is the correlation coefficient. We can see
that the photon numbers of different longitudinal modes are not directly related to each
other, but interact via the same carrier pool.
Each process term on the right-hand sides of Eq. (4.1) and (4.2) is a source of shot
noise, and the total variance of the Langevin noise is the sum of the variances of all the
corresponding shot noise. The gain term can be written as the net stimulated emission
shown in Eq. (4.10)
i i
i cv vcG N E E (4.10)
where i
cvE is the stimulated emission rate per photon in i-th mode, and i
vcE is the
absorption rate.
2i
cv iE BN (4.11)
Thus, the variances and correlation coefficients can be expressed as
2 i i
N cv vc i
i
V J R N E E S (4.12)
2 21i i
i cv vc i i i
p
V E E S S BN
(4.13)

Ph.D. Thesis – Qingyi Guo; McMaster University – Electrical & Computer Engineering
72
2i i
i N i cv vc i irV V E E S BN
(4.14)
Note that the electron and photon are anti-correlated, thus there is a minus sign in Eq.
(4.14). Using Eqs. (4.10) and (4.11), we can derive
22i i
cv vc i iE E BN G N (4.15)
Substituting Eq. (4.15) into Eqs. (4.12) to (4.14), we can obtain the variances and
correlation coefficients as a function of laser parameters.
To numerically solve this noise-driven multi-mode rate equation, we implemented
the 4th
-order Runge-Kutta method [103]. To handle the Langevin noise, we can express
the stochastic function in any time interval t as in the study by Marcuse [75]:
NN N
VF t x
t
(4.16)
21i ii i N i i
N
V VF t r F r x
V t
(4.17)
where Nx and ix are independent Gaussian random variables with mean 0 and standard
deviation 1. The integration time step is chosen to ensure the convergence of the rate
equation, and also to cover the whole frequency spectrum of the laser diode if the fiber
dispersion is to be accounted for.
4.3 Mode Probability Density Function and k-factor
In the theoretical analysis of MPN, the total photon number is assumed to remain
constant, whereas the photon numbers of the individual modes are randomly fluctuated.

Ph.D. Thesis – Qingyi Guo; McMaster University – Electrical & Computer Engineering
73
The photon number in the i-th mode is normalized by the average total output
power as
/i i i
i
a t S t S t (4.18)
where the bar represents the mean value.
k-factor for mode i is defined as [72]
2 2
2
2
i ii
i i
a ak
a a
(4.19)
The total k-factor is defined as
2 2
2
2
( )
( )
i i
i
i i
i
a a
ka a
(4.20)
The k-factor is in the range of 0 to 1. A k-factor of 0 means no mode partition, as
for the case of LED. A k-factor of 1 is the worst case, where a single mode is lasing, but
the frequency varies from the pulse-to-pulse power.
From the statistical analysis of noise, the normalized photon number ia has a β
probability density function (pdf), as expressed in Eq. (4.21) [70].
1 1 11
, 1
i i i ia a
i i
i
i i i i
a ap a
B a a
(4.21)
where ,B x y is the beta-function, and is a mode partition coefficient
2
11i
ik (4.22)
Ph.D. Thesis – Qingyi Guo; McMaster University – Electrical & Computer Engineering
74
For a real laser, the total photon number also fluctuates instead of being constant.
The normalized total photon number ta has a Gaussian pdf, as
2
2
11exp
22
t
t
ap a
(4.23)
where is the standard deviation.
For the low-power side mode, the pdf in Eq. (4.21) is approximately exponential
distribution, as
1
exp ii
i i
ap a
a a
(4.24)
4.4 Simulation
4.4.1 Simulation Setup
The laser parameters follow those in the study by Jensen et al. [102] and are
shown in Table 4-1.
RZ code is used, and we modulate the injection current by a square-wave pulse
train, with a duty cycle of 0.44. The relaxation frequency is about 2.5 GHz at a bias
current of 1.5 times the threshold current (Ith). Here we modulate the laser at 2.2 GHz.
The time step is 1 ps, and 1024 information pulses are processed. A few more bits are
added before and after the information pulse train, to ensure the turn-on of the laser
diode, and to avoid hitting the simulation boundary. Eleven modes are calculated.

Ph.D. Thesis – Qingyi Guo; McMaster University – Electrical & Computer Engineering
75
Table 4-1 Laser parameters [102]
Parameter Symbol Value
Nonradiative recombination constant A 1×10⁸
s-1
Band-to-band recombination constant B 0.26 s-1
Auger recombination constant
Photon lifetime
C
τp
4.44×10⁻¹⁰
s-1
2 ps
Mode confinement factor Γ 0.3
Carrier number at transparency N0 3×10⁸
Longitudinal mode spacing D 0.72 nm
Width of gain curve G 32.5 nm
Width of spontaneous emission spectrum s 50.0 nm
Gain coefficient GN 3.3×10³
s-1
Center wavelength λ0 1.3 μm
Group refractive index ng 3.9
Refractive index nr 3.3
Mode volume V 3×10-16
m3

Ph.D. Thesis – Qingyi Guo; McMaster University – Electrical & Computer Engineering
76
A low-pass filter is used after the laser diode photon output to emulate the
receiver. Its 3dB bandwidth is set to be equal to the modulation frequency, and the
impulse response is
2sin , k = 0,1,...,K
0, elsewhere
k
h k K
(4.25)
After the low-pass filter, we find the sampling time point in the pulse interval
where the total photon number is maximal when Langevin noise is turned off. We then
sample the photon number of each mode at this instant.
From the sampled data, we can calculate the pdf. The photon number samples are
collected in 200 bins, and then the sample number in each bin is divided by the total
number of samples. The k-factor can also be calculated using Eqs. (4.19) and (4.20) from
the sampled data. Note that we only count in bits ‘1’ information, since the assumption in
the analytical derivation was that the total photon number is constant from pulse to pulse
[70].
4.4.2 Mode pdf Results
We conducted the simulation for the modulation frequency of 2.2 GHz, with bias
current Ibias = 1.05 × Ith, and the pulse current Ipulse = 0.45 × Ith. 1024 pulses, all of which
are bits ‘1’, are simulated with Langevin noise on.
Figure 4-1 shows the average mode spectrum over the sampled photon numbers.
The root-mean-square (RMS) width is 0.92 nm.

Ph.D. Thesis – Qingyi Guo; McMaster University – Electrical & Computer Engineering
77
-5 0 50
0.2
0.4
0.6
0.8
1Average Mode Spectrum, RMS =0.92nm
Modes
Sp
ec
tru
m
Figure 4-1 Average longitudinal mode spectrum under pulsed modulation. Modulation
frequency is 2.2 GHz, Ibias = 1.05 × Ith, Ipulse = 0.45 × Ith. This is the average over the
sampled data of 1024 pulses of bits ‘1’.

Ph.D. Thesis – Qingyi Guo; McMaster University – Electrical & Computer Engineering
78
Figure 4-2 Probability density functions for (a) the total photon output Stot, (b) the central
mode S0, and a few side modes (c) S-2, (d) S2, (e) S-4, (f) S4. The blue dots are pdf
calculated from counting the sample numbers in bins, and the red solid lines are the fitted
curve to the analytical formulas.

Ph.D. Thesis – Qingyi Guo; McMaster University – Electrical & Computer Engineering
79
Figure 4-2 illustrates the probability density functions for (a) the total photon
output Stot, (b) the central mode S0, and a few side modes (c) S-2, (d) S2, (e) S-4, (f) S4.
The pdf calculated from counting the sample numbers in bins are shown in blue dots, and
the red solid lines are the fitted curve to the theoretical formulas in Eqs. (4.21), (4.23) and
(4.24). The simulation results are in good agreement with the literature [102], and fit well
with the theoretical curves. We can see that the total photon output S0 has a Gaussian
distribution instead of being a constant as expected, and the modal pdf match well with
predicted distributions although the analyze was based on the assumption of a constant
total power. The pdf for each mode is well fitted with the Beta distribution (S0, S-2, and
S2), and the low-power side mode shows an exponential distribution (S-4 and S4).
Our simulation results agree with the published results [102], which validates our
simulation model.
4.4.3 k-factor Results
The k-factor describes the degree of power fluctuations in each longitudinal mode
of the FP laser. For a multi-mode FP laser, the power fluctuations are induced by two
sources: one is the laser Langevin noise that randomly varies the power, and can be called
“intrinsic”; the other one is the bit pattern effect which is deterministic and has a memory
effect, and can be referred as “extrinsic”. Therefore, to make k-factor zero, two
conditions are required: 1) the intrinsic laser Langevin noise must be turned off; and 2)
the bit pattern must be regular, not random.

Ph.D. Thesis – Qingyi Guo; McMaster University – Electrical & Computer Engineering
80
To study the contribution of these two sources, we simulate the same laser diode
and low-pass filter. The modulation frequency is still 2.2 GHz, with bias current Ibias =
1.05 × Ith, and the modulation pulse current Ipulse = 0.45 × Ith. 1024 pulses are calculated.
Four different conditions are simulated: 1) Regular bit pattern, Langevin noise are turned
off; 2) Regular bit pattern, Langevin noise are turned on; 3) Random bit pattern,
Langevin noise are turned off; and 4) Random bit pattern, Langevin noise are turned on.
Since we use RZ code, for regular bit pattern, all the bits are set to ‘1’. For random bit
pattern, we use the De Bruijn sequence to efficiently traverse all the combinations of
sequence.
Figure 4-3 shows the waveform for total photon number and major modes when
all bits are ‘1’s, and without Langevin noise. (a) is the laser diode output, and (b) is the
waveform after the low-pass filter. There is no power fluctuation at all; thus the sampled
data are all the same, as shown by the straight lines in Figure 4-4. Therefore, the k-factor
is calculated to be 0.
Figure 4-5 shows the waveform for total photon number and major modes when
all bits are ‘1’s, and with Langevin noise. (a) is the laser diode output, and (b) is the
waveform after the low-pass filter. The sampled photon output is shown in Figure 4-6.
We can see that the Langevin noise causes the mode power to randomly change. The total
k-factor is calculated to be 0.36, and the k-factor for each mode is illustrated in Figure
4-7. The k-factors for the central modes are larger, and the k-factors for the low-power
side modes are smaller.

Ph.D. Thesis – Qingyi Guo; McMaster University – Electrical & Computer Engineering
81
(a)
(b)
Figure 4-3 The waveform for total photon number and major modes. All bits are ‘1’s, and
without Langevin noise. (a) Laser diode output. (b) After the low-pass filter.
100 100.5 101 101.5 102 102.5 1030
1
2
3
4
5
6
7x 10
5
Time, t (ns)
Ph
oto
n n
um
be
r
Stotal
S-2
S-1
S0
S1
S2
100 100.5 101 101.5 102 102.5 1030
0.5
1
1.5
2
2.5
3
3.5
4
4.5x 10
5
Time, t (ns)
Ph
oto
n n
um
be
r
Stotal
S-2
S-1
S0
S1
S2
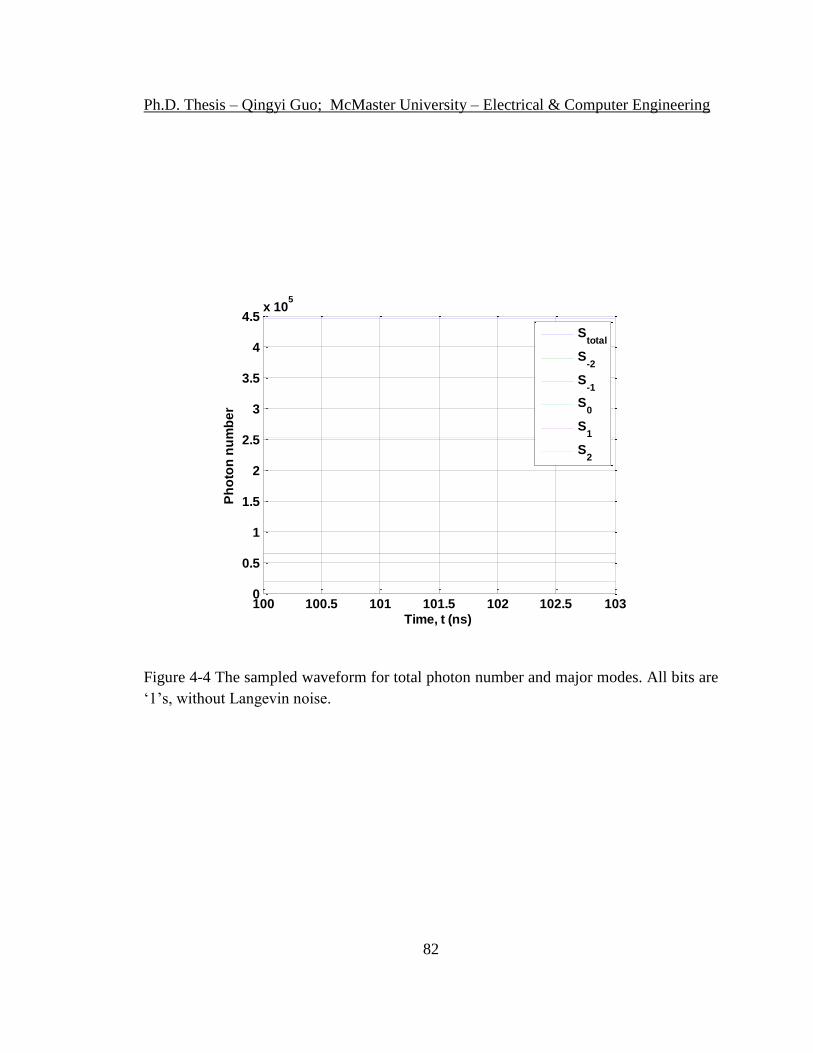
Ph.D. Thesis – Qingyi Guo; McMaster University – Electrical & Computer Engineering
82
Figure 4-4 The sampled waveform for total photon number and major modes. All bits are
‘1’s, without Langevin noise.
100 100.5 101 101.5 102 102.5 1030
0.5
1
1.5
2
2.5
3
3.5
4
4.5x 10
5
Time, t (ns)
Ph
oto
n n
um
be
r
Stotal
S-2
S-1
S0
S1
S2

Ph.D. Thesis – Qingyi Guo; McMaster University – Electrical & Computer Engineering
83
(a)
(b)
Figure 4-5 The waveform for total photon number and major modes. All bits are ‘1’s,
with Langevin noise. (a) Laser diode output. (b) After the low-pass filter.
100 100.5 101 101.5 102 102.5 1030
1
2
3
4
5
6
7
8x 10
5
Time, t (ns)
Ph
oto
n n
um
be
r
Stotal
S-2
S-1
S0
S1
S2
100 100.5 101 101.5 102 102.5 1030
1
2
3
4
5x 10
5
Time, t (ns)
Ph
oto
n n
um
be
r
Stotal
S-2
S-1
S0
S1
S2

Ph.D. Thesis – Qingyi Guo; McMaster University – Electrical & Computer Engineering
84
Figure 4-6 The sampled waveform for total photon number and major modes. All bits are
‘1’s, with Langevin noise.
Figure 4-7 k-factor for each mode. All bits are ‘1’s, with Langevin noise.
100 100.5 101 101.5 102 102.5 1030
1
2
3
4
5x 10
5
Time, t (ns)
Ph
oto
n n
um
be
r
Stotal
S-2
S-1
S0
S1
S2
-5 0 50.05
0.1
0.15
0.2
0.25
0.3
0.35
0.4
0.45k-factor for each mode, k=0.36
mode number
k-f
acto
r

Ph.D. Thesis – Qingyi Guo; McMaster University – Electrical & Computer Engineering
85
(a)
(b)
Figure 4-8 The waveform for total photon number and major modes. The bit pattern is De
Bruijn sequence, without Langevin noise. (a) Laser diode output. (b) After the low-pass
filter.
100 100.5 101 101.5 102 102.5 1030
2
4
6
8
10
12
14x 10
5
Time, t (ns)
Ph
oto
n n
um
be
r
Stotal
S-2
S-1
S0
S1
S2
100 100.5 101 101.5 102 102.5 1030
1
2
3
4
5
6
7
8x 10
5
Time, t (ns)
Ph
oto
n n
um
be
r
Stotal
S-2
S-1
S0
S1
S2

Ph.D. Thesis – Qingyi Guo; McMaster University – Electrical & Computer Engineering
86
Figure 4-9 The sampled waveform for total photon number and major modes. The bit
pattern is De Bruijn sequence, without Langevin noise.
Figure 4-10 k-factor for each mode. The bit pattern is De Bruijn sequence, without
Langevin noise.
100 100.5 101 101.5 102 102.5 1030
1
2
3
4
5
6
7x 10
5
Time, t (ns)
Ph
oto
n n
um
be
r
Stotal
S-2
S-1
S0
S1
S2
-5 0 50
0.05
0.1
0.15
0.2
0.25
0.3
0.35k-factor for each mode, k=0.21
mode number
k-f
acto
r

Ph.D. Thesis – Qingyi Guo; McMaster University – Electrical & Computer Engineering
87
(a)
(b)
Figure 4-11 The waveform for total photon number and major modes. The bit pattern is
De Bruijn sequence, with Langevin noise. (a) Laser diode output. (b) After the low-pass
filter.
100 100.5 101 101.5 102 102.5 1030
2
4
6
8
10
12x 10
5
Time, t (ns)
Ph
oto
n n
um
be
r
S
total
S-2
S-1
S0
S1
S2
100 100.5 101 101.5 102 102.5 1030
1
2
3
4
5
6
7x 10
5
Time, t (ns)
Ph
oto
n n
um
be
r
Stotal
S-2
S-1
S0
S1
S2

Ph.D. Thesis – Qingyi Guo; McMaster University – Electrical & Computer Engineering
88
Figure 4-12 The sampled waveform for total photon number and major modes. The bit
pattern is De Bruijn sequence, with Langevin noise.
Figure 4-13 k-factor for each mode. The bit pattern is De Bruijn sequence, with Langevin
noise.
100 100.5 101 101.5 102 102.5 1030
1
2
3
4
5
6
7x 10
5
Time, t (ns)
Ph
oto
n n
um
be
r
Stotal
S-2
S-1
S0
S1
S2
-5 0 50.1
0.15
0.2
0.25
0.3
0.35
0.4
0.45
0.5
0.55
0.6k-factor for each mode, k=0.45
mode number
k-f
acto
r

Ph.D. Thesis – Qingyi Guo; McMaster University – Electrical & Computer Engineering
89
Figure 4-8 shows the waveform for total photon number and major modes for the
bit pattern of De Bruijn sequence, and without Langevin noise. Again (a) is the laser
diode output, and (b) is the waveform after the low-pass filter. The sampled photon
output is shown in Figure 4-9. We can see that without the laser Langevin noise, the bit
pattern itself can cause the laser power to vary with time. The total k-factor is 0.21, and
the k-factor for each mode is illustrated in Figure 4-10. High-power mode has larger k-
factor.
Finally, both sources are included in the simulation. This should introduce the
biggest power fluctuations. The bit pattern is De Bruijn sequence, and the Langevin noise
is turned on. Figure 4-11 shows the waveform (a) at the laser diode output, and (b) after
the low-pass filter. Figure 4-12 is the sampled data, and Figure 4-13 shows the k-factor
for each mode. The total k-factor is 0.45, and high-power mode has larger k-factor.
We can denote the total k-factor as k1, k2, k3 and k4 for the four simulation
conditions:
1. {Regular bit pattern, without Langevin noise}, represented by k1
2. {Regular bit pattern, with Langevin noise}, represented by k2
3. {Random bit pattern, without Langevin noise}, represented by k3
4. {Random bit pattern, with Langevin noise}, represented by k4
It can be seen from the previous results that k1 = 0, k2 > 0, k3 > 0, k4 > k2, and k4 >
k3, as expected. The value 2 2
4 2 3~k k k approximately.

Ph.D. Thesis – Qingyi Guo; McMaster University – Electrical & Computer Engineering
90
Next, the k-factors at different operating conditions are studied. For each case, the
k-factors of four simulation conditions are calculated and plotted in figures, and the value
2 2
2 3k k is also computed for reference. Blue circles represent k1; green upward-
pointing triangles represent k2; red downward-pointing triangles represent k3; cyan
asterisks represent k4; and magenta plus signs represent 2 2
2 3k k .
In Figure 4-14, the modulation current Ipulse is kept constant as 0.45 × Ith, and bias
current Ibias is varied at {0.95, 1.05, 1.5, 2.0} × Ith. It can be seen that the total k-factors
and contributions from Langevin noise and bit pattern randomness all decrease with
increasing bias current. The contribution of Langevin noise to the k-factor is bigger than
that of the random bit pattern, and is more dominant at lower bias current.
In Figure 4-15, the bias current Ibias is kept constant as 1.05 × Ith, while the
modulation current Ipulse is varied at {0.45, 0.75, 1.05} × Ith. It can be seen that the total k-
factors decrease slightly with increasing pulse current, and the contribution of bit pattern
randomness decreases. The contribution of Langevin noise to the k-factor is also bigger
than that of the random bit pattern, and is more dominant at higher modulation current.
In Figure 4-16, the average injection current is kept as a constant. With the
increasing bias current and decreasing pulse current, the contribution of Langevin noise
to the k-factor decreases, and the contribution from random bit pattern slightly increases.
The contribution of Langevin noise to the k-factor is still bigger than that of the random
bit pattern, and is more dominant at lower bias current.

Ph.D. Thesis – Qingyi Guo; McMaster University – Electrical & Computer Engineering
91
Figure 4-14 The total k-factor for four simulation conditions. The modulation current
Ipulse is kept constant as 0.45 × Ith, and bias current Ibias is varied at {0.95, 1.05, 1.5, 2.0} ×
Ith.
0.8 1 1.2 1.4 1.6 1.8 2 2.20
0.2
0.4
0.6
0.8
1k-factor for total photon numbers, Ipulse = 0.45*Ith
kto
t
Ibias/Ith
1. Regular, w/o noise
2. Regular, w/ noise
3. Random, w/o noise
4. Random, w/ noise
sqrt(k2
2+k
3
2)

Ph.D. Thesis – Qingyi Guo; McMaster University – Electrical & Computer Engineering
92
Figure 4-15 The total k-factor for four simulation conditions. The bias current Ibias is kept
constant as 1.05 × Ith, while the modulation current Ipulse is varied at {0.45, 0.75, 1.05} ×
Ith.
0.4 0.5 0.6 0.7 0.8 0.9 1 1.10
0.2
0.4
0.6
0.8
1k-factor for total photon numbers, Ibias = 1.05*Ith
kto
t
Ipulse/Ith
1. Regular, w/o noise
2. Regular, w/ noise
3. Random, w/o noise
4. Random, w/ noise
sqrt(k2
2+k
3
2)

Ph.D. Thesis – Qingyi Guo; McMaster University – Electrical & Computer Engineering
93
Figure 4-16 The total k-factor for four simulation conditions. The average injection
current is kept as a constant.
0.9 0.95 1 1.05 1.1 1.150
0.2
0.4
0.6
0.8
1k-factor for total photon numbers, constant ave. input current
kto
t
Ibias/Ith
1. Regular, w/o noise
2. Regular, w/ noise
3. Random, w/o noise
4. Random, w/ noise
sqrt(k2
2+k
3
2)

Ph.D. Thesis – Qingyi Guo; McMaster University – Electrical & Computer Engineering
94
4.5 Summary
In this chapter, we have studied the MPN characteristics of FP laser diode using
the time-domain simulation of noise-driven multi-mode laser rate equation. The
probability density functions are calculated for each mode. The sources of the k-factor are
investigated with simulation, including the intrinsic source of the laser Langevin noise,
and the extrinsic source of the bit pattern. The photon waveforms are shown under four
simulation conditions for regular/random bit pattern, and with/without Langevin noise.
The k-factors contributed by those sources are studied with a variety of bias current and
modulation current.

Ph.D. Thesis – Qingyi Guo; McMaster University – Electrical & Computer Engineering
95
Chapter 5.
Summary and Future Work
5.1 Contributions of the Thesis
Passive optical network (PON) is considered as the most appealing access
network architecture in terms of cost-effectiveness, bandwidth management flexibility,
scalability and durability. The overall objectives of this thesis are the investigation of
cost-effective and high-performance designs of link system and devices in the PON.
Firstly, a novel optical orthogonal frequency division multiplexing (OOFDM)-
PON upstream link scheme is proposed and numerically simulated with two
configurations: 10 Gbit/s bit rate for 4 optical network units (ONUs), and 2.5 Gbit/s bit
rate for 16 ONUs. At the ONUs, orthogonal subcarrier multiplexing is used to realize
colorless ONU and high spectral efficiency. At the optical line terminal (OLT), the
optical switch and all optical fast Fourier transform (OFFT) are applied to achieve high
speed demultiplexing. According to the Monte-Carlo simulation results of the BER, the
tolerance of the laser diode central wavelength shift in ONUs for 10 Gbit/s link is higher
than that for the 2.5 Gbit/s link.
Next, we design and numerically simulate a newly proposed polarization beam
splitter (PBS) device based on a planar waveguide platform. PBS is one of the most
important components in polarization-controlled optical systems, e.g. the next-generation

Ph.D. Thesis – Qingyi Guo; McMaster University – Electrical & Computer Engineering
96
PON utilizing polarization multiplexing. In our PBS design, a wedge made of a
subwavelength grating utilizes the form birefringence to enlarge the effective refractive
index difference between the TM and TE polarizations, and splits the two polarization
beams to different directions. The insertion loss is less than 0.9 dB for the designed
operating wavelength band of 1.5 μm to 1.6 μm. The crosstalk between the two
polarizations is below -30 dB. The whole device size is 300 μm × 80 μm, and can
potentially be further reduced by improving the lens design. This PBS device can be
readily fabricated by lithography and etching, and can be monolithically integrated with
other optical components on the same platform. This design can also be extended to other
material systems and other wavelength bands to meet the required specifications.
Lastly, we study the mode partition noise (MPN) characteristics of the Fabry-
Perot (FP) laser diode using the time-domain simulation of noise-driven multi-mode laser
rate equation. FP laser is cheaper than the widely used distributed feedback (DFB) laser
diode in PON, but its MPN is the major limiting factor in an optical transmission system.
We calculate the probability density functions for each longitudinal mode. The sources of
the k-factor are studied with simulation, including the intrinsic source of the laser
Langevin noise, and the extrinsic source of the bit pattern. The photon waveforms are
shown under four simulation conditions for regular/random bit pattern, and with/without
Langevin noise. The k-factors contributed by those sources are studied with a variety of
bias current and modulation current.

Ph.D. Thesis – Qingyi Guo; McMaster University – Electrical & Computer Engineering
97
Publications
1. Q. Guo, K. He, X. Li, and W.-P. Huang, "A novel upstream link scheme for
OOFDM-PON," IEEE Access Networks and In-house Communications (ANIC)
Topical Meeting, Toronto, Ontario, Canada, Jun. 2011, paper AMC2.
2. Q. Guo, X. Li, J. Mu, L. Han and W.-P. Huang, “Planar waveguide
polarization beam splitter based on the form birefringence,” IEEE Photonics
Technology Letters, vol. 24, no. 20, pp. 1034-1037, Oct. 2012.
5.2 Future Work
When multi-mode FP laser is used as the transmitter, fiber-dispersion-induced
inter-symbol interference (ISI) will be enhanced due to MPN. Some of our primitive
simulations show that maximum-likelihood sequence estimation (MLSE) receiver may
reduce the bit error rate (BER) and MPN penalty induced by the bit pattern randomness.
After training, the MLSE receiver has a better performance than an optimum-threshold-
based direct-detection receiver when mode hopping is absent. MLSE does not mitigate
Langevin-noise-induced MPN penalty; therefore, we do not expect a significant
performance improvement when the contribution of Langevin noise to the k-factor is
dominant. Further simulations and investigations need to be conducted to illustrate
quantitatively the effective optical gain of MLSE receiver as a function of laser intrinsic
parameters and operating conditions.

Ph.D. Thesis – Qingyi Guo; McMaster University – Electrical & Computer Engineering
98
In the time-domain numerical simulation, mode hopping/switching can be
observed even when the FP laser is operated with DC current. The probability and
frequency of mode hopping is related to laser design parameters and Langevin noise.
When mode hopping happens, the system performance will be severely affected, and
MLSE receiver will not work without re-training. Therefore, it would be interesting and
significant to find an easily-implemented design to suppress mode hopping in FP laser.

Ph.D. Thesis – Qingyi Guo; McMaster University – Electrical & Computer Engineering
99
References
[1] L. Pavesi, “Routes toward silicon-based lasers”, Materials Today, vol. 8, pp.18-25,
Jan. 2005.
[2] S. Coffa, “Light from silicon”, IEEE Spectrum, vol. 42, pp. 44-49, Oct. 2005.
[3] S.-H. Yen, S.-W. Wong, S. Das, N. Cheng, J. Cho, S. Yamashita, O. Solgaard,
and L. G. Kazovsky, "Photonic components for future fiber access networks,"
IEEE J. Sel. Areas Commun., vol. 28, pp. 928-935, Aug. 2010.
[4] W.-P. Huang, X. Li, C.-Q. Xu, X. Hong, C. Xu, and W. Liang, “Optical
transceivers for fiber-to-the-premises applications: system requirements and
enabling technologies,” J. Lightwave Technol., vol. 25, pp. 11-27, Jan. 2007.
[5] G. Kramer, Ethernet Passive Optical Networks, McGraw-Hill, 2005.
[6] K. Choi, J. Moon, J. H. Lee, and C. Lee, “An efficient evolution method from a
TDM-PON with a video overlay to NGA,” Proc. OFC 2008, paper OWH1, 2008.
[7] H. D. Kim, S.-G. Kang and C.-H. Lee, “A low-cost WDM source with an ASE
injected Fabry-Perot semiconductor laser,” IEEE Photon. Technol. Lett., vol. 12,
pp. 1067-1069, Aug. 2000.
[8] A. Borghesani, I. F. Lealman, A. Poustie, D. W. Smith, and R. Wyatt, “High
temperature, colourless operation of a reflective semiconductor optical amplifier
for 2.5Gbit/s upstream transmission in a WDM-PON”, 2007 33rd European
Conference on Optical Communication (ECOC), pp. 1-2, Sep. 2007.

Ph.D. Thesis – Qingyi Guo; McMaster University – Electrical & Computer Engineering
100
[9] G. C. Yang and W. C. Kwong, “Performance comparison of multiwavelength
CDMA and WCDMA+CDMA for fiber optic network,” IEEE Trans. Commun.,
vol. 45, pp. 1426, Nov. 1992.
[10] K. Takiguchi, T. Shibata and H. Takahashi, “Time-spreading/wavelength hopping
OCDMA experiment using PLC encoder/decoder with large spread factor,”
Electron. Lett., vol. 42, pp. 301 – 302, Mar. 2006.
[11] J.-M. Kang and S.-K. Han, “A novel hybrid WDM/SCM-PON sharing
wavelength for up- and down-link using reflective semiconductor optical
amplifier,” IEEE Photon. Technol. Lett., vol. 18, pp. 502-504, Feb. 2006.
[12] T. E. Darcie, “Subcarrier multiplexing for lightwave networks and video
distribution system,” IEEE J. Sel. Areas Commun., vol. 8, pp. 1240-1248, Sep.
1990.
[13] D. Qian, N. Cvijetic, J. Hu, and T. Wang, "A novel OFDMA-PON architecture
with source-free ONUs for next-generation optical access networks", IEEE
Photon. Technol. Lett., vol. 21, pp. 1265-1267, Sep. 2009.
[14] Y.-M. Lin and P.-L. Tien, "Next-generation OFDMA-based passive optical
network architecture supporting radio-over-fiber," IEEE J. Sel. Areas Commun.,
vol. 28, pp. 791-799, Aug. 2010.
[15] Carrier Sense Multiple Access with Collision Detection (CSMA/CD) Access
Method and Physical Layer Specifications-Amendment: Media Access Control
Parameters, Physical Layers, and Management Parameters for Subscriber Access
Networds, IEEE Standard 802.3ah, 2004.

Ph.D. Thesis – Qingyi Guo; McMaster University – Electrical & Computer Engineering
101
[16] ITU-T Recommendation G.984.1, “Gigabit-capable Passive Optical Networks (G-
PON): General characteristics,” 2003.
[17] Carrier Sense Multiple Access with Collision Detection (CSMA/CD) Access
Method and Physical Layer Specifications-Amendment: Physical Layers
Specifications and Management Parameters for 10 Gb/s Passive Optical
Networks, IEEE Standard 802.3av, 2009.
[18] ITU-T Recommendation G.987.1, “10Gigabit-capable Passive Optical Networks
(XG-PON): General requirements,” 2009.
[19] J.-i. Kani, "Enabling Technologies for Future Scalable and Flexible WDM-PON
and WDM/TDM-PON Systems," IEEE J. Sel. Topics Quantum Electron., vol. 16,
pp. 1290-1297, Sep./Oct. 2010.
[20] J. Armstrong, "OFDM for optical communications," J. Lightwave Technol., vol.
27, pp. 189-204, Feb. 2009.
[21] W. Shieh and I. Djordjevic, Orthogonal frequency division multiplexing for
optical communications, Elsevier Inc., 2010.
[22] W. Shieh, H. Bao, and Y. Tang, "Coherent optical OFDM: theory and design,"
Opt. Express, vol. 16, pp. 841-859, Jan. 2008.
[23] C. W. Chow, C. H. Yeh, C. H. Wang, C. L. Wu, S. Chi, and C. Lin, "Studies of
OFDM signal for broadband optical access networks," IEEE J. Sel. Areas
Commun., vol. 28, pp. 800-807, Aug. 2010.

Ph.D. Thesis – Qingyi Guo; McMaster University – Electrical & Computer Engineering
102
[24] D. Qian, N. Cvijetic, J. Hu, and T. Wang, “108 Gb/s OFDMA-PON with
polarization multiplexing and direct detection,” J. Lightwave Technol., vol. 28, pp.
484-493, Feb. 2010.
[25] Y. Li, Y. Xi, X. Li, and W.-P. Huang, “Design and analysis of single mode Fabry-
Perot lasers with high speed modulation capability,” Opt. Express, vol. 19, pp.
12131-12140, Jun. 2011.
[26] K. Nakahara, E. Nomoto, T. Tsuchiya, Y. Katou, R. Kaneko, and A. Taike, "A 4
km transmission at 10-Gb/s operation with wide temperature range in 1.3-μm
InGaAlAs MQW FP lasers," IEEE 18th International Semiconductor Laser
Conference, pp. 59-60, 2002.
[27] Y. Yi, S. Verschuere, Z. Lou, P. Ossieur, J. Bauwelinck, X.-Z. Qiu, and J.
Vandewege, “Simulations and experiments on the effective optical gain of FEC in
a GPON uplink,” IEEE Photon. Technol. Lett., vol. 19, pp. 82-84, Jan. 2007.
[28] J. M. Oh, S. G. Koo, D. Lee, and S. J. Park, “Enhancement of the performance of
a reflective SOA-based hybrid WDM/TDM PON system with a remotely pumped
erbium-doped fiber amplifier,” IEEE J. Lightw. Technol., vol. 26, pp. 144–149,
Jan. 2008.
[29] J. Kani and K. Iwatsuki, “A wavelength-tunable optical transmitter using
semiconductor optical amplifiers and an optical tunable filter for metro/access
DWDM applications,” IEEE J. Lightw. Technol., vol. 23, pp. 1164–1169, Mar.
2005.

Ph.D. Thesis – Qingyi Guo; McMaster University – Electrical & Computer Engineering
103
[30] S. Hara and R. Prasad, Multicarrier Techniques for 4G Mobile Communications,
Artech House Publishers, 2003.
[31] L. Hanzo and T. Keller, OFDM and MC-CDMA: A Primer, IEEE Press, 2006.
[32] Q. Pan and R. J. Green, "Bit-error-rate performance of lightwave hybrid
AM/OFDM systems with comparison with AM/QAM systems in the presence of
clipping impulse noise," IEEE Photon. Technol. Lett., vol. 8, pp. 278-280, Feb.
1996.
[33] W. Shieh and C. Athaudage, "Coherent optical orthogonal frequency division
multiplexing," Electron. Lett., vol. 42, pp. 587-589, May 2006.
[34] I. Djordjevic and B. Vasic, "Orthogonal frequency division multiplexing for high-
speed optical transmission," Opt. Express, vol. 14, pp. 3767-3775, May 2006.
[35] H. Bao and W. Shieh, "Transmission simulation of coherent optical OFDM
signals in WDM systems," Opt. Express, vol. 15, pp. 4410-4418, Apr. 2007.
[36] Y. Tang, W. Shieh, X. Yi, and R. Evans, "Optimum design for RF-to-optical up-
converter in coherent optical OFDM systems," IEEE Photon. Technol. Lett., vol.
19, pp. 483-485, Apr. 2007.
[37] S. L. Jansen, I. Morita, T. C. W. Schenk, and H. Tanaka, "121.9-Gb/s PDM-
OFDM transmission with 2-b/s/Hz spectral efficiency over 1000 km of SSMF," J.
Lightwave Technol., vol. 27, pp. 177-188, Feb. 2009.
[38] C. Sethumadhavan, X. Liu, E. Burrows, and L. Buhl, "Hybrid 107-Gb/s
Polarization-multiplexed DQPSK and 42.7-Gb/s DQPSK transmission at 1.4-
bits/s/Hz spectral efficiency over 1280 km of SSMF and 4 bandwidth-managed

Ph.D. Thesis – Qingyi Guo; McMaster University – Electrical & Computer Engineering
104
ROADMs," in European Conference on Optical Communication (ECOC), Paper
PD 1.9, pp. 1-2, Sep. 2007.
[39] S. B. Weinstein and P. M. Ebert, "Data transmission by frequency-division
multiplexing using the discrete Fourier transform," IEEE Trans. Commun.
Technol., vol.19, pp. 628-634, Oct. 1971.
[40] L. Hanzo, M. Munster, B. J. Choi, T. Keller, OFDM and MC-CDMA for
Broadband Multi-User Communications, WLANs and Broadcasting, John Wiley
& Sons, 2003.
[41] Communications, WLANs and Broadcasting. New York: Wiley; 2003.
[42] A. J. Lowery, S. Wang and M. Premaratne, "Calculation of power limit due to
fiber nonlinearity in optical OFDM systems," Opt. Express, vol. 15, pp. 13282-
13287, Oct. 2007.
[43] A. J. Lowery, "Fiber nonlinearity mitigation in optical links that use OFDM for
dispersion compensation," IEEE Photon. Technol. Lett., vol. 19, pp. 1556-1558,
Oct. 2007.
[44] A. J. Lowery, "Fiber nonlinearity pre- and post-compensation for long-haul
optical links using OFDM," Opt. Express, vol. 15, pp. 12965-12970, Oct. 2007.
[45] M. E. Marhic, "Discrete Fourier transforms by single-mode star networks," Opt.
Lett., vol. 12, pp. 63-65, Jan. 1987.
[46] K. Lee, C. T. D. Thai, and J.-K. K. Rhee, “All optical discrete Fourier transform
processor for 100 Gbps OFDM transmission,” Opt. Express, vol. 16, pp. 4023-
4028, Mar. 2008.

Ph.D. Thesis – Qingyi Guo; McMaster University – Electrical & Computer Engineering
105
[47] G. P. Agrawal, Nonlinear fiber optics, 3rd-Ed, Academic Press, 2001.
[48] D. Hillerkuss, A. Marculescu, J. Li, M. Teschke, G. Sigurdsson, K. Worms, S.
Ben Ezra, N. Narkiss, W. Freude, and J. Leuthold, "Novel optical fast Fourier
transform scheme enabling real-time OFDM processing at 392 Gbit/s and
beyond," Optical Fiber Communication Conference (OFC), Paper OWW3, 2010.
[49] D. Hillerkuss, M. Winter, M. Teschke, A. Marculescu, J. Li, G. Sigurdsson, K.
Worms, S. Ben Ezra, N. Narkiss, W. Freude, and J. Leuthold, “Simple all-optical
FFT scheme enabling Tbit/s real-time signal processing,” Opt. Express, vol. 18,
pp. 9324-9340, Apr. 2010.
[50] K. Shiraishi, T. Sato, and S. Kawakami, “Experimental verification of a form-
birefringent polarization splitter,” Appl. Phys. Lett., vol. 58, pp. 211-212, Jan.
1991.
[51] D. Yi, Y. Yan, H. Liu, S. Lu, and G. Jin, "Broadband polarizing beam splitter
based on the form birefringence of a subwavelength grating in the quasi-static
domain," Opt. Lett., vol. 29, pp. 754-756, Apr. 2004.
[52] Y. Yue, L. Zhang, J.-Y. Yang, R. G. Beausoleil, and A. E. Willner, "Silicon-on-
insulator polarization splitter using two horizontally slotted waveguides", Opt.
Lett., vol. 35, pp. 1364-1366, May 2010.
[53] H. Fukuda, K. Yamada, T. Tsuchizawa, T. Watanabe, H. Shinojima, and S.
Itabashi, "Ultrasmall polarization splitter based on silicon wire waveguides," Opt.
Express, vol. 14, pp. 12401-12408, Dec. 2006.

Ph.D. Thesis – Qingyi Guo; McMaster University – Electrical & Computer Engineering
106
[54] T. Yamazaki, J. Yamauchi, and H. Nakano, "A branch-type TE/TM wave splitter
using a light-guiding metal line," J. Lightwave Technol., vol. 25, pp. 922-928,
Mar. 2007.
[55] L. Wu, M. Mazilu, J.-F. Gallet, T. F. Krauss, A. Jugessur, and R. M. De La Rue,
"Planar photonic crystal polarization splitter," Opt. Lett., vol. 29, pp. 1620-1622,
Jul. 2004.
[56] M. R. Watts, H. A. Haus, and E. P. Ippen, "Integrated mode-evolution- based
polarization splitter," Opt. Lett., vol. 30, pp. 967-969, May 2005.
[57] X. Li, G.-R. Zhou, N.-N. Feng, and W. Huang, "A novel planar waveguide
wavelength demultiplexer design for integrated optical triplexer transceiver,"
IEEE Photon. Technol. Lett., vol.17, pp. 1214-1216, Jun. 2005.
[58] S. Janz, A. Balakrishnan, S. Charbonneau, P. Cheben, M. Cloutier, A. Delage, K.
Dossou, L. Erickson, M. Gao, P.A. Krug, B. Lamontagne, M. Packirisamy, M.
Pearson, and D.-X. Xu, "Planar waveguide echelle gratings in silica-on-silicon,"
IEEE Photon. Technol. Lett., vol.16, pp. 503–505, Feb. 2004.
[59] D. C. Flanders, "Submicrometer periodicity gratings as artificial anisotropic
dielectrics," Appl. Phys. Lett., vol. 42, pp. 492-494, Mar. 1983.
[60] A. Taflove and S. C. Hagness, Computational electrodynamics: the finite-
difference time-domain method, 3rd-Ed, Artech House Publishers, 2005.
[61] D. M. Sullivan, Electromagnetic simulation using the FDTD method, IEEE Press
Series on RF and Microwave Technology, Wiley-IEEE Press, 2000.

Ph.D. Thesis – Qingyi Guo; McMaster University – Electrical & Computer Engineering
107
[62] I. H. Malitson, "Interspecimen comparison of the refractive index of fused silica,"
J. Opt. Soc. Am., vol. 55, pp. 1205-1208, Oct. 1965.
[63] E. D. Palik, Handbook of optical constants of solids, vol. I, 1985.
[64] SOPRA N&K Database,
http://refractiveindex.info/?group=CRYSTALS&material=a-Si.
[65] J. Chilwell and I. Hodgkinson, “Thin-films field-transfer matrix theory of planar
multilayer waveguides and reflection from prism-loaded waveguides,” J. Opt. Soc.
Am. A, vol. 1, pp. 742-753, Jul. 1984.
[66] T. Tamir (Ed), Guided-wave optoelectronics, 2nd-Ed, Springer-Verlag, pp. 43-50,
1990.
[67] S. Sinzinger and J. Jahns, Microoptics, 2nd-Ed, Wiley-VCH, 2003.
[68] W. -P. Huang and C. L. Xu, “A wide-angle vector beam propagation method,”
IEEE Photon. Technol. Lett., vol. 4, pp. 1118-1120, Oct. 1992.
[69] F. Marty, L. Rousseau, B. Saadany, B. Mercier, O. Français, Y. Mita, and T.
Bourouina, "Advanced etching of silicon based on deep reactive ion etching for
silicon high aspect ratio microstructures and three-dimensional micro- and
nanostructures," Microelectronics Journal, vol. 36, pp. 673–677, Jul. 2005.
[70] Y. Okano, K. Nakagawa, and T. Ito, "Laser mode partition noise evaluation for
optical fiber transmission," IEEE Trans. on Communications, vol. 28, pp. 238-
243, Feb. 1980.

Ph.D. Thesis – Qingyi Guo; McMaster University – Electrical & Computer Engineering
108
[71] K. Ogawa, "Analysis of mode partition noise in laser transmission systems,”
IEEE J. Quantum Electron., vol. 18, pp. 849- 855, May 1982.
[72] K. Ogawa and R. Vodhanel, "Measurements of mode partition noise of laser
diodes," IEEE J. Quantum Electron., vol. 18, pp. 1090- 1093, Jul. 1982.
[73] P.-L. Liu and K. Ogawa, "Statistical measurements as a way to study mode
partition in injection lasers," J. Lightwave Technol., vol. 2, pp. 44- 48, Feb. 1984.
[74] J.C. Campbell, "Calculation of the dispersion penalty for the route design of
single-mode systems," J. Lightwave Technol., vol. 6, pp. 564-573, Apr. 1988.
[75] D. Marcuse, “Computer simulation of laser photon fluctuations: Theory of single-
cavity laser,” IEEE J. Quantum Electron., vol. 20, pp. 1139-1148, Oct. 1984.
[76] D. Marcuse, “Computer simulation of laser photon fluctuations: Single-cavity
laser results,” IEEE J. Quantum Electron., vol. 20, pp. 1148-1155, Oct. 1984.
[77] L. V. T. Nguyen, “Mode-partition noise in semiconductor lasers”, Defense
Science and Technology Organization (Australia) research report DSTO-RR-0244,
Sep. 2002.
[78] M. Ahmed and M. Yamada, "Influence of instantaneous mode competition on the
dynamics of semiconductor lasers," IEEE J. Quantum Electron., vol. 38, pp. 682-
693, Jun. 2002.

Ph.D. Thesis – Qingyi Guo; McMaster University – Electrical & Computer Engineering
109
[79] M. Yamada, W. Ishimori, H. Sakaguchi, and M. Ahmed, "Time-dependent
measurement of the mode-competition phenomena among longitudinal modes in
long-wavelength lasers," IEEE J. Quantum Electron., vol. 39, pp. 1548-1554, Dec.
2003.
[80] A. M. Yacomotti, L. Furfaro, X. Hachair, F. Pedaci, M. Giudici, J. Tredicce, J.
Javaloyes, S. Balle, E. A. Viktorov, and P. Mandel, "Dynamics of multimode
semiconductor lasers," Phys. Rev. A, vol. 69, 053816, May 2004.
[81] L. Furfaro, F. Pedaci, M. Giudici, X. Hachair, J. Tredicce, and S. Balle, "Mode-
Switching in Semiconductor Lasers," IEEE J. Quantum Electron., vol. 40, pp.
1365-1376, Oct. 2004.
[82] G. P. Agrawal, P. J. Anthony, and T.-M. Shen, "Dispersion penalty for 1.3 μm
lightwave systems with multimode semiconductor lasers," J. Lightwave Technol.,
vol. 6, pp. 620-625, May 1988.
[83] N. Cheung, S. Davidow, and D. Duff, "A 90-Mb/s transmission experiment in
single-mode fibers using 1.5-µm multi-longitudinal- mode InAsGaP/InP lasers," J.
Lightwave Technol., vol. 2, pp. 1034- 1039, Dec. 1984.
[84] R. H. Wentworth, G. E. Bodeep, and T. E. Darcie, "Laser mode partition noise in
lightwave systems using dispersive optical fiber," J. Lightwave Technol., vol. 10,
pp. 84-89, Jan. 1992.

Ph.D. Thesis – Qingyi Guo; McMaster University – Electrical & Computer Engineering
110
[85] K. Iwashita and K. Nakagawa, "Mode partition noise characteristics in high-speed
modulated laser diodes," IEEE J. Quantum Electron., vol. 18, pp. 2000-2005, Dec.
1982.
[86] T. M. Shen and G. P. Agrawal, "Theoretical analysis of mode partition noise in
single-frequency semiconductor lasers," Electron. Lett., vol. 21, pp. 1220-1221,
Dec. 1985.
[87] S. Lathi, S. Inoue, S. Kasapi, and Y. Yamamoto, "Longitudinal mode-partition
noise in diode lasers," IEEE Quantum Electronics and Laser Science Conference
(QELS), pp. 92-93, May 1997.
[88] X. Wang and K. Chan, "Impact of mode partition noise in free-running gain-
switched Fabry-Perot laser for 2-dimensional OCDMA," Opt. Express, vol. 12, pp.
3334-3340, Jul. 2004.
[89] J. C. Cartledge, “Performance implications of mode partition fluctuations in
nearly single longitudinal mode lasers,” J. Lightwave Technol., vol. 6, pp. 626-
635, May 1988.
[90] J. C. Cartledge and A. F. Elrefaie, “Threshold gain difference requirements for
nearly single-longitudinal-mode lasers,” J. Lightwave Technol., vol. 8, pp. 704-
715, May 1990.

Ph.D. Thesis – Qingyi Guo; McMaster University – Electrical & Computer Engineering
111
[91] J. C. Cartledge, “On the probabilistic characterization of side mode fluctuations in
pulse-modulated nearly-single-mode semiconductor lasers,” IEEE J. Quantum
Electron., vol. 26, pp. 2046- 2051, Dec. 1990.
[92] B. R. Clarke, "Mode partition noise introduced by optical filtering," Electron.
Lett., vol. 25, pp. 211-212, Feb. 1989.
[93] P. Anandarajah, L. P. Barry, and A. Kaszubowska, "Cross-channel interference
due to mode partition noise in WDM optical systems," Proceedings of 2001 3rd
International Conference on Transparent Optical Networks, pp. 173-176, Jun.
2001.
[94] Z. M. Liao and G. P. Agrawal, "Mode-partition noise in fibre lasers," Electron.
Lett., vol. 36, pp. 1188-1189, Jul. 2000.
[95] M. Ramadan, "Parameters affecting mode partition noise in laser transmission
systems," IEEE Global Telecommunications Conference and Exhibition
'Communications Technology for the 1990s and Beyond' (GLOBECOM), vol. 2,
pp. 692 - 695, Nov. 1989.
[96] C. M. Olsen, K. E. Stubkjaer, and H. Olesen, “Noise caused by semiconductor
lasers in high-speed fiber-optic links,” J. Lightwave Technol., vol. 7, pp. 657-665,
Apr. 1989.

Ph.D. Thesis – Qingyi Guo; McMaster University – Electrical & Computer Engineering
112
[97] C. Michie, T. Kelly, and I. Andonovic, "Reflective semiconductor optical
amplifiers in passive optical networks," 14th OptoElectronics and
Communications Conference (OECC), pp. 1-2, Jul. 2009.
[98] K. Sato and H. Toba, "Reduction of mode partition noise by using semiconductor
optical amplifiers," IEEE J. Sel. Topics Quantum Electron., vol. 7, no. 2, pp. 328-
333, Mar./Apr. 2001.
[99] H.-S. Kim, T. T. Pham, Y.-Y. Won, and S.-K. Han, "Simultaneous wired and
wireless 1.25-Gb/s bidirectional WDM-RoF transmission using multiple optical
carrier suppression in FP LD," J. Lightwave Technol., vol. 27, pp. 2744-2750, Jul.
2009.
[100] D. Mandridis, I. Ozdur, M. Akbulut and P. J. Delfyett, "A photonic method for
overcoming the mode partition noise contribution in the AM Noise spectra of
periodic electrical signals," Conference on Lasers and Electro-Optics (CLEO)
and Quantum Electronics and Laser Science Conference (QELS), pp. 1-2, May
2010.
[101] S. Pato, P. Monteiro, and H. Silva, "Impact of mode-partition noise in the
performance of 10 Gbit/s Ethernet passive optical networks," 9th International
Conference on Transparent Optical Networks (ICTON), vol. 4, pp.67-70, Jul.
2007.

Ph.D. Thesis – Qingyi Guo; McMaster University – Electrical & Computer Engineering
113
[102] N. H. Jensen, H. Olesen, and K. E. Stubkjaer, "Partition noise in semiconductor
lasers under CW and pulsed operation," IEEE J. Quantum Electron., vol. 23, pp.
71- 80, Jan. 1987.
[103] W. H, Press, S. A. Teukolsky, W. T. Vetterling, and B. P. Flannery, Numerical
Recipes in C, 2nd-Ed, Cambridge University Press, 1992.