RADIO-TO-OPTICAL FLUX DENSITY RADIO LUMINOSITY RADIO MORPHOLOGY
STUDIES ON OPTICAL COMPONENTS AND RADIO OVER FIBRE SYSTEMS
THESIS SUBMITTED IN PARTIAL FULFILLMENT OF THE REQUIREMENTS FOR THE DEGREE OF
BACHELOR OF TECHNOLOGY IN
Electronics and Communication ENGINEERING
By
ANKUSH KUMAR
DEPARTMENT OF Electronics and communication ENGINEERING NATIONAL INSTITUTE OF TECHNOLOGY
ROURKELA, ORISSA-769008 2009
STUDIES ON OPTICAL COMPONENTS AND RADIO OVER FIBRE SYSTEMS
THESIS SUBMITTED IN PARTIAL FULFILLMENT OF THE REQUIREMENTS FOR THE DEGREE OF
BACHELOR OF TECHNOLOGY IN
Electronics and Communication ENGINEERING
By
ANKUSH KUMAR
Under the guidance of
Prof P.K.Sahu
DEPARTMENT OF Electronics and communication ENGINEERING NATIONAL INSTITUTE OF TECHNOLOGY
ROURKELA, ORISSA-769008 2009

iii
National Institute of Technology Rourkela
CERTIFICATE
This is to certify that the thesis entitled “STUDIES ON OPTICAL COMPONENTS AND
RADIO OVER FIBRE SYSTEMS” submitted by Ankush Kumar, Roll no-10509029 in
partial fulfillment of the requirements for the award of Bachelor of Technology
degree in Electronics and communication Engineering at the National Institute of
Technology, Rourkela (Deemed University) is an authentic work carried out by
him under my supervision and guidance.
To the best of my knowledge, the matter embodied in the thesis has not been
submitted to any other University/Institute for the award of any Degree or
Diploma.
Prof P.K.Sahu Dept. of Electronics and communication engineering
National Institute of Technology Rourkela, Orissa-769008
Date:

iv
ACKNOWLEDGEMENT I wish to express my profound gratitude and indebtedness to Prof P.K.Sahu,
Department of Electronics and communication Engineering, N.I.T Rourkela and
Prof S.K.Patra, Head of department, Department of Electronics and
communication Engineering, N.I.T. Rourkela for their inspiring guidance,
constructive criticism and valuable suggestion throughout this project work.
.
Last but not least, I sincere thanks to all our friends who have patiently extended
all sorts of help for accomplishing this undertaking
Ankush Kumar
Roll no -10509029
v
ABSTRACT
In the modern era good communication systems are the need of the hour. This project includes
the study of optical components and Radio over Fibre systems. Various Optical components are
used in optical systems and those optical components have different characteristics. Various
optical components have been studied in this project and in addition to that there is a study of
components using S-matrix. The use of S-matrix in analyising the directional coupler. Optical
networks can be analysed with the same methods as microwave networks in theory of microwave
networks, components are generally represented by complex scattering parameters which form
the S- matrix. we adopted this formalism to fibre optic coupler used in optical network taking the
polarization dependence into account. There is the study of Fabry- perot filter in which the study
of free spectral range (FSR) and the Transfer function was determined through Matlab
simulation. The results thus obtained are studied.
For the future provisions of broadband, multimedia the radio over fibre
systems are a good alternative. RoF systems are used basically because of their low loss and
extremely wide bandwidth and robustness. Radio over fibre can use millimeter waves and serve
as a high speed wireless local or personal area network. In this project various parts of the Radio
over fibre systems are studied, The power spectrum measurements of a millimeter wave Radio
over Fibre under different single mode fibre length is done with a Matlab simulation it is found
that the fading occurs at some values of length of fibre in the power spectrum.
In radio over fibre systems the two subcarrier modulations
(SCMs) i.e., single sideband and tandem single sideband have been widely used both SSB and
TSSB SCMs can be obtained by using optical mach Zehnder modulator. In this project we
investigate the impact of the impact of the harmonic distortion and inter modulation distortion in
RoF systems for one wavelength carrying two radio frequency signals with either SSB or TSSB
SCM. It is found that non linear distortion can be reduced when the frequency difference ~ 1
GHz. It was found that non linear distortion strongly depends on the modulation index. The
source of these results was a mat lab simulation and calculations. For the different values of the
signal frequencies the NSR was calculated.

vi
CONTENTS
CHAPTER PAGE NO.
1.INTRODUCTION 1.1 Optical communication 1.2 Optical fibre 1.3 losses in optical fibre 1.4 optical fibre connector 1.5 optical fibre coupler 1.6 Fabry perot filter 1.7 Radio over fibre systems 2. OPTICAL COMPONENT ANALYSIS 2.1 S matix representation of fibre optic couplers 2.1.1 Scattering parameters 2.1.2 JoneS-matrixof a coupler 2.2 Simulation work 1(Fabry perot filter) 2.2.1 Theory 2.3 Results 3. RADIO OVER FIBRE SYSTEMS 3.1 Radio over fibre systems 3.1.1 RoF link configurations 3.2 Millimeter wave band characteristics 3.3 Simulation work 2(power spectrum measurements of RoF) 3.3.1 Theory 3.3.2 Results and discussions 3.4 Simulation work 3(impact of non linear distortion in RoF systems) 3.4.1 ROF using TSSB SCM 3.4.2 ROF using SSB SCM 3.5 Result and discussion 3.6 Future scope of work REFERENCES
1-20 2 3 7 10 12 16 18 21-30 22 22 24 25 26 28 31-58 32 34 37 40 41 42 44 46 51 55 58 59-63

vii
LIST OF TABLES
TABLE PAGE NO
Table 1 NSR for optical carrier having TSSB SCM Table 2 NSR for one optical carrier having TSSB SCM Table 3 NSR for one optical carrier having two SSB subcarriers Table 4 values for NSR for optical carrier having TSSB SCM Table 5 values for NSR for one optical carrier having TSSB SCM Table 6 values for NSR for one optical carrier having two SSB subcarriers
48
50
54
56
56
56
LIST OF FIGURES TABLE PAGE NO
Fig 1.1 Optical fibre communication system Fig 1.2 Optical connector Fig 1.3 Directional coupler Fig 1.4 Fabry perot filter Fig 2.1 Transmitted intensity of a Fabry perot filter Fig 2.2 Finesse factor vs the mirror reflectivity Fig 3.1 A general radio over fibre system Fig 3.2
a. RF modulated signal b. IF modulated signal c. BB modulated signal d. Direct modulation
Fig 3.3 Combination of DWDM and ROF configuration Fig 3.4 Setup for power spectrum measurements
5
10
14
17
28
29
33
36-37
39
40
viii
Fig 3.5 Power spectrum for photo -detector at 58.1 GHz Fig 3.6 Power spectrum for photo-detector at various frequencies Fig 3.7 Power spectrum with noise in channel Fig 3.8 Schematic of ROF system using TSSB SCM Fig 3.9 ROF system having SSB SCM Fig 3.10 Electric field distribution of TSSB SCM Fig 3.11 Electric field distribution of SSB SCM
42
43
44
46
51
57
57

1
Chapter 1
INTRODUCTION
1.1 Optical communication
1.2 Optical fibre
1.3 losses in optical fibre
1.4 Optical fibre connector
1.5 Optical fibre coupler
1.6 Fabry perot filter
1.7 Radio over fibre systems

2
CHAPTER 1
INTRODUCTION
1.1 OPTICAL COMMUNICATION
Optical communication may be defined as the form of communication that uses light as the
transmission medium. An optical communication[32] system has many parts like a transmitter,
which encodes a message into an optical signal, it also comprises of a channel, which carries the
signal to its destination, and a receiver, which reproduces the message from the received optical
signal.
FORMS OF OPTICAL COMMUNICATION
In the old times, Techniques [4], such as semaphore lines, ship flags, smoke signals, and beacon
fires were used as optical communication early forms
There is a type of optical communication in which a mirror is used to reflect sunlight to a
distant observer. By moving the mirror the distant observer sees flashes of light that can be used
to send a prearranged signaling code. It’s called as heliograph.
Many mariners used Distress flares in emergencies, while lighthouses and navigation lights
are used to communicate navigation hazards.
Optical fibre is the most common medium for modern digital optical communication.
Free-space optical communication is also used today in a variety of applications.

3
OPTICAL FIBRE COMMUNICATION
The most common type of channel for optical communications is optical fibre, however, there
are different types of optical waveguides used in communication systems, The transmitters in
optical fibre links are generally light-emitting diodes (LEDs) or laser diodes. Infrared light,
rather than visible light is used more commonly, The reason for using the same is because
optical fibres transmit infrared wavelengths with less attenuation and dispersion. The signal
encoding is typically simple intensity modulation, although optical phase and frequency
modulation have been tested in the lab. The need for periodic signal regeneration was largely
superseded by the introduction of the erbium-doped fibre amplifier, which amplifies the signal
and extended link distances at significantly lower cost.
FREE SPACE OPTICAL COMMUNICATION
Free Space Optics (FSO) systems are point to point communication systems that can function
over distances of several kilometers as long as there is a clear line of sight between the source
and the destination, and the optical receiver can reliably decode the transmitted information.
1.2 OPTICAL FIBRE
An optical fibre is a glass or plastic fibre that carries light along its length[32].the science dealing
with applied science and engineering concerned with the design and application of optical fibres
is called as Fibre optics. Optical fibres are widely used in fibre-optic communications, which
permits transmission over longer distances and at higher bandwidths (data rates) than other forms
of communications. The signals travel along the fibres with less loss, and they are also immune
to electromagnetic interference that’s why fibres are used in place of metal wires. Fibres are also
used for illumination, and are wrapped in bundles so they can be used to carry images, thus
allowing viewing in tight spaces. Specially designed fibres are used for a variety of other
applications, including sensors and fibre lasers.
Light is kept in the core of the optical fibre by total internal reflection. This causes the fibre
to act as a waveguide. There are two types of Fibres. Fibres which support many propagation
paths or transverse modes are called multi-mode fibres (MMF), while those which can only

4
support a single mode are called single-mode fibres (SMF). Multi-mode fibres generally have a
larger core diameter, and are used for short-distance communication links and for applications
where high power must be transmitted. Single-mode fibres are used for most communication
links longer than 550 metres.
Joining lengths of optical fibre is more complex than joining electrical wire or cable. The
ends of the fibres must be carefully cleaved, and then spliced together either mechanically or by
fusing them together with an electric arc. Special connectors are used to make removable
connections.
FIBRE USE IN COMMUNICATION
In 1880, only four years after his invention of the telephone [58], Alexander Graham Bell made a
device called photo-phone to use light for the transmission of speech. It was a tube with a
flexible mirror at its end. He spoke down the tube and the sound vibrated the mirror. The
modulated light was detected by a photocell placed at a distance of 200m or so. After the
invention of the ruby laser in 1960, the direct use of light for communication was reinvestigated.
However, there was a need of a specific data medium for the systems.
It was an interesting idea and in 1983 it was used to send a message, by Morse code, over a
distance of 240 km (150 miles) between two mountaintops. Many researches were done for the
development of an optic fibre to carry the light over long distances. The early results were
disappointing. The losses were such that the light power was halved every three meters along the
route. This would reduce the power by a factor of a million over only 60 meters (200 feet).
Obviously this would rule out long distance communications even when using a powerful laser.
Then there was usage of a silica glass with losses comparable with the best copper cables. The
glass used for optic fibre is unbelievably clear. We occasionally use plastic for optic fibre but its
losses are still impossibly high for long distance communications, but for short links of a few
tens of meters it is satisfactory and simple to use. It is finding increasing applications in hi-fi
systems, And in automobile and other control circuitry. On the other hand, a fibre optic system
using a glass fibre is certainly capable of carrying light over long distances. By converting an
input signal into short flashes of light, the optic fibre is able to carry complex information over
distances of more than a hundred kilometers without additional amplification. This is at least

fifty time
basically
a laser or
end, are
input sign
MOTIVA
The mot
invented
the optic
transmiss
problems
However
cost and
on/off ke
es better than
y very simple
r an LED (li
converted t
nal is recove
ATIONS FO
tivation for
in the early
cal spectrum
sion links w
s were faced
r, it also was
operational
eyed links. T
Fig
n the distanc
e: a signal is
ight emitting
to an electri
ered
OR USING O
developing
1960s. The
m as an ex
with extrem
d in the wa
s noted that o
advantages
The various
g 1.1 Optical
ces attainabl
s used to mo
g diode). The
cal signal b
OPTICAL FI
optical fibr
further stud
xtension of
mely high ca
ay of achievi
other proper
over coppe
advantages o
l fibre comm
5
e using the b
dulate, the l
e flashes of
by means of
IBRE SYST
re communi
dies of this d
f the radio
apacities. A
ing such a s
rties of optic
er wires and
of optical fib
munication sy
best copper c
ight output o
light travel a
f a photo-ele
TEMS
ication syste
evice encour
and micro
As research
super broadb
cal fibres gav
d made them
bres are:
ystem [58]
coaxial cabl
of a suitable
along the fib
ectric cell. T
ems started
raged resear
owave spect
progressed,
band commu
ve them a nu
m highly attra
es. The syst
e source – us
bre and, at th
Thus the ori
when laser
rchers to exa
trum to pro
, many com
unication sy
umber of inh
active for si
em is
sually
he far
iginal
r was
amine
ovide
mplex
stem.
herent
imple

6
1. Long transmission distance.
Optical fibres can be used to send the data over longer distances. This means that data can be
sent over longer distances, they have lower transmission losses compared to copper wires
thereby reducing the number of intermediate repeaters needed for these spans. This reduction in
equipment and components decreases system cost and complexity.
2. Large information capacity:
Optical fibres can be used to send more information simultaneously over a single line, optical
fibres have wider bandwidths than copper wires. This property results in a decrease in the
number of physical lines needed for sending a certain amount of information.
3. Small size and low weight.:
The low weight and the small dimensions of fibres offer a distinct advantage over heavy, bulky
wire cables in crowded underground city ducts or in ceiling-mounted cable trays. This also is of
importance in aircraft, satellites, and ships where small, lightweight cables are advantageous, and
in tactical military applications where large amounts of cable must be unreeled and retrieved
rapidly.
4. Immunity to electrical interference:
An especially important feature of optical fibres[32] relates to the fact is that they do not
conduct electricity. they are made up of dielectric materials, This makes optical fibres immune to
the electromagnetic interference effects seen in copper wires, such as inductive pickup from
other adjacent signal-carrying wires or coupling of electrical noise into the line from any type of
nearby equipment.
5. Enhanced safety:
Optical fibres do not have the problems of ground loops, sparks, and potentially high voltages
inherent in copper lines. However, precautions with respect to laser light emissions need to be
observed to prevent possible eye damage.
6. Increased signal security:
An optical fibre has the optical signal well confined within the fibre and any signal emissions
are absorbed by an opaque coating around the fibre. This offers a high degree of data security,
since This is in contrast to copper wires where electric signals often can be tapped off easily.

7
This makes fibres attractive in applications where information security is important, such as in
financial, legal, government, and military systems.
HOW DOES A FIBRE WORK REFRACTION
Consider a flashlight. The light waves spread out along its beam. Looking down and seeing the
wave crests it would appear As we move further from the light source, the wavefront gets
straighter and straighter. At a long distance from the light source, the wavefront would be
virtually straight. In a short interval of time each end of the wavefront would move forward a set
distance. If we look at a single ray of light moving through a clear material the distance advanced
by the wave front would be quite regular
There is a widely held view that light always travels at the same speed [58]. This ‘fact’ is
simply not true. The speed of light depends upon the material through which it is moving. In free
space light travels at its maximum possible speed, close to 300 million meters or nearly eight
times round the world, in a second. When it passes through a clear material, it slows down by an
amount dependent upon a property of the material called its refractive index. For most materials
that we use in optic fibres, the refractive index is in the region of 1.5.
So: Speed of light in free space/speed of light in the material = refractive index
1.3 LOSSES IN OPTICAL FIBRES
Basically, there are just two ways of losing light. Either the fibre is not clear enough or the
light is being diverted in the wrong direction.
ABSORPTION
Any impurities that remain in the fibre[32],[58] after manufacture will block some of the light
energy. The main impurities are hydroxyl ions and traces of metals. The hydroxyl ions are
actually the form of water which caused the large losses at 1380 nm. In a similar way, metallic
traces can cause absorption of energy at their own particular wavelengths. These small
absorption peaks are also visible. In both cases, the answer is to ensure that the glass is not
8
contaminated at the time of manufacture and the impurities are reduced as far as possible. Now
for the second reason, the diversion of the light.
RAYLEIGH SCATTERING
This is the scattering of light due to small localized changes in the refractive index of the core
and the cladding material. The changes are indeed very localized. It has dimensions which are
less than the wavelength of the light. There are two causes, both problems within the
manufacturing processes. The first is the fluctuations in the ‘mix’ of the ingredients. These
random changes are impossible to completely eliminate. The other cause is slight changes in the
density as the silica cools and solidifies.
FRESNEL REFLECTION
When a ray of light strikes a change of refractive index and is approaching at an angle close to
the normal, most of the light passes straight through. Most of the light but not all. A very small
proportion is reflected back off the boundary. We have seen this effect with normal window
glass. Looking at a clean window we can see two images. We can see the scene in front of us and
we can also see a faint reflection of what is behind us. Light therefore is passing through the
window and is also being reflected off the surface.
Reflected power = 2)21(2)21(
nnnn
+
−

9
BENDING LOSSES
MACROBENDS
A sharp bend in a fibre can cause significant losses as well as the possibility of mechanical
failure. It is easy to bend a short length of optic fibre to produce higher losses than a whole
kilometer of fibre in normal use.
The normal is always at right angles to the surface of the core. Now, if the core bends, the
normal will follow it and the ray will now find itself on the wrong side of the critical angle and
will escape
MICROBENDS
These are identical in effect to the microbend already described but differ in size and cause.
Their radius is equal to, or less than, the diameter of the bare fibre – very small indeed. These
are generally a manufacturing problem. A typical cause is differential expansion of the optic
fibre and the outer layers. If the fibre gets too cold, the outer layers will shrink and get shorter. If
the core/cladding shrinks at a slower rate, it is likely to kink and cause a microbend.

10
1.4 OPTICAL FIBRE CONNECTORS
Connectors and adapters are the plugs[32] and sockets of a fibre optic system. They allow the
data to be re-routed and equipment to be connected to existing systems. Connectors are
inherently more difficult to design than mechanical splices. This is due to the added requirement
of being able to be taken apart and replaced repeatedly. It is one thing to find a way to align two
fibres but it is
something altogether different if the fibres are to be disconnected and reconnected hundreds of
times and still need to perform well. If two fibres are to be joined, each fibre has a connector
attached and each is then plugged into an adapter. An adapter is basically a tube into which the
two connectors are inserted. It holds them in alignment and the connectors are fixed onto the
adapter to provide mechanical support. An adapter is shown as part of Although different makes
are sold as compatible, it is good practice to use the same manufacturer for the connector and for
the adapter. The design of connectors originated with the adaptation of those used for copper
based coaxial cables, which were usually fitted by the manufacturers onto a few meters of fibre
called a pigtail which was then spliced into the main system. Most connectors nowadays are
fitted by the installer although pre-fitted ones are still available. The benefit of using the pre-
fitted and pigtailed version is that it is much quicker and easier to fit a mechanical splice or
perform a fusion splice than it is to fit a connector, so there is some merit in allowing the factory
to fit the connector since this saves time.
Fig1. 2. Optical connector [58]

11
CONNECTOR PARAMETERS
INSERTION LOSS
This is the most important measure of the performance of a connector. Imagine we have a length
of fibre which is broken and reconnected by two connectors and an in-line adapter. If the loss of
the system is measured and found to have increased by 0.4 dB then this is the value of the
insertion loss. It is the loss caused by inserting a mated pair of connectors in a fibre. Insertion
loss for optical connectors only makes sense when considering the loss across two mated
Connectors. Typical values are 0.2–0.5 dB per mated pair but the international standards
recognize and allow a loss of up to 0.75 dB and this would be considered a compliant connector.
RETURN LOSS
This loss occurs when power is being reflected[4] off the connector back towards the light
source.
This is a measure of the Fresnel reflection. The lasers and LEDs used for multimode working
are not greatly affected by the reflected power and so the return loss is not usually quoted in this
instance. In single mode systems the laser is affected and produces a noisy output. The laser
suppliers will always be pleased to advise on permitted levels of return loss.
MATING DURABILITY
Also called insertion loss change. It is a measure of how much the insertion loss is likely to
increase in use after it has been connected and disconnected a large number of times.
Typical value: 0.2 dB per 1000 matings.
OPERATING TEMPRATURE
These are, of course, compatible with the optic fibre cables. Typical values: 25°C to 80°C.
12
CABLE RETENTION
Also called tensile strength or pull-out loading. This is the loading that can be applied to the
cable before the fibre is pulled out of the connector. It is similar in value to the installation
tension on a lightweight cable.
Typical value: 200N.
REPEATIBILITY
This is a measure of how consistent the insertion[58] loss is when a joint is disconnected and
then remade. It is not a wear-out problem like mating durability but simply a test of whether the
connector and adapter are designed so that the light path is identical each time they are joined.
This is an important feature of a connector but is not always quoted in specifications owing to
the difficulty in agreeing a uniform method of measuring it. Some manufacturers do give a figure
for it; some just use descriptive terms like ‘high’ or ‘very high’. The quoted insertion loss should
actually be the average insertion loss over a series of matings, thus taking repeatability into
account.
1.5 OPTICAL FIBRE COUPLERS
When an optic fibre carrying an input signal needs to be connected to two different destinations.
The signal needs to be split into two. This is easily[4] achieved by a coupler. When used for this
purpose, it is often referred to as a splitter. Couplers are bi-directional – they can carry light in
either direction. Therefore the coupler described above could equally well be used to combine
the signals from two transmitters onto a single optic fibre[32]. In this case, it is called a
combiner.It is exactly the same device. It is just used differently .Physically, they look almost the
same as a mechanical splice, If there is one fibre at each end, it is a mechanical splice; any other
number and it is a coupler.
Directional couplers are passive devices used in the field of radio technology. They couple part
of the transmission power in a transmission line by a known amount out through another port,
often by using two transmission lines set close enough together such that energy passing through
one is coupled to the other. The device has four ports: input, transmitted, coupled, and isolated.

The term
the main
may use
external
coupler i
which wi
the coup
couplers)
Physic
coupled o
without i
three is h
transmiss
coupler i
coaxial c
is much w
3). Howe
example,
m "main line"
n line is desi
a small SM
matched loa
is a linear d
ill result in t
led port, an
).
cal consider
output from
interrupting
half the inp
sion line is
is referred to
couplers spec
wider (i.e. if
ever it shoul
, a λ/4 coupl
" refers to th
igned for hi
MA connec
ad (typically
evice, the n
the directly c
d the diagon
ations such a
the directio
the main po
ut power (i.
also 3 dB b
o as a 90 de
cified by ma
f the spec is
ld be recogn
led line coup
Fig 1.3
he section be
igh power o
tor. Often t
y 50 ohms).
otations on
connected po
nal port bein
as internal lo
onal coupler
ower flow i
.e. 3 dB bel
below the in
egree hybrid
anufacturers
2-4 GHz, th
nized that th
pler will have
3. Directiona
13
etween ports
operation (la
the isolated
It should b
Figure 1.3 a
ort being the
ng the isolat
oad on the is
can be used
in the system
low the inpu
nput power
d, hybrid, or
is that of th
he main arm
he coupled r
e responses
al coupler [3
s 1 and 2. O
arge connect
port is term
be pointed o
are arbitrary
e transmitted
ted port (for
solated port w
d to obtain th
m. When th
ut power lev
and equals
r 3 dB coup
he coupling
could opera
response is p
at nλ/4 wher
2]
On some dire
tors), while
minated wit
out that sinc
y. Any port
d port, the ad
r stripline an
will limit po
he informati
e power cou
vel), the pow
the coupled
ler. The freq
arm. The m
ate at 1 or 5 G
periodic wit
re n is an od
ectional coup
the coupled
th an intern
ce the direct
can be the i
djacent port b
nd microstri
ort operation
ion on the s
upled out to
wer on the
d power. Su
quency rang
ain arm resp
GHz - see F
th frequency
dd integer.
plers,
d port
nal or
tional
input,
being
ipline
n. The
signal
o port
main
uch a
ge for
ponse
Figure
y. For

14
Common properties desired for all directional couplers are wide operational bandwidth, high
directivity, and a good impedance match at all ports when the other ports are terminated in
matched loads. These performance characteristics of hybrid or non-hybrid directional couplers
are self-explanatory. Some other general characteristics will be discussed below.
COUPLING FACTOR
The coupling factor is defined as:
Coupling factor db 10 logP3
1
where P1 is the input power at port 1 and P3 is the output power from the
coupled port The coupling factor represents the primary property of a directional coupler.
Coupling is not constant, but varies with frequency. While different designs may reduce the
variance, a perfectly flat coupler theoretically cannot be built. Directional couplers are specified
in terms of the coupling accuracy at the frequency band center. For example, a 10 dB coupling
+/- 0.5 dB means that the directional coupler can have 9.5 dB to 10.5 dB coupling at the
frequency band center. The accuracy is due to dimensional tolerances that can be held for the
spacing of the two coupled lines. Another coupling specification is frequency sensitivity. A
larger frequency sensitivity will allow a larger frequency band of operation. Multiple quarter-
wavelength coupling sections are used to obtain wide frequency bandwidth directional couplers.
Typically this type of directional coupler is designed to a frequency bandwidth ratio and a
maximum coupling ripple within the frequency band. For example a typical 2:1 frequency
bandwidth coupler design that produces a 10 dB coupling with a +/- 0.1 dB ripple would, using
the previous accuracy specification, be said to have 9.6 +/- 0.1 dB to 10.4 +/- 0.1 dB of coupling
across the frequency range.
LOSS
In an ideal directional coupler, the main line loss[32] from port 1 to port 2 (P1 - P2) due to power
coupled to the coupled output port is:

15
Insertion loss db 10log 1P3P1
The actual directional coupler loss will be a combination of coupling loss, dielectric loss,
conductor loss. Depending on the frequency range, coupling loss becomes less significant above
15 dB coupling where the other losses constitute the majority of the total loss.
ISOLATION
Isolation of a directional coupler can be defined as the difference in signal levels in dB between
the input port and the isolated port when the two other ports are terminated by matched loads, or:
Isolation db 10logP4P1
Isolation can also be defined between the two output ports. In this case, one of the output ports is
used as the input; the other is considered the output port while the other two ports (input and
isolated) are terminated by matched loads.
Isolation db 10logP3P1
DIRECTIVITY
Directivity is directly related to isolation. It is defined as:
Isolation db 10log PP
= 10log PP
+10log PP
where: P3 is the output power from the coupled port and P4 is the power output from the isolated
port. The directivity should be as high as possible. The directivity is very high at the design
frequency and is a more sensitive function of frequency because it depends on the cancellation of

16
two wave components. Waveguide directional couplers will have the best directivity. Directivity
is not directly measurable, and is calculated from the isolation and coupling measurements as:
Directivity (dB) = Isolation (dB) - Coupling (dB)
1.6 FABRY PEROT FILTER
In optics, a Fabry-Pérot filter or etalon is typically made of a transparent plate with two
reflecting surfaces, or two parallel highly reflecting mirrors. Its transmission spectrum as a
function of wavelength exhibits peaks of large transmission corresponding to resonances of the
etalon. It is named after Charles Fabry and Alfred Perot. The resonance effect of the Fabry-Pérot
filter is identical to that used in a dichroic filter. That is, dichroic filters are very thin sequential
arrays of Fabry-Pérot filters, and are therefore characterised and designed using the same
mathematics.
Etalons are widely used in telecommunications, lasers and spectroscopy to control and measure
the wavelengths of light. Recent advances in fabrication technique allow the creation of very
precise tunable Fabry-Pérot filters.
Fig 1.4 Fabry-perot filter [6]

17
The varying transmission function of an etalon is caused by interference between the multiple
reflections of light between the two reflecting surfaces. Constructive interference occurs if the
transmitted beams are in phase, and this corresponds to a high-transmission peak of the etalon. If
the transmitted beams are out-of-phase, destructive interference occurs and this corresponds to a
transmission minimum. Whether the multiply-reflected beams are in-phase or not depends on the
wavelength (λ) of the light (in vacuum), the angle the light travels through the etalon (θ), the
thickness of the etalon (l) and the refractive index of the material between the reflecting surfaces
(n).The phase difference between each succeeding reflection is given by δ:
2nlcos
A Fabry-Pérot interferometer differs from a Fabry-Pérot etalon in the fact that the distance l
between the plates can be tuned in order to change the wavelengths at which transmission peaks
occur in the interferometer. Due to the angle dependence of the transmission, the peaks can also
be shifted by rotating the etalon with respect to the beam.
Fabry-Pérot interferometers or etalons are used in optical modems, spectroscopy, lasers, and
astronomy.
1.7 RADIO OVER FIBRE COMMUNICATION SYSTEMS
A technology whereby light is modulated by a radio signal and transmitted over an optical fibre
link to facilitate wireless access is referred to as Radio over Fibre (RoF). Although radio
transmission over fibre is used for multiple purposes, such as in cable television (CATV)
networks and in satellite base stations, the term RoF is usually applied when this is done for
wireless access.
In RoF systems, wireless signals are transported in optical form between a central station
and a set of base stations before being radiated through the air. Each base station is adapted to
communicate over a radio link with at least one user's mobile station located within the radio
range of said base station.

18
RoF transmission systems are usually classified into two main categories (RF-over-Fibre ; IF-
over-Fibre) depending on the frequency range of the radio signal to be transported.
a) In RF-over-Fibre architecture, a data-carrying RF (Radio Frequency) signal with a high
frequenty (usually greater than 10 GHz) is imposed on a lightwave signal before being
transported over the optical link. Therefore, wireless signals are optically distributed to base
stations(BS) directly at high frequencies and converted to from optical to electrical domain at the
base stations before being amplified and radiated by an antenna. As a result, no frequency
up/down conversion is required at the various base station, thereby resulting in simple and rather
cost-effective implementation is enabled at the base stations.
b) In IF-over-Fibre architecture, an IF (Intermediate Frequency) radio signal with a lower
frequency (less than 10 GHz) is used for modulating light before being transported over the
optical link. Therefore, wireless signals are transported at intermediate frequency over the
optical.
NEED OF RADIO OVER FIBRE SYSTEMS
For the future provision of broadband, interactive and multimedia services over wireless media,
some typical characteristics are required which are-1) to reduce cell size to accommodate more
users and 2) to operate in the microwave/millimeter wave (mm-wave) frequency bands to avoid
spectral congestion in lower frequency bands. It demands a large number of base stations (BSs)
to cover a service area, and cost-effective BS is a key to success in the market. This requirement
has led to the development of system architecture where functions such as signal
routing/processing, handover and frequency allocation are carried out at a central control station
(CS), rather than at the BS. Furthermore, such a centralized configuration allows sensitive
equipment to be located in safer environment and enables the cost of expensive components to
be shared among several BSs. An attractive alternative for linking a CS with BSs in such a radio
network is via an optical fibre network, since fibre has low loss, is immune to EMI and has broad
bandwidth. The transmission of radio signals over fibre, with simple optical-to electrical
conversion, followed by radiation at remote antennas, which are connected to a central CS, has
19
been proposed as a method of minimizing costs. The reduction in cost can be brought about in
two ways. Firstly, the remote antenna BS or radio distribution point needs to perform only
simple functions, and it is small in size and low in cost. Secondly, the resources provided by the
CS can be shared among many antenna BSs. This technique of modulating the radio frequency
(RF) subcarrier onto an optical carrier for distribution over a fibre network is known as .radio
over fibre. (RoF) technology. To be specific, the RoF network typically comprises a central CS,
where all switching, routing, medium access control (MAC) and frequency management
functions are performed, and an optical fibre network, which interconnects a large number of
functionally simple and compact antenna BSs for wireless signal distribution. The BS has no
processing function and its main function is to convert optical signal to wireless one and vice
versa. Since RoF technology was first demonstrated for cordless or mobile telephone service in
1990 , a lot of research efforts have been made to investigate its limitation and develop new, high
performance RoF technologies. Their target applications range from mobile cellular networks,
wireless local area network (WLAN) at mm-wave bands broadband wireless access networks to
road vehicle communication (RVC) networks for intelligent transportation system. Due to the
simple BS structure, system cost for deploying infrastructure can be dramatically reduced
compared to other wireline alternatives. In addition to the advantage of potential low cost, RoF
technology has the further a benefit of transferring the RF signal to and from a CS that can allow
flexible network resource management and rapid response to variations in traffic demand due to
its centralized network architecture.
some of its important characteristics are described below :
1. The system control functions, such as frequency allocation, modulation and
demodulation scheme, are located within the CS, simplifying the design of the BS. The
primary functions of the BSs are optical/RF conversion, RF amplification, and RF/optical
conversion.
2. This centralized network architecture allows a dynamic radio resource configuration and
capacity allocation. Moreover, centralized upgrading is also possible.
3. Due to simple BS structure, its reliability is higher and system maintenance becomes
simple.

20
4. In principle, optical fibre in RoF is transparent to radio interface format (modulation,
radio frequency, bit rate and so on) and protocol. Thus, multiple services on a single fibre
can be supported at the same time.
5. Large distances between the CS and the BS are possible.

21
Chapter 2
OPTICAL COMPONENT ANALYSIS
2.1 S-matix representation of fibre optic couplers
2.1.1 Scattering parameters
2.1.2 Jones matrix of a coupler
2.2 Simulation work 1(Fabry perot filter)
2.2.1 Theory
2.3 Results

22
OPTICAL COMPONENET ANALYSIS
2.1 S-MATRIXREPRESENTATION OF FIBRE OPTIC COUPLERS
2.1.1 SCATTERING PARAMETERS
In a microwave circuit, when a incoming wave with amplitude[12],[13] and phase comes on a
transmission line. This incoming wave is "scattered" by the circuit and its energy is partitioned
between all the possible outgoing waves on all the other transmission lines connected to the
circuit. The scattering parameters are fixed properties of the (linear) circuit which describe how
the energy couples between each pair of ports or transmission lines connected to the circuit.
Formally, s-parameters can be defined for any collection of linear electronic components,
whether or not the wave view of the power flow in the circuit is necessary. They are
algebraically related to the impedance parameters (z-parameters), also to the admittance
parameters (y-parameters) and to a notional characteristic impedance of the transmission lines.
An n-port microwave network has n arms into which power can be fed and from which
power can be taken. In general, power can get from any arm (as input) to any other arm (as
output). There are thus n incoming waves and n outgoing waves. We also observe that power can
be reflected by a port, so the input power to a single port can partition between all the ports of
the network to form outgoing waves.
Associated with each port is the notion of a "reference plane" at which the wave amplitude and
phase is defined. Usually the reference plane associated with a certain port is at the same place
with respect to incoming and outgoing waves.
In the case of a microwave network having two ports only, an input and an output, the s-matrix
has four s-parameters, designated
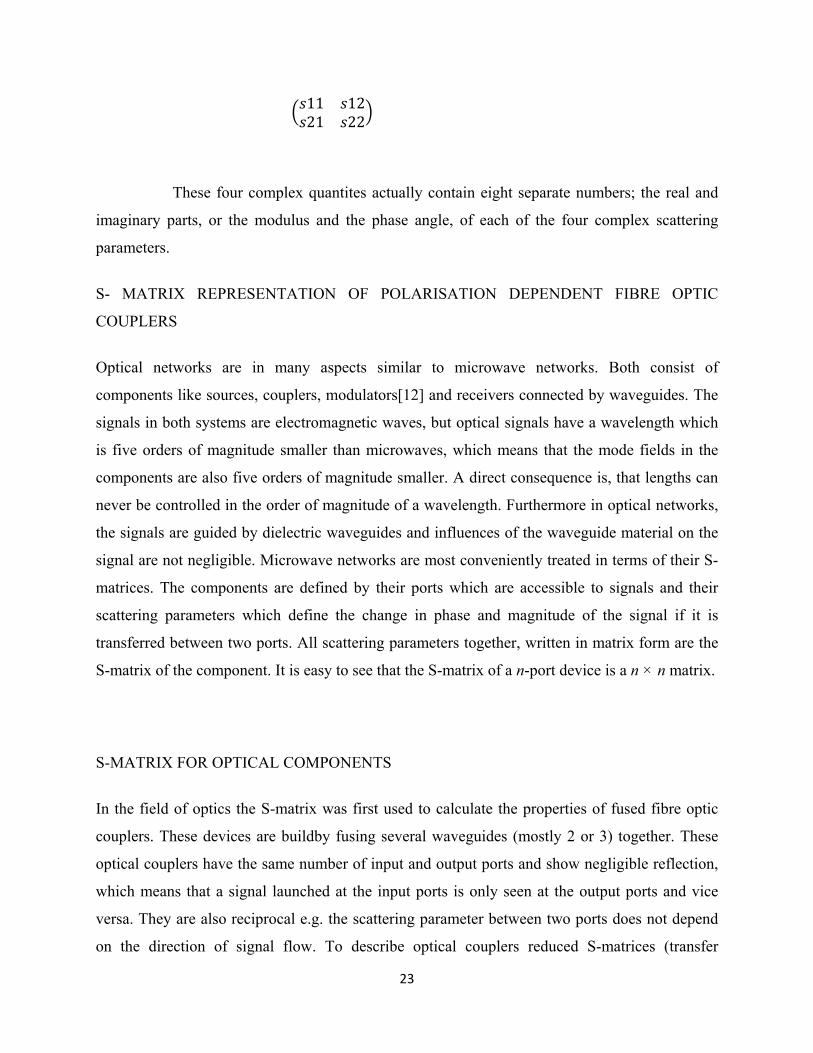
23
11 1221 22
These four complex quantites actually contain eight separate numbers; the real and
imaginary parts, or the modulus and the phase angle, of each of the four complex scattering
parameters.
S- MATRIX REPRESENTATION OF POLARISATION DEPENDENT FIBRE OPTIC
COUPLERS
Optical networks are in many aspects similar to microwave networks. Both consist of
components like sources, couplers, modulators[12] and receivers connected by waveguides. The
signals in both systems are electromagnetic waves, but optical signals have a wavelength which
is five orders of magnitude smaller than microwaves, which means that the mode fields in the
components are also five orders of magnitude smaller. A direct consequence is, that lengths can
never be controlled in the order of magnitude of a wavelength. Furthermore in optical networks,
the signals are guided by dielectric waveguides and influences of the waveguide material on the
signal are not negligible. Microwave networks are most conveniently treated in terms of their S-
matrices. The components are defined by their ports which are accessible to signals and their
scattering parameters which define the change in phase and magnitude of the signal if it is
transferred between two ports. All scattering parameters together, written in matrix form are the
S-matrix of the component. It is easy to see that the S-matrix of a n-port device is a n × n matrix.
S-MATRIX FOR OPTICAL COMPONENTS
In the field of optics the S-matrix was first used to calculate the properties of fused fibre optic
couplers. These devices are buildby fusing several waveguides (mostly 2 or 3) together. These
optical couplers have the same number of input and output ports and show negligible reflection,
which means that a signal launched at the input ports is only seen at the output ports and vice
versa. They are also reciprocal e.g. the scattering parameter between two ports does not depend
on the direction of signal flow. To describe optical couplers reduced S-matrices (transfer

24
matrices) were used. A transfer matrix of a n-port device is a n/2 × n/2 matrix. For example the
S-matrix of an 2 × 2 fused fibre optic coupler has the following form[13]
If there exists no reflection is evident from the zero submatrices. The coupler is reciprocal which
causes the lower left 2 × 2 submatrix to be the Transpose of the upper right 2 × 2 submatrix. The
coupler can therefore be fully described by the upper right submatrix alone which is the transfer
matrix of the coupler.
2 2
2.1.2 JONES-MATRIXOF A COUPLER
A generally polarized input field is now specified by its Jones vector The first three of the Jones
matrices necessary to describe the coupler can be obtained from these expressions. Since the
input field is completely arbitrary, it can be omitted and the relation with the fields after the
coupler written as Jones matrices. If the light enters the coupler through fibre 2 the same modes
are excited but their polarisations are rotated through 120, whereas if light is input through fibre
3 the modes must be rotated through 240.
The Jones matrices J21, J22, J23 are then obtained from J11, J12, J13[12] through rotation by
120.
J31 = R( π)J12R( π)
J32 = R( π)J13R( π)

25
J33 = R( π)J11R( π)
CONSTRUCTION OF S-MATRIX
As pointed out before the 3 × 3 coupler can be fully described by a 6×6 S-matrix if it is
reflection free and reciprocal. These properties are build into the model of propagating vector
eigenmodes. The S-matrix is a 3 × 3 matrix with the Jones matrices as elements
S11 12 1321 22 2331 32 33
Most approaches use the vector modes[12] for numerical calculations to determine the free
propagation constants βx
β1x, β2x and β3y not determined by symmetry considerations. However this approach requires a
detailed knowledge of the transversal geometry of the coupler which is difficult to obtain if
commercially available couplers are used. Calculation of the Jones matrices also requires
knowledge of the coupling length L which is not available to the required precision
2.2 SIMULATION WORK 1
FABRY PEROT FILTER
INTRODUCTION
A Fabry-Parot Filter consist of the cavity formed by two highly reflective mirrors placed parallel
to each other .The input light beam to the filter enters the first mirror at right angles to its
surface. The output of the filter is the light beam leaving the second mirror. This filter is called
Fabry-Parot or etalon. This is a classical device that has been used widely in interferometric
applications. Fabry-Parot filters have been used for WDM in several optical network test beds.
There are better filters today, such as thin film resonant multi cavity filter and they can still be

26
viewed as Fabry-Perot filter. This type of filter transmits a narrow band of wavelengths and
rejects wavelengths outside of that band. An interesting feature of this type of filter is its ability
to "select" a different peak wavelength as the filter is tilted
2.2.1 THEORY
The varying transmission function of an filter is[4],[58] caused by interference between the
multiple reflections of light between the two reflecting surfaces. Constructive interference occurs
if the transmitted beams are in phase, and this corresponds to a high-transmission peak of the
filter. If the transmitted beams are out-of-phase, destructive interference occurs and this
corresponds to a transmission minimum. Whether the multiply-reflected beams are in-phase or
not depends on the wavelength (λ) of the light (in vacuum), the angle the light travels through the
etalon (θ), the thickness of the etalon (l) and the refractive index of the material between the
reflecting surfaces (n).
The phase difference between each succeeding reflection is given by δ:
2nlcos
If both surfaces have a reflectance R, the transmittance function of the etalon is given by:
1 21 2
1
1 sin 2
Where 4
1 2
is the coefficient of finesse.

27
Maximum transmission (Te = 1) occurs when the optical path length difference (2nl cos θ)
between each transmitted beam is an integer multiple of the wavelength. In the absence of
absorption, the reflectance of the etalon Re is the complement of the transmittance, such that Te +
Re = 1. The maximum reflectivity is given by:
1
and this occurs when the path-length difference is equal to half an odd multiple of the
wavelength.
The wavelength separation between adjacent transmission peaks is called the free spectral range
(FSR) of the etalon, Δλ, and is given by:
∆ 2
2
Where λ0 is the central wavelength of the nearest transmission peak. The FSR is related to the
full‐width half‐maximum, δλ, of any one transmission band by a quantity known as the finesse:
Δδλ
π2arcsin 1/ F
.This is commonly approximated (for R > 0.5) by
√2
√1
Etalons with high finesse show sharper transmission peaks with lower minimum
transmission coefficients.
28
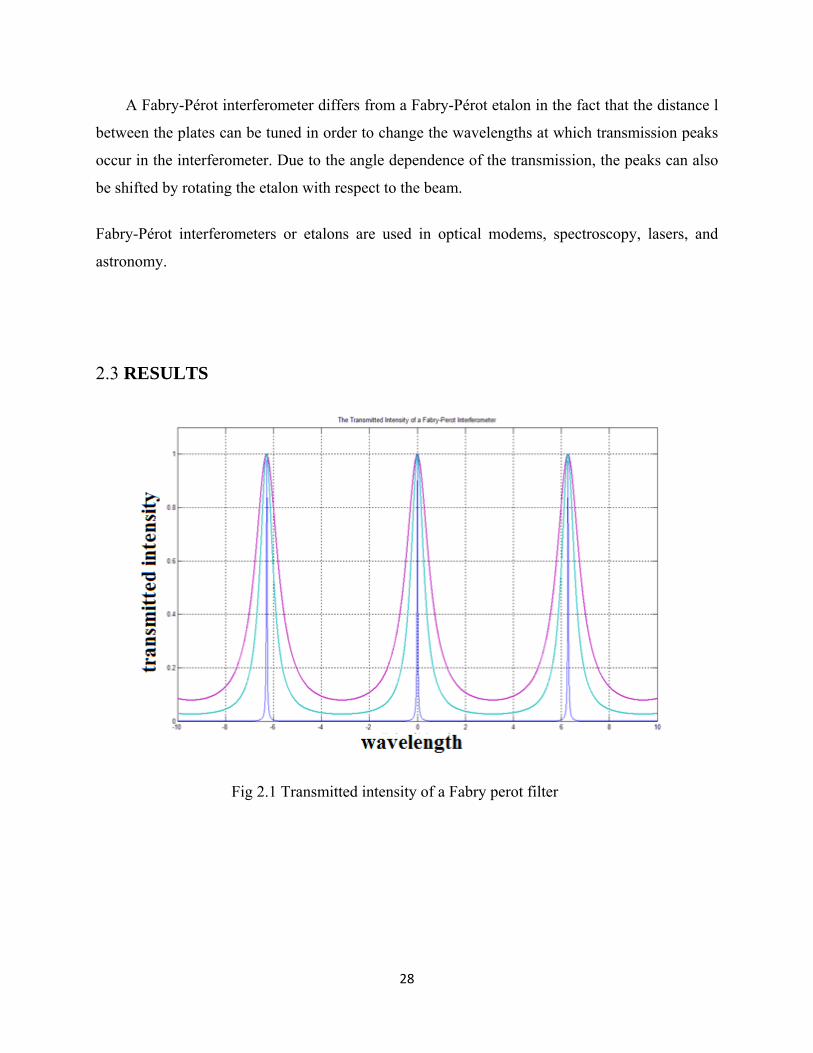
A Fabry-Pérot interferometer differs from a Fabry-Pérot etalon in the fact that the distance l
between the plates can be tuned in order to change the wavelengths at which transmission peaks
occur in the interferometer. Due to the angle dependence of the transmission, the peaks can also
be shifted by rotating the etalon with respect to the beam.
Fabry-Pérot interferometers or etalons are used in optical modems, spectroscopy, lasers, and
astronomy.
2.3 RESULTS
Fig 2.1 Transmitted intensity of a Fabry perot filter

29
Fig 2.2 Finesse factor vs the mirror reflectivity
APPLICATIONS
• The most important common applications are as dichroic filters, in which a series of
etalonic layers are deposited on an optical surface by vapor deposition. These optical
filters usually have more exact reflective and pass bands than absorptive filters. When
properly designed, they run cooler than absorptive filters because they can reflect
unwanted wavelengths. Dichroic filters are widely used in optical equipment such as light
sources, cameras and astronomical equipment.
• Telecommunications networks employing wavelength division multiplexing have add-
drop multiplexers with banks of miniature tuned fused silica or diamond etalons. These
are small iridescent cubes about 2 mm on a side, mounted in small high-precision racks.
The materials are chosen to maintain stable mirror-to-mirror distances, and to keep stable
frequencies even when the temperature varies. Diamond is preferred because it has
greater heat conduction and still has a low coefficient of expansion. In 2005, some
telecommunications equipment companies began using solid etalons that are themselves
optical fibres. This eliminates most mounting, alignment and cooling difficulties.

30
• Laser resonators are often described as Fabry-Pérot resonators, although for many types
of laser the reflectivity of one mirror is close to 100%, making it more similar to a Gires-
Tournois interferometer. Semiconductor diode lasers sometimes use a true Fabry-Pérot
geometry, due to the difficulty of coating the end facets of the chip.
• Fabry-Pérot etalons can be used to prolong the interaction length in laser absorption
spectrometry techniques.
• A Fabry-Pérot etalon can be used to make a spectrometer capable of observing the
Zeeman effect, where the spectral lines are far too close together to distinguish with a
normal spectrometer.
• In astronomy an etalon is used to select a single atomic transition for imaging. The most
common is the H-alpha line of the sun. The Ca-K line from the sun is also commonly
imaged using etalons

31
Chapter 3
RADIO OVER FIBRE SYSTEMS 3.1 Radio over fibre systems
3.1.1 RoF link configurations
3.2 Millimeter wave band characteristics
3.3 Simulation work 2
3.3.1 Theory
3.3.2 Results and discussions
3.4 Simulation work
3.4.1 ROF using TSSB SCM
3.4.2 ROF using SSB SCM
3.5 Result and discussion
3.6 Future scope of work

32
3.1 RADIO OVER FIBRE SYSTEMS
Wireless networks based on RoF technologies have been proposed as a promising cost-effective
solution to meet ever increasing user 0bandwidth and wireless demands. Since it was first
demonstrated for cordless or mobile telephone service in 1990 [5],[6],[8] a lot of research has
been carried out to investigate its limitation and develop new and high performance RoF
technologies. In this network a CS is connected to numerous functionally simple BSs via an optic
fibre. The main function of BS is to convert optical signal to wireless one and vice versa. Almost
all processing including modulation, demodulation, coding, routing is performed at the CS. That
means, RoF networks use highly linear optic fibre links to distribute RF signals between the CS
and BSs. Fig shows a general RoF architecture. At a minimum, an RoF link consists of all the
hardware required to impose an RF signal on an optical carrier, the fibre-optic link, and the
hardware required to recover the RF signal from the carrier. The optical carrier's wavelength is
usually selected to coincide with either the 1.3 um window, at which standard single-mode fibre
has minimum dispersion, or the 1.55 um window, at which its attenuation is minimum.
This topic has two parts.
first part is dedicated to a description of general optical transmission link, where digital
signal transmission is assumed as current optical networks. The second part mainly deals with
RoF technologies and is subdivided as follows: (1) RoF link characteristics, requirements, (2) RF
signal generation and transportation techniques, and link configurations (3) the state of the art on
mm-wave generation and transport technologies.

33
Fig 3.1 General Radio over Fibre system [6]
RADIO OVER FIBRE OPTICAL LINKS
INTRODUCTION
Unlike conventional optical networks where digital signal is mainly transmitted, RoF is
fundamentally an analog transmission system because it distributes the radio waveform, directly
at the radio carrier frequency, from a CS to a BS. Actually, the analog signal that is transmitted
over the optical fibre can either be RF signal, IF signal or baseband (BB) signal. For IF and BB
transmission case, additional hardware for up-converting it to RF band is required at the BS. At
the optical transmitter, the RF/IF/BB signal can be imposed on the [7] optical carrier by using
direct or external modulation of the laser light. In an ideal case, the output signal from the optical
link will be a copy of the input signal. However, there are some limitations because of non-
linearity and frequency response limits in the laser and modulation device as well as dispersion
in the fibre. The transmission of analog signals puts certain requirements on the linearity and
dynamic range of the optical link. These demands are different and more exact than requirements
on digital transmission systems

34
3.1.1 ROF LINK CONFIGURATIONS
A typical RoF link configuration is classified based on the kinds of frequency bands (baseband
(BB), IF, RF bands) transmitted over an optical fibre link. Here, we assume that a BS has its own
light source for explanation purpose, however, BS can be configured without light source for
uplink transmission. In each configuration, BSs do not have any equipment for modulation and
demodulation, only the CS has such equipment. In the downlink from the CS to the BSs, the
information signal from a public switched telephone network (PSTN), the Internet, or other CS is
fed into the modem in the CS. The signal that is either RF, IF or BB bands modulates optical
signal from LD. if the RF band is low, we can modulate the LD signal by the signal of the RF
band directly. If the RF band is high, such as the mm-wave band, we sometimes need to use
external optical modulators (EOMs), like electroabsorption ones. The modulated optical signal is
transmitted to the BSs via optical fibre. At the BSs, the RF/IF/BB band signal is recovered to
detect the modulated optical signal by using a PD. The recovered signal, which needs to be
upconverted to RF band if IF or BB signal is transmitted, is transmitted to the MHs via the
antennas of the BSs. In the configuration, the modulated signal is generated at the CS in an RF
band and directly transmitted to the BSs by an EOM, which is called .RF-over-Fibre.. At each
BS, the modulated signal is recovered by detecting the modulated optical signal with a PD and
directly transmitted to the MHs. Signal distribution as RF-over-Fibre has the advantage of a
simplified BS design but is susceptible to fibre chromatic dispersion that severely limits the
transmission distance. In the configuration, the modulated signal is generated at the CS in an IF
band and transmitted to the BSs by an EOM, which is called .IF-over-Fibre. At each BS, the
modulated signal is recovered by detecting the modulated optical signal with a PD, upconverted
to an RF band, and transmitted to the MHs. In this scheme, the effect of fibre chromatic
dispersion on the distribution of IF signals is much reduced, although antenna BSs implemented
for RoF system incorporating IF-over- Fibre transport require additional electronic hardware
such as a mm-wave frequency LO for frequency up- and downconversion. In the configuration
(c) of the figure, the modulated signal is generated at the CS in baseband and transmitted to the
BSs by an EOM, which is referred to as .`BB-over-Fibre.. At each BS, the modulated signal is
recovered by detecting the modulated optical signal with a PD, upconverted to an RF band
through an IF band or directly, and transmitted to the MHs. In the baseband transmission,

35
influence of the fibre dispersion effect is negligible, but the BS configuration is the most
complex. Since, without a subcarrier frequency, it has no choice but to adopt time-division or
code division multiplexing. In the configuration (d), the modulated signal is generated at the CS
in a baseband or an IF band and transmitted to the BSs by modulating a LD directly. At each BS,
the modulated signal is recovered by detecting the modulated optical signal with a PD,
unconverted to an RF band, and transmitted to the MHs. This is feasible for relatively low
frequencies, say, less than 10 GHz. By reducing the frequency band used to generate the
modulated signal at the CS such as IF over- Fibre or BB-over-Fibre, the bandwidth required for
optical modulation can greatly be reduced. This is especially important when RoF at mm-wave
bands is combined with dense wavelength division multiplexing (DWDM). However, this
increases the amount of equipment at the BSs because an up converter for the downlink and a
down converter for the uplink are required. In the RF subcarrier transmission, the BS
configuration can be simplified only if a mm-wave optical[6],[8] external modulator and a high-
frequency PD are respectively applied to the electric-to-optic (E/O) and the optic-to-electric
(O/E) converters. For the uplink from an MH to the CS, the reverse process is performed. In the
configuration shown in (a), the signals received at a BS are amplified and directly transmitted to
the CS by modulating an optical signal from a LD by using an EOM. In the configuration (b) and
(c), the signals received at a BS are amplified and downconverted to an IF or a baseband
frequency and transmitted to the CS by modulating an optical signal from a LD by using an
EOM. In the configuration (d), the signals received at a BS are amplified and downconverted to
an IF or a baseband frequency and transmitted to the CS by directly modulating an optical signal
from a LD.

36

37
Fig 3.2
a. RF modulated signal
b. IF modulated signal
c. BB modulated signal
d. Direct modulation[6]
3.2 MILLIMETER WAVE BAND CHARACTERISTICS
Due to spectrum congestion in microwave bands and, the interest of researchers and
standardization bodies has indicated the mm-wave band[4] as a candidate for some of
the most challenging services to be provided in the future . However, the use of the mm-wave
band introduces some features that have to be taken into account in system design; these features
are mainly related to the short wavelength and to the additional attenuation due to rain and
oxygen absorption, when present.
WHY MILLIMETER WAVES?
The main advantages on the usage of mm-waves can be summarized as follows:
1. The high power level attenuation, due to the large value of frequency, in conjunction with
oxygen and rain absorption, which leads to a high spatial filtering effect with the consequent
frequent channel reuse;
2. The small size of antennas and RF circuits;

38
3. The large spectrum availability.
On the other hand, large values of signal attenuation become a fundamental drawback when
long-distance communication links are to be managed. Hence, significant applications of the
mm-wave can be found in the field of short-range communication systems, i.e., when link
distances range from a few meters up to one kilometer Another useful consequence of the mm-
wave band utilization, related to the large values of attenuation, is the low number of interfering
signal sources that are usually present in the system. Both in indoor environments, due to walls,
and in outdoor scenarios, due to high frequency, a number of interferers ranging from zero to two
or three may be present. This represents a signi_cant advantage in terms of capture probability
when packet communications and narrow-band signaling are considered.
MILLIMETER WAVE GENERATION TECHNIQUES
Recently, a lot of research has been carried out to develop mm-wave[4] generation and transport
techniques, which include the optical generation of low phase noise wireless signals and their
transport overcoming the chromatic dispersion in fiber. Several state-of-the-art techniques that
have been investigated so far are described in this section, which are classified into the following
four categories :
1. optical heterodyning
2. external modulation
3. up- and down-conversion
4. optical transceiver
ROF AND WAVELENGTH DIVISION MULTIPLEXING
The application of WDM in RoF networks has many advantages including simpli_cation of the
network topology by allocating different wavelengths to individual BSs, enabling easier network
and service upgrades and providing simpler network management. Thus, WDM in combination
with optical mm wave transport has been widely studied. A schematic arrangement is illustrated
39
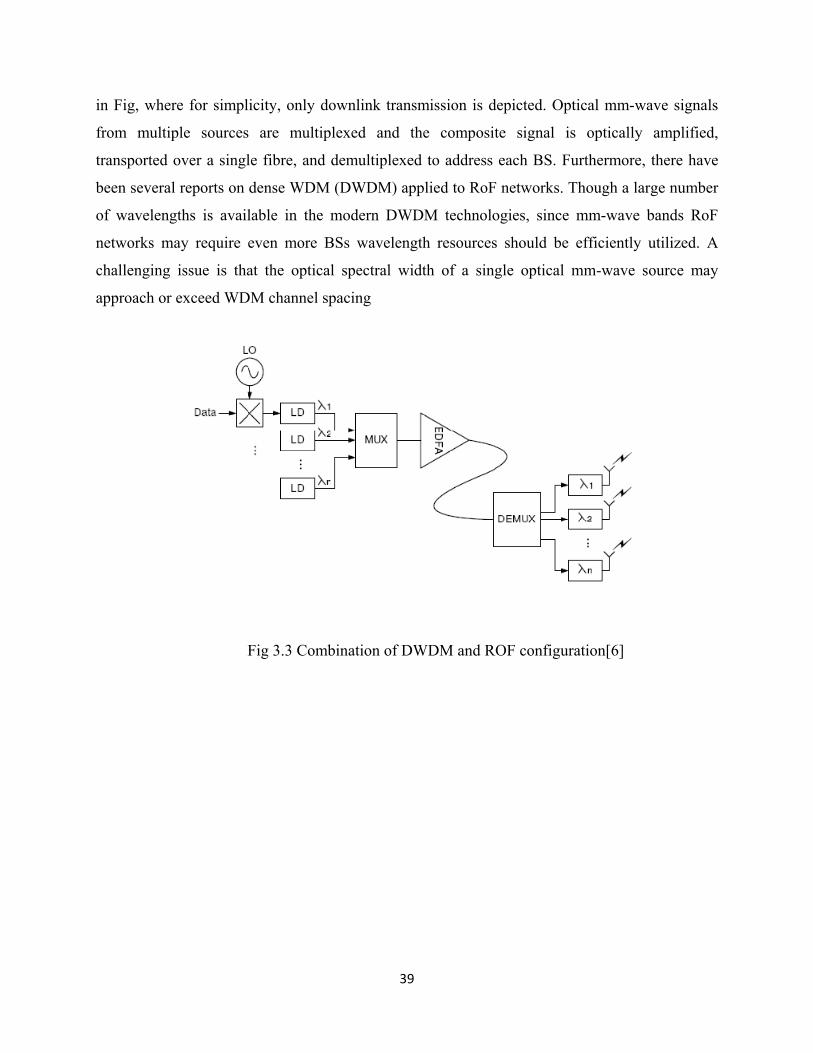
in Fig, where for simplicity, only downlink transmission is depicted. Optical mm-wave signals
from multiple sources are multiplexed and the composite signal is optically amplified,
transported over a single fibre, and demultiplexed to address each BS. Furthermore, there have
been several reports on dense WDM (DWDM) applied to RoF networks. Though a large number
of wavelengths is available in the modern DWDM technologies, since mm-wave bands RoF
networks may require even more BSs wavelength resources should be efficiently utilized. A
challenging issue is that the optical spectral width of a single optical mm-wave source may
approach or exceed WDM channel spacing
Fig 3.3 Combination of DWDM and ROF configuration[6]

40
3.3 SIMULATION WORK 2
POWER SPECTRUM MEASUREMENTS OF A MILLIMETER WAVE RADIO OVER
FIBRE SYSTEM
INTRODUCTION
For a high speed wireless local or personal area network millimeter[37][39] wave
communication systems can be used. In this simulation work the power spectrum measurements
of a 1.25 gbps radio overfibre system at 60ghz. Millimeter wave at 58.1 ghz is modulated using
binary phase shift keying(BPSK) The power spectrum of ROF link output is examined as a
function of fibre length. Again, the use of optical filter to remove fading effect in the power
spectrum is conducted and the effect of modulating frequency on power spectrum is discussed.
Fig 3.4 Setup for power spectrum measurements[37]
3.3.1 THEORY When we use an optical filter at 58.1GHz. The power level experiences a dip in some regions of
length that display bit errors in the BER measurements. The introduction of the optical filter
improves the SNR in the regions of fibre lengths with bit error problems. However, the loss
introduced by the optical filter is around 12dB. if transmission is done at two millimeter wave
frequencies without filter inserted. When the transmitted frequency is higher, the power is

41
smaller for the same fibre length. Low power level leads to high bit error rate. By comparing
BER with results here, the minimum power level before error occurs is -75.6dBm without any
adjustment for gain provided by amplifiers. Different frequency components in light spectra
travel with different speed in optical fibre. The photodetector[37] carries out direct demodulation
of optical signals. Destructive interference results when the upper sideband and lower sideband is
π radians out of phase. The normalized power after transmission in the dispersive fibre is given
by
where aL, aH, i, c, L, and f are the fibre propagation loss, chirp parameter of EA modulator,
wavelength of the optical carrier, speed of light in vacuum, fibre length and frequency of
modulating signal respectively. Fading occurs when the argument of cosine in Equation is odd
multiples of π2. The lengths of fibre where fading will occur are given by
where k= 1, 2, 3, .... For a 60GHz modulating frequency, the length at which fading occurs are
612m, 2.758km and 4.903km for k = 1, 2 and 3 respectively. The regions around these lengths
coincide with the regions with the BER measurements.

42
3.3.2 RESULTS AND DISCUSSION
Fig 3.5 Power spectrum from photo detector at 58.1 ghz
Figure 3.5 compares the effect of the use of an optical filter at 58.1GHz. The power level
experiences a dip in the same regions of length that display bit errors in the previous section
for the BER measurements. The introduction of the optical filter improves the SNR in the
regions of fibre lengths with bit error problems. However, the loss introduced by the optical
filter is around 12dB.
43
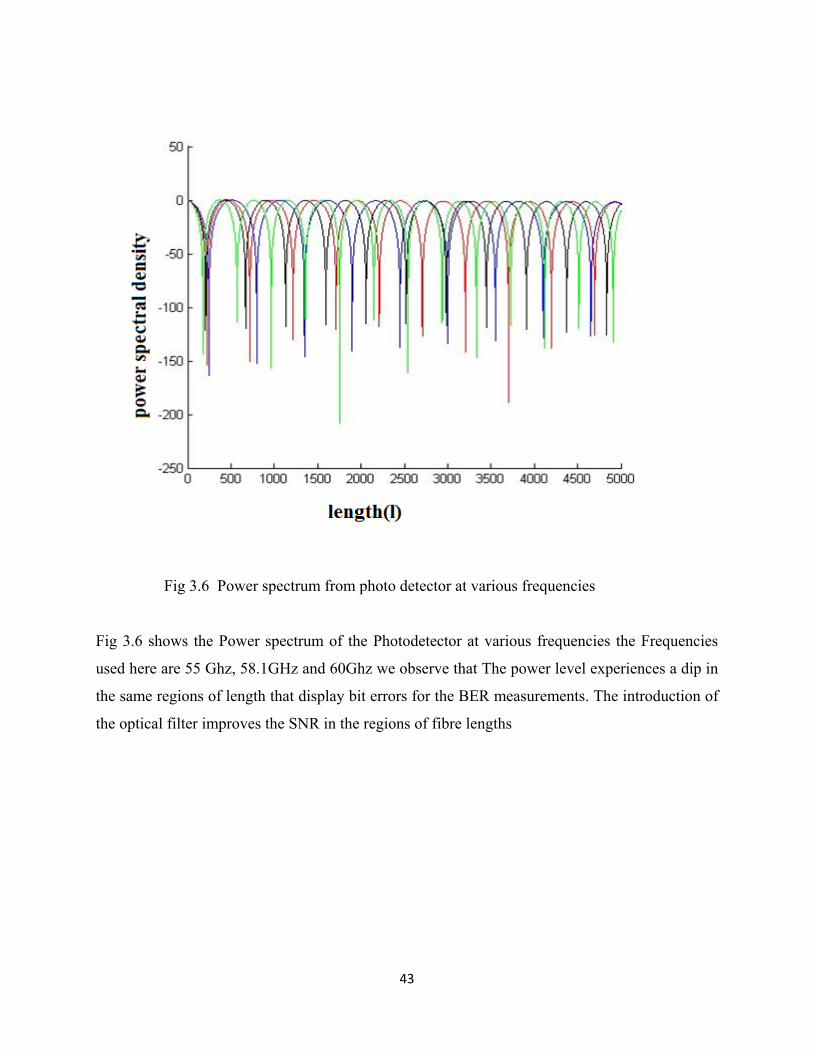
Fig 3.6 Power spectrum from photo detector at various frequencies
Fig 3.6 shows the Power spectrum of the Photodetector at various frequencies the Frequencies
used here are 55 Ghz, 58.1GHz and 60Ghz we observe that The power level experiences a dip in
the same regions of length that display bit errors for the BER measurements. The introduction of
the optical filter improves the SNR in the regions of fibre lengths

44
Fig 3.7 Power spectrum with noise in the channel
Fig 3.7 shows the Power spectrum of the Photodetctor when the channel noise(Guassian) is there
in the channel It distorts the power Spectrum and a filter has to be used to remove the noise the
filter used is DIcone tunable band pass filter.
3.4 SIMULATION WORK 3
IMPACT OF NON LINEAR DISTORTION IN RADIO OVER FIBRE SYSTEMS WITH
SINGLE SIDE BAND AND TANDEM SINGLE SIDE BAND SUBCARRIER
MODULATIONS
INTRODUCTION
Microwave and millimeter-wave band radio over fibre (RoF) system scan[43],[47] be applied
combined with dense wavelength-division multiplexing (DWDM) for the future wireless acess
networks. To improve optical spectral efficiency in transmission and reduce chromatic dispersion
impact
45
on transmission, two subcarrier modulations (SCMs), i.e., single-sideband modulation (SSB) and
tandem single-sideband (TSSB) modulations, were proposed and demonstrated. The two SCMs
both can be realized by using optical Mach–Zehnder modulators (MZMs), which have a cosine
transfer function theoretically in the electric field domain. In other words, MZMs have the
nonlinear transfer function, leading to nonlinear distortion consisting of harmonic distortion
(HD) and intermodulation distortion (IMD) when radio frequency (RF) signals electrically drive
an MZM. The IMDs can be further increased when multiple RF signals or frequencydivision-
Multiplexed (FDM) signals drive an MZM simultaneously (i.e., one wavelength carries multiple
RF signals). Such nonlinear distortions will considerably reduce receiver sensitivity and dynamic
range, and thus, RoF system performance. For the SSB SCM, multiple RF or FDM signal
tones carried by one wavelength or optical carrier are located in either lower sideband (LSB) or
upper sideband (USB) of the optical carrier, whereas for the TSSB SCM, one half of multiple RF
signals or FDM signal tones are located in LSB and the others in USB of the optical carrier.
Therefore, the optical spectral efficiency with both SCMs can be the same in DWDM RoF
systems. Intuitively, it should be expected that the two SCMs should result in similar nonlinear
distortion for a similar RoF system setup. However, we will see that nonlinear distortions in RoF
systems using the SSB and TSSB SCMs may be different, strongly depending on optical
modulation index and frequency difference of two RF signals as well as transmission fibre. To
achieve high-capacity wireless access networks, very dense WDM systems have to be used,
which can be combined with microcell and picocell wireless networks. In addition, the impact of
nonlinear distortion was investigated only for DWDM RoF systems using SSB SCM with a
small modulation index. However, a large modulation index is usually preferred in RoF systems,
but serious nonlinear distortion may be induced. Here we theoretically investigate nonlinear
distortion impact in RoF systems using both SSB and TSSB SCMs combined with simulation.
46
3.4.1 ROF SYSTEMS USING TSSB SCM
THEORY
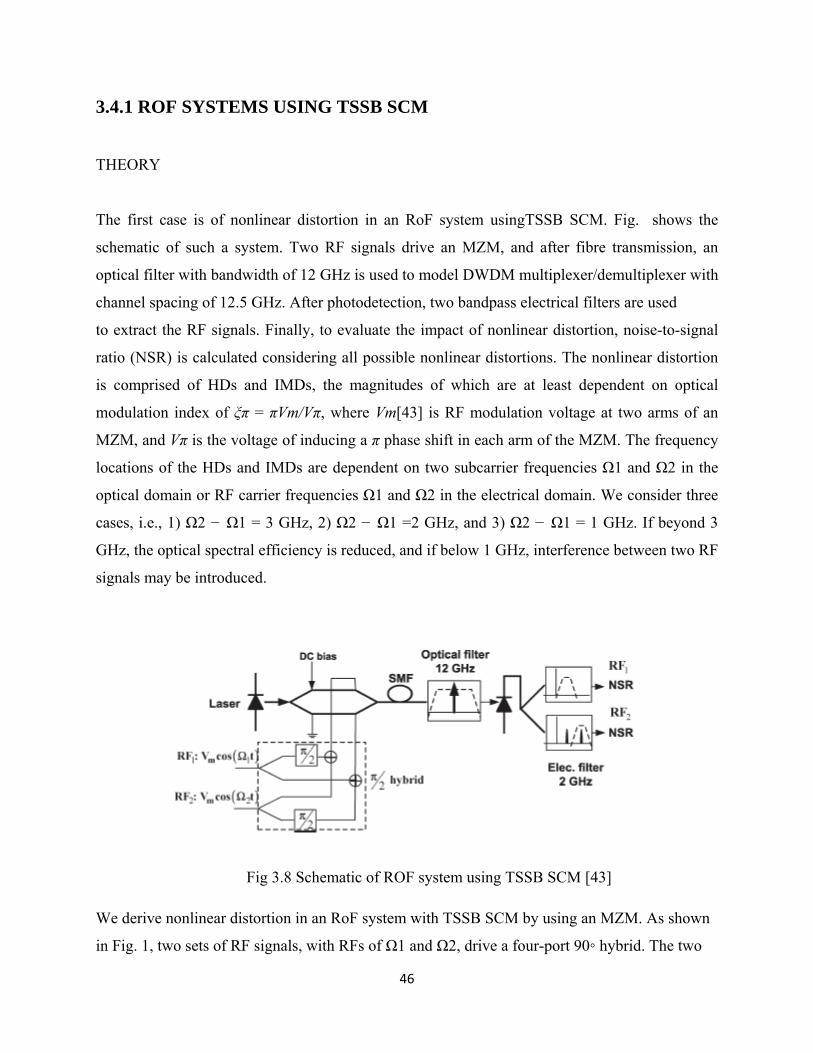
The first case is of nonlinear distortion in an RoF system usingTSSB SCM. Fig. shows the
schematic of such a system. Two RF signals drive an MZM, and after fibre transmission, an
optical filter with bandwidth of 12 GHz is used to model DWDM multiplexer/demultiplexer with
channel spacing of 12.5 GHz. After photodetection, two bandpass electrical filters are used
to extract the RF signals. Finally, to evaluate the impact of nonlinear distortion, noise-to-signal
ratio (NSR) is calculated considering all possible nonlinear distortions. The nonlinear distortion
is comprised of HDs and IMDs, the magnitudes of which are at least dependent on optical
modulation index of ξπ = πVm/Vπ, where Vm[43] is RF modulation voltage at two arms of an
MZM, and Vπ is the voltage of inducing a π phase shift in each arm of the MZM. The frequency
locations of the HDs and IMDs are dependent on two subcarrier frequencies Ω1 and Ω2 in the
optical domain or RF carrier frequencies Ω1 and Ω2 in the electrical domain. We consider three
cases, i.e., 1) Ω2 − Ω1 = 3 GHz, 2) Ω2 − Ω1 =2 GHz, and 3) Ω2 − Ω1 = 1 GHz. If beyond 3
GHz, the optical spectral efficiency is reduced, and if below 1 GHz, interference between two RF
signals may be introduced.
Fig 3.8 Schematic of ROF system using TSSB SCM [43]
We derive nonlinear distortion in an RoF system with TSSB SCM by using an MZM. As shown
in Fig. 1, two sets of RF signals, with RFs of Ω1 and Ω2, drive a four-port 90 hybrid. The two

47
hybrid outputs drive a dual-arm MZM [10], biased at quadrature. When a continuous-wave (CW)
electric field of E0ejωt, ω-optical carrier frequency is injected into the MZM, the output electric
field after transmission over fibre with a length of L is given by
Eout = √
√2 0 0 .25
-2(j0)(j1)cos(wt+Ω1(t)-(b1(Ω1)l)-(.5b2(Ω1)(Ω1)l))
-2(j0)(j1)2sin(wt-(Ω2)t+(b1(Ω2)l)-(.5b2(Ω2)2l))
+ √2(j1)3sin(wt+(Ω2-Ω1)t-(.25π)-(b1(Ω2-Ω1)l)-(.5b2(Ω2-Ω1)(Ω2-Ω1)l))
- √2(j1)2sin(wt-(Ω2-Ω1)t-(.25π)+(b1(Ω2-Ω1)l)-(.5b2(Ω2-Ω1)(Ω2-Ω1)l))
+ √2(j1)2sin(wt+(Ω2+Ω1)t+(.25π)-(b1(Ω2+Ω1)l)-(.5b2(Ω2-Ω1)(Ω2-Ω1)l))
+ 2(j1)(j2)cos(wt-(2Ω2-Ω1)t+(b1(2Ω2-Ω1)l)-(.5b2(2Ω2-Ω1)(2Ω2-Ω1)l))
- 2(j1)(j2)sin(wt-(2Ω1-Ω2)t+(b1(2Ω1-Ω2)l)-(.5b2(2Ω1-Ω2)(2Ω1-Ω2)l))
+ √2(j0)(f)(j2)(f)cos(wt+(2Ω1t)-(.25π)-(2b1(Ω1)l)-(2b2(Ω1)2l))
+ √2(j0)(j2)cos(wt-(2Ω1t)-(.25π)+(2b1(Ω1)l)-(2b2(Ω1)2l))
- (2(j2)4 cos(wt+(2Ω2-Ω1)t+(.25π)-2b1(Ω2-Ω1)l-(2b2(Ω2-Ω1)(Ω2- Ω1)l))
- 2(j2)2cos(wt-(2Ω2-Ω1)t+(.25π)+2b1(Ω2-Ω1)l-(2b2(Ω2-Ω1)(Ω2-Ω1)l))
+2(j1)(j3)sin(wt-(3Ω1-Ω2)t-(.25π)-(2b1(3Ω1-Ω2)l)-(.5(b2(3Ω1-Ω2)(3Ω1-Ω2)l))) …… (1)
where Jk() is the Bessel function of first kind, k = 0, 1, 2, 3, . . ., ξπ = πVm/Vπ is the
optical modulation index or depth, Vm is the RF modulation voltage at two arms, and Vπ is the
voltage of inducing a π phase shift in each arm of the MZM.
Where b1 and b2 denote the first and second derivatives of the propagation constant with respect
to the optical carrier frequency.
There are a number of HDs and IMDs in the electrical domain, which may interfere with the
two RF signals. One method for estimating nonlinear distortion impact is to use the ratio of each
HD or each IMD to RF signal in power . Thus, there are several ratios for different HDs and
IMDs, and it is impossible to have an entire picture of nonlinear distortion impact on RoF

48
systems. Here, we use NSR, considering all possible HDs and IMDs to estimate the impact of
nonlinear distortion. NSR is given in Table I for different RF frequencies of Ω1 and Ω2.
Ω1
Ghz
Ω2
Ghz
Non linear distortion
frequencies for Ω1
Non linear distortion
frequencies for Ω2
RF Ω1
NSR
RF Ω2
NSR
1 4 2 Ω1,( Ω2-2 Ω1) 3 Ω1,( Ω2- Ω1),( Ω2-Ω1) NSR(1a) NSR(2a)
2 5 ( Ω2- Ω1), ( Ω2-2Ω1) 3 Ω1, 2 Ω1, 2( Ω2- Ω1) NSR(1b) NSR(2b)
3-5 6-8 ( Ω2- Ω1) 3 Ω1, 2( Ω2- Ω1) NSR(1c) NSR(2c)
6-7 9-10 2 ( Ω2- Ω1) ( 3Ω1- Ω2) NSR(1d) NSR(2d)
Table 1 NSR for optical carrier having TSSB SCM with (Ω2 − Ω1) = 3[43]
Where
NSR(1a)=
10log[(2(j0)2(j2)2sin2(2b2(Ω1)(Ω1)l)+((j1)(j1)(j2)(j2))/((j0)2((j1)2))]
NSR(2a)=10log[(2(j1)2sin2(.5b2(Ω2)(Ω1)(Ω2)(Ω1)l+(2((j1)4)sin2(.5b2(Ω2+Ω1)(Ω2+Ω1)l)+((j0)2
((j3)2/((j0)2(j1)2)]
NSR(1b)= 10log[(2(j1)2sin2(.5(b2)(Ω2-Ω1)(Ω2-Ω1)l)+(j2)2/((j0)2)]
NSR(2b)=10log[((j0)2(j2)2sin2(2(Ω1)2l)+2(j2)4 +(j0)2(j3)2)/((j0)2((j1)2))]
NSR(1c)=
10log[(2(j0)4(j1)2sin2(.5(b2)(Ω2-Ω1)(Ω2- Ω1)l)+4(j1)2(j2)4)/((j0)6]
NSR(2c)= 10log[((j0)2(j2)2sin2(2(Ω1)2l)+2(j2)4)/((j0)2(j1)2)]
NSR(1d)=10log[((j2)4(j0)2sin2(2b2(Ω2-Ω1)(Ω2-Ω1)l) +2(j1)2(j2)2(j3)2)/((j0)4(j1)2)]

49
NSR(2d)= 10log[(2(j3)2sin2(.5b2(3Ω1-Ω2)(3Ω1-Ω2)l))/((j0)2(j0))]
For the case of Ω2 − Ω1 = 1 GHz, the two RF signals may interfere with each other, but these
were not considered. Suppose that any HDs and IMDs that are located in between the two RF
signals in frequency are considered to be nonlinear distortion for both RF signals. Practically,
electrical bandpass filters with a bandwidth of less than 2 GHz to extract the two RF signals
should be used to reduce two RF signal mutual interference. This implies that our NSR may
overestimate nonlinear distortion-induced interference. The frequency locations of some HDs
and IMDs for the different combinations of Ω1 and Ω2 ., it is obviously seen that some
nonlinear distortions in frequency are shifted closer to or farther than the RF signals at Ω1 and
Ω2. These frequency shifts will alter NSR. Correspondingly, NSRs of RF signals at Ω1 and Ω2
are given in Table 2
Ω1
Ghz
Ω2
Ghz
Non linear distortion
frequencies for Ω1
Non linear distortion
frequencies for Ω2
RF Ω1
NSR
RF Ω2
NSR
1 2 2 Ω1,( Ω2- Ω1) 2 Ω1,3 Ω1,( Ω2+Ω1),
( 2Ω2-Ω1)
NSR(3a) NSR(4a)
2 3 ( Ω2- Ω1), ( Ω2-2Ω1) 2 Ω1, (2 Ω2- Ω1) NSR(3b) NSR(4b)
3-9 4-10 ( Ω2- 2Ω1) ( 2Ω2- Ω1) NSR(3c) NSR(4c)
Table 2 NSR for one optical carrier having TSSB SCM with (Ω2 − Ω1) = 1[43]
Where
NSR(3a)=10log[(2(j1)4sin2(.5(b2)(Ω2-Ω1)2l)+ (j0)2(j2)2)/((j0)2(j1)2)]
NSR(3b)=10log[(2(j1)2(j1)3sin2(.5b2(Ω2-Ω1)2)l)+(j1)2(j2)2)/((j0)2(j1)2)]
NSR(4a)=10log[(2(j1)4cos2(.5(b2)(Ω2+Ω1)2l)+(j0)2(j2)2+(j0)2(j3)2*)/((j0)2(j1)2)]
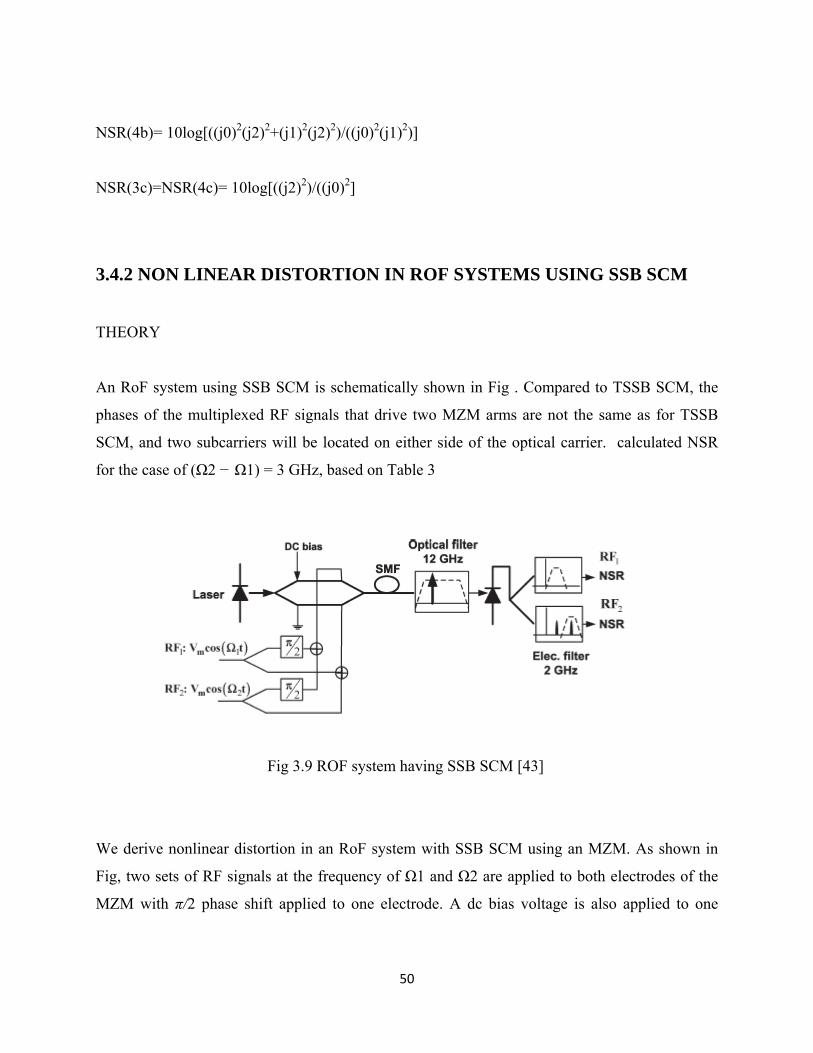
50
NSR(4b)= 10log[((j0)2(j2)2+(j1)2(j2)2)/((j0)2(j1)2)]
NSR(3c)=NSR(4c)= 10log[((j2)2)/((j0)2]
3.4.2 NON LINEAR DISTORTION IN ROF SYSTEMS USING SSB SCM
THEORY
An RoF system using SSB SCM is schematically shown in Fig . Compared to TSSB SCM, the
phases of the multiplexed RF signals that drive two MZM arms are not the same as for TSSB
SCM, and two subcarriers will be located on either side of the optical carrier. calculated NSR
for the case of (Ω2 − Ω1) = 3 GHz, based on Table 3
Fig 3.9 ROF system having SSB SCM [43]
We derive nonlinear distortion in an RoF system with SSB SCM using an MZM. As shown in
Fig, two sets of RF signals at the frequency of Ω1 and Ω2 are applied to both electrodes of the
MZM with π/2 phase shift applied to one electrode. A dc bias voltage is also applied to one

51
electrode, while the other is grounded, biased at quadrature .When a electric field of E0ejωt,
ω-optical carrier frequency is injected into the MZM
If we only consider the IMDs and HDs that may be dominant in introducing nonlinear distortion,
after transmission over fibre with a length L , we get an equation as
Eout= 0/2 √2 0 2 .25
-2j0j1cos(w(i)t+Ω1(t)-b1(Ω1)l-.5b2(Ω1)(Ω1)l)
-2j0(j1)2cos(w(i)t+Ω2(t)-b1(Ω2)l-.5b2(Ω2)2l)
+√2(j1)4cos(w(i)t+(Ω2-Ω1)t-.25π-b1(Ω2-Ω1)l-.5b2
(Ω2- Ω1)(Ω2-Ω1)l)
+√2j1j1cos(w(i)t+(Ω2-Ω1)t-.25π-b1(Ω2-Ω1)l-.5b2(Ω2-Ω1)
(Ω2-Ω1)l)
+√2(j1)2cos(w(i)t-(Ω2-Ω1)t-.25π+b1(Ω2-Ω1)l-.5b2(Ω2-Ω1)
(Ω2-Ω1)l)
-√2(j1)2cos(w(i)t+(Ω2+Ω1)t+.25π-b1(Ω2+Ω1)l
-.5b2(Ω2+Ω1)(Ω2+Ω1)l)
-√2j1j1cos(w(i)t-(Ω2+Ω1)t+.25π+b1(Ω2+Ω1)l
-.5b2(Ω2+Ω1)(Ω2+Ω1)l)
+√2j1j2cos(w(i)t+2Ω1t-.25π-2π9Ω1)l-2b2(Ω1)(Ω1)l)
+√2j1j2cos(w(i)t-2(Ω1)t-.25π+2π(Ω1)l-2b2(Ω1)2l)
+ √2j1j2cos(w(i)t+2(Ω2)t-.25π-2π(Ω2)l-2b2(Ω2)2l)
+√2j1j2cos(w(i)t-2(Ω2)t-.25π+2π(Ω2)l-2b2(Ω2)2l)
+2j1j2cos(w(i)t-(2Ω2+Ω1)t+b1(2Ω2-Ω1)
l-.5b2(2Ω2+Ω1)(2Ω2+Ω1)l)
+2j1j2cos(w(i)t+(2Ω2-Ω1)t-b1(2Ω2-Ω1)l-.5b2(2Ω2-Ω1)
(2Ω2-Ω1)l)+2j1j2cos(w(i)t+(2Ω2+Ω1)t-b1(2Ω2+Ω1)

52
l-.5b2(2Ω2+Ω1)(2Ω2+Ω1)l)
+2j1j2cos(w(i)t+(2Ω2-Ω1)t-b1(2Ω2-Ω1)l-.5b2(2Ω2-Ω1)
(2Ω2-Ω1)l)
+2(j2)2cos(w(i)t+2(Ω2-Ω1)t+.25π-2b1(Ω2-Ω1)l-2b2(Ω2-Ω1)
(Ω2-Ω1)l)
+2(j2)2cos(w(i)t-2(Ω2-Ω1)t+.25π-2b1(Ω2-Ω1)l-2b2(Ω2-Ω1)
(Ω2-Ω1)l)
-2j1j3cos(w(i)t+(3Ω1-Ω2)t-.25π-2b1(3Ω1-Ω2)l-.5b2
(3Ω1-Ω2)(3Ω1-Ω2)l)
-2j1j3cos(w(i)t-(3Ω1-Ω2)t-.25π+2b1(3Ω1-Ω2)l-.5b2
(3Ω1-Ω2)(3Ω1-Ω2)l) …..(2) the first term denotes the optical carrier, the second and third terms are two USB
subcarriers, and all others are either IMDs or HDs. The IMDs occur at ±(Ω2 − Ω1), (2Ω2 − Ω1),
(2Ω1 − Ω2), ±(Ω1 +Ω2), −(2Ω2 +Ω1), −(2Ω1 +Ω2), ±2(Ω2 − Ω1), ±(3Ω1 − Ω2), etc.; the HDs
occur at ±2Ω1, ±2Ω2, −3Ω1, −3Ω2, etc For example, suppose that Ω1 = 4 and Ω2 = 7 GHz;
thus, we have ±(Ω1 − Ω2) = 3, ±2(Ω2− Ω1) = ±6, ±(Ω1 +Ω2) = ±11, 2Ω2 − Ω1 = 10, 2Ω1 −
Ω2 = 1, ±2Ω1 = ±8 GHz, and so on. For Ω2 = 2Ω1, and thus Ω2 − Ω1 = Ω1, the two IMDs at
±(Ω2 − Ω1) = ±Ω1 are overlapped with the optical signal subcarrier at Ω1, and the HD at 2Ω1 is
overlapped with optical signal subcarrier at Ω2 (the HD at −2Ω1 can be removed by optical
filtering).
Suppose that some HDs and IMDs can be removed by optical filtering, which is assumed the
same as for TSSB SCM. However, optical signal subcarriers are located in one side of the optical
carrier; thus, the optical carrier for SSB SCM may not be aligned with the central wavelength of
DWDM multiplexer filters. Practically, such filtering may reduce optical carrier power and thus
improve the optical modulation index. However, we do not consider this filtering impact in our
analysis of NSR. After photodetection, the current by use of above equation can be written as

53
I= Rn(E0 )2/2
* (j0)4+ 2√2(j0)3 (j1)cos(Ω1(t)-b1(Ω1)l-.5(b2)(Ω1)2l-.25π)
-2√2 (j0)3 (j1)cos(Ω2(t)-b1(Ω2)l-.5(b2)(Ω2)2l-.25π)
+4(j0)2 (j1)2cos(.25π-.5(b2)(Ω1Ω1+Ω1Ω2)l)cos((Ω2-Ω1)t-b1(Ω2-Ω1)l-
.5 b2((Ω2)2 - Ω1Ω2)l-.25π)
-4(j0)2(j1)2cos((Ω2+Ω1)t-b1(Ω2+Ω1)l)
+4(j0)3( j2)cos(2Ω1(t)-2b1(Ω1)l-2b2(Ω1)2l-.5π)
+2√2(j0)2j1j2cos((2Ω2-Ω1)t-b1(2Ω2-Ω1)l+.5b2(2Ω2-Ω1)(2Ω2
- Ω1)l+.25*π)
+2√2(j0)2j1j2cos((2Ω1-Ω2)t-b1(2Ω1-Ω2)l+.5b2(2Ω1-Ω2)
(2Ω1-Ω2)l+.25π)
+2√2(j0)2j1j2cos((2Ω1+Ω2)t-b1(2Ω1-Ω2)l-.5b2(2Ω1-Ω2)
(2Ω1-Ω2)l-.25π)
+4(j0)2(j2)2cos(2(Ω2-Ω1)t-2b1(Ω2-Ω1)l-2b2(Ω2-Ω1)(Ω2-Ω1)l)
-4(j0)2j1j3cos((3Ω1-Ω2)t-2b1(3Ω1-Ω2)l-.5b2(3Ω1-Ω2)
(3Ω1-Ω2)l-.25π) ….(3)
Similar to TSSB SCM, we consider three cases. NSR expressions for different combinations of
Ω1 and Ω2 are listed in Table 3
Ω1
Ghz
Ω2
Ghz
Non linear distortion
frequencies for Ω1
Non linear distortion
frequencies for Ω2
RF Ω1
NSR
RF Ω2
NSR
1 4 2 Ω1,( Ω2-2 Ω1) ( Ω2- Ω1),(Ω2+Ω1) NSR(5a) NSR(6a)
2 5 ( Ω2- Ω1), ( Ω2-2Ω1) 2 Ω1, 2( Ω2- Ω1) NSR(5b) NSR(6b)
3-5 6-8 ( Ω2- Ω1) 2 Ω1, 2( Ω2- Ω1) NSR(5c) NSR(6c)
6-7 9-10 2 ( Ω2- Ω1) ( 3Ω1- Ω2) NSR(5d) NSR(6d)
Table 3 NSR for one optical carrier having two SSB subcarriers[43]

54
Where
NSR(5a)= 10log[(2(j0)2(j2)2+(j1)2(j2)2)/((j0)2(j1)2)]
NSR(6a)= 10log[(2(j1)2)/((j0)2)]
NSR(5b)= 10log[(2(j1)2cos2(.25π-.5(b2)(Ω1)2+(Ω1)Ω2)l)+(j2)2)/((j0)2)]
NSR(6b)=NSR(6c)=10log[(2(j0)2(j2)2+2(j2)4)/((j0)2(j1)2)]
NSR(5c)= 10log[(2(j1)2cos2(.25π-.5(b2)((Ω1)2+(Ω1)(Ω2)l))/((j0)2)]
NSR(5d)= 10log[(2(j2)4)/((j0)2(j1)2)]
NSR(6d)= 10log[(2(j3)2)/((j0)2)]
3.5 SIMULATION RESULTS AND DISCUSSION
We have analyzed the impact of nonlinear distortion in RoF systems with TSSB and SSB SCMs,
considering one wavelength carrying two RF signals. It was found that nonlinear distortion
strongly depends on optical modulation index and frequency difference of the two RF signals.
For a small modulation index that was widely used, TSSB and SSB SCMs induce similar and
very small nonlinear distortion, and the two RF signals are not seriously distorted by nonlinear
distortion. Generally speaking, NSR of below −25 dB when the frequency difference of two RF
signals is 2 GHz and beyond, and −30 dB when frequency difference of two RF signals is
around 1 GHz, can be obtained. However, when a medium or large modulation index is used,
TSSB and SSB SCMs will induce different nonlinear distortions,[43].[47] and nonlinear
distortion may be very serious. For this case, it was found that for both TSSB and SSB SCMs,
NSR of below −20db can be obtained for two RF signals when a minimum RF of 3 GHz and
1-GHz frequency difference of two RF signals are used, except for the maximum modulation
index. However, if the frequency difference of two RF signals is 2 GHz and beyond, NSR of
below −20 dB can be only achieved using a medium optical modulation index combined with a
minimum RF of 6 GHz. If a large optical modulation index is used, NSR of below −20 dB
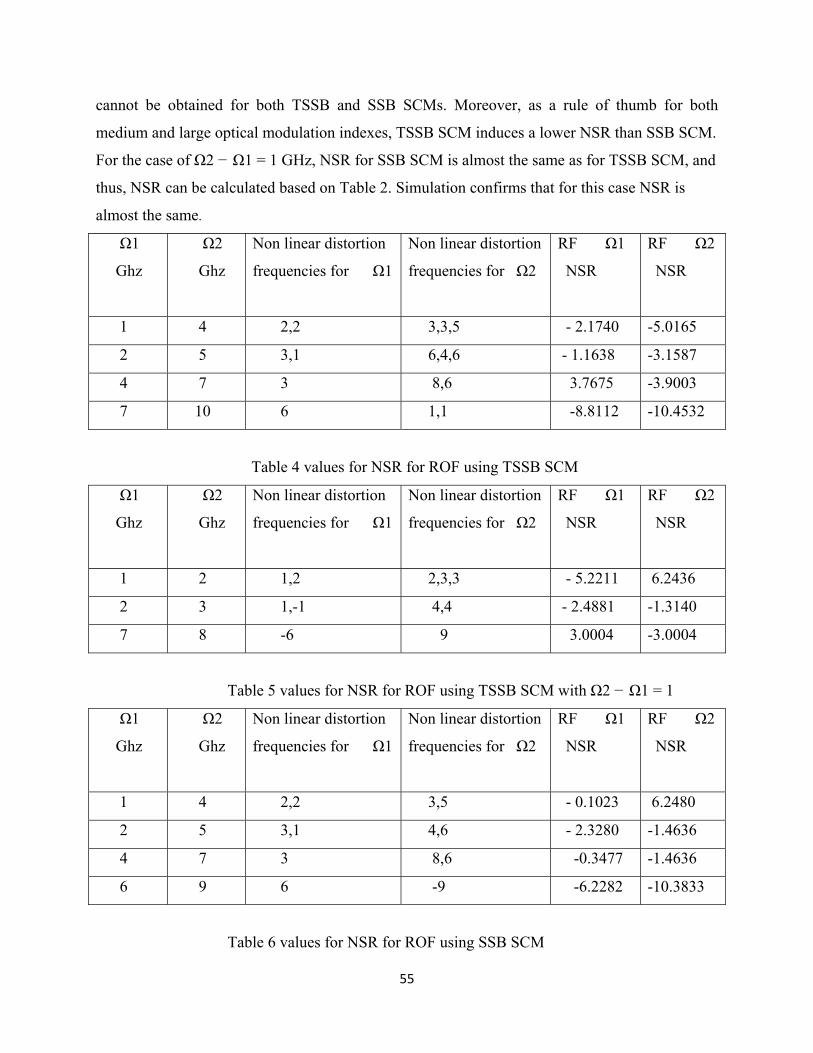
55
cannot be obtained for both TSSB and SSB SCMs. Moreover, as a rule of thumb for both
medium and large optical modulation indexes, TSSB SCM induces a lower NSR than SSB SCM.
For the case of Ω2 − Ω1 = 1 GHz, NSR for SSB SCM is almost the same as for TSSB SCM, and
thus, NSR can be calculated based on Table 2. Simulation confirms that for this case NSR is
almost the same.
Ω1
Ghz
Ω2
Ghz
Non linear distortion
frequencies for Ω1
Non linear distortion
frequencies for Ω2
RF Ω1
NSR
RF Ω2
NSR
1 4 2,2 3,3,5 - 2.1740 -5.0165
2 5 3,1 6,4,6 - 1.1638 -3.1587
4 7 3 8,6 3.7675 -3.9003
7 10 6 1,1 -8.8112 -10.4532
Table 4 values for NSR for ROF using TSSB SCM
Ω1
Ghz
Ω2
Ghz
Non linear distortion
frequencies for Ω1
Non linear distortion
frequencies for Ω2
RF Ω1
NSR
RF Ω2
NSR
1 2 1,2 2,3,3 - 5.2211 6.2436
2 3 1,-1 4,4 - 2.4881 -1.3140
7 8 -6 9 3.0004 -3.0004
Table 5 values for NSR for ROF using TSSB SCM with Ω2 − Ω1 = 1
Ω1
Ghz
Ω2
Ghz
Non linear distortion
frequencies for Ω1
Non linear distortion
frequencies for Ω2
RF Ω1
NSR
RF Ω2
NSR
1 4 2,2 3,5 - 0.1023 6.2480
2 5 3,1 4,6 - 2.3280 -1.4636
4 7 3 8,6 -0.3477 -1.4636
6 9 6 -9 -6.2282 -10.3833
Table 6 values for NSR for ROF using SSB SCM

Fig 3.10
correspon
the propa
frequency
electric f
Fig
0 shows the
nding to Equ
agation cons
y far away f
field is show
Fig 3
3.10 Optical
output Opt
uation 1 (pag
stant with res
from the opti
wn in Fig. 3.1
3.11 Optical
l spectra dist
tical spectra
ge 47) where
spect to the o
ical signal su
0 for the cas
Spectra dist
56
tribution of T
a after trans
e b1 and b2 d
optical carrie
ubcarriers ar
se of Ω1 = 4
tribution of S
TSSB SCM
smission ov
denote the fi
er frequency
re not shown
4 and Ω2 = 7
SSB SCM
er fiber wit
irst and seco
y. Some HDs
n The optical
7 GHz
th a length
ond derivativ
s and IMDs
l spectra of t
of L
ves of
with
the
57
Fig 3.11 shows the output optical spectra after transmission over fiber with a length of L
corresponding to Equation 2(page 53) The optical spectra corresponding is shown in Fig.3.11
for two optical subcarriers with Ω1 = 4 and Ω2 = 7 GHz. Suppose that some HDs and IMDs can
be removed by optical filtering, which is assumed the same as for TSSB SCM. However, optical
signal subcarriers are located in one side of the optical carrier; thus, the optical carrier for SSB
SCM may not be aligned with the central wavelength of DWDM multiplexer filters.

58
3.6 FUTURE SCOPE OF WORK
The future scope of work involves further study of optical components and radio over fibre
components for the improvement and new applications for the same.
The radio over fibre system can be used for the future wireless acess networks radio over fibre
network provide bigger bandwidth and a more robust system In this dissertation, we are
concerned with RoF based network architecture aimed at efficient mobility and bandwidth
management using centralized control capability of the network. In particular, the focus
is mainly placed on RoF networks operating at mm-wave bands. In indoor environments, the
electromagnetic field at mm-wave tends to be confined by walls due to their electromagnetic
properties at these frequencies. In outdoor environments, especially at frequencies around 60
GHz, an additional attenuation is necessary as oxygen absorption limits the transmission range .
Both the cases result in very small cell as compared to microwave bands such as 2.4 or 5 GHz,
requiring numerous BSs to be deployed to cover a broad service area. Thus, in such networks
with a large number of small cells, we realize two important issues: (1) the system should be
cost-effective and (2) mobility management is very significant.
One promising alternative to the first issue is an RoF based network since in this network
functionally simple and cost-effective BSs are utilized in contrast to conventional wireless
systems. However, the second issue is still challenging and difficult to realize as the conventional
handover procedures cannot easily be applied to the system. In this dissertation, we consider first
RoF network architecture operating at mm-wave bands with special emphasis on mobility
management. Specifically, our concern is how to support fast and simple handover in such
networks using RoF network's centralized control capability. In addition, an RoF based
broadband wireless access network architecture is proposed, where wavelength division
multiplexing (WDM) is utilized for bandwidth allocation. RoF systems have a wide variety of
applications and they fulfill the necessary criteria for being a modern communication systems
59
REFERENCES
[1] N. Gisin and B. Huttner, “Combined effects of polarization mode dispersion and polarization
dependent losses in optical fibers,” Opt. Commun., vol. 142, pp.119–125, 1997.
[2] C.-L. Chen and W. K. Burns, “Polarization characteristics os singlemode fiber couplers,”
IEEE J. Quantum Electron., vol. QE-18, no. 10, pp. 1589–1600, 1982.
[3] R. G. Priest, “Analysis of fiber interferometer utilizing 3 × 3 fiber coupler,” IEEE Trans.
Microwave Theory Tech., vol. MTT-30, pp. 1589–1591, 1982.
[4] “Liquid Crystal Fabry-Perot Tunable Filter” by Boulder Nonlinear Systems May 9, 2001
[5] H. S. Huang and H. C. Chang, “Analysis of equilateral three-core fibers by circular
harmonics expansion method,” J. Lightwave Technol., vol. 8, no. 6, pp. 945–951, 1990.
[6] RADIO OVER FIBER NETWORKS by Pardeep Kaur1,R.S.Kale
[7] D. Castleford, A. Nirmalathas, D. Novak, and R. S. Tucker, “Optical crosstalk in fiber- radio
WDM networks“IEEE Transactions on Microwave Theory & Techniques, vol. 49 pp 2030-5,
2004.
[8] J. Yu, J. Gu, X. Liu, Z. Jia, and G. Chang, “Seamless integration of an 8 × 2.5 Gb/s
WDM PON and radio over fiber using all-optical up conversion based on Raman assisted
FWM,” IEEE Photon. Technol. Lett., vol. 17, no. 9, p .1986–1988, Sep. 2005.
[9] X. Zhang, B. Liu, J. Yao, K. Wu, and R. Kashyap, “A novel millimeter wave band radio
over fiber system with dense wavelength division multiplexing bus architecture,” IEEE Trans.
Microw. Theory Tech., vol. 54, no. 2, pp. 929–937, Feb. 2006.
[10] W. Chen and W. Way, “Multi-channel signal-sideband SCM/DWDM transmission
systems,” J. Lightw. Technol., vol. 22, no. 7, pp. 1679–1693, Jul. 2004.
[11] M. Bakaul, A. Nirmalathas, and C. Lim, “Multi-functional WDM optical interface for
millimeter wave fiber-radio Antenna base station,” J. Lightw. Technol., vol. 23, no. 3, pp.
1210–1218, Mar. 2005.
[12] Jan Bechtle, Gert F. Trommer “S-matrix representation of polarization dependent fibre
optic couplers for the simulation of optical networks”, Aug 2005
[13] H. Toda, T. Yamashita, T. Kuri, and K. Kitayama, “Demultiplexing using an arrayed-
waveguide grating for frequency interleaved DWDM millimeter wave radio on fiber systems,”
J. Lightw. Technol., vol. 21, no. 8, pp. 1735-1741, Aug. 2003.

60
[14] T. Kuri and K. Kitayama, “Optical heterodyne detection techniques for densely
multiplexed millimeter-wave band radio on fiber systems,” J. Lightw. Technol., vol. 21, no. 12,
pp. 3167–3179, Dec. 2003.
[15] G. Smith, D. Novak, and Z. Ahmed, “Technique for optical SSB generation to overcome
dispersion penalties in fiber-radio system,” Electron. Lett., vol. 33, no. 1, pp. 74–75, Jan.
1997.
[16] “Overcoming chromatic dispersion effects in fiber-wireless systems incorporating external
modulators,” IEEE Trans. Microw. Theory Tech., vol. 45, no. 8, pp. 1410–1415, Aug. 1997.
[17] A. Narasimha, X. Meng, M. Wu, and E. Yablonovitch, “Tandem singleside band
modulation scheme for doubling spectral efficiency of analogue fiber links,” Electron. Lett.,
vol. 36, no. 13, pp. 1135–1136, Jun. 2000.
[18] P. Laurencio and M. Medeiros, “Dynamic range of optical links employing optical single
side-band modulation,” IEEE Photon. Technol. Lett., vol. 15, no. 5, pp. 748–750, May 2003.
[19] H. Lu, S. Tzeng, and Y. Liu, “Intermodulation distortion suppression in a full-duplex
radio over fiber ring networks,” IEEE Photonics Technol. Lett., vol. 16, pp. 602–604, Feb.
2004.
[20] L. Roselli, V. Borgioni, F. Zepparelli, F. Ambrosi, M. Comez, P. Faccin, and A. Casini,
“Analog laser pre-distortion for multi-service radio over fiber systems,” J. Lightw. Technol.,
vol. 21, no. 5, pp. 1211–1223, May 2003.
[21] K. S. Yang, S. T. Choi, Y. H. Kim, S. Nishi, S. Shimizu and K. Tokuda, "A 60GHz
compact mobile terminal for full dules radio on fiber system", Microwave and Optical Tech.
Letters, Vol. 44, pp. 504-507, Mar 2005.
[22] T. Kuri, K. Kitayama, A. Stohr and Y. Ogawa, "Fiber-Optic Millimeter-Wave Downlink
System Using 60GHz-Band External Modulation", IEEE J. Lightwave Technol., Vol. 17,
No. 5, pp. 799-806, May 1999.
[23] L. A. Johansson and A. J. Seeds, "36GHz 140Mb/s radio-overfiber transmission using an
optical injection phase-lock loop source", IEEE Photonics Technology Letters, Vol. 13, No.
8, pp. 893-895, Aug 2001.
[24] G. H. Smith, A. Nirmalathas, J. Yates and D. Novak, "Dispersion effects in millimeter
wave fiber radio systems employing direct sequence code division multiple access", Optical
Fiber Technology, Vol. 5, pp. 165-174, 1999.

61
[25] H. Ogawa, D. Polifko and S. Banba, "Millimeter-wave fiber optics systems for personal
radio communication", IEEE Trans. Microwave Theory & Tech., Vol. 40, No. 12, pp. 2285
-2292, Dec 1992.
[26] Q. H. Pham, A. Alphones, M. Fujise and Z. Shao, "Performance of MC-CDMA signals
on low cost radio over fiber link", 5th Intl. Conf. on ITST 2005, France, Jun 2005.
[27] D. Castleford, A. Nirmalathas, D. Novak, and R. S. Tucker, “Optical crosstalk in fiber-
radio WDM networks“IEEE Transactions on Microwave Theory & Techniques, vol. 49 pp
2030-5, 2004.
[28] L. Moura, M. Darby, P. M. Lane, and J. J. O'Reilly, —Impact of interferometric noise
on the remote delivery of optically generated millimeter-wave signals“IEEE Transactions
on Microwave Theory & Techniques, vol. 45, pp1398-402, 2002.
[29] ANTONIO TEIXERRA,“filter optimization for wavelength intertleaved radio over
fiber networks”ieee transactions ,2003
[30] A. Nirmalathas, D. Novak, C. Lim, and R. B. Waterhouse. Wavelength reuse in the
WDM optical interface of a millimeterwave fiber-wireless antenna base station”, IEEE
Transactions onMicrowave Theory & Techniques, vol. 49, 2001.
[31] Istavan frigyes,“radio over fiber: application, design and impact”IEEE journal of selected
areas in communication, Jun 2001.
[32] Y. Weissman, Optical Network Theory. Norwood, MA: Artech House, 1992.
[33] S. K. Sheem, “Fiber optic gyroscope with (3 × 3)-directional coupler,” Appl. Phys.
Lett., vol. 37, pp. 869–871, 1980.
[34] G. F. Trommer, “Wavelength dependence of (3 × 3) fibre couplers for gyro
applications,” Electron. Lett., vol. 25, pp. 944–945, 1989.
[35] R. G. Priest, “Analysis of fiber interferometer utilizing 3 × 3 fiber coupler,” IEEE
Trans. Microwave Theory Tech., vol. MTT-30, pp. 1589– 1591, 1982.
[36] T. Wiener, F. Bucholtz, and M. Todd, “The effects of thermal and polarization
fluctuations on 3×3 coupler performance,” in 15th Optical Fiber Sensors Conference
Technical Digest, 2002, pp. 587–590.
[37] Bit Error Rate and Power Spectrum Measurements of a Millimeter Wave Radio-over-
Fiber System L. C. Ong', C. S. Lim', B. Luol, A. Alphones2, Mingtuo Zhou3 and
R.Miura3 1-4244-0749-4/07/ w2007 IEEE.
62
[38] A. J. Stevenson and J. D. Love, “Vector modes of six-port couplers,” Electron
Lett., vol. 23, pp. 1011–1013, 1987.
[39] C. C. Su, “A surface integral equations method for homogeneous optical fibers
and coupled image lines of arbitrary cross sections,” IEEE Trans. Microwave
Theory Tech., vol. MTT-33, no. 11.
[40] T.-L. Wu, “Rigorous analysis of polarization-dependence loss (pdl) for
equilateral 3 × 3 fused fiber couplers,” IEEE Trans. Microwave Theory Tech.
, vol. 16, no. 1.
[41] H. S. Huang and H.-C. Chang, “Analysis of equilateral three-core fibers by
circular harmonics expansion method,” J. Lightwave Technol., vol. 8, no. 6, pp
. 945–951, 1990.
[42] S.-W. Yang and H.-C. Chang, “Numerical modeling of weakly fused fiber
-optic polarization beamsplitters-part i: Accurate calculation of coupling
coefficients and form birefringence,” J. Lightwave Technol., vol. 16, no. 4, pp
. 685–690, 1998.
[43] Impact of Nonlinear Distortion in Radio Over Fiber Systems With Single-Sideband
and Tandem Single-Sideband Subcarrier Modulations Caiqin Wu and Xiupu Zhang,
Member, IEEE, 0733-8724 © 2006 IEEE
[44] G. F. Trommer, H. Poisel, W. Buhler, E. Hartl, and R. Muller, “Passive fiber optic
gyroscope,” Appl. Optics, vol. 29, pp. 5360–5363, 1990.
[45] O. Andrisano, V. Tralli, and R. Verdone, .Millimeter Waves for Short-Range
Multimedia CommunicationSystems,. Proc. IEEE, vol. 86, no. 7, pp
.1383.1401, July 1998.
[46] P. Smulders, .Exploiting the 60 GHz Band for Local Wireless Multimedia
Access: Prospects and Future Directions,. IEEE Commun. Mag., pp. 140.147
, Jan. 2002.
[47] J. R. Forrest, .Communication Networks for the New Millennium,. IEEE
Trans. Microwave Theory Tech., vol. 47, no. 12, pp. 2195.2201, Dec. 1999.
[48] F. Giannetti, M. Luise and R. Reggiannini, .Mobile and Personal Communications in
the 60 GHz Band: A Survey,. Wireless Personal Commun., pp. 207.243, Oct. 1999.
[49] A. J. Cooper, .Fiber/Radio for the provision of cordless/mobile telephony services in the

63
accessnetwork,. Electron. Lett., vol. 26, no. 24, pp. 2054.2056 ,Nov. 1990.
[50] T.-S. Chu and M. J. Gans, .Fiber Optic Microcellular Radio,. IEEE Trans. Veh
.Technol., vol. 40, no. 3, pp. 599.606, Aug. 1991.
[51] H. Kim, J. M. Cheong, C. Lee, and Y. C. Chung, .Passive Optical Network
for Microcellular CDMA Personal Communication Service,. IEEE Photonics
Tech. Lett., vol. 10, no. 11, pp. 1641.1643, Nov. 1998.
[52] J. S. Yoon, M. H. Song, S. H. Seo, Y. S. Son, J. M. Cheong and Y. K. Jhee,
.A High-Performance Fiber-Optic Link for cdma2000 Cellular Network,. IEEE
Photon. Technol. Lett., vol. 14, no. 10, pp. 1475.1477, Oct. 2002.
[53 ] K. Kojucharow, M. Sauer, H. Kaluzni, D. Sommer, F. Poegel, W. Nowak, and
D. Ferling, .Simultaneous Electrooptical Upconversion, Remote Oscillator
Generation, and Air Transmission of Multiple Optical WDM Channels for a
60-GHz High-Capacity Indoor System,. IEEE Trans. Microwave Theory
Tech., vol. 47, no. 12, pp. 2249.2255, Dec. 1999.
[54] E. I. Ackerman and C. H. Cox, .RF Fiber-Optic Link Performance,. IEEE
Microwave, pp. 50.58, Dec. 2001.141
[55] J. H. Haywood, I. M. Bassett, and M. Matar, “Application of the nimi technique to
the 3 × 3 sagnac fibre optic current sensor – experimental results,” in 15th Optical
Fiber Sensors Conference Technical Digest, 2002, pp
. 553–556.
[57] C. Lim, A. Nirmalathas, M. Attygalle, D. Novek, and R. Waterhouse, “On the merging
of millimeter-wave fiber-radio backbone with 25 GHzWDM ring networks,” J. Lightw.
Technol., vol. 21, no. 10, pp. 2203–2210, Oct. 2003.
[58] Introduction to Fiber Optics, 3rd Edition,1995, John Crisp Barry Elliott