Studies on Eel Liver Functions Using Perfused Liver and ... · PDF fileStudies on Eel Liver...
57
Aqua-BioSci. Monogr. (ABSM), Vol. 1, No. 2, pp. 1–57 (2008) © 2008 TERRAPUB, Tokyo. All rights reserved. www.terrapub.co.jp/onlinemonographs/absm/ *Corresponding author at: Department of Biochemistry and Technology of Marine Food and Resources, Faculty of Fisheries, Kagoshima University, Kagoshima 890-0056, Japan e-mail: [email protected] Received on March 17, 2008 Accepted on June 9, 2008 Published online on December 26, 2008 Keywords • perfused eel livers • isolated eel hepatocytes • cultured eel hepatocytes • gluconeogenesis • glycogen synthesis • glucagon • lipoprotein synthesis • ganglioside GM4 Studies on Eel Liver Functions Using Perfused Liver and Primary Cultured Hepatocytes Seiichi Hayashi * and Akiko Kumagai Department of Biochemistry and Technology of Marine Food and Resources, Faculty of Fisheries, Kagoshima University, Kagoshima 890-0056, Japan Abstract Perfused eel livers, isolated eel hepatocytes, and cultured eel hepatocytes are used to investigate eel liver functions such as gluconeogenesis, glycogen synthesis, and lipoprotein synthesis and methods for preparation are described. A novel phos- phoenolpyruvate (PEP) synthesis pathway from pyruvate in gluconeogenesis in eel liver was elucidated and PEP synthesis pathways in eel, rat, and pigeon livers were compared. Glycogen synthesis from pyruvate, lactate, and glucose was in- vestigated by using cultured eel hepatocytes. It was found that 10 –6 or 10 –7 M glucagon didn’t stimulate glycogen degradation in the presence of pyruvate but stimulated glycogen degradation in the presence of lactate. Glycogen synthesis from pyruvate was observed even when 10 –6 or 10 –7 M glucagon was present. The characteristics of the lipoprotein synthesized and secreted by cultured eel hepatocytes are clarified. Thyroxine and eel serum high-density lipoprotein (HDL) stimulated the lipoprotein synthesis by cultured eel hepatocytes. In the presence of estradiol-17β, eel serum HDL stimulated vitellogenin synthesis in eel hepatocytes. HDL specifically bound to eel hepatocytes and the ligand of HDL receptor in the plasma membrane of eel hepatocytes was identified to be ganglio- side GM4 of eel serum HDL. 1. Introduction A liver has many functions such as gluconeogenesis, synthesis of serum proteins, lipid synthesis, and detoxification. Hormones, cytokines, and many metabolites in serum regulate liver functions in vivo. These materials are produced by various extra-hepatic tissues as well as by liver. Therefore, isolation of a liver from a living animal is necessary for investigating liver functions. A perfused liver, isolated hepatocytes, and primary culture of hepatocytes have been developed for investigating such functions. A perfused liver was used for the first time when Claude Bernard (1957) investigated the conversion of glycogen to glucose in a liver. However, this technique was not widely accepted until the early 1960s when Miller et al. (Miller et al. 1951; Miller 1973) developed an apparatus and an operative procedure for the perfusion of isolated rat liver. A perfused liver is able to keep liver functions active for 2 to 3 h and so is usually available for experiments lasting 2 to 3 h.
-
Upload
nguyendung -
Category
Documents
-
view
228 -
download
1
Transcript of Studies on Eel Liver Functions Using Perfused Liver and ... · PDF fileStudies on Eel Liver...

Aqua-BioSci. Monogr. (ABSM), Vol. 1, No. 2, pp. 1–57 (2008)© 2008 TERRAPUB, Tokyo. All rights reserved. www.terrapub.co.jp/onlinemonographs/absm/
*Corresponding author at:Department of Biochemistry and Technology of Marine Food and Resources,Faculty of Fisheries, Kagoshima University,Kagoshima 890-0056, Japane-mail: [email protected]
Received on March 17, 2008Accepted on June 9, 2008Published online on
December 26, 2008
Keywords• perfused eel livers• isolated eel hepatocytes• cultured eel hepatocytes• gluconeogenesis• glycogen synthesis• glucagon• lipoprotein synthesis• ganglioside GM4
Studies on Eel Liver Functions Using PerfusedLiver and Primary Cultured Hepatocytes
Seiichi Hayashi* and Akiko Kumagai
Department of Biochemistry and Technology of Marine Food and Resources,Faculty of Fisheries, Kagoshima University,Kagoshima 890-0056, Japan
AbstractPerfused eel livers, isolated eel hepatocytes, and cultured eel hepatocytes are usedto investigate eel liver functions such as gluconeogenesis, glycogen synthesis,and lipoprotein synthesis and methods for preparation are described. A novel phos-phoenolpyruvate (PEP) synthesis pathway from pyruvate in gluconeogenesis ineel liver was elucidated and PEP synthesis pathways in eel, rat, and pigeon liverswere compared. Glycogen synthesis from pyruvate, lactate, and glucose was in-vestigated by using cultured eel hepatocytes. It was found that 10–6 or 10–7 Mglucagon didn’t stimulate glycogen degradation in the presence of pyruvate butstimulated glycogen degradation in the presence of lactate. Glycogen synthesisfrom pyruvate was observed even when 10–6 or 10–7 M glucagon was present. Thecharacteristics of the lipoprotein synthesized and secreted by cultured eelhepatocytes are clarified. Thyroxine and eel serum high-density lipoprotein (HDL)stimulated the lipoprotein synthesis by cultured eel hepatocytes. In the presenceof estradiol-17β, eel serum HDL stimulated vitellogenin synthesis in eelhepatocytes. HDL specifically bound to eel hepatocytes and the ligand of HDLreceptor in the plasma membrane of eel hepatocytes was identified to be ganglio-side GM4 of eel serum HDL.
1. Introduction
A liver has many functions such as gluconeogenesis, synthesis of serum proteins, lipidsynthesis, and detoxification. Hormones, cytokines, and many metabolites in serum regulateliver functions in vivo. These materials are produced by various extra-hepatic tissues as well asby liver. Therefore, isolation of a liver from a living animal is necessary for investigating liverfunctions. A perfused liver, isolated hepatocytes, and primary culture of hepatocytes have beendeveloped for investigating such functions.
A perfused liver was used for the first time when Claude Bernard (1957) investigated theconversion of glycogen to glucose in a liver. However, this technique was not widely accepteduntil the early 1960s when Miller et al. (Miller et al. 1951; Miller 1973) developed an apparatusand an operative procedure for the perfusion of isolated rat liver. A perfused liver is able to keepliver functions active for 2 to 3 h and so is usually available for experiments lasting 2 to 3 h.

2 Studies on Eel Liver Functions Using Perfused Liver and Primary Cultured Hepatocytes
Aqua-BioScience Monographs VOL. 1 NO. 2 2008
The current methods of isolated hepatocytes are based on the procedure of Berry and Friend(1969). Berry (1976) has pointed out that any successful method for liver cell separation mustinvolve three critical steps, namely exposure of the liver to a calcium-free medium, digestionwith collagenase, and gentle mechanical treatment. Liver cell suspension consists of severalkinds of cells, which are hepatic parenchymal cells (hepatocytes), endothelial and epithelialcells, Kupper cells, and Ito cells. The hepatocytes constitute the major and most representativecellular subpopulation in terms of liver functions and are easily separated from other liver cellsby low-speed centrifugation of about 60 × g for 90 s. Isolated hepatocytes, as well as a perfusedliver are available for around 2 to 3 h for experiments, but many experiments with differentconditions can be conducted by using isolated hepatocytes prepared from one liver.
Primary culture of hepatocytes has been used for investigating liver functions since Bissellet al. (1973) cultured adult rat hepatocytes as a monolayer. Cultured hepatocytes maintain liverfunctions for several days in a culture medium (Gómez-Lechón and Castell 1994).
A perfused liver, isolated hepatocytes, and cultured hepatocytes are used to investigatefish liver functions as well as mammalian liver. Particularly, all these three methods are avail-able for studying eel liver functions. Eel livers also have many important functions as havemammalian livers. Their functions are gluconeogenesis (Hayashi and Ooshiro 1975a, 1979),lipogenesis (Ndiaye and Hayashi 1996), and synthesis and secretion of serum proteins (Yu et al.1991; Hayashi and Yu 1993).
Here, gluconeogenesis, gluconeogenic pathway, glycogen synthesis, lipoprotein synthe-sis, high-density lipoprotein (HDL) metabolism, and vitellogenin synthesis in eel liver are de-scribed. In addition, integrity of a perfused eel liver, isolated and cultured eel hepatocytes is alsodiscussed.
2. Eel as an experimental fish for studying liver functions
2-1. Availability of eel (Anguilla japonica) as an experimental fish
A perfused liver (Hayashi and Ooshiro 1975a, 1975b), isolated liver cells (Hayashi andOoshiro 1978), and cultured hepatocytes (Hayashi and Ooshiro 1985c, 1986; Hayashi 1988,1991; Hayashi and Komatsu 1998) have been used for investigation of eel liver functions. Eelliver should be made available for these experimental methods. There are five reasons why eelliver should be available. (1) Compared to those of other fishes, eel portal and hepatic veins arethicker and stronger, making it possible to insert polyethylene tubing into the veins. Further-more, the portal vein of eel is very easy to recognize because of the short length of the intestine.(2) Eels of 200 to 250 g body weight have livers (2 to 3 g) large enough for perfusion. (3) Eelscan be kept in fresh water in a laboratory for several months without feeding. (4) Eel liver is aseparate organ from the pancreas, but in other fishes such as carp the liver and pancreas coexistas a hepatopancreas and perfusing such a liver is impossible. (5) Eels weighing 200 to 250 g canbe obtained at any season throughout the year, because eels are actively aquacultured in fresh-water at 25 to 31°C at Kagoshima, Japan.
2-2. Perfusion of eel liver
Perfusion apparatus is shown in Fig. 1 and is set up in a box kept at 28°C with a ther-moregulator and a hair-dryer. The perfusion medium is Krebs–Ringer bicarbonate buffer (pH7.4 ± 0.1) oxygenated continuously with 5% CO2/95% O2. Eel liver, portal vein, intestine, andheart are shown in Fig. 2A. The pancreas is found around the portal vein like an adipose tissue onthe intestine and the gall bladder is contacted and connected to the liver and is hidden at the backof the liver in Fig. 2A. Figure 2B shows how to connect polyethylene tubings into a liver. De-tailed procedures of perfusion of eel liver have previously been described in the papers by Hayashiand Ooshiro (1975a), Hayashi (1991), and Hayashi and Komatsu (1998).

Studies on Eel Liver Functions Using Perfused Liver and Primary Cultured Hepatocytes 3
Aqua-BioScience Monographs VOL. 1 NO. 2 2008
2-3. Primary culture of eel hepatocytes
2-3A. Isolated eel hepatocytesIsolated eel hepatocytes are prepared by collagenase digestion of a perfused liver (Hayashi
and Ooshiro 1978). The average number of isolated eel hepatocytes prepared from one eel liver
Fig. 1. Perfusion apparatus. (I) A, flask (100 mL); B, silicon tubing (100 cm, 2-mm inner diameter, 4-mm outer diameter);C, reservoir; D, three-way cock; E, silicon tubing (15 cm, 4-mm inner diameter, 6-mm outer diameter); F, platform;G, polyethylene tubing for O2 and CO2; a, about 6 cm; b, about 7 cm; 1,2, silicon tubing (1-mm inner diameter, 3-mm outerdiameter). (II) A, peristaltic pump; B, reservoir; C, tube for O2 and CO2; D, flask; E, stirrer; F, platform; G, J, thermoregulator;H, hair dryer; I, pH meter; L, liver. Reproduced with permission from Primary culture of eel hepatocytes—Synthesis andsecretion of lipoprotein, Hayashi and Komatsu. In: Cell & Tissue Culture: Laboratory Procedures, Doyle, Griffiths, andNewell, eds. 1998 © John Wiley & Sons Limited.

4 Studies on Eel Liver Functions Using Perfused Liver and Primary Cultured Hepatocytes
Aqua-BioScience Monographs VOL. 1 NO. 2 2008
(2 to 2.5 g) is 5 × 10⁸ hepatocytes. If 5 × 10⁶ of hepatocytes are used in one experiment, up to 100experiments are possible using one liver. Though a perfused liver is good experimental materialfor investigating liver functions, one experiment requires one eel. Since eel as an experimentalfish is not homogeneous in age, sex, nutritional conditions, heredity, and weighing, we do some-times get results with relatively large deviations by using perfused eel livers. Isolated eelhepatocytes can remove such obstacles because many experiments are possible by using iso-lated hepatocytes prepared from one liver.
A stringent test of the metabolic integrity of hepatocytes is the ability to synthesize glu-cose from pyruvate or lactate, because gluconeogenesis involves both the mitochondrial andcytosolic fractions of hepatocytes working in union. Furthermore, four moles of ATP and twomoles of GTP (or ITP) are required for the synthesis of one mole of glucose from two moles oflactate or pyruvate. The ability to synthesize glucose from lactate, pyruvate, or alanine is stableat least for 60 min in isolated eel hepatocytes (Hayashi and Ooshiro 1978, 1979). However, asdescribed by Söling and Kleineke (1976), the functional state of isolated hepatocytes are some-times impaired in comparison to intact livers. The results obtained with isolated hepatocytesmust be interpreted with great caution.
Fig. 2. (A) Eel liver, portal vein, intestine and heart. (B) Polyethylene tubing inserted into portal and hepatic veins. I, Insertpolyethylene tubing into the portal vein and fix by ligation. II, Remove a liver with a gall bladder, a part of the intestine andthe heart from the body. III, Separate the heart from the liver. Insert another polyethylene tube into the hepatic vein betweenthe heart and the liver, and fix by ligation. Reproduced with permission from Primary culture of eel hepatocytes—Synthesisand secretion of lipoprotein, Hayashi and Komatsu. In: Cell & Tissue Culture: Laboratory Procedures, Doyle, Griffiths, andNewell, eds. 1998 © John Wiley & Sons Limited.

Studies on Eel Liver Functions Using Perfused Liver and Primary Cultured Hepatocytes 5
Aqua-BioScience Monographs VOL. 1 NO. 2 2008
Fig. 3. Eel hepatocytes cultured 0 and5 days at 30°C. Bar represents 40 μm.
2-3B. Primary culture of eel hepatocytesAs shown in Fig. 3, isolated eel hepatocytes could be cultured in Williams’ E medium (WE
medium) with 0.16 μM insulin and 5 to 10% fetal bovine serum (FBS) (Table 1A) at 28°C in aCO2 incubator (Yu et al. 1991; Ndiaye and Hayashi 1996; Hayashi and Komatsu 1998). WEmedium contains 11 mM glucose, 20 kinds of amino acids, some kinds of vitamins and inor-ganic salts. Isolated hepatocytes are necessary to attach the surface of culture dishes for culture.However, eel hepatocytes are difficult to attach and the dishes precoated with fibronectin orpoly L-lysine must be prepared to make the eel hepatocytes attach. Poly-L-lysine precoated onculture dishes could make eel hepatocytes attach to the dishes electrostatically. Fibronectin,purifed from horse serum by a gelatin-Sepharose column, is an extracellular matrix and allowseel hepatocytes to attach by its biological activities (March et al. 1974; Dessau et al. 1978).
Kondo and Watabe (2006) have reported the effects of carp serum on goldfish culture cellsand carp serum has a more extensive growth promoting effect compared with FBS. In general,fish serum contains high concentrations of lipoproteins, particularly high-density lipoprotein(HDL). Concentration of fish serum HDL is several to 10 times higher than that of human (Babinand Vernier 1989), but in contrast to HDL, albumin is a very minor component in fish serum

6 Studies on Eel Liver Functions Using Perfused Liver and Primary Cultured Hepatocytes
Aqua-BioScience Monographs VOL. 1 NO. 2 2008
although about half the amount of serum proteins is albumin in human serum. Therefore, in fishcell culture, the use of FBS is not the best choice. Kondo and Watabe (2006) have examined thecomponents of carp serum to promote growth of goldfish cells and they have found lipoproteinfraction containing HDL has a promoting effect. However, the mechanism is still uncertain butfish cells seem to require more lipid than mammalian cells.
Eel hepatocytes were cultured in a serum-free medium, as shown in Table 1B, for 2 to 3weeks (Hayashi and Ooshiro 1986). Insulin, glucagon, prolactin, growth hormone, epidermalgrowth factor (EGF), and H2SeO3 were used for culture instead of FBS. The serum-free mediumis the modified medium reported by Enat et al. (1984) and all these hormones and EGF origi-nated from mammals. Asami et al. (1984) have reported that rat hepatocytes do not survive in aserum-free medium over 2 days without a trypsin inhibitor because a trypsin-like enzyme ispresent in the plasma membrane of rat hepatocytes and this enzyme damages cultured rathepatocytes. As FBS contains a trypsin inhibitor, rat hepatocytes can be cultured in Williams’medium E with 10% FBS. Eel hepatocytes could be cultured in a serum-free medium without atrypsin inhibitor.
To investigate the effect of hormones or EGF in a serum-free medium on cultured eelhepatocytes, the eel hepatocytes were cultured in a serum-free medium deprived of one hor-mone or EGF (Hayashi and Ooshiro 1986). The hepatocytes cultured for 11 days in a completeserum-free medium are shown in Fig. 4(1). An insulin-deficient medium had the most remark-able effect on the morphology and cell survival of the hepatocytes (Fig. 4(2)). Their morphologywas of a round shape like isolated hepatocytes, even after 11 days and the cell numbers wereabout half compared with those of the control in a complete serum-free medium. This resultshows that insulin is essential for the attachment and spreading of eel hepatocytes.
The morphology of the hepatocytes cultured in a glucagon or prolactin-deficient mediumwas normal during the first 7 days but oil-like droplets in the cultured hepatocyte were observedat 11 days (Figs. 4(3) and (5)). The cell numbers of both hepatocytes were about 60% of thecontrol cells. The hepatocytes cultured in an EGF or growth hormone-deficient medium had anormal morphology but the EGF deficient medium made the cell numbers decrease to about60% of the control cells (Figs. 4(4) and (6)).
3. Glucose metabolisms in eel liver
3-1. Gluconeogenesis in rat liver
Generally, gluconeogenesis means glucose synthesis from pyruvate or lactate. Four molesof ATP and two moles of GTP (or ITP) are required for the synthesis of one mole of glucosefrom two moles of pyruvate or lactate. The pathway of gluconeogenesis is principally the re-verse of the glycolysis pathway except for three steps, specifically between glucose and
A (100 mL) B (100 mL)
William’s E medium 1.1 g 1.1 gPenicilin 7 mg 7 mgStreptomycine 10 mg 10 mgNaHCO3 23 mM 23 mMInsulin 0.16 μM 1 mgOthers FBS 5 or 10 mL Glucagon 100 μg
Prolactin 2 UGrowth hormone 1 μgEGF 5 μgH2SeO3 3 nM
Table 1. Culture medium: A, Williams’ E medium containing fetal bovine serum; B, Williams’ E mediumwithout serum.

Studies on Eel Liver Functions Using Perfused Liver and Primary Cultured Hepatocytes 7
Aqua-BioScience Monographs VOL. 1 NO. 2 2008
glucose-6-phosphate, fructose-6-phosphate and fructose-1,6-bisphosphate, and phosphoenolpyru-vate (PEP) and pyruvate (Fig. 5).
When lactate is used as a substrate for gluconeogenesis, lactate is converted to pyruvate bylactate dehydrogenase (LDH) in the cytosole. Then the pyruvate passes through the mitochon-drial membrane and is converted to oxaloacetate by pyruvate carboxylase. Because the liverpyruvate carboxylase of all animals investigated so far is localized in the mitochondria(Gumbmann and Tappel 1962; Böttger et al. 1969; Garber and Hanson 1971) and oxaloacetatecan not pass through the mitochondrial membrane (Haslam and Griffiths 1968), the reaction ofPEP syntheisis from oxaloacetate by PEP-carboxykinase should be carried out in the mitochon-dria. However, subcellular distribution of PEP-carboxykinase is different among animals. Threesubcellular distributions of PEP-carboxykinase are known. PEP-carboxykinases of pigeon (Gevers
Fig. 4. Effects of insulin, glucagons, prolactin, growth hormone, and epidermal growth factor on primary culture of eelhepatocytes. Eel hepatocytes were cultured for 11 days in Williams’ E medium without serum as shown in Table 1B. Reprintedfrom Hayashi S. Primary culture of eel hepatocytes. Iden, 1988; 42(7), 6–11 (in Japanese) with permission of Shokabo.

8 Studies on Eel Liver Functions Using Perfused Liver and Primary Cultured Hepatocytes
Aqua-BioScience Monographs VOL. 1 NO. 2 2008
1967), rat (Böttger et al. 1969), and eel (Hayashi and Ooshiro 1979) liver distribute in the mito-chondria, in the cytosole, and in both the mitochondria and the cytosole, respectively. Therefore,the step from pyruvate to PEP boxed in Fig. 5 is rather complex. In rat liver PEP-carboxykinasedistribute in the cytosole, therefore oxaloacetate, which can not pass through the mitochondrialmembrane, must be transported to the cytosole from the mitochondria. In rat liver, PEP is syn-thesized from oxaloacetate and GTP by cytosolic PEP-carboxykinase in the cytosole (Böttger etal. 1969). This transportation of oxaloacetate to the cytosole is done by an aspartate-oxaloacetateor a malate–oxaloacetate pathway.
When lactate is used as a gluconeogenetic substrate, lactate is converted to pyruvate by acytosolic enzyme of LDH and, at the same time, an equivalent amount of NADH is formed. Butwhen pyruvate is used, about half of the pyruvate is converted to lactate by LDH, as shown inFig. 6B (Krebs 1968) and so an equivalent amount of NADH in the cytosole is consumed. There-fore, cytosolic NADH is increased when lactate is used as a gluconeogenetic sustrate, but de-creased when pyruvate is used. NADH in the cytosole is necessary for glyceraldehyde-3-phos-phate dehydrogenase reaction in gluconeogenesis, as shown in Fig. 5. The reason why the quan-tity of the cytosolic NADH is changed by lactate or pyruvate seems to be due to the muscle-typeLDH of rat liver (Fine et al. 1963; Ogihara 1975).
There are two types of LDH-isozymes. One is muscle-type and the other is heart-type.Catalytic properties of heart- and muscle-type LDHs are different from each other. It is knownthat substrate inhibition of LDH is due to the formation of a ternary complex such as LDH-NAD+-pyruvate (Everse et al. 1971). The formation of a ternary complex proceeds more readily
Fig. 5. Pathway of gluconeogenesis.* and ** represent glucose-6-P phosphatase andfructose-1,6-P2 phosphatase for gluconeo-genesis, respectively. The PEP synthesis pathwayis boxed.

Studies on Eel Liver Functions Using Perfused Liver and Primary Cultured Hepatocytes 9
Aqua-BioScience Monographs VOL. 1 NO. 2 2008
with heart-type LDH than with muscle-type LDH. As shown in Fig. 6B, about half of the pyru-vate is converted to lactate and this is due to little inhibition of rat liver LDH by the pyruvate. Ifrat liver LDH is of the heart-type, little lactate is produced, as shown in Fig. 6A which alsoshows gluconeogenesis from pyruvate by a perfused eel liver. Eel liver LDH is heart-type, asdescribed in Section 3-2A.
In rat liver when pyruvate is used as a gluconeogenic substrate, the malate–oxaloacetatepathway is used to supplement the decreased cytosolic NADH, as shown in Fig. 7 (Lardy et al.
Fig. 6. Comparison of gluconeogenesisfrom pyruvate by the (A) perfused eel and(B) rat liver. (A) The initial concentrationand radioactivity of 14C-pyruvate were5 mM and 4.63 kBq mL–1, respectively;(B) The initial concentration of pyruvatewas 5 mM (data from Table 3 in Krebs1968). Reproduced from Hayashi, Gluco-neogenesis. In: Metabolism in Fish,Nagayama, ed., 1983. Kouseisha KouseikakuCo., Ltd. with permission of the JapaneseSociety of Fisheries Science and KouseishaKouseikaku Co., Ltd.
Fig. 7. Oxaloacetate–malate pathway in arat liver for gluconeogenesis from pyruvate.The box indicates mitochondrial reactions.Reproduced from Lardy et al., Paths ofcarbon in gluconeogenesis and lipogenesis:The role of mitochondria in supplyingprecursors of phosphoenolpyruvate. Proc.Natl. Acad. Sci. USA, 53, 1965; 1410–1415.© 1965, The National Academy of Scienceswith kind permission of Prof. Henry Lardyand Prof. Verner Paetkau.
10 Studies on Eel Liver Functions Using Perfused Liver and Primary Cultured Hepatocytes
Aqua-BioScience Monographs VOL. 1 NO. 2 2008
1965). The pathways within the box are the mitochondrial pathways. NADH formed by malatedehydrogenase in the cytosole is used for glyceraldehyde-3-phosphate dehydrogenase in thegluconeogenetic pathway, but when lactate is used, the aspartate–oxaloacetate pathway is usedfor gluconeogenesis. These metabolic pathways were also confirmed by inhibitors of enzymes.Amino-oxyacetate (AOA), D-malate, and quinolinic acid inhibit glutamate-oxaloacetate transami-nase, malate dehydrogenase and PEP carboxykinase, respectively. PEP-carboxykinase in thecytosole is also inhibited by tryptophan. In rat liver, AOA inhibits gluconeogenesis from lactate,but not from pyruvate, while D-malate inhibits gluconeogenesis from pyruvate, but not fromlactate. Thus, the aspartate–oxaloacetate pathway functions for gluconeogenesis from lactateand the malate–oxaloacetate pathway functions for that from pyruvate (Krebs et al. 1967;Rognstad and Katz 1970; Anderson et al. 1971; Arinze et al. 1973; Arinze and Rowley 1975;Meijer et al. 1978).
3-2. Gluconeogenesis in eel liver
3-2A. Gluconeogenesis by perfused eel liverGluconeogenesis from lactate (10 mM) by a perfused eel liver is shown in Fig. 8. Glucose
was determined by the colorimetic method using a o-toluidine-borate reagent (Sasaki 1969) andlactate was determined by the enzymatic method (Noll 1984). The rate of glucose synthesisfrom lactate was 0.90 ± 0.07 μmol (g-liver)–1 min–1. The rate of removal of lactate during theinitial 30 min was 4.5 μmol (g-liver)–1 min–1 and that during the following 30 min was2.07 μmol (g-liver)–1 min–1 (Hayashi and Ooshiro 1975a). During the initial 30 min, lactate wasused in another metabolic pathway as well as gluconeogenesis. However, in the following30 min, gluconeogenesis was the main fate of lactate and one mole of glucose was synthesizedfrom 2 moles of lactate. The ability of gluconeogenesis by a perfused eel liver was almost thesame as that by a perfused rat liver (Hems et al. 1966), although the experimental temperature at28°C for eel was lower than that at 37°C for rat.
Eel livers contain glycogen in spite of a long starvation period such as several months(Larsson and Lewander 1973; Dave et al. 1975). Therefore, glucose produced by gluconeogen-esis in the perfusion medium can not be distinguished from glucose produced by glycolysis ofglycogen. To avoid this confusion, a radio-isotope labeled precursor was used for determiningthe gluconeogenesis. Gluconeogenesis from 5 mM 14C-pyruvate by a perfused eel liver is shownin Fig. 6A (Hayashi et al. 1982b; Hayashi 1983). The incorporation of 14C-pyruvate into glucosewas determined as follows. A part of the perfusion medium (0.5 mL) was taken at the indicatedtime and applied to pencil-type columns of Dowex 1 × 8 (formate type) and Dowex 50 × 8(H+ type). 14C-Glucose was eluted by 4 mL of water and 14C-glucose in the eluate was measured
Fig. 8. Gluconeogenesis from DL-lactate by theperfused eel liver. DL-Lactate (10 mM) wasadded at 58 min. Reprinted with permissionfrom Nippon Suisan Gakkaishi, 41, Hayashi andOoshiro, Gluconeogenesis and glycolysis inisolated perfused liver of the eel, 201–208,1975, the Japanese Society of Fisheries Science.
Studies on Eel Liver Functions Using Perfused Liver and Primary Cultured Hepatocytes 11
Aqua-BioScience Monographs VOL. 1 NO. 2 2008
by a liguid scintilation counter (Beckman LS-230). Lactate and pyruvate were determined byenzymatic methods (Noll 1984; Lamprecht and Heinz 1984).
Gluconeogenesis from pyruvate by a perfused rat liver prepared from a starved rat is alsoshown in Fig. 6B (Krebs 1968). As there is almost no glycogen in the liver of rat starved for48 h, the glucose in the perfusion medium is posturated to be derived from gluconeogenesis. Aremarkable difference between eel and rat is the production of lactate. As shown in Figs. 6A andB, lactate production at 20 min perfusion in eel and rat perfused liver was 1.6 and 43 μmol (g-liver)–1, respectively. Pyruvate consumption at 20 min perfusion in eel and rat perfused liver was40 and 85 μmol (g-liver)–1, respectively. Whereas glucose production at 20 min perfusion in eeland rat perfused liver was 15 and 16 μmol (g-liver)–1, respectively.
The difference of lactate production between eel and rat liver is due to the difference of thetype of LDH. The LDH of rat liver is of the muscle type (Fine et al. 1963; Ogihara 1975),whereas that of eel liver is of the heart type, as shown in Fig. 9 (Hayashi et al. 1985). Further-more, LDH types of cod (Sensabaugh and Kaplan 1972), rainbow trout (Bailey and Wilson1968), and other fish livers (Whitt et al. 1975) have been reported to be of the heart type. Cata-lytic properties of heart- and muscle-type LDHs are different as described in Section 3-1. Thesubstrate inhibition proceeds more readily with heart-type enzyme than with muscle-type en-zyme. Actually, the activity of the eel liver LDH is inhibited by 70% in the presence of 1 mMpyruvate and NAD+, whereas that of the eel muscle LDH is inhibited only by 9% (Hayashi et al.1985). As shown in Fig. 6A, little lactate formation from pyruvate seems to be due to the substrateinhibition of the eel liver LDH. The heart type of the eel liver LDH seems to induce a differentPEP synthesis pathway in gluconeogenesis from pyruvate from that of rat, as described in Sec-tion 3-1. The PEP synthesis pathway in the eel liver will be described in Section 3-3.
Gluconeogenesis in eel liver from 14C-lactate was investigated by a non-circulated perfusionsystem to measure the mean time for convertion of lactate to glucose. As shown in Fig. 10, themean time for gluconeogenesis from lactate was 60 ± 15 sec (Hayashi and Ooshiro 1975b). Thismean time is the same as that of a perfused rat liver, about 75 sec (Exton and Park 1967).
Fig. 9. Starch gel electrophoresis of LDH of eelmuscle, liver, and heart extracts. LDH wasdetected by activity staining. Reprinted withpermission from Nippon Suisan Gakkaishi, 51,Hayashi et al., Biochemical properties of thelactate dehydrogenase purified from the eel liver,79–85, 1985, the Japanese Society of FisheriesScience.

12 Studies on Eel Liver Functions Using Perfused Liver and Primary Cultured Hepatocytes
Aqua-BioScience Monographs VOL. 1 NO. 2 2008
3-2B. Gluconeogenesis by isolated eel hepatocytes and cultured eel hepatocytesThe average gluconeogenesis from 5 mM 14C-pyruvate, 14C-lactate, and 14C-alanine by
isolated eel hepatocytes were 19 ± 7 (n = 5), 24 ± 3 (n = 4), and 11 ± 2 (n = 4) μmol (g-wetweight)–1 h–1, respectively (Hayashi and Ooshiro 1979). These were determined by the incorpo-ration of 14C-substrate into glucose. The reaction mixture with 2 mL of final volume con-tained 1 mL of isolated eel hepatocytes, 20 μL of 14C-substrate and a Krebs–Ringer bicarbonatebuffer gassed with 95% O2/5% CO2. The mixture was incubated at 30°C for 60 min. The reac-tion was initiated by the addition of isolated eel hepatocytes and stopped by the addition of0.2 mL of 60% HClO4. After centrifugation, the supernatant was neutralized with 2 M K2CO3
and 1 mL of neutralized supernatant was applied to pencil-type columns of Dowex 1 × 8 andDowex 50 × 8. 14C-Glucose was recovered in the eluate. The wet weight of the cells was calcu-lated from the dry weight and the water content of the cells (73.2 ± 2.8%, n = 10). All theseprocedures are described in the paper by Hayashi and Ooshiro (1979).
Isolated eel hepatocytes were used within 2 h after the preparation of isolated eel hepatocytes.They retain gluconeogenetic ability within 2 h. The average number of isolated eel hepatocytesprepared from one eel liver is 5 × 10⁸ cells and 50 mL of hepatocytes suspension is possible for45 experiments on gluconeogenesis.
After eel hepatocytes were cultured in WE-5% FBS (Table 1A) or a WE-serum-free defienedmedium (Table 1B) on dishes precoated with fibronectin for 7 to 10 days, the hepatocytes werewashed with glucose-free MEM medium containing 0.5% bovine serum albumin (BSA) andincubated in the same medium with or without 10 mM pyruvate or lactate. The medium wasremoved at the indicated time and the glucose in the medium was determined by the colorimetricmethod with glucose oxidase and peroxidase (Kunst et al. 1984).
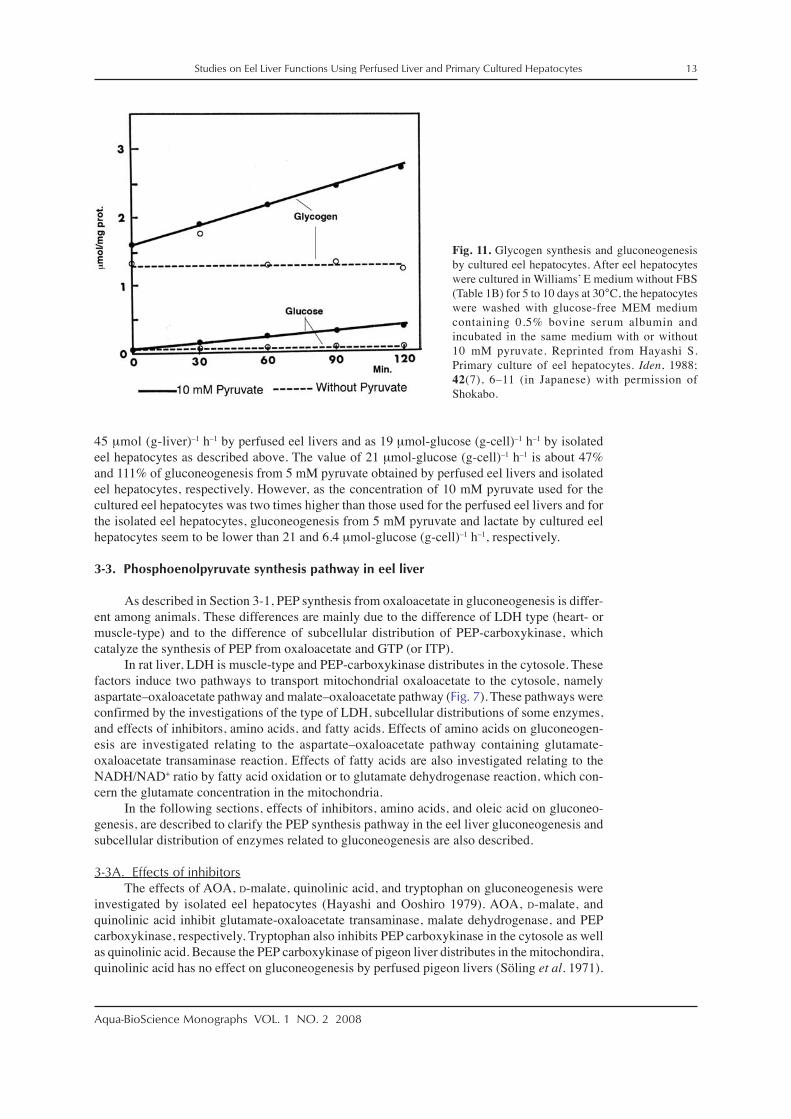
Gluconeogenesis from 10 mM pyruvate and lactate in the cultured eel hepatocytes weredetermined as 0.104 ± 0.029 (n = 3) (Fig. 11) and 0.032 (n = 2) μmol (mg-cell protein)–1 h–1,respectively. If the protein content of the cultured eel hepatocytes is hypothesized to be 20%, therates of glucose synthesis from 10 mM pyruvate and latate are calculated as 21 and 6.4 μmol-glucose (g-cell)–1 h–1, respectively. Gluconeogenesis from 5 mM pyruvate was determined as
Fig. 10. Average time for conversion of lactate to glucose. Aliver of a fasted eel was perfused for 10 min with a mediumcontaining 10 mM DL-lactate by a recirculating system. A pulseof DL-2-14C-lactate (15.9 kBq/50 μL) was injected into themedium flowing into the liver and samples of the effluent werecollected at intervals. Reprinted with permission from NipponSuisan Gakkaishi, 41, Hayashi and Ooshiro, Incorporation of14C-lactate into glucose by perfused eel liver, 791–796, 1975,the Japanese Society of Fisheries Science.
Studies on Eel Liver Functions Using Perfused Liver and Primary Cultured Hepatocytes 13
Aqua-BioScience Monographs VOL. 1 NO. 2 2008
45 μmol (g-liver)–1 h–1 by perfused eel livers and as 19 μmol-glucose (g-cell)–1 h–1 by isolatedeel hepatocytes as described above. The value of 21 μmol-glucose (g-cell)–1 h–1 is about 47%and 111% of gluconeogenesis from 5 mM pyruvate obtained by perfused eel livers and isolatedeel hepatocytes, respectively. However, as the concentration of 10 mM pyruvate used for thecultured eel hepatocytes was two times higher than those used for the perfused eel livers and forthe isolated eel hepatocytes, gluconeogenesis from 5 mM pyruvate and lactate by cultured eelhepatocytes seem to be lower than 21 and 6.4 μmol-glucose (g-cell)–1 h–1, respectively.
3-3. Phosphoenolpyruvate synthesis pathway in eel liver
As described in Section 3-1, PEP synthesis from oxaloacetate in gluconeogenesis is differ-ent among animals. These differences are mainly due to the difference of LDH type (heart- ormuscle-type) and to the difference of subcellular distribution of PEP-carboxykinase, whichcatalyze the synthesis of PEP from oxaloacetate and GTP (or ITP).
In rat liver, LDH is muscle-type and PEP-carboxykinase distributes in the cytosole. Thesefactors induce two pathways to transport mitochondrial oxaloacetate to the cytosole, namelyaspartate–oxaloacetate pathway and malate–oxaloacetate pathway (Fig. 7). These pathways wereconfirmed by the investigations of the type of LDH, subcellular distributions of some enzymes,and effects of inhibitors, amino acids, and fatty acids. Effects of amino acids on gluconeogen-esis are investigated relating to the aspartate–oxaloacetate pathway containing glutamate-oxaloacetate transaminase reaction. Effects of fatty acids are also investigated relating to theNADH/NAD+ ratio by fatty acid oxidation or to glutamate dehydrogenase reaction, which con-cern the glutamate concentration in the mitochondria.
In the following sections, effects of inhibitors, amino acids, and oleic acid on gluconeo-genesis, are described to clarify the PEP synthesis pathway in the eel liver gluconeogenesis andsubcellular distribution of enzymes related to gluconeogenesis are also described.
3-3A. Effects of inhibitorsThe effects of AOA, D-malate, quinolinic acid, and tryptophan on gluconeogenesis were
investigated by isolated eel hepatocytes (Hayashi and Ooshiro 1979). AOA, D-malate, andquinolinic acid inhibit glutamate-oxaloacetate transaminase, malate dehydrogenase, and PEPcarboxykinase, respectively. Tryptophan also inhibits PEP carboxykinase in the cytosole as wellas quinolinic acid. Because the PEP carboxykinase of pigeon liver distributes in the mitochondira,quinolinic acid has no effect on gluconeogenesis by perfused pigeon livers (Söling et al. 1971).
Fig. 11. Glycogen synthesis and gluconeogenesisby cultured eel hepatocytes. After eel hepatocyteswere cultured in Williams’ E medium without FBS(Table 1B) for 5 to 10 days at 30°C, the hepatocyteswere washed with glucose-free MEM mediumcontaining 0.5% bovine serum albumin andincubated in the same medium with or without10 mM pyruvate. Reprinted from Hayashi S.Primary culture of eel hepatocytes. Iden, 1988;42(7), 6–11 (in Japanese) with permission ofShokabo.

14 Studies on Eel Liver Functions Using Perfused Liver and Primary Cultured Hepatocytes
Aqua-BioScience Monographs VOL. 1 NO. 2 2008
As shown in Table 2, AOA inhibited gluconeogenesis from lactate and pyruvate by about 60%.However, D-malate, quinolinic acid, and tryptophan had no effect. These results agreed with thereport on isolated hepatocytes of rainbow trout (Walton and Cowey 1979). It has been reportedthat the permeability of quinolinic acid to the plasma membrane is different among animals(Elliot et al. 1977). No effect of quinolinic acid on gluconeogenesis in eel and rainbow trouthepatocytes seemed to be due to the impermeability of the cell membrane to quinolinic acid orto the properties of the enzyme itself.
In eel and rainbow trout liver, D-malate did not inhibit gluconeogenesis from pyruvate. Itseems that the oxaloacetate–malate pathway with malate dehydrogenase is not included in thepathway of PEP synthesis in gluconeogenesis from pyruvate. In contrast to the effect ofD-malate, AOA, an inhibitor of transaminase, inhibits gluconeogenesis from both pyruvate andlactate. That AOA , but not D-malate, showed an inhibitory effect on gluconeogenesis frompyruvate in eel and rainbow trout liver is remarkably different from gluconeogenesis from pyru-vate in rat liver. As described in Section 3-1, when pyruvate is used as a substrate for gluconeo-genesis in rat liver, about half of the pyruvate is converted into lactate with the consumption ofan equimolar NADH in the cytosole (Fig. 6B) because rat liver LDH is of the muscle type.Therefore, supplying NADH in the cytosole is necessary for glyceraldehyde-3-phosphate dehy-drogenase reaction in gluconeogenesis from pyruvate in rat liver and the oxaloacetate–malatepathway supplies NADH through malate dehydrogenase in the cytosole (Krebs et al. 1967;Anderson et al. 1971). As shown in Fig. 6A, pyruvate is used to synthesize glucose, and littlelactate is formed in perfused eel livers. This means that even if pyruvate is used as a gluconeogenicsubstrate, there is no decrease in the cytosolic NADH in eel liver. This seems mainly due to theheart type of LDH in eel liver, as shown in Fig. 9 (Hayashi et al. 1985). Therefore, the oxaloacetate–malate pathway for gluconeogenesis is not essential in eel liver, as supported by the fact thatD-malate did not inhibit gluconeogenesis from pyruvate.
Table 2. Effects of amino-oxyacetate (AOA), D-malate, quinolinic acid (QA) and tryptophan on gluconeogenesis in isolated eelliver cells.
The initial concentration and radioactivity of substrates were 5 mM and 9.25 kBq, respectively. The data are the means ± S.D.for three observations. ap < 0.01. Reprinted from J. Comp. Physiol. B, 132, 1979, 343–350, Gluconeogenesis in isolated livercells of the eel, Anguilla japonica, Hayashi and Ooshiro, Table 1. © 1979, Springer-Verlag. With kind permission of SpringerScience+Business Media.

Studies on Eel Liver Functions Using Perfused Liver and Primary Cultured Hepatocytes 15
Aqua-BioScience Monographs VOL. 1 NO. 2 2008
3-3B. Subcellular distribution of enzymesSubcellular distribution of pyruvate carboxylase, glutamate oxaloacetate transaminase, and
PEP carboxykinase, as well as marker enzymes of succinate dehydrogenase of mitochondriaand lactate dehydrogenase of cytosole in eel hepatocytes, is shown in Table 3. Pyruvate car-boxylase of eel liver is a mitochondrial enzyme as well as that of carp (Gumbmann and Tappel1962), rat (Böttger et al. 1969), and guinea pig liver (Garber and Hanson 1971). Glutamate-oxaloacetate transaminase and PEP carboxykinase of eel liver was distributed in both the mito-chondria and the cytosole. Approximately 30% of PEP-carboxykinase activity was localized inthe mitochondria, therefore a part of PEP seemed to be synthesized in the mitochondria bymitochondrial PEP-carboxykinase (oxaloacetate–PEP pathway). That the degree of inhibitionby AOA on gluconeogenesis from lactate or pyruvate was 60% (Table 2) seems due to theinhibition of cytosolic glutamate-oxaloacetate transaminase by AOA. The AOA insensitive por-tion is likely due to the oxaloacetate–PEP pathway in the mitochondria.
Effects of quinolinic acid on the PEP carboxykinase activity in the cytosolic and the mito-chondrial fractions were investigated. The activities of the cytosolic and the mitochondrial
Table 3. Subcellular distribtion of enzymes in eel liver.
(A) Marker enzymes of succinate dehydrogenase (SCD) and lactate dehydrogenase (LDH). (B) Pyruvate carboxylase (PC),aspartate transaminase (GOT), and PEP-carboxykinase (PEPCK). Activities were measured at 37°C. The data are means ± S.D.of three observations. Reproduced from J. Comp. Physiol. B, 132, 1979, 343–350, Gluconeogenesis in isolated liver cells of theeel, Anguilla japonica, Hayashi and Ooshiro, Tables 6 and 7. © 1979, Springer-Verlag. With kind permission of SpringerScience+Business Media.

16 Studies on Eel Liver Functions Using Perfused Liver and Primary Cultured Hepatocytes
Aqua-BioScience Monographs VOL. 1 NO. 2 2008
fraction were inhibited by 30 and 25%, respectively (Hayashi and Ooshiro 1979). No effect ofquinolinic acid on the gluconeogensis in isolated eel hepatocytes shown in Table 2 seems due tothe impermeability of the plasma membrane of eel hepatocytes to quinolinic acid. PEPcarboxykinase of rat liver is found only in the cytosole (Nordie and Lardy 1963; Böttger et al.1969), but that of guinea pig liver is found in both the cytosole and the mitochondria (Nordieand Lardy 1963). In pigeon liver PEP carboxykinase is found only in the mitochondria (Gevers1967). Thus, there are three types of subcellular distrubution of PEP carboxykinase among ani-mals. Comparison of the PEP synthesis pathway between eel, rat, and pigeon liver will be de-scribed in Section 3-4.
The PEP synthesis pathway in eel liver is shown in Fig. 12. The pathways within thesquare show the mitochondrial pathways. These are assumed from the results of the effects ofinhibitors such as AOA, D-malate, and quinolinic acid and of the subcellular distributions ofpyruvate carboxylase, glutamate-oxaloacetate transaminase, and PEP carboxykinase.
3-3C. Effects of leucine and other amino acidsAs shown in Fig. 12, oxaloacetate in the mitochondria is synthesized by mitochondrial
pyruvate carboxylase and then converted to aspartate by the mitochondrial glutamate-oxaloacetatetransaminase. Aspartate formation is affected by the glutamate concentration in the mitochon-dria and the glutamate concentration is affected through glutamate dehydrogenase or sometransaminases. Glutamate dehydrogenase is stimulated by leucine and some amino acids stimu-late transaminases. Then the effects of leucine and other amino acids on gluconeogenesis wereinvestigated.
The stimulatory effect of leucine was observed in gluconeogenesis from 5 mM 14C-lactate,14C-pyruvate, and 14C-alanine (Table 4). Gluconeogenesis from 5 mM 14C-lactate, 14C-pyruvate,and 14C-alanine was stimulated by 5 mM leucine by 8, 76, and 45% compared with the control,respectively. The stimulation of gluconeogenesis by leucine depended on the concentrations ofleucine. For example, 10 mM leucine stimulated gluconeogenesis from 14C-lactate but 2.5 mMleucine did not affect it, as shown in Table 4.
Fig. 12. Gluconeogenetic pathway ofeel liver. The box indicatesmitochondrial reactions. Reprintedfrom J. Comp. Physiol. B, 132, 1979,343–350, Gluconeogenesis in isolatedliver cells of the eel, Anguillajaponica, Hayashi and Ooshiro,Figure 3. © 1979, Springer-Verlag.With kind permission of SpringerScience+Business Media.

Studies on Eel Liver Functions Using Perfused Liver and Primary Cultured Hepatocytes 17
Aqua-BioScience Monographs VOL. 1 NO. 2 2008
Incorporation of 14C-pyruvate into glucose and amino acids in the presence or absence ofleucine (5 mM) was investigated (Table 5). The incorporation into glucose was increased1.8 fold by leucine and the incorporation into neutral, acidic, and basic amino acids was in-creased 2.6, 3.7, and 1.6 fold by leucine, respectively. Furthermore, effects of leucine on aspar-tate and glutamate concentrations and on the incorporation of 14C-pyruvate into these aminoacids were investigated. As shown in Table 6, the glutamate content increased 3.6 fold in the
Table 4. Effect of leucine on gluconeogenesis.
The initial concentration and radioactivity of substrates were as described in Table 2. The data are the means ± S.D. of threeobservations. ap < 0.01. Reprinted from J. Comp. Physiol. B, 132, 1979, 343–350, Gluconeogenesis in isolated liver cells of theeel, Anguilla japonica, Hayashi and Ooshiro, Table 2. © 1979, Springer-Verlag. With kind permission of SpringerScience+Business Media.
Table 5. Incorporation of 14C-pyruvate into glucose and amino acids in the presence or absence of leucine (Leu), tryptophan(Trp) or amino-oxyacetate (AOA).
The initial concentration and radioactivity of 14C-pyruvate were 5 mM and 9.25 kBq, respectively. The data are the means ± S.D.of three observations. Reprinted from J. Comp. Physiol. B, 132, 1979, 343–350, Gluconeogenesis in isolated liver cells of theeel, Anguilla japonica, Hayashi and Ooshiro, Table 4. © 1979, Springer-Verlag. With kind permission of Springer Science+BusinessMedia.
Table 6. Effects of leucine on aspartate and glutamate concentrations and on incorporation of 14C-pyruvate into these aminoacids.
The initial concentration and radioactivity of 14C-pyruvate were 5 mM and 9.25 kBq, respectively. The data are the means ± S.D.of three observations. ap < 0.001, bp < 0.05. Reprinted from J. Comp. Physiol. B, 132, 1979, 343–350, Gluconeogenesis inisolated liver cells of the eel, Anguilla japonica, Hayashi and Ooshiro, Table 5. © 1979, Springer-Verlag. With kind permissionof Springer Science+Business Media.
18 Studies on Eel Liver Functions Using Perfused Liver and Primary Cultured Hepatocytes
Aqua-BioScience Monographs VOL. 1 NO. 2 2008
presence of 5 mM leucine, but no change was observed in the aspartate content, while the incor-poration of 14C-pyruvate into both glutamate and aspartate was increased 5 to 6 fold by leucinesupplement. As a result, the specific radioactivity (cpm μmol–1) of 14C-aspartate was 4.3 timeshigher than that of the control. These results indicate that the increase of the turnover of aspar-tate was due to an increase of the glutamate content in the mitochondria.
Two enzyme reactions affecting the glutamate content in the mitochondria are assumed;one is a glutamate dehydrogenase (GDH) reaction and the other is a transaminase reaction, asshown in Fig. 12. Glutamate dehydrogenase in eel liver was purified from the mitochondria andthe physico-chemical properties were investigated (Hayashi et al. 1982a; Tang et al. 1992). Eelliver GDH activity is stimulated 2.5 fold to the direction of glutamate synthesis and 1.4 fold tothe deamination direction in the presence of 5 mM leucine. The stimulatory effect of leucine ongluconeogenesis seems due to activation of the GDH by leucine followed by an increase in theglutamate content in the mitochondria.
Another enzyme affecting the glutamate content by leucine in the mitochondria is leucinetransaminase. However, there is no data on leucine transaminase in eel liver mitochondria. In-vestigations into leucine transaminase need to carried out to clarify the situation.
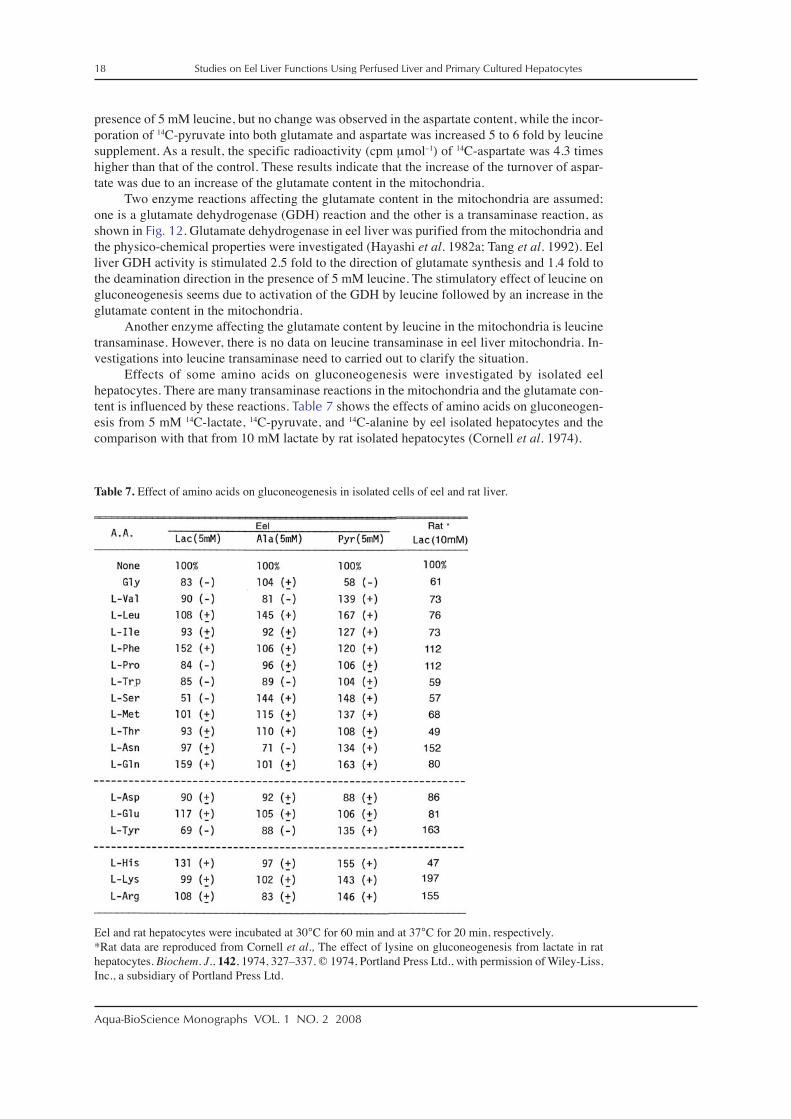
Effects of some amino acids on gluconeogenesis were investigated by isolated eelhepatocytes. There are many transaminase reactions in the mitochondria and the glutamate con-tent is influenced by these reactions. Table 7 shows the effects of amino acids on gluconeogen-esis from 5 mM 14C-lactate, 14C-pyruvate, and 14C-alanine by eel isolated hepatocytes and thecomparison with that from 10 mM lactate by rat isolated hepatocytes (Cornell et al. 1974).
Table 7. Effect of amino acids on gluconeogenesis in isolated cells of eel and rat liver.
Eel and rat hepatocytes were incubated at 30°C for 60 min and at 37°C for 20 min, respectively.*Rat data are reproduced from Cornell et al., The effect of lysine on gluconeogenesis from lactate in rathepatocytes. Biochem. J., 142, 1974, 327–337. © 1974, Portland Press Ltd., with permission of Wiley-Liss,Inc., a subsidiary of Portland Press Ltd.

Studies on Eel Liver Functions Using Perfused Liver and Primary Cultured Hepatocytes 19
Aqua-BioScience Monographs VOL. 1 NO. 2 2008
In isolated eel liver the gluconeogenesis from 14C-lactate was stimulated by glutamine,phenylalanine, and histidine, but that from 14C-pyruvate was stimulated by leucine, glutamine,histidine, serine, arginine, valine, methionine, tyrosine, and asparagine. Gluconeogenesis from14C-alanine was stimulated only by serine. On the contrary, serine and tyrosine inhibited gluco-neogenesis from 14C-lactate and only glycine inhibited that from 14C-pyruvate. However, thenumber of amino acids showing an inhibitory effect on the gluconeogenesis was less than thatshowing a stimulatory effect.
The stimulatory effects of valine, leucine, isoleucine, phenylalanine, and histidine on glu-coneogenesis from 5 mM 14C-pyruvate disappeared after the addition of 1 mM AOA in theincubation medium of isolated eel hepatocytes (Table 8). The addition of AOA in the presenceof these amino acids decreased the gluconeogenesis from 5 mM 14C-pyruvate to 46 to 55%compared to the control value obtained in the absence of both the amino acids and AOA. Theseresults strongly suggest that the amino acids stimulate the site of aspartate–oxaloacetate path-way in gluconeogenesis in the eel hepatocytes.
In isolated rat hepatocytes, lysine, tyrosine, arginine, and asparagine stimulategluconeogensis from lactate, though the incubation time of 20 min for isolated rat hepatocytes isshorter than the incubation time of 60 min for isolated eel hepatocytes (Cornell et al. 1974) andhistidine, threonine, serine, and tryptophan inhibited the gluconeogenesis in rat hepatocytes.Amino acids giving stimulatory or inhibitory effects are different between eel and rat but theexact reason of this difference is still uncertain.
3-3D. Effect of oleic acidβ-Oxidation of oleic acid produces acetyl-CoA which induces NADH production through
tricarboxylic acid cycle and an increase in the NADH/NAD+ ratio in the mitochondria (Söling etal. 1970). Acetyl-CoA is an activator of pyruvate carboxylase and the increased NADH/NAD+
ratio in the mitochondria leads to an increased NADH/NAD+ ratio in the cytosole, which affectsLDH reaction.
Gluconeogenesis from lactate (20 mM) in perfused rat livers is stimulated by 2 mM oleicacid (Söling et al. 1968, 1970; Williamson et al. 1966). Söling et al. (1968, 1970) have ex-plained that the stimulatory effect of oleic acid in rat liver occurs between pyruvate and PEP,namely oxaloacetate production is increased by the activation of pyruvate carboxylase by acetyl-CoA.
Whereas gluconeogenesis from lactate (20 mM) in perfused guinea pig livers is inhibitedby 2 mM oleic acid by about 20% compared with the control (Jomain-Baum and Hanson 1975;Tutwiler and Brentzel 1982), Söling et al. (1970) have explained why oleic acid inhibits gluco-neogenesis from lactate in guinea pig liver, where the redox state of the lactate/pyruvate system
Table 8. Gluconeogenesis from pyruvate in the presence of amino acids and AOA.
The initial concentration and radioactivity of 14C-pyruvate were 5 mM and 9.25 kBq, respectively. The dataare the means ± S.D. of three observations. ap < 0.01, bp < 0.05. Reprinted from J. Comp. Physiol. B, 132,1979, 343–350, Gluconeogenesis in isolated liver cells of the eel, Anguilla japonica, Hayashi and Ooshiro,Table 3. © 1979, Springer-Verlag. With kind permission of Springer Science+Business Media.

20 Studies on Eel Liver Functions Using Perfused Liver and Primary Cultured Hepatocytes
Aqua-BioScience Monographs VOL. 1 NO. 2 2008
is already more negative than that in rat liver and the addition of oleic acids leads to a furtherincrease of the lactate/pyruvate ratio resulting in a considerable drop in the concentration ofpyruvate. This is the most probable reason for the decreased gluconeogenesis from lactate inguinea pig livers in the presence of oleic acid, since under these conditions the rate of pyruvatecarboxylation in guinea pig liver seems to depend much more on the concentration of pyruvatethan on the level of acetyl-CoA.
In isolated eel hepatocytes, oleic acid strongly inhibited gluconeogenesis from lactate andpyruvate (Hayashi and Ooshiro 1985b). Table 9 shows the effects of oleic acid on gluconeogen-esis, protein synthesis, and the incorporation into amino acids fraction from 5 mM 14C-lactate or14C-pyruvate by isolated eel hepatocytes. Oleic acid at 0.25 and 2.50 mM inhibited gluconeo-genesis from 14C-lactate by 36 and 99%, respectively. The incorporation of 14C-lactate into aminoacids in the presence of 2.50 mM of oleic acid decreased by 40% compared with that of thecontrol, but protein synthesis from 14C-lactate was not affected by the oleic acid. Similarly, oleicacid at 0.25 and 2.50 mM inhibited gluconeogenesis from 14C-pyruvate by 37 and 94%, respec-tively. These inhibitory effects on gluconeogenesis in eel liver are quite different from the stimu-latory effect of oleic acid on gluconeogenesis in rat liver. The degree of inhibitory effects ofoleic acid in eel liver is stronger than that in guinea pig liver.
Table 10 shows the effect of oleic acid, α-ketoglutarate, and NH4Cl on the glutamatecontent as well as on gluconeogenesis from 5 mM 14C-lactate or 14C-pyruvate by the isolated eelhepatocytes. When 14C-lactate was used as a precursor, the glutamate content decreased by 29%in the presence of 2.50 mM of oleic acid. Similarly, when 14C-pyruvate was used, the glutamatecontent dereased by 24% in the presence of 2.50 mM of oleic acid (Hayashi and Ooshiro 1985b).
In the presence of 5 mM α-ketoglutarate and NH4Cl, gluconeogenesis from 5 mM 14C-lactate and 14C-pyruvate increased by 23 and 50%, respectively. But 2.5 mM oleic acid com-pletely inhibited the gluconeogenesis from both precursors in the presence of 5 mM α-ketoglu-tarate and NH4Cl (Hayashi and Ooshiro 1985b).
The effect of oleic acid on O2 consumption and 14CO2 production in isolated eel hepatocytesin the presence of 5 mM 14C-lactate was investigated using a Warburg manometer. As shown inFig. 13, 2.5 mM oleic acid slightly increased the O2 consumption and 14CO2 production (Hayashiand Ooshiro 1985b). These results show that the utilization of 14C-lactate slightly increased asan energy source. Because gluconeogenesis from 5 mM 14C-lactate was inhibited almost com-pletely by 2.5 mM oleic acid, the metabolic flow of lactate to the tricarboxylic acid cycle andelectron transport chain seems to increase.
Table 9. Effects of oleic acid on gluconeogenesis, protein synthesis, and the incorporation into amino acids fraction from14C-lactate and 14C-pyruvate by isolated eel liver cells.
The initial concentration and radioactivity of substrates were 5 mM and 9.25 kBq, respectively. The data are the means ± S.D. ofthree observations. *p < 0.01, **p < 0.05. Reprinted with permission from Nippon Suisan Gakkaishi, 51, Hayashi and Ooshiro,Effect of oleic acid on gluconeogenesis in isolated liver cells of eel, 447–452, 1985, the Japanese Society of Fisheries Science.

Studies on Eel Liver Functions Using Perfused Liver and Primary Cultured Hepatocytes 21
Aqua-BioScience Monographs VOL. 1 NO. 2 2008
Fig. 13. Effects of oleic acid on O2 consumption and 14CO2 production. The initial concentration and radioactivity of 14C-lactatewere 5 mM and 9.25 kBq, respectively. The wet weight of cells used was 136.81 ± 0.01 mg. The data are the means ± S.D. ofthree observations. Reprinted with permission from Nippon Suisan Gakkaishi, 51, Hayashi and Ooshiro, Effect of oleic acid ongluconeogenesis in isolated liver cells of eel, 447–452, 1985, the Japanese Society of Fisheries Science.
Table 10. Effects of oleic acid, α-ketoglutarate (α-KG), and NH4Cl on glutamate content and gluconeogenesis.
The initial concentration and radioactivity of substrates were 5 mM and 9.25 kBq, respectively. The data are the means ± S.D. ofthree observations. *p < 0.01, **p < 0.05, ***p < 0.2. Reprinted with permission from Nippon Suisan Gakkaishi, 51, Hayashiand Ooshiro, Effect of oleic acid on gluconeogenesis in isolated liver cells of eel, 447–452, 1985, the Japanese Society ofFisheries Science.

22 Studies on Eel Liver Functions Using Perfused Liver and Primary Cultured Hepatocytes
Aqua-BioScience Monographs VOL. 1 NO. 2 2008
The site of the inhibitory effect of oleic acid in isolated eel hepatocytes is not a pyruvatecarboxylase reaction. Because acetyl-CoA derived from the oxidation of oleic acid in the mito-chondria is an activator of pyruvate carboxylase, oxaloacetate production by pyruvate carboxy-lase increases and then gluconeogenesis is stimulated. However, oleic acid strongly inhibitedgluconeogenesis in eel liver. The reaction site of the inhibitory effect of oleic acid seems a morelater reaction than the pyruvate carboxylase reaction. As shown in Fig. 12, the aspartate–oxaloacetate pathway is the main pathway of gluconeogenesis in eel liver and the glutamateconcentration affects the glutamate-oxaloacetate transaminase reaction. Glutamate is formed byglutamate dehydrogenase (GDH), and GDH and glutamate-oxaloacetate transamiase are inti-mately connected. The activity of GDH purified from eel liver mitochondria was completelyinhibited by 10 μM of oleic acid or oleoyl-CoA (Hayashi and Ooshiro 1985b). Palmitic acid andcaproic acid at 10 μM also inhibited eel GDH by 85 and 20%, respectively.
The effect of leucine on gluconeogenesis was described in the previous section and it isknown that it plays an important role as the activator of eel liver GDH. In contrast to leucine,oleic acid plays the role of the inhibitor of GDH. Both leucine and oleic acid affect GDH activitywhich in turn affects the glutamate concentration in the mitochondria followed by the regulationof gluconeogenesis.
3-4. Comparison of PEP synthesis pathways between eel, rat, and pigeon liver
Figures 14A, B and C show PEP synthesis pathways of eel, rat, and pigeon liver, respec-tively. The pathways within the boxes show the mitochondrial pathways which have been char-acterized by the subcellular distribution of enzymes such as pyruvate carboxylase, glutamate-oxaloacetate transaminase, and PEP carboxykinase, by the effects of enzyme inhibitors on glu-coneogenesis, and by the effects of leucine and oleic acid on gluconeogenesis.
Table 11 compares the subcellular distribution of pyruvate carboxylase and PEPcarboxykinase in rat, eel and pigeon liver. Pyruvate carboxylase from all three animals waslocalized in the mitochondria (Gevers 1967; Bötttger et al. 1969; Hayashi and Ooshiro 1979).However, PEP carboxykinase of rat, eel, and pigeon liver is localized in the cytosole (Nordieand Lardy 1963), in both the cytosole and the mitochondria (Hayashi and Ooshiro 1979), and inthe mitochondria (Gevers 1967), respectively.
Fig. 14. Comparison of PEP synthesis pathways between eel (A), rat (B), and pigeon (C) livers. The pathways within squaresshow the mitochondrial pathways. (A) is reprinted from J. Comp. Physiol. B, 132, 1979, 343–350, Gluconeogenesis inisolated liver cells of the eel, Anguilla japonica, Hayashi and Ooshiro, Figure 3. © 1979, Springer-Verlag. With kind permissionof Springer Science+Business Media. (B) is reproduced from Lardy et al., Paths of carbon in gluconeogenesis and lipogenesis:The role of mitochondria in supplying precursors of phosphoenolpyruvate. Proc. Natl. Acad. Sci. USA, 53, 1965; 1410–1415.© 1965, The National Academy of Sciences with kind permission of Prof. Henry Lardy and Prof. Verner Paetkau.

Studies on Eel Liver Functions Using Perfused Liver and Primary Cultured Hepatocytes 23
Aqua-BioScience Monographs VOL. 1 NO. 2 2008
In rat liver, oxaloacetate formed by pyruvate carboxylase in the mitochondria must betransported to the cytosole to synthesize PEP by cytosolic PEP carboxykinase. Oxaloacetate isimpermeable to the mitochondrial membrane and then the malate–oxaloacetate pathway or as-partate–oxaloacetate pathway is used to transport the mitochondrial oxaloacetate to the cytosolein rat liver. Another characteristic point in the PEP synthesis pathway in rat liver is that there aretwo PEP synthesis pathways. When pyruvate is used for the gluconeogenesis in rat liver, themalate–oxaloacetate pathway is used for the PEP synthesis pathway. While lactate is used forthe gluconeogenesis, the aspartate–oxaloacetate pathway is used for the PEP synthesis pathway,as described in Section 3-1.
In the eel liver, the remarkable characteristic for the PEP synthesis pathway is absencefrom the malate–oxaloacetate pathway in gluconeogenesis from pyruvate. This is mainly due tothe heart type of LDH. As shown in Fig. 6A, most pyruvate was used to synthesize glucose, andlactate is not formed by LDH. Contrasting with eel perfused liver, rat perfused liver convertsabout half the amount of consumed pyruvate to lactate (Fig. 6B) in association with the con-sumption of equivalent of cytosolic NADH. Therefore, if the cytosolic NADH/NAD+ ratio issimilar in rat and eel liver, the supply of cytosolic NADH is not required for gluconeogenesisfrom pyruvate in eel liver. However, the redox state in eel hepatocytes still remains to be inves-tigated.
In pigeon liver, PEP carboxykinase is localized in the mitochondria. Oxaloacetate is con-verted to PEP in the mitochondrial PEP carboxykinase and PEP is transported to the cytosole forgluconeogenesis. This PEP synthesis pathway is the simplest of the three species (Fig. 14C).
3-5. Glycogen metabolisms in eel liver
The reason why eel liver glycogen is retained in spite of a long period of starvation (Larssonand Lewander 1973; Dave et al. 1975) is uncertain. The ability of glycogen synthesis from 10 mMpyruvate or lactate was determined by using cultured eel hepatocyetes. After eel hepatocyteswere cultured in WE–5% FBS–0.16 μM insulin on dishes precoated with fibronectin for 7 to10 days, the hepatocytes were washed with glucose-free MEM medium containing 0.5% BSAand cultured in the same medium at least for 4 h. Then the hepatocytes were incubated in glu-cose-free MEM medium–0.5% BSA with or without 10 mM pyruvate or lactate. After incuba-tion the medium was removed and the cells were homogenized in HClO4. The supernatant of thehomogenate after centrifugation was neutralized with KHCO3 and after centrifugation the neu-tralized supernatant was used for the determination of glycogen which was digested byglucoamylase (Keppler and Decker 1984) and the glucose formed was determined by an enzymaticmethod (Kunst et al. 1984).
The glycogen synthesis from 5 mM 14C-pyruvate or 14C-glucose was also determined byusing cultured eel hepatocytes which were cultured in WE–5% FBS–0.16 μM insulin for 7 to10 days. Then the hepatocytes were washed with serum- and insulin-free WE medium and incu-bated in the same medium in the presence of 5 mM 14C-pyruvate or 14C-glucose. The cells werethen homogenized in HClO4. After centrifugation glycogen in the supernatant of the homoge-nate was precipitated with ethanol and then washed with ethanol. After washing, the glycogenwas dissolved in water and the radioactivity was determined.
Animal Pyruvate Carboxylase PEP Carboxykinase
Cyt. Mt. Cyt. Mt.
Eel – +++ ++ +Rat – +++ +++ –Pigeon – +++ – +++
Table 11. Comparison of subcellular distribution of pyruvate carboxylase and PEP carboxykinase amongeel, rat, and pigeon livers.

24 Studies on Eel Liver Functions Using Perfused Liver and Primary Cultured Hepatocytes
Aqua-BioScience Monographs VOL. 1 NO. 2 2008
As shown in Fig. 11, glycongen synthesis from 10 mM pyruvate was observed in eelhepatocytes cultured in glucose-free MEM medium. The rates of glycogen synthesis from 10 mMpyruvate and lactate were 0.407 ± 0.127 (n = 4) and 0.163 (n = 2) μmol-glucose (mg-cell pro-tein)–1 h–1 in the absence of glucose, respectively. If the protein content of the cultured eelhepatocytes is hypothesized to be 20%, the rates of glycogen synthesis from 10 mM pyruvateand lactate are calculated as 81 and 33 μmol-glucose (g-cell)–1 h–1, respectively. It was foundthat the rates of glycogen synthesis from pyruvate and lactate were 3.9 and 5 times higher thanthe rates of glucose synthesis from pyruvate and lactate because gluconeogenesis from 10 mMpyruvate and lactate by cultured eel hepatocytes was 21 and 6.4 μmol-glucose (g-cell)–1 h–1,respectively.
The effects of glucagon and insuilin on balancing blood glucose are well known in mam-malian livers (Darnell et al. 1990). Glucagon stimulates glycogen degradation and gluconeo-genesis, whereas insulin stimulates glycogen synthesis and inhibits gluconeogenesis. We inves-tigated the effect of glucagon or insulin on glycogen metabolism and gluconeogenesis by usingcultured eel hepatocytes.
The eel hepatocytes were cultured in the defined serum-free WE medium, as shown inTable 1B, for 7 to 9 days and then washed with glucose-free MEM–0.5% BSA. The cells wereincubated in glucose-free MEM–0.5% BSA for 4 h. After that the cells were again washed withglucose-free MEM–0.5% BSA and inbubated for 1 h in the same medium in the presence of10 mM pyruvate or lactate with or without different concentrations of glucagon.
In the presence of 10 mM pyruvate without glucagon, glycogen was synthesized at the rateof 0.560 μmol-glucose (mg-cell protein)–1 h–1. However, glycogen was still synthesized from10 mM pyruvate in the presence of 10–6 and 10–7 M glucagon at the rates of 0.313 and 0.286 μmol-glucose (mg-cell protein)–1 h–1, respectively (Fig. 15), although glucagon at 10–6 and 10–7 Mrepressed glycogen synthesis compared with glycogen synthesis without glucagon. Glucagon at10–6 and 10–7 M did not stimulate glycogen degradation to glucose in the presence of 10 mM
Fig. 15. Effect of glucagon on the glycogen metabolism in the presence of 10 mM pyruvate or 10 mM lactate.

Studies on Eel Liver Functions Using Perfused Liver and Primary Cultured Hepatocytes 25
Aqua-BioScience Monographs VOL. 1 NO. 2 2008
pyruvate. When 10 mM pyruvate was used, the glucose appeared in the medium which waspossibly due to gluconeogenesis from 10 mM pyruvate, because the glycogen content in the eelhepatocytes was always higher than that in the eel hepatcytes at 0 min incubation, as shown inFig. 15.
Whereas the glycogen content in the eel hepatocytes incubated with 10 mM lactate wasdecreased by 10–6 or 10–7 M glucagons, below the glycogen content in the eel hepatocytes beforeincubation (Fig. 15). These results show that glucagon at 10–6 and 10–7 M stimulated glycogendegradation. Therefore, the glucose appeared in the medium in the presence of 10–6 and 10–7 Mglucagon seemed due to glycogen degradation to glucose.
When eel hepatocytes were cultured in a serum- and insulin-free WE medium, which con-tains 11 mM glucose, glucagon at 2.5 × 10⁻⁷ M stimulated not only gluconeogenesis from 5 mM14C-pyruvate but also glycogen synthesis from 5 mM 14C-pyruvate (Fig. 16). These results wereobtained from the incorporation of 5 mM 14C-pyruvate into glycogen or glucose. In the presenceof 11 mM glucose in a WE medium, glycogen synthesis and gluconeogenesis from 5 mM14C-pyruvate were stimulated by 2.5 × 10⁻⁷ M glucagon 2.5- and 37-fold compared with those inthe absence of glucagon, respectively (Hayashi and Ooshiro 1985d). Ui and Tokumitsu (1979)reported that glucose inhibits glycogen phosphorylase and activates glycogen synthetase.
Fig. 16. Effects of insulin (I), 0.25 μM, and glucagon (G), 0.25 μM, on the incorporation of 14C-precursor into glucose, glycogen,and proteins in cultured eel hepatocytes. Control cells were cultured in Williams’ E medium with 10% NU-serum (Flow Laboratory)for 6 days. After 6 days, the hepatocytes were washed with a serum-free medium and the cells were incubated in the serum-freemedium with a 14C-precursor at 30°C for 4 h. The incorporation of 5 mM 14C-pyruvate (9.25 kBq) into the intracellular protein,extracellular protein, glucose, and glycogen in the control cells were 36,200, 4,600, 735, and 563 dpm (mg-protein)–1, respectively.The incorporation of 5 mM 14C-glucose (9.25 kBq) into the intracellular protein, extracellular protein, and glycogen in thecontrol cells were 4,930, 690, and 2,250 dpm (mg-protein)–1, respectively. The incorporation of 5 mM 14C-leucine (9.25 kBq)into the intra- and extra-cellular proteins in the control cells were 23,160 and 4,740 dpm (mg-protein)–1, respectively. Percentagesshow the ratio of the dpm (mg-protein)–1 obtained in the presence of insulin or glucagon or both to the dpm (mg-protein)–1
obtained in the absence of insulin and glucagons. Reprinted with permission from Nippon Suisan Gakkaishi, 51, Hayashi andOoshiro, Effects of glucagon, insurin, and the eel serum in the eel liver cells in primary culture, 1123–1127, 1985, the JapaneseSociety of Fisheries Science.

26 Studies on Eel Liver Functions Using Perfused Liver and Primary Cultured Hepatocytes
Aqua-BioScience Monographs VOL. 1 NO. 2 2008
Glucose in WE medium seems to inhibit glycogen phosphorylase and to activate glycogen syn-thetase in the cultured eel hepatocytes.
In contrast to glucagon, insulin at 2.5 × 10⁻⁷ M inhibited gluconeogenesis from 5 mM14C-pyruvate by 33% and slightly stimulated glycogen syntheisis by 18% compared with thoseof the control. However, in the presence of both glucagon and insulin at 2.5 × 10⁻⁷ M, gluconeo-genesis and glycogen synthesis from 5 mM 14C-pyruvate were stimulated 35- and 10-fold com-pared with those of the control, respectively (Fig. 16) (Hayashi and Ooshiro 1985d). In thepresence of insulin alone, glycogen synthesis from 5 mM 14C-pyruvate was slightly stimulatedby 18% compared with the control. In the presence of glucagon alone, glycogen synthesis wasstimulated 2.5-fold, as described above.
Glycogen synthesis from 5 mM 14C-glucose was stimulated by 2.5 × 10⁻⁷ M insulin 2.3-fold and inhibited by 2.5 × 10⁻⁷ M glucagon by 78% as shown in Fig. 16. In the presence of bothglucagon and insulin at 2.5 × 10⁻⁷ M, glycogen synthesis from 5 mM 14C-glucose was inhibitedby 66%.
Intracellular- and extracellular-protein synthesis from 5 mM 14C-leucine was stimulatedby 2.5 × 10⁻⁷ M insulin by 73 and 52% compared with those of the control, respectively, and alsostimulated by 2.5 × 10⁻⁷ M glucagon by 63 and 31% compared with those of the control, respec-tively.
The effects of eel serum on glycogen synthesis and gluconeogenesis were investigated byusing cultured eel hepatocytes. After the eel hepatocytes were cultured in WE medium contain-ing 5% eel serum (final protein concentration of 1.35 mg mL–1) instead of NU serum (finalprotein concentration of 1.36 mg mL–1, artificial serum equivalent to FBS) for 4 days, thehepatocytes were washed with a serum- and insulin-free WE medium and incubated in the samemedium for 4 h in the presence of 5 mM 14C-pyruvate. As shown in Fig. 17, gluconeogenesis andglycogen synthesis by eel hepatocytes cultured in eel serum increased 39-fold and 8-fold higherthan those by the control hepatocytes cultured in NU serum, respectively (Hayashi and Ooshiro1985d).
Fig. 17. Effects of eel serum and eelserum with insulin (1.6 μM) on theincorporation of 5 mM 14C-pyruvate(9.25 kBq) into the glucose, glycogen,and proteins in cultured eel hepatocytes.Reprinted with permission from NipponSuisan Gakkaishi, 51, Hayashi andOoshiro, Effects of glucagon, insurin,and the eel serum in the eel liver cells inprimary culture, 1123–1127, 1985, theJapanese Society of Fisheries Science.

Studies on Eel Liver Functions Using Perfused Liver and Primary Cultured Hepatocytes 27
Aqua-BioScience Monographs VOL. 1 NO. 2 2008
The stimulatory effects of eel serum on glycogen synthesis and gluconeogenesis from5 mM 14C-pyruvate, resembled the stimulatory effects of glucagon, as shown in Fig. 16, but thesubstance giving stimulatory effects in eel serum is uncertain. During 4 days’ culture in a WEmedium containing 5% eel serum, the substance seemed to affect glycogen synthesis and gluco-neogenesis in the cultured eel hepatocytes and to maintain the stimulatory effects during 4 hincubation in a serum-free WE medium. Glucose concentrations of eel serum and NU serum inthe culture medium are almost the same, about 0.61 mM, and so stimulatory effects by eel serumare not due to glucose. The stimulatory effects of eel serum on glycogen synthesis and gluco-neogenesis from 5 mM 14C-pyruvate disappeared after the addition of 1.6 × 10⁻⁶ M insulin(Fig. 17).
4. Lipoprotein metabolisms in eel liver
4-1. Characteristics of fish serum lipoproteins
Babin and Vernier (1989) reviewed fish serum lipoproteins that, except for Chondrichthyessuch as skates and shark, Agnatha such as lamprey and Teleostei such as carp and rainbow troutare classified as hyperlipidemic and hypercholesterolemic compared with human serum. Forexample, concentrations of cholesterol and triglyceride of eel serum are 476 and 749 mg dL–1,respectively, whereas concentrations are 180 and 100 mg dL–1 in human serum, respectively(Hayashi 1999). Total lipid concentrations of eel and human serum are 2,100 and 480 mg dL–1,respectively. On the other hand, protein concentrations of eel and human serum are 4,000 to5,000 and 8,000 mg dL–1, respectively. In fish, most serum lipids are associated with lipoproteins.Therefore, lipoproteins are the main component of eel serum proteins, whereas albumin is themain component in human serum protein. In general, fish serum contains more lipoproteins thanhuman serum. This leads to a hyperapolipoproteinemia in fish and the plasma concentration ofapolipoproteins accounts for about 36% of plasma proteins in rainbow trout (Babin 1987) and30% in channel catfish (McKay et al. 1985). However, in human serum it is lower than 10%.
In fish lipoproteins, high-density lipoprotein (HDL) is the main lipoprotein although verylow-density lipoprotein (VLDL) and low-density lipoprotein (LDL) are also present. In humanserum LDL is a main lipoprotein. Protein concentrations of HDL in eel and human serum are770 mg dL–1 and 170 to 190 mg dL–1, respectively (Hayashi 1999). Fish VLDL and LDL containapoB48-like proteins as human VLDL and LDL and fish HDL contains apoA-like proteins.However, fish VLDL and LDL lack apoB100-like proteins and contain apoA-like proteins aswell as in HDL. Contrary to fish VLDL and LDL, human VLDL and LDL contain apoB100 butdo not contain apoA.
Why the amounts of fish lipoproteins are so high is still unclear and the role of thelipoproteins is also unclear, particularly the role of HDL is an interesting problem, but why sucha high concentration of HDL is necessary is unresolved.
On the other hand, the role and function of vitellogenin is clear. Female fish serum duringmaturation for spawning contains vitellogenin as do other oviparous animals. Vitellogenin is aprecursor of egg yolk and classified as very high-density lipoprotein (VHDL). It is induced andsynthesized in liver by 17β-estradiol, circulated through blood, and incorporated into oocyte bya specific receptor in the oocyte plasma membrane. The lipid content of VHDL is about 20%and the main lipid component is phospholipids.
4-2. Lipoproteins secreted by primary cultured eel hepatocytes
We determined the lipoprotein secreted by cultured eel hepatocytes, isolated the lipopro-tein, and the secreted lipoprotein was defined as VLDL-like lipoprotein. The secreted lipopro-tein was determined as described below.
Hepatocytes of 1.5 × 10⁷ cells were cultured on a 10-cm plastic dish in WE medium con-taining 5% FBS and 0.16 μM insulin for 6 days. After the hepatocytes were incubated with14C-leucine in WE medium without serum and insulin for the indicated period, a medium (7 mL)

28 Studies on Eel Liver Functions Using Perfused Liver and Primary Cultured Hepatocytes
Aqua-BioScience Monographs VOL. 1 NO. 2 2008
and PBS (3 mL), used to wash cells, were combined and the combined medium was applied to aSephadex G-25 column (1.6 × 15 cm). The protein fraction was pooled as extracellular proteinand lyophilized. The lyophilized protein was dissolved in 50 μL of sample buffer for SDS-PAGE and used for the measurement of radioactivity and autoradiography.
The intracellular protein was recovered as follows. Three milliliters of 0.1 N NaOH wasadded to the cells on a dish, and the dissolved cells were transferred to a test tube. Then proteinsin the test tube were precipitated with 5% trichloroacetic acid. The resulting precipitate wasdissolved in 2 mL of 0.1 N NaOH, and the solution was used for the measurement of radioactiv-ity and to assay the proteins as an intracellular protein.
The time course of the syntheses of intra- and extra-cellular proteins is shown in Fig. 18.Syntheses of intra- and extra-cellular proteins from 2 to 32 h were increased over 32 h, and thesynthesis of intracellular protein was higher at any time than that of the extracellular protein(Fig. 18A). A fluorogram of extracellular protein shows that after 16 h incubation almost allproteins corresponding to eel serum proteins were observed (Fig. 18B).
The lipoprotein secreted by cultured eel hepatocytes was also isolated by density gradientultracentrifugation, as described below.
After hepatocytes of 1.5 × 10⁷ cells on a 10 cm plastic dish were cultured in WE mediumcontaining 5% FBS and 0.16 μM insulin for 5 to 7 days. The hepatocytes were washed threetimes with a serum- and insulin-free WE medium and 7 mL of the serum- and insulin-free me-dium and 14C-leucine was added to the cells. Then hepatocytes were incubated at 28°C for 24 h.After incubation, the medium was recovered as decribed above. The medium and the PBS usedto wash the cells were combined. The medium pooled from 6 to 10 dishes was centrifuged at3,000 rpm for 5 min to remove cell and cell debris, and the supernatant was applied to a Sephadex
Fig. 18. Time course of the synthesis of intra- and extra-cellular protein by hepatocytes cultured for 6 days. After hepatocyteswere incubated with 14C-leucine (56 kBq) in Williams’ E medium without serum and insulin for the indicated period, themedium was recovered and applied to a Sephadex G-25 column. The protein fraction was pooled as extracellular protein andlyophilized. Lyophilized protein was dissolved in 50 μL of the sample buffer for SDS-PAGE and used for measurement ofradioactivity (20 μL) and for autoradiography (15 μL). Intracellular protein was prepared as described in the text and in Yu etal. (1991). (A) Incorporation of 14C-leucine into intra- and extra-cellular protein. �, intracellular protein; �, extracellularprotein. (B) Fluorogram of extracellular protein. Samples were loaded on a 14.5% polyacrylamide gel. Fifty micrograms ofeel serum protein as the control was loaded on a 15.5% polyacrylamide gel and the proteins were stained with CoomassieBrilliant Blue R-250. Reprinted with permission from Cell Struct. Funct., 16, Yu et al. Characterization of lopoprotein secretedby cultural eel hepatocytes and its comparison with serum lipoproteins, 347–355, 1991, the Japan Society for Cell Biology.

Studies on Eel Liver Functions Using Perfused Liver and Primary Cultured Hepatocytes 29
Aqua-BioScience Monographs VOL. 1 NO. 2 2008
G-25 column (5 × 18.6 cm) equilibrated with PBS. The protein fraction was pooled and concen-trated with a membrane of YM10 (Amicon).
The lipoprotein was fractionated by density gradient ultracentrifugation (Chung et al. 1980).An equal amount of 0.75% NaCl was gently laid over 19 mL of the sample containing 7.6 g ofKBr, and centrifuged at 35,000 rpm (150,000 × g) for 14 h at 15°C in a 410-rotor using anInternational B/60 model ultracentrifuge (DAMON/IBC). After centrifugation, 40 fractions werecollected from the bottom of the tube by a peristaltic pump and a fraction collector (Pharmacia).
Proteins secreted by cultured hepatocytes were fractionated by density gradient ultracen-trifugation, as shown in Fig. 19A. The radioactivity of proteins labeled with 14C-leucine and theproteins determined by the colorimetric method were observed at densities above 1.21 g mL–1
and below 1.063 g mL–1. The fractions with densities below 1.063 g mL–1 appeared to havetriglycerides, which were determined by the enzymatic method (Determiner TG-S555, KyowaMedix), as the main lipid component (Fig. 19A(2)).
Fig. 19. Fractionation of secreted and serum lipoproteins by density gradient ultracentrifugation. After hepatocytes culturedon a 10-dm dish were incubated with 14C-leucine (37 kBq/dish) for 24 h, the medium pooled from 10 dishes was centrifugedand applied to a Sephadex G-25 column (5 × 18.6 cm). Then the protein was fractionated by density gradient ultracentrifugation.Eel serum was fractionated in the same way. (A) Fractionation of secreted lipoprotein: 1, Distribution of protein (�) andradioactivity (×); 2, Distribution of lipid. (B) Fractionation of serum lipoproteins: 1, Distribution of protein (�); 2, Distributionof lipid (�, triglyceride; �, phospholipids; �, cholesteryl ester; �, free cholestero). Reprinted from Cell Struct. Funct., 16,Yu et al. Characterization of lopoprotein secreted by cultural eel hepatocytes and its comparison with serum lipoproteins,347–355, 1991, with permission from the Japan Society for Cell Biology.

30 Studies on Eel Liver Functions Using Perfused Liver and Primary Cultured Hepatocytes
Aqua-BioScience Monographs VOL. 1 NO. 2 2008
On the other hand, eel serum proteins fractionated in the same manner as secreted proteinswere observed at densities above 1.21 g mL–1, between 1.08 and 1.17 g mL–1, and below 1.063 gmL–1 (Fig. 19B(1)). Fractions with densities between 1.08 and 1.17 g mL–1 had phospholipidsand cholesterol as the main lipid components (Fig. 19B(2)). Phospoholipid, total cholesterol,and free cholesterol were determined by enzymatic methods of Determiner PL, Determiner TC555,and Determiner FC555 (Kyowa Medix), respectively. As shown in Table 12, the fraction(1.08 < d < 1.17 g mL–1) was found to resemble a typical HDL found in human and rat serum inrespect of protein and lipid compostions. Furthermore, the fraction contained two mainapolipoproteins corresponding to apoAI and AII of mammalian HDL. This fraction was definedas HDL. The lipoprotein with densities below 1.063 g mL–1 had triglycerides as the main lipidcomponent. The protein content was 6.2% and this lipoprotein had apolipoproteins correspond-ing to apoB48. These results show that this lipoprotein is VLDL.
However, secreted proteins contained no lipoprotein corresponding to serum HDL, as shownin Fig. 19A. Recent research on HDL formation suggests that HDL is formed from serum freeapoAI and AII and an intracellular free cholesterol mediated ATP-binding cassett transporter I(ABCAI) in plasma membranes (Tsujita et al. 2005; Brunham et al. 2006). Actually, free apoAIand AII in the secreted proteins were detected in the fraction with a density above 1.21 g mL–1 byantibodies against the apoAI and AII purified from eel serum HDL (Katoh et al. 2000). Further-more, although the secreted lipoprotein is a VLDL-like lipoprotein, apoAI and AII of the se-creted lipoprotein are easily transferred to liposome particles by incubation with the secretedlipoprotein and liposomes (Yu et al. 1992).
When the secreted lipoprotein with densities below 1.063 g mL–1 was compared with eelserum VLDL, 12% of protein and 69% of triglycerides contents of the secreted lipoprotein werehigher than those of eel serum VLDL (Table 12). The total cholesterol (4%) and phospholipid(15%) content of the secreted lipoprotein were lower. Apolipoproteins of the secreted lipopro-tein consisted of apoA and B48 as the main components (Fig. 20A). Molecular weights of thesecreted apolipoproteins are as follows: proteins corresponding to apoB48 are 290,000, 265,000,245,000, and 220,000, and proteins corresponding to apoAI and AII are 28,000 and 14,000,respectively. These apolipoproteins were found in eel serum VLDL (Fig. 20B).
VLDL-like lipoprotein was secreted at the rate of 10.9 ± 4.34 μg protein (mg-cell protein)–1
(24 h)–1 (n = 6). It has been reported that in rat hepatocytes VLDL is secreted at the rate of 0.28 μg-protein (mg-cell protein)–1 (24 h)–1 (Bell-Quint and Forte 1981). This value was much lower thanthat of eel hepatocytes.
Table 12. Composition of VLDL-like lipoprotein secreted by eel hepatocytes, serum VLDL, and HDL. VLDL-like lipoproteinwas pooled from fractions 37 to 40 shown in Fig. 19A.
The values of VLDL-like lipoprotein, VLDL, and HDL are the means ± S.D. for 5, 4, and 4 experiments, respectively. FC, freecholesterol; CE, cholesteryl ester; TG, triglyceride; PL, phospholipids. Reprinted with permission from Cell Struct. Funct., 16,Yu et al. Characterization of lopoprotein secreted by cultural eel hepatocytes and its comparison with serum lipoproteins, 347–355, 1991, the Japan Society for Cell Biology.

Studies on Eel Liver Functions Using Perfused Liver and Primary Cultured Hepatocytes 31
Aqua-BioScience Monographs VOL. 1 NO. 2 2008
4-3. Effects of maturation on eel lipoprotein metabolism
4-3A. Comparison of body length, body weight, gonad-somatic index, and plasma thyrox-ine between silver and yellow eels
Yellow eels are immature and grow in rivers. Silver eels migrate to the sea from the riverfor spawning. We captured silver and yellow eels in the Sendai River in Kagoshima, Japan anddetermined the body length, body weight, GSI [=(gonad weight/body weight) × 100], and con-centrations of the plasma thyroxine. As shown in Table 13, body lengths and weights of silvereels were significantly higher than those of yellow eels. The GSI of silver eels was also signifi-cantly higher than that of yellow eels. We determined total thyroxine concentrations by enzymeimmunoassay (ICN Pharmaceutical) in the plasma of silver and yellow eels. The former was10.9 ± 8.2 μg dL–1 (1.40 × 10⁻⁷ M, n = 20) and the latter was 3.0 ± 4.3 μg dL–1 (3.86 × 10⁻⁸ M,n = 20). The thyroxine concentration of silver eels was significantly higher than that of yelloweels. The high concentration of plasma thyroxine of silver eels strongly suggests a correlationbetween the migration of eels for spawning and thyroxine. Namely, when eels migrate to the seafor spawning as silver eels, the thyroxine concentration in their plasma increases.
4-3B. Comparison of plasma lipoproteins between silver and yellow eelsPlasma lipoproteins of silver and yellow eels were separated by density gradient ultracen-
trifugation. The VLDL of silver eels has two remarkable characteristics. The first is the highratio of protein (apolipoproteins). The protein composition of silver eel VLDL was 17% and thevalue of yellow eel VLDL was 6%. The second is the low composition of triglycerides, and thevalue in silver eels was 40%, whereas the value of yellow eels was 53%. However, phospholipidscompotion of silver eel (30%) was slightly higher than that of yellow (26%).
Fig. 20. SDS-PAGE of secreted and serumproteins. Gradient gel of 5 to 17.5% was used.Samples for SDS-PAGE were taken from eachfraction, as shown in Fig. 19, and 15 μL of eachfraction was loaded on to the gel. (A) Fluorogramof secreted proteins fractionated as shown inFig . 19A; (B) Serum proteins which werefractionated as shown in Fig. 19B, stained withCoomassie Brilliant Blue R-250. Reprinted withpermission from Cell Struct. Funct., 16, Yu et al.Characterization of lopoprotein secreted bycultural eel hepatocytes and its comparison withserum lipoproteins, 347–355, 1991, the JapanSociety for Cell Biology.
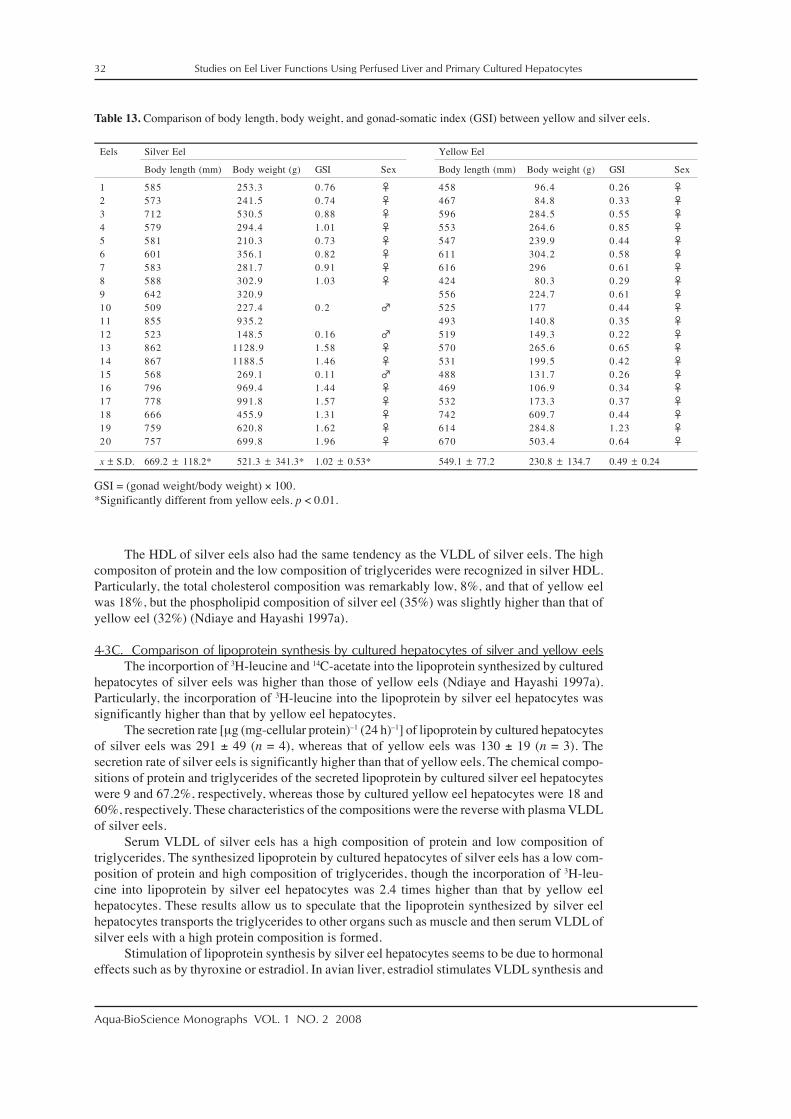
32 Studies on Eel Liver Functions Using Perfused Liver and Primary Cultured Hepatocytes
Aqua-BioScience Monographs VOL. 1 NO. 2 2008
The HDL of silver eels also had the same tendency as the VLDL of silver eels. The highcompositon of protein and the low composition of triglycerides were recognized in silver HDL.Particularly, the total cholesterol composition was remarkably low, 8%, and that of yellow eelwas 18%, but the phospholipid composition of silver eel (35%) was slightly higher than that ofyellow eel (32%) (Ndiaye and Hayashi 1997a).
4-3C. Comparison of lipoprotein synthesis by cultured hepatocytes of silver and yellow eelsThe incorportion of 3H-leucine and 14C-acetate into the lipoprotein synthesized by cultured
hepatocytes of silver eels was higher than those of yellow eels (Ndiaye and Hayashi 1997a).Particularly, the incorporation of 3H-leucine into the lipoprotein by silver eel hepatocytes wassignificantly higher than that by yellow eel hepatocytes.
The secretion rate [μg (mg-cellular protein)–1 (24 h)–1] of lipoprotein by cultured hepatocytesof silver eels was 291 ± 49 (n = 4), whereas that of yellow eels was 130 ± 19 (n = 3). Thesecretion rate of silver eels is significantly higher than that of yellow eels. The chemical compo-sitions of protein and triglycerides of the secreted lipoprotein by cultured silver eel hepatocyteswere 9 and 67.2%, respectively, whereas those by cultured yellow eel hepatocytes were 18 and60%, respectively. These characteristics of the compositions were the reverse with plasma VLDLof silver eels.
Serum VLDL of silver eels has a high composition of protein and low composition oftriglycerides. The synthesized lipoprotein by cultured hepatocytes of silver eels has a low com-position of protein and high composition of triglycerides, though the incorporation of 3H-leu-cine into lipoprotein by silver eel hepatocytes was 2.4 times higher than that by yellow eelhepatocytes. These results allow us to speculate that the lipoprotein synthesized by silver eelhepatocytes transports the triglycerides to other organs such as muscle and then serum VLDL ofsilver eels with a high protein composition is formed.
Stimulation of lipoprotein synthesis by silver eel hepatocytes seems to be due to hormonaleffects such as by thyroxine or estradiol. In avian liver, estradiol stimulates VLDL synthesis and
Table 13. Comparison of body length, body weight, and gonad-somatic index (GSI) between yellow and silver eels.
GSI = (gonad weight/body weight) × 100.*Significantly different from yellow eels. p < 0.01.

Studies on Eel Liver Functions Using Perfused Liver and Primary Cultured Hepatocytes 33
Aqua-BioScience Monographs VOL. 1 NO. 2 2008
secretion (Tarlow et al. 1977; Lin et al. 1986). Thyroxine stimulates lipid synthesis in culturedrat hepatocytes (Blennemann et al. 1995).
4-3D. Effect of thyroxine on lipoprotein synthesis by cultured eel hepatocytesHepatocytes were prepared from aquacultured immature eels and cultured in a WE me-
dium containing 5% FBS and 0.16 μM insulin. Addition of 10–8 M thyroxine (T4) in the WEmedium stimulated lipid synthesis by hepatocytes. Thyroxine (10–8 M) increased the amount ofintracellular free cholesterol, phospolipid, and triglyceride, and the sum of these lipids was510 μg (mg-cell protein)–1 corresponding to 143% of the control (Table 14) (Ndiaye and Hayashi1997b). Thyroxine also increased the amount of extracellular free cholesterol, phospholipids,and triglycerides, and the sum of these lipids corresponded to 143% of the control.
The incorporation of 14C-acetate into cholesterol, phospholipid, and triglyceride in cul-tured hepatocytes was stimulated by thyroxine. The incorporation into the sum of these lipidscorresponded to 157% of the control. The incorporation of 14C-acetate into extracellular lipids ofthyroxine treated hepatocytes corresponded to 133% of the control (Table 15).
These results suggest that thyroxine stimulates lipid synthesis in hepatocytes and lipidefflux into the culture medium. Most of extracellular lipids associate with lipoproteins. Then weinvestigated the effect of thyroxine on lipoprotein synthesis and secretion.
Table 14. Lipid contents of intra- and extra-cellular fraction of eel hepatocytes cultured with or without thyroxine.
Hepatocyes (2 × 10⁷/dish) were cultured with or without 10–8 M thyroxine (T4) in 7 mL of Williams’ E medium (WE medium)containing 5% FBS and 0.16 μM insulin for 5 days. Then the medium was changed to 7 mL of FBS- and insulin-free WEmedium with or without 10–8 M T4. After 24 h, intra- and extra-cellular lipids were extracted. FC, PL, and TG represent freecholesterol, phospholipids, and triglyceride, respectively. The values are the means ± S.D. for three experiments. *p < 0.01,**p < 0.05. Reprinted from Comp. Biochem. Physiol. B, 116, Ndiaye and Hayashi, A lipoprotein secreted by cultured hepatocytesof silver or yellow eel: Comparison with their plasma lipoproteins, 209–216, © 1997, Elsevier Inc. with permission fromElsevier.
Table 15. Effect of thyroxine on lipid synthesis and efflux in cultured eel hepatocyes.
Hepatocyes (2 × 10⁷/dish) were cultured with or without 10–8 M thyroxine (T4) in 7 mL of Williams’ E medium (WE medium)containing 5% FBS and 0.16 μM insulin for 5 days. Then the medium was changed to 7 mL of FBS- and insulin-free WEmedium containing 74 kBq 14C-acetate with or without 10–8 M T4. After 24 h, phospholipids (PL), triglyceride (TG), freecholesterol (FC), and cholesterylester (CE) of the extracted lipid were separated by TLC. The each lipid after TLC was cutinto pieces and the radioactivity of each piece in 5 mL of scintillation-cocktail was measured by a scintillation counter. Thevalues are the means ± S.D. for three experiments. *p < 0.01, **p < 0.05. Reprinted from Comp. Biochem. Physiol. B, 116,Ndiaye and Hayashi, A lipoprotein secreted by cultured hepatocytes of silver or yellow eel: Comparison with their plasmalipoproteins, 209–216, © 1997, Elsevier Inc. with permission from Elsevier.

34 Studies on Eel Liver Functions Using Perfused Liver and Primary Cultured Hepatocytes
Aqua-BioScience Monographs VOL. 1 NO. 2 2008
Hepatocytes prepared from immature and aquacultured eel were cultured with or withoutthyroxine (10–8 M) for 5 days. After the 5 days, the medium was changed to an FBS- and insulin-free WE medium containing 3H-leucine and 14C-acetate, and hepatocytes were incubated for24 h. After incubation, the medium was recovered, centrifuged, and filtered with a membrane of3.0 μm pore size. 100 μL of the filtrate was applied to a Superose 12 HR 10/30 column. Lipopro-tein and other proteins were eluted by PBS, as shown in Fig. 21.
As shown in Table 16, the incorporation of 3H-leucine and 14C-acetate into lipoproteinsyntehsezed by thyroxine-treated hepatocytes were 206% and 132% of the control, respectively(Ndiaye and Hayashi 1997b). On the other hand, the incorporation of 14C-acetate into the pro-teins, except lipoprotein synthesized by both thyroxine-treated and control hepatocytes, was notobserved, but the incorporation of 3H-leucine into the proteins, except lipoprotein synthesizedby both hepatocytes, was almost the same. These results show that thyroxine specifically stimu-lates lipoprotein synthesis.
Silver eels migrate to the sea from the river for spawning. The concentration of the thyrox-ine in their plasma is significantly higher than that of yellow eels. Thyroxine seems to stimulatelipogenesis and lipoprotein synthesis in the liver of silver eels. Cultured hepatocytes from silvereels show high activity of synthesis of protein as well as lipoprotein. However, the effect ofthyroxine on lipoprotein and protein synthesis in the cultured hepatocytes prepared from imma-ture eel showed that thyroxine specifically stimulated lipoprotein synthesis but not proteinsexcluding lipoprotein. These disagreements seem to be due to the effect of another factor ex-cluding thyroxine on the liver of silver eels. Actually, isolated hepatocytes prepared from silvereels showed higher gluconeogenetic activity than hepatocytes prepared from yellow eels (Hayashiand Ooshiro 1985a).
Fig. 21. Gel-filtration of the medium from culturedhepatocytes treated with or without thyroxine by aSuperose 12 HR 10/30 column. Hepatocyes (2 ×10⁷/dish) were cultured with or without 10–8 Mthyroxine (T4) in 7 mL of Williams’ E medium (WEmedium) containing 5% FBS and 0.16 μM insulinfor 5 days. Then the medium was changed to 7 mLof FBS- and an insulin-free WE medium containing185 kBq 3H-leucine and 74 kBq 14C-acetate with orwithout 10–8 M T4 for 24 h. After incubation, themedium was centrifuged at 3,000 rpm for 5 minand the supernatant was filtered with a membraneof pore size 3.0 μm (Millipore). One hundredmicroliters of the filtrate was applied to a Superose12 HR 10/30 column equilibrated with PBS andsecreted lipoprotein and other proteins were elutedwith PBS at a flow rate of 18 mL h–1. A fractionwas collected every 0.5 mL and the radioactivity ofeach fraction was measured with a scintillationcounter (Aloka LS-3500). Reprinted from Comp.Biochem. Physiol. B, 116, Ndiaye and Hayashi, Alipoprotein secreted by cultured hepatocytes ofsilver or yellow eel: Comparison with their plasmalipoproteins, 209–216, © 1997, Elsevier Inc. withpermission from Elsevier.

Studies on Eel Liver Functions Using Perfused Liver and Primary Cultured Hepatocytes 35
Aqua-BioScience Monographs VOL. 1 NO. 2 2008
4-4. HDL binding to primary cultured eel hepatocytes
4-4A. Stimulatory effect of HDL on VLDL-like lipoprotein synthesis and secretionThe primary function of HDL is known as a reverse transport of cholesterol from periph-
eral tissues to liver. Liver is the only tissue that metabolizes excess cholesterol to bile acid toexclude or to use as a detergent for lipid absorption in intestine. The main apolipoproteins ofHDL are apoAI and AII. Free apoAI and AII are synthesized in liver and secreted into circula-tion. Excess cholesterol of peripheral tissues are transported to free apoAI and AII throughABCAI of peripheral tissues and thereafter a mature HDL is formed (Yokoyama 2004). Infor-mation on the mechanism of HDL formation and HDL function seem to be available for eels, butthere are few reports on HDL formation and the reverse transport of cholesterol in fish.
When HDL transports cholesterol to liver, HDL binds to an HDL receptor in the plasmamembrane of hepatocytes. Scavenger receptor BI is most well known as an HDL receptor ofliver in mammals (Acton et al. 1996). In fish serum, including eel serum, HDL is a main compo-nent and its concentration is about several to ten times higher than that of human (Babin andVernier 1989). We investigated whether eel hepatocytes have an HDL receptor.
HDL isolated from eel serum by density gradient ultracentrifugation was labeled by li-pophilic dye of N,N-dipentadecylaminostyrylpyridinium iodide (di-15-ASP), FITC, or 125I. Byusing di-15-ASP-HDL or FITC-HDL, binding of HDL to hepatocytes was investigated. Incor-poration of HDL into hepatocytes was also investigated by using 125I-HDL.
Freshly isolated eel hepatocytes were incubated with di-15-ASP-HDL at different concen-trations in a WE medium at 0°C for 2 h in the dark. After the incubation, the cells were washedwith cold PBS and then suspended with 0.5 mL of cold PBS. The cell suspension was analyzedby a flow cytometer (Epics Elite, Coulter Electronics). As shown in Fig. 22, specific binding ofdi-15-ASP to hepatocytes was saturated at a concentration of over 100 μg-HDL-protein mL–1
and Kd was about 20 μg-HDL-protein mL–1 (Ndiaye et al. 1995).Eel hepatocytes were cultured in a 96-well microplate, and different concentrations of
FITC-HDL/mL-PBS were added to each well and incubated for 30 min at 28°C in a CO2 incuba-tor. After incubation, each well was washed with cold PBS and 100 μL of cold PBS was added.The binding of FITC-HDL to cultured eel hepatocytes was determined by measuring the fluo-rescence intensity using a Cyto Fluor 4000 (Applied Biosystems). The binding of FITC-HDL tothe hepatocytes was inhibited in the presence of 50 times excess of non-labeled HDL. Theseresults show that FITC-HDL bound specifically to cultured hepatocytes (Kumagai et al. 2007).
125I-HDL was linearly incorporated into the acid-insoluble and acid-soluble fractions ofthe cultured hepatocytes (Fig. 23). Though the amount of incorporation of 125I-HDL into theacid-soluble fractions was about 7% of the total incorporation amount, which was relatively low
Hepatocyes (2 × 10⁷/dish) were cultured with or without 10–8 M thyroxine (T4) in 7 mL of Williams’ E medium (WE medium)containing 5% FBS and 0.16 μM insulin for 5 days. Then the medium was changed to 7 mL of FBS- and insulin-free WEmedium containing 185 kBq 3H-acetate and 74 kBq 14C-acetate with or without 10–8 M T4 for 24 h. After incubation, 100 μLof the medium was applied to a Superose 12HR 10/30 column, and the secreted lipoprotein and other proteins were eluted, asshown in Fig. 21. The secreted lipoprotein and other fractions were the fractions from Nos. 15 to 20 and from Nos. 22 to 30in Fig. 21, respectively. The values are the means ± S.D. for three experiments. *p < 0.01. Reprinted from Comp. Biochem.Physiol. B, 116, Ndiaye and Hayashi, A lipoprotein secreted by cultured hepatocytes of silver or yellow eel: Comparison withtheir plasma lipoproteins, 209–216, © 1997, Elsevier Inc. with permission from Elsevier.
Table 16. Effect of treatment of the eel hepatocytes with thyroxine on the incorporation of 3H-leucine and 14C-acetate into thesecreted lipoprotein and other proteins.

36 Studies on Eel Liver Functions Using Perfused Liver and Primary Cultured Hepatocytes
Aqua-BioScience Monographs VOL. 1 NO. 2 2008
compared with that of the acid-insoluble fractions, the appearance of radioactivity in the acid-soluble fraction shows that 125I-HDL incorporated into the hepatocytes was decomposed withinthe cells during 1 h incubation. In the presence of 100 times excess of cold HDL, the incorpora-tion of 125I-HDL was extremely inhibited, as shown in Fig. 23 (Ndiaye et al. 1995).
These results show that eel hepatocytes have an HDL receptor in the plasma membrane ofeel hepatocytes. The Kd value between the HDL receptor and HDL was determined to be about20 μg-HDL protein mL–1, which corresponds to 40 μg-HDL mL–1 because HDL consists ofabout 50% protein. This value is almost the same as those of rat liver, the Kd values are 10 to50 μg-HDL mL–1 (Leitersdorf et al. 1984; Glass et al. 1985; Mitchel et al. 1987; Morrison et al.1992).
When cultured hepatocytes prepared from immature eels were incubated with HDL, intra-cellular phospholipids and cholesterol ester contents increased, but not significantly, comparedwith the control. The levels of intracellular free fatty acids, triglycerides, and free cholesterolsshowed a tendency to decrease (Ndiaye et al. 1995). However, the rate of secretion of lipopro-tein by the cultured eel hepatocytes incubated with HDL increased 2-fold higher than that by thecontrol hepatocytes (Table 17). The composition of the secreted lipoprotein was 53.9%triglycerides, 5.0% free cholesterol, 6.2% cholesterol ester, 21.6% phospholipids, and 13.3%protein. The compositions of free cholesterol, cholesterol ester, and phospholipids of thesecreted lipoprotein increased significantly. These results show that the addition of HDL to
Fig. 22. Binding experiment of N,N-dipentadecylamino-styrylpyridinium iodide (di-15-ASP)–HDL to eel hepatocytes.Freshly isolated hepatocytes of 2 × 10⁵ cells mL–1 wereincubated with di-15-ASP-HDL at the indicated concentrationin Williams’ E medium at 0°C for 2 h in the dark. Afterincubation, the cells were washed with cold PBS and suspendedwith 0.5 mL of cold PBS. The cell suspension was analyzedwith a flow cytometer. (A) Total binding; (B) Nonspecific bindingdetermined in the presence of unlabeled HDL of 0.8 mg HDLprotein mL–1; (C) Specific binding. Reprinted with permissionfrom Cell Struct. Funct., 20, Ndiaye et al. Effect of specificbinding of high density lipoprotein to eel hepatocytes on theirsecretion of lipoprotein, 301–310, 1995, the Japan Society forCell Biology.
Fig. 23. Incorporation of 125I-HDL into the cultured hepatocytes.The hepatocytes of 107 cells/dish (6 cm) were cultured for 8 daysin 2 mL of Williams’ E medium (WE medium) at 28°C andthen washed with FBS- and insulin-free WE medium twice.The hepatocytes were incubated with 125I-HDL at the indicatedconcentration in FBS- and insulin-free WE medium at 28°Cfor 1 h. When the cells were incubated in the presence of coldHDL, its concentration was 100 times higher than that of 125I-HDL. After incubation the cells were divided into the acidinsoluble and soluble fractions and the ratioactivities of bothfractions were measured. Specific activity of 125I-HDL was 188cpm (ng-HDL protein)–1. (�) and (�), the acid insolublefraction in the absence and the presence of cold HDL; (�) and(�), the acid soluble fraction in the absence and the presenceof cold HDL. Reprinted with permission from Cell Struct.Funct., 20, Ndiaye et al. Effect of specific binding of highdensity lipoprotein to eel hepatocytes on their secretion oflipoprotein, 301–310, 1995, the Japan Society for Cell Biology.
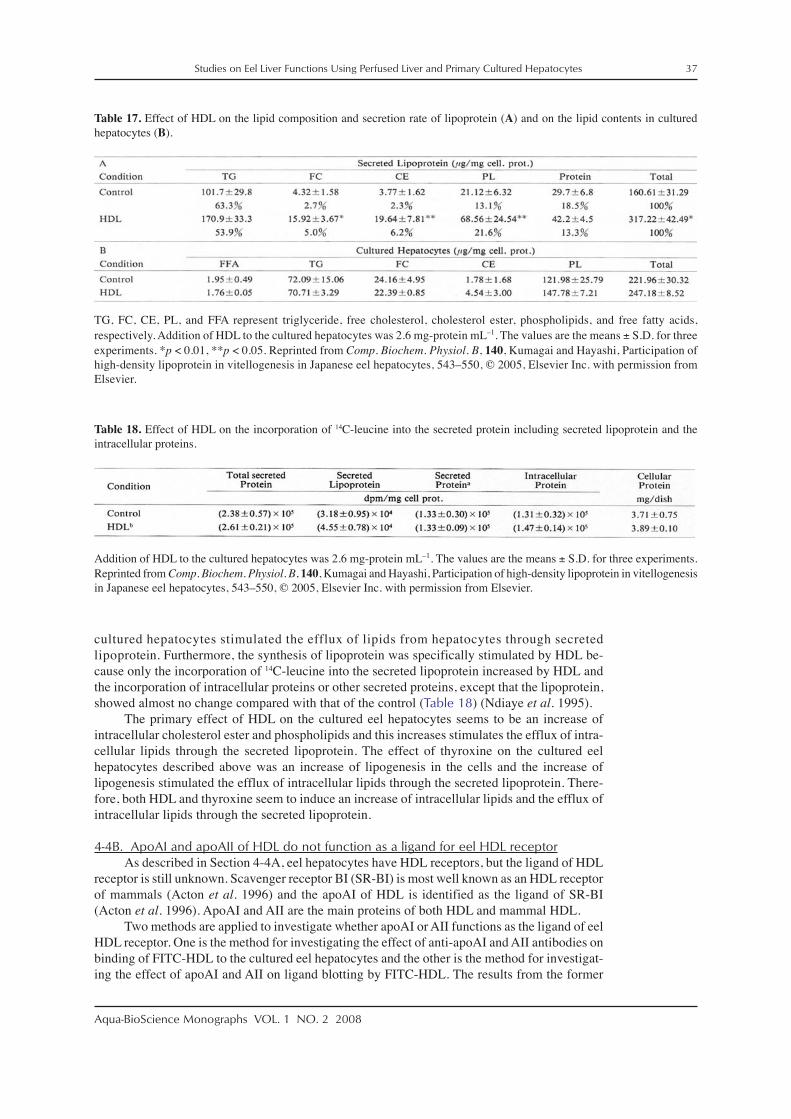
Studies on Eel Liver Functions Using Perfused Liver and Primary Cultured Hepatocytes 37
Aqua-BioScience Monographs VOL. 1 NO. 2 2008
cultured hepatocytes stimulated the efflux of lipids from hepatocytes through secretedlipoprotein. Furthermore, the synthesis of lipoprotein was specifically stimulated by HDL be-cause only the incorporation of 14C-leucine into the secreted lipoprotein increased by HDL andthe incorporation of intracellular proteins or other secreted proteins, except that the lipoprotein,showed almost no change compared with that of the control (Table 18) (Ndiaye et al. 1995).
The primary effect of HDL on the cultured eel hepatocytes seems to be an increase ofintracellular cholesterol ester and phospholipids and this increases stimulates the efflux of intra-cellular lipids through the secreted lipoprotein. The effect of thyroxine on the cultured eelhepatocytes described above was an increase of lipogenesis in the cells and the increase oflipogenesis stimulated the efflux of intracellular lipids through the secreted lipoprotein. There-fore, both HDL and thyroxine seem to induce an increase of intracellular lipids and the efflux ofintracellular lipids through the secreted lipoprotein.
4-4B. ApoAI and apoAII of HDL do not function as a ligand for eel HDL receptorAs described in Section 4-4A, eel hepatocytes have HDL receptors, but the ligand of HDL
receptor is still unknown. Scavenger receptor BI (SR-BI) is most well known as an HDL receptorof mammals (Acton et al. 1996) and the apoAI of HDL is identified as the ligand of SR-BI(Acton et al. 1996). ApoAI and AII are the main proteins of both HDL and mammal HDL.
Two methods are applied to investigate whether apoAI or AII functions as the ligand of eelHDL receptor. One is the method for investigating the effect of anti-apoAI and AII antibodies onbinding of FITC-HDL to the cultured eel hepatocytes and the other is the method for investigat-ing the effect of apoAI and AII on ligand blotting by FITC-HDL. The results from the former
Table 17. Effect of HDL on the lipid composition and secretion rate of lipoprotein (A) and on the lipid contents in culturedhepatocytes (B).
TG, FC, CE, PL, and FFA represent triglyceride, free cholesterol, cholesterol ester, phospholipids, and free fatty acids,respectively. Addition of HDL to the cultured hepatocytes was 2.6 mg-protein mL–1. The values are the means ± S.D. for threeexperiments. *p < 0.01, **p < 0.05. Reprinted from Comp. Biochem. Physiol. B, 140, Kumagai and Hayashi, Participation ofhigh-density lipoprotein in vitellogenesis in Japanese eel hepatocytes, 543–550, © 2005, Elsevier Inc. with permission fromElsevier.
Table 18. Effect of HDL on the incorporation of 14C-leucine into the secreted protein including secreted lipoprotein and theintracellular proteins.
Addition of HDL to the cultured hepatocytes was 2.6 mg-protein mL–1. The values are the means ± S.D. for three experiments.Reprinted from Comp. Biochem. Physiol. B, 140, Kumagai and Hayashi, Participation of high-density lipoprotein in vitellogenesisin Japanese eel hepatocytes, 543–550, © 2005, Elsevier Inc. with permission from Elsevier.

38 Studies on Eel Liver Functions Using Perfused Liver and Primary Cultured Hepatocytes
Aqua-BioScience Monographs VOL. 1 NO. 2 2008
method were that FITC-HDL treated with anti-apoAI or AII antibody bound to hepatocytes withthe same affinity as FITC-HDL without treatment with the antibody (Table 19). The resultsfrom the latter method were that FITC-HDL binding to 67 kDa plasma membrane protein of eelhepatocytes was not affected in the presence of an excess of apoAI or AII (Fig. 24). Theseresults suggest that neither apoAI nor AII functions as the ligand of eel HDL receptor (Kumagaiet al. 2007).
4-4C. Ganglioside of HDL functions as a ligand for an HDL receptor of eel hepatocytesHakomori (1981) have reviewed that oligosaccharide side chains of intrinsic membranes
of glyco-sphingo lipids, particularly gangliosides, specifically bind to receptors. For example,ganglioside GM1 of the plasma membrane of intestinal epitherial cells is known as the ligand ofchorela toxin protein (Fishman 1982). Chisada et al. (2005) reported that Vibrio trachuri, whichcauses vibriosis in fish, adheres to ganglioside GM4 of the intestine of red sea bream (Pagras
Table 19. Effects of HDL, anti-apoAI antibody, anti-apoAII antibody, and the purified ganglioside from the eel HDL on bindingof FITC-HDL to hepatocytes.
Eel hepatocytes (1.2 × 10⁵ cells) were cultured into a 96-well microplate. One hundred microliters of FITC-HDL (30 μg-protein mL–1) with or without non-labeled HDL, antibody against apoAI or AII, and the purified ganglioside was added toeach well, followed by incubation on ice for 30 min. After incubation, each well was washed with twice cold PBS, and thenadded to 100 μL of cold PBS. FITC-HDL (30 μg-protein mL–1) was incubated with 1.5 mg of non-labeled HDL, 6.0 μg of thepurified ganglioside or 1.5 mg of non-labeled HDL incubated with 6.0 μg of the purified ganglioside. FITC-HDL (30 μg-protein mL–1) was treated with 15 μg of the antibodies. The binding of FITC-HDL was determined by measuring the fluorescenceintensity using Cyto Fluor 4000. Each number ± S.D. represents the relative fluorescence intensity of FITC-HDL binding tohepatocytes. *Significantly different from the value of FITC-HDL. p < 0.01. **Significantly different from the value ofFITC-HDL. p < 0.02. Reprinted from Comp. Biochem. Physiol. B, 147, Kumagai et al., Ganglioside from eel serum highdensity lipoprotein (HDL) and its role as a ligand for HDL binding protein, 635–644, © 2007, Elsevier Inc. with permissionfrom Elsevier.
Fig. 24. Effects of apoAI and apoAII on binding of FITC-HDLby ligand blotting. Plasma membrane proteins of hepatocyteswere applied to a gradient gel from 5 to 17.5% polyacrylamide,followed by transblotting to a PVDF membrane. Lane 1 wasstained with 0.1% Coomassie Brilliant Blue R-250 in 50%methanol–7% glacial acetic acid. Lane 2 was incubated with2 μg protein of FITC-HDL. Lanes 3, 4, and 5 were incubatedwith 2 μg protein of FITC-HDL in the presence of 50 timesexcess of non-labeled HDL, apoAI, and apoAII, respectively.Reprinted from Comp. Biochem. Physiol. B, 147, Kumagai etal., Ganglioside from eel serum high density lipoprotein (HDL)and its role as a ligand for HDL binding protein, 635–644,© 2007, Elsevier Inc. with permission from Elsevier.

Studies on Eel Liver Functions Using Perfused Liver and Primary Cultured Hepatocytes 39
Aqua-BioScience Monographs VOL. 1 NO. 2 2008
major). Whether the ganglioside of eel serum HDL functions as the ligand of eel HDL receptorwas investigated.4-4C-1. Ganglioside GM4 isolated from eel serum HDL
Gangliodside GM4 was purified from lyophilized eel serum HDL, as reported by Kumagaiet al. (2007). The mobilities of the purified GM4 and its lyso-form were the same as those ofauthentic GM4 from human brain and its lyso-form on HPTLC analysis. As shown in Fig. 25,the lyso-form of GM4 was positive against a ninhydrin reaction, because the amino-group ap-peared in lyso-form of ganglioside after ganglioside is treated by sphingolipid ceramideN-deacylase.
The mass of purified GM4 from eel serum HDL was 1088.7 and authentic GM4 fromhuman brain was 1118.8. The masses of ceramide of the purified and authentic GM4s were618.6 and 648.6, respectively (Fig. 26). From these values, masses of oligosaccaride of bothGM4s were calculated as 470.1 and 470.2, respectively. The oligosaccaride of GM4 consists ofN-acetylneuraminic acid and galactose, the mass of which corresponds to 470. Recombinantendoglycoceramidase II (TAKARA Bioscience) did not hydrolyze GM4, but hydrolyzedgangliosides such as GM3, the seramide of which binds to the glucose of the oligosaccaride.This means that purified ganglioside has no glucose in its oligosaccaride. The difference of30 mass between GM4 of eel serum HDL (1088.7) and that of human brain (1118.8) is due to thedifference of fatty acids of the GM4s. The fatty acid of GM4 of eel serum HDL seems to be 22:1(C22H41O, 321) and the fatty acid of GM4 of human brain seems to be 24:0 (C24H47O, 351).
Fig. 25. HPTLC of the purifiedganglioside and its lyso-form.(A) HPTLC of the purified gangliosidefrom eel serum HDL and authenticGM4 with a solvent system ofchloroform/methanol/0.2% CaCl2H2O(65/25/4, v/v). Lane 1, authentic GM4from human brain (1 μg); Lane 2, thepurified ganglioside from eel serumHDL (0.5 μg); (B) HPTLC of lyso-form of the purified ganglioside,authentic GM4 and GM3. The purifiedganglioside from eel serum HDL andauthentic GM4 were treated withsphingolipid ceramide N-deacetylase,and the lyso-form of the purifiedganglioside was further purified usinga Sep-Pak Plus Silica column. Thelyso-form of authentic GM4 (lane 1,5 μg), the purified ganglioside (lane2, 1.5 μg), and authentic GM3 frombovine milk (lane 3, 5 μg) weredeveloped on HPTLC with a solventsystem of chloroform/methanol/0.2%CaCl2H2O (65/25/4, v/v) and visualizedwith resorcinol-HCl reagent and 0.5%(w/v) ninhydrin in 100% acetone.Reprinted from Comp. Biochem.Physiol. B, 147, Kumagai et al.,Ganglioside from eel serum highdensity lipoprotein (HDL) and its roleas a ligand for HDL binding protein,635–644, © 2007, Elsevier Inc. withpermission from Elsevier.

40 Studies on Eel Liver Functions Using Perfused Liver and Primary Cultured Hepatocytes
Aqua-BioScience Monographs VOL. 1 NO. 2 2008
Fig. 26. TOF mass spectrometry and assumed structures of the purified ganglioside from eel HDL. Authentic GM4 from humanbrain and the purified ganglioside from eel HDL were dissolved in chloroform/methanol (2/1, v/v) at a final concentration of0.17 and 0.12 μg μL–1, respectively. Each sample of 1 μL was applied to an Agilent 1100 TOF mass spectrometer (California,USA) with an HPLC of Agilent 1100 system equipped with a column of ZORBAX SB-08. The column equilibrated with 10 mMammonium acetate/acetonitrile (80:20) was eluted at a flow rate of 0.3 mL min–1 at 40°C. (A) Authentic GM4 from human brain.(B) Purified ganglioside from eel HDL. Reprinted from Comp. Biochem. Physiol. B, 147, Kumagai et al., Ganglioside from eelserum high density lipoprotein (HDL) and its role as a ligand for HDL binding protein, 635–644, © 2007, Elsevier Inc. withpermission from Elsevier.

Studies on Eel Liver Functions Using Perfused Liver and Primary Cultured Hepatocytes 41
Aqua-BioScience Monographs VOL. 1 NO. 2 2008
Serum HDL of immature eels contained 47.8 ± 17.8 nmol (n = 6) GM4 (MW 1089) per100 mg dry weight of HDL calculated from the amount of N-acetylneuraminic acid. The HDLcontained 52.6 ± 16.4 mg protein per 100 mg dry weight of HDL, and about the half of the HDLproteins consist of apoAI (MW 28,000), namely apoAI of 26.3 mg protein, which correspondsto 939.2 nmol of apoAI, containing per 100 mg dry weight of HDL. The molecular ratio ofapoAI to GM4 in 100 mg dry weight of HDL is roughly 20:1. If the molecular weight of eelHDL is about 400,000 as well as mammalian HDL, 5 molecules of apoAI and AII (MW 14,000)are contained in each HDL particle. Therefore, taking an average that one in four molecule ofHDL contains one molecule of GM4. If 1 molecule of HDL contains 20 molecules of GM4, themolar ratio of the HDL with GM4 to that without GM4 is 1/80, although how many molecules ofGM4 are contained in 1 molecule of HDL has not yet been determined.
Although there are reports on gangliosides of serum lipoproteins in human serum (Chatterjeeand Kwiterovich 1976; Clark 1980), the report on ganglioside GM4 of eel HDL is the first one inTeleostei (Kumagai et al. 2007). In human serum the major gangliosides of serum HDL aregangliosides GM3, GD3, and GM2, but GM4 is not detected (Senn et al. 1989). On the otherhand, other gangliosides, excluding GM4, were not detected in eel serum HDL.
4-4C-2. GM4 as the ligand for eel HDL receptorTwo methods were applied to investigate whether GM4 functions as the ligand of eel HDL
receptor. One is the method for investigating the effect of GM4 on binding of FITC-HDL tocultured eel hepatocytes. The other is the method for investigating the effect of GM4 and GM1on ligand blotting by FITC-HDL. The results from the former method were that FITC-HDLincubated preliminarily with GM4 bound to the eel hepatocytes with a higher affinity than FITC-HDL without incubation with GM4. However, in the presence of non-labeled HDL incubatedpreliminarily with GM4, binding of FITC-HDL to the eel hepatocytes was strongly inhibited(Table 19).
The results from the latter method were that FITC-HDL incubated preliminarily with GM4bound to 67 and 80 kDa plasma membrane proteins of eel hepatocytes with a higher affinity thanFITC-HDL without incubation with GM4 (Fig. 27). Particularly, 80 kDa plasma membraneprotein could be detected only by FITC-HDL incubated preliminarily with GM4. However, thebinding of FITC-HDL incubated preliminarily with GM1 was strongly inhibited (Fig. 27). Theseresults suggest that GM4 of eel HDL is the ligand of the eel HDL receptor.
Fig. 27. Effects of gangliosides on binding ofFITC-HDL by ligand blotting. Plasmamembrane proteins of hepatocytes were appliedon a gradient gel from 5 to 17.5% polyacrylamide,followed by transblotting to a PVDF membrane.Lane 1 was stained with 0.1% CoomassieBrilliant Blue R-250 in 50% methanol–7%glacial acetic acid. Lane 2 was incubated with2 μg protein of FITC-HDL. Lanes 3, 4, and 5were incubated with 2 μg protein of FITC-HDLpreincubated for 30 min with the purifiedganglioside, authentic GM4, and GM1,respectively. The molar ratio of the purifiedganglioside, authentic GM4 or GM1 to GM4 inFITC-HDL was 300. Reprinted from Comp.Biochem. Physiol. B, 147, Kumagai et al.,Ganglioside from eel serum high densitylipoprotein (HDL) and its role as a ligand forHDL binding protein, 635–644, © 2007,Elsevier Inc. with permission from Elsevier.

42 Studies on Eel Liver Functions Using Perfused Liver and Primary Cultured Hepatocytes
Aqua-BioScience Monographs VOL. 1 NO. 2 2008
As described in Section 4-4A, the Kd value for binding eel HDL to eel HDL receptor isabout 20 μg-HDL-protein mL–1, which corresponds to 40 μg-HDL mL–1 because HDL consistsof about 50% protein. If the molecular weight of eel HDL is about 400,000, the Kd value iscalculated as 1 × 10⁻⁷ mol L–1. The concentration of HDL containing GM4 is calculated asfollows. As the concentration of eel serum HDL is about 500 mg dL–1, the HDL concentration iscalculated as 1.25 × 10⁻⁵ mol L–1. As described in Section 4-4C-1, if 20 molecules of GM4 arecontained in one molecule of HDL, the molar ratio of the HDL with GM4 to the HDL withoutGM4 is 1/80. Then the concentration of the HDL containing GM4 is calculated as 1.56 × 10⁻⁷
mol L–1, which is comparable to the Kd value. However, this concentration is calculated on thehypothesis that one molecule of HDL among 80 molecules of HDL contains 20 molecules ofGM4.
It is thought that the ganglioside of serum lipoprotein is synthesized in a liver (Senn et al.1989). Fish livers such as horse mackerel, Pacific mackerel, bonito, red sea bream, and sharkcontain GM4 as a main ganglioside, but mammalian liver contains GM3 as the main ganglioside(Saito et al. 2001; Li et al. 2002). Ganglioside is secreted into blood as a component of secretedlipoprotein (Kivatinitz et al. 1992), probably VLDL. The concentration of GM4 in serum HDLprobably varies depending on the degree of GM4 synthesis, synthesis and secretion of lipopro-tein, and transportation of GM4 to HDL from secreted lipoprotein. These variations of GM4concentration in HDL may affect the interaction between eel serum HDL and the eel HDL receptor.
4-5. Vitellogenin induction by cultured eel hepatocytes
4-5A. Vitellogenin induction by estradiol-17βVitellogenin, a calcium-binding glycophospholipoprotein, is a precursor of primary egg
yolk proteins and is synthesized and induced in the liver by estradiol-17β. Vitellogenin secretedfrom the liver is circulated through the blood and is incorportated into the oocyte by receptor-mediated endocytosis.
When aquacultured immature eels were intraperitoneally injected with 2 mg estradioil-17β per kg weight three times every 4 days, vitellogenin appeared in the plasma. Vitellogenin isa very-high density lipoprotein with a density from 1.27 to 1.30 g mL–1 and was isolated bydensity gradient ultracentrifugation. Vitellogenin was further purified by a DEAE-Toyopearl650S column. During the purification procedures, aprotinin (1,000 KIE mL–1) and 20 mM EDTAwere necessary to protect against protease digestion (Komatsu and Hayashi 1997). The purifiedvitellogenin had a single protein with 196 kDa under both reduced and non-reduced conditions(Fig. 28).
4-5B. Vitellogenin induction by cultured eel hepatocytesCultutred hepatocytes prepared from aquacultured immature eels induced a synthesis of
196 kDa protein by 10–4 M estradiol-17β, which was the same protein as that appearing in theplasma of estradiol-17β injected eels. The synthesized protein with 196 kDa by culturedhepatocytes seems a component of vitellogenin (Fig. 29). However, a pharmacological dose ofestradiol-17β was necessary for induction of vitellogenin (Komatsu and Hayashi 1997). Thehepatocytes cultured with 10–4 M estradiol-17β contained many oily droplets in the cytoplasm,but the control cells had only a few droplets.
The effect of coating with poly-L-lysine and fibronectin on culture dishes used for attach-ment of hepatocytes were investigated for vitellogenin synthesis by 10–4 M estradiol-17β. At thesame time, the effects of cell densities of 3.5 × 10⁵ and 7 × 10⁵ cells cm–2 were investigated. Thehepatocytes cultured on fibronectin-coated dishes and at low cell density synthesized vitellogenin14 μg-protein (mg-cell protein)–1 (Figs. 30 and 31) (Komatsu and Hayashi 1998). These condi-tions were optimal for vitellogenin induction under tested conditions.
Hepatocytes prepared from preliminarily estradiol-17β injected eels induced a synthesisof 196 kDa protein by 10–6 M estradiol-17β, a physiological concentration. After 3 days’ culture,the vitellogenin was observed in the medium supplemented with 10–6 M estradiol-17β and itsamount was 0.66 and 1.32 μg-protein (mg-cell protein)–1 at 9 and 11 days, respectively (Fig. 32),but control cells without estradiol-17β did not synthesize vitellogenin (Komatsu and Hayashi 1997).

Studies on Eel Liver Functions Using Perfused Liver and Primary Cultured Hepatocytes 43
Aqua-BioScience Monographs VOL. 1 NO. 2 2008
Fig. 28. SDS-PAGE of the purified vitellogenin (Vg) from eel plasma. The purified Vgs from estradiol-17β-treated eels (lanesF and G) and female silver eel (lanes H and I) were prepared by a DEAE-Toyopearl 650S following density gradientultracentrifugation. The whole plasma of control eels (lane B), estradiol-17β-treated eels (lane C), wild eels (lane D) and afemale silver eel (lane E) were electrophoresed. Each sample of 15 μg (lanes B, C, D and E) or 3 μg (lanes F, G, H and I) wasloaded on an SDS polyacrylamide gradient (4.5–18%) slab gel. Lanes B, C, D, E, F and H were performed under reducedconditions, and lanes G and I were performed under non-reduced conditions. Lane A, low molecular weight marker; Lane J,high molecular marker. Reprinted with permission from Fish. Sci., 63, Komatsu and Hayashi, Pharmacological dose of estradiol-17β induces vitellogenin synthesis in cultured hepatocytes of immature eel Anguilla japonica, 989–994, 1997, the JapaneseSociety of Fisheries Science.
Fig. 29. SDS-PAGE of the plasma protein (lanes B, C, and D) prepared from control eels (lane B), estradiol-17β-treated eels(lane C), and a female silver eel (lane D) and that of the secreted protein (lanes E, F, G, H, I, and J) by non-treated eel hepatocytescultured with 10–4 M estradiol-17β (lanes H, I, and J) and without estradiol-17β (lanes E, F, and G). Aliquots (15 μg) of severalsamples were loaded on an SDS polyacrylamide gradient (4.5–18%) slab gel. Lane A, molecular weight marker; VTG,apolipoprotein of Vg. Reprinted with permission from Fish. Sci., 63, Komatsu and Hayashi, Pharmacological dose of estradiol-17β induces vitellogenin synthesis in cultured hepatocytes of immature eel Anguilla japonica, 989–994, 1997, the JapaneseSociety of Fisheries Science.

44 Studies on Eel Liver Functions Using Perfused Liver and Primary Cultured Hepatocytes
Aqua-BioScience Monographs VOL. 1 NO. 2 2008
Fig. 30. SDS-PAGE of plasma proteins and secretedproteins by cultured eel hepatocytes. The hepatocytes werecultured on plastic dishes precoated with poly-L-lysine (Eand C) or fibronectin (F and H). Aliquots (15 μg) of sampleswere loaded on an SDS polyacrylamide gradient (4.5–18%)slab gel. Lane A, molecular weight marker; lanes B, C,and D, the plasma protein prepared from control, estradiol-17β-treated, and a female silver eel, respectively; lanes E,F, G, and H, the secreted protein by the eel hepatocytescultured with 10–4 M estradiol-17β (G and H) and withoutestradiol-17β (E and F). Reprinted with permission fromFish. Sci., 63, Komatsu and Hayashi, Pharmacological doseof estradiol-17β induces vitellogenin synthesis in culturedhepatocytes of immature eel Anguilla japonica, 989–994,1997, the Japanese Society of Fisheries Science.
Fig. 31. Effects of materials for cell adhesion and cell density on thelevels of apolipoprotein of vitellogenin (VTG) secretion by culturedeel hepatocytes. Hepatocytes were cultured under low cell density(3.5 × 10⁵ cells cm–2) or high cell density (7 × 10⁵ cells cm–2) conditionon plastic dishes which were precoated with poly-L-lysine orfibronectin in the presence or absence of 10–4 M estradiol-17β. After4 days’ culture, the intracellular (A) and extracellular (B) proteinswere recovered. Several secreted proteins were loaded on SDSpolyacrylamide gradient (4.5–18%) gel. After electrophoresis, theVTG content (C) in extracellular proteins was determined by adensitometer. Percentage of the VTG to total secreted proteins is givenin parentheses in (C). Numbers of experiments are given in parenthesesin (A). Reprinted with permission from Fish. Sci., 64, Komatsu andHayashi, Optimal conditions for estradiol-17β induced vitellogeninsynthesis by cultured hepatocytes of eel Anguilla japonica, 658–659,1998, the Japanese Society of Fisheries Science.
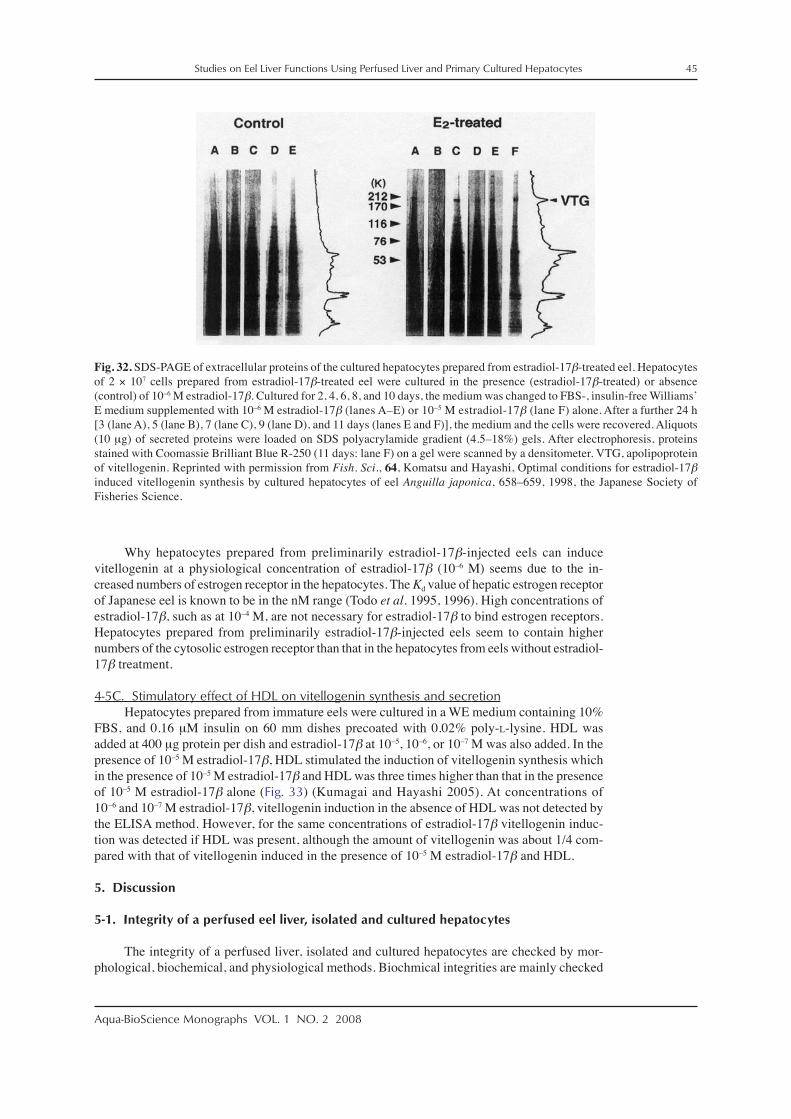
Studies on Eel Liver Functions Using Perfused Liver and Primary Cultured Hepatocytes 45
Aqua-BioScience Monographs VOL. 1 NO. 2 2008
Why hepatocytes prepared from preliminarily estradiol-17β-injected eels can inducevitellogenin at a physiological concentration of estradiol-17β (10–6 M) seems due to the in-creased numbers of estrogen receptor in the hepatocytes. The Kd value of hepatic estrogen receptorof Japanese eel is known to be in the nM range (Todo et al. 1995, 1996). High concentrations ofestradiol-17β, such as at 10–4 M, are not necessary for estradiol-17β to bind estrogen receptors.Hepatocytes prepared from preliminarily estradiol-17β-injected eels seem to contain highernumbers of the cytosolic estrogen receptor than that in the hepatocytes from eels without estradiol-17β treatment.
4-5C. Stimulatory effect of HDL on vitellogenin synthesis and secretionHepatocytes prepared from immature eels were cultured in a WE medium containing 10%
FBS, and 0.16 μM insulin on 60 mm dishes precoated with 0.02% poly-L-lysine. HDL wasadded at 400 μg protein per dish and estradiol-17β at 10–5, 10–6, or 10–7 M was also added. In thepresence of 10–5 M estradiol-17β, HDL stimulated the induction of vitellogenin synthesis whichin the presence of 10–5 M estradiol-17β and HDL was three times higher than that in the presenceof 10–5 M estradiol-17β alone (Fig. 33) (Kumagai and Hayashi 2005). At concentrations of10–6 and 10–7 M estradiol-17β, vitellogenin induction in the absence of HDL was not detected bythe ELISA method. However, for the same concentrations of estradiol-17β vitellogenin induc-tion was detected if HDL was present, although the amount of vitellogenin was about 1/4 com-pared with that of vitellogenin induced in the presence of 10–5 M estradiol-17β and HDL.
5. Discussion
5-1. Integrity of a perfused eel liver, isolated and cultured hepatocytes
The integrity of a perfused liver, isolated and cultured hepatocytes are checked by mor-phological, biochemical, and physiological methods. Biochmical integrities are mainly checked
Fig. 32. SDS-PAGE of extracellular proteins of the cultured hepatocytes prepared from estradiol-17β-treated eel. Hepatocytesof 2 × 10⁷ cells prepared from estradiol-17β-treated eel were cultured in the presence (estradiol-17β-treated) or absence(control) of 10–6 M estradiol-17β. Cultured for 2, 4, 6, 8, and 10 days, the medium was changed to FBS-, insulin-free Williams’E medium supplemented with 10–6 M estradiol-17β (lanes A–E) or 10–5 M estradiol-17β (lane F) alone. After a further 24 h[3 (lane A), 5 (lane B), 7 (lane C), 9 (lane D), and 11 days (lanes E and F)], the medium and the cells were recovered. Aliquots(10 μg) of secreted proteins were loaded on SDS polyacrylamide gradient (4.5–18%) gels. After electrophoresis, proteinsstained with Coomassie Brilliant Blue R-250 (11 days: lane F) on a gel were scanned by a densitometer. VTG, apolipoproteinof vitellogenin. Reprinted with permission from Fish. Sci., 64, Komatsu and Hayashi, Optimal conditions for estradiol-17βinduced vitellogenin synthesis by cultured hepatocytes of eel Anguilla japonica, 658–659, 1998, the Japanese Society ofFisheries Science.

46 Studies on Eel Liver Functions Using Perfused Liver and Primary Cultured Hepatocytes
Aqua-BioScience Monographs VOL. 1 NO. 2 2008
by synthetic abilities such as gluconeogenesis, protein synthesis, urea synthesis, bile acid syn-thesis, and lipogenesis. Oxygen consumption and CO2 production are used as indicators of physi-ological integrity. In this section we focus on biochemical integrities.
Gluconeogenesis is a good indicator for biochemical integrity because gluconeogenesisfrom pyruvate or lactate needs 4 ATP and 2 GTP per mole of glucose synthesis. Furthermoreenzymes necessary for gluconeogenesis are distributed in both cytosol and mitochondria. Namely,having a gluconeogenetic ability reflects normal energy production and integrity of intracellularcompartments.
Perfused eel livers, isolated and cultured eel hepatocytes have the ability of gluconeogen-esis. Table 20 shows a comparison of gluconeogenesis by perfused eel livers (Section 3-2A),isolated eel hepatocytes (Section 3-2B) and cultured eel hepatocytes (Section 3-2B). The high-est rate of gluconeogenesis was obtained by the perfused eel livers and the lowest was obtainedby the cultured eel hepatocytes. The values of 21 and 6.4 μmol-glucose (g-cell) h–1 for culturedeel hepatocytes in Table 20 were the rates of gluconeogenesis from 10 mM pyruvate and
Fig. 33. Effect of estradiol-17β and HDL on vitellogenesis in cultured hepatocytes. (A) Calibration curve of sandwich ELISAfor quantification of apolipoprotein of vitellogenin (VTG). VTG of 100, 101, 102, 103, and 2 × 10³ ng mL–1 were used to makecalibration curve; (B) Secreted VTG by primary cultured hepatocytes in the presence of 10–5 M estradiol-17β (b), 10–6 Mestradiol-17β (c), 10–7 M estradiol-17β (d), 10–5 M estradiol-17β + HDL (e), 10–6 M estradiol-17β + HDL (f), 10–7 M estradiol-17β + HDL (g), and in the absence of estradiol-17β and HDL (a). HDL of 400 μg was added; VTG in cultured medium wasdetermined by sandwich ELISA. All values are mean ± S.D. for three experiments. *** Significantly different from the controlvalue. p < 0.05, +++ Significantly different from the 10–5 M E2 value. p < 0.05. Reprinted from Comp. Biochem. Physiol. B, 140,Kumagai and Hayashi, Participation of high-density lipoprotein in vitellogenesis in Japanese eel hepatocytes, 543–550, © 2005,Elsevier Inc. with permission from Elsevier.

Studies on Eel Liver Functions Using Perfused Liver and Primary Cultured Hepatocytes 47
Aqua-BioScience Monographs VOL. 1 NO. 2 2008
lactate, respectively. Therefore, when 5 mM pyruvate or lactate was used, gluconeogenesis bycultured eel hepatocyes seems lower than 21 or 6.4 μmol-glucose (g-cell)–1 h–1. If only gluco-neogenesis is used as an indicator of the integrity of an eel liver, perfused eel livers retain thebest liver functions. Certainly, perfused eel livers maintain tissues that consist of several kindsof cells and to maintain liver tissue seems to be the best way of keeping the liver functions. Butperfused eel livers can retain liver functions only for 2 to 3 h and it is impossible to retain liverfunctions of perfused eel livers for over 3 h at present. Whereas gluconeogenesis by isolated eelhepatocytes was higher than that by cultured eel hepatocytes, as shown in Table 20. From thisresult, postulating that the integrity of isolated eel hepatocytes is higher than that of cultured eelhepatocytes is not reasonable. We then compared glycogen synthesis and intracellular proteinsynthesis between isolated eel hepatocytes and cultured eel hepatocytes.
Isolated eel hepatocytes were suspended in Ringer solution or serum- and insulin-free WEmedium immediately after preparation and suspension of the isolated eel hepatocytes was usedfor experiments. Eel hepatocytes were cultured in WE–5% FBS–0.16 μM insulin for 4 to 5 daysand then washed with Ringer solution or serum- and insulin-free WE medium. After washing,the cultured eel hepatocytes were used for experiments. Incubation time for experiments byisolated eel hepatocyes and by cultured eel hepatocyes were 1 and 2 h, respectively.
As shown in Table 21, glycogen synthesis was the highest in the cultured eel hepatocytesincubated in a serum- and insulin-free WE medium and then in the cultured eel hepatocytesincubated in Ringer solution. Among the three substrates, glycogen synthesis from 5 mM14C-glucose was the highest and that from 5 mM 14C-lactate was the lowest. Both isolated eelhepatocytes suspended in Ringer solution and in a serum- and insulin-free WE medium synthe-sized little glycogen.
Intracellular protein synthesis was the highest in the cultured eel heatocytes incubated in aserum- and insulin-free WE medium as glycogen synthesis. Among the three substrates, intra-cellular protein synthesis from 5 mM 14C-pyruvate was the highest and that from 5 mM14C-glucose was the lowest. Isolated eel hepatocytes synthesized about 1/30 to 1/230 of theintracellular protein obtained by cultured eel hepatocytes.
These results show that judging the integrity of perfused eel livers or eel hepatocytes fromonly the ability of gluconeogenesis is not reasonable. Putting all these results together, culturedeel hepatocytes seem to retain the highest integrity. However, which method of the three is usedis due to the purpose of the experiment.
5-2. Gluconeogenesis and glycogen metabolisms in eel liver
5-2A. GluconeogenesisThe main focus of the pathway for gluconeogenesis from pyruvate or lactate is the PEP
synthesis pathway. PEP synthesis is different among animals such as rat, eel, and pigeon, as
Table 20. Comparison of gluconeogenesis between perfused eel livers, isolated eel hepatocytes, and culturedeel hepatocytes.
Methods Gluconeogenesis
μmole-glucose/(g-liver [or -cell]·h)
Perfused Eel Livers5 mM Pyruvate 455 mM Lactate 54
Isolated Eel Hepatocytes5 mM Pyruvate 195 mM Lactate 245 mM Alanine 11
Cultured Eel Hepatocytes10 mM Pyruvate 2110 mM Lactate 6.4

48 Studies on Eel Liver Functions Using Perfused Liver and Primary Cultured Hepatocytes
Aqua-BioScience Monographs VOL. 1 NO. 2 2008
shown in Fig. 14. The reason why the PEP synthesis pathway is different is due to a differenttype of LDH and to the difference of the subcellular distribution of PEP carboxykinase. The PEPsynthesis pathway was also clarified from the effects of some enzyme inhibitors and some aminoacids on gluconeogenesis.
The stoichiometric analysis of gluconeogenesis from 5 mM pyruvate by perfused eel liv-ers suggests that the LDH type in eel liver is different from that in rat liver. Actually, the LDH ofthe eel liver was found to be of the heart type by starch gel electrophoresis and not of the muscletype as in rat liver (Fig. 9). An important characteristic of heart-type LDH was elucidated byintense substrate inhibition. Namely, the ternary complex of LDH-pyruvate-NAD+ inhibits LDHreaction. While the muscle type of LDH hardly forms the ternary complex. Because rat liverLDH is of the muscle type, the LDH reaction is little inhibited by pyruvate. Therefore, in ratliver about half of the amount of consumed pyruvate is converted to lactate with consumption ofNADH in the cytosol, whereas when pyruvate is used for gluconeogenesis in eel liver no lactateis produced, therefore NADH in the cytosol is not consumed.
The difference of LDH type between rat and eel liver brings about a different consumptionof cytosolic NADH. This seems to be the reason why a malate–oxaloacetate pathway for PEPsynthesis is required in rat liver and not in eel liver (Figs. 14A, B). The malate–oxaloacetate
Table 21. Comparison of glycogen synthesis, gluconeogenesis, and protein synthesis between isolated eelhepatocytes and cultured eel hepatocytes.
Substrate Glycogen Glucose Protein
cpm/(mg-protein·h)
5 mM 14C-LactateRinger 0 5.79 × 10³ 89Serum-free WE medium 0 2.70 × 10³ 34
5 mM 14C-PyruvateRinger 4 4.77 × 10³ 134Serum-free WE medium 6 2.33 × 10³ 46
5 mM 14C-GlucoseRinger 10 59Serum-free WE medium 8 13
B) Cultured eel hepatocytes
A) Isolated eel hepatocytes
The values of isolated eel hepatocytes and cultured eel hepatocytes are the means for three experimentsand for two experiments, respectively.
Substrate Glycogen Glucose Protein
cpm/(mg-protein·2 h)
5 mM 14C-LactateRinger 96 3.45 × 10³ 2.44 × 10³
Serum-free WE medium 508 711 4.93 × 10³
5 mM 14C-PyruvateRinger 120 5.02 × 10³ 4.39 × 10³
Serum-free WE medium 1.47 × 10³ 1.76 × 10³ 10.6 × 10³
5 mM 14C-GlucoseRinger 615 1.06 × 10³
Serum-free WE medium 6.02 × 10³ 1.06 × 10³

Studies on Eel Liver Functions Using Perfused Liver and Primary Cultured Hepatocytes 49
Aqua-BioScience Monographs VOL. 1 NO. 2 2008
pathway is available to supply the cytosolic NADH through cytosolic malate dehydrogenase.Cytosolic NADH is necessary for glyceraldehydes-3-phosphate dehydrogenase in gluconeo-genesis.
PEP carboxykinase of rat, eel, and pigeon distributes in the cytosol, in both the mitochon-dria and the cytosol, and in the mitochondria, respectively. Pyruvate carboxylase, which catalyzesthe conversion of pyruvate to oxaloacetate, localizes in the mitochondria of rat, eel, and pigeonliver. Therefore, oxaloacetate is produced in the mitochondria and then the oxaloacetate is con-verted to PEP by PEP carboxykinase. In pigeon liver PEP carboxykinase localizes in the mito-chondria and PEP is synthesized in the mitochondria (Fig. 14C).
PEP can pass through the mitochondrial membrane, but oxaloacetate can not (Haslam andGriffiths 1968). Therefore, in rat and eel liver, oxaloacetate must be transported from the mito-chondria to the cytosol. The effects of some enzyme inhibitors on gluconeogenesis, such asamino-oxyacetate (transaminase inhibitor), D-malate (malate dehydrogenase inhibitor), quinolinicacid (PEP carboxykinase inhibitor), and tryptophan (PEP carboxykinase inhibitor), suggest twoPEP synthesis pathways in rat and eel liver, malate–oxaloacetate pathway and aspartate–oxaloacetate pathway (Fig. 7). As eel liver LDH is of the heart type, when pyruvate is used forgluconeogenesis, the malate–oxaloacetate pathway is not required because cytosolic NADH isnot consumed by LDH. In eel liver, only the aspartate–oxaloacetate pathway is necessary forPEP synthesis, as shown in Fig. 14B, although about 30% of PEP is synthesized in the mitochon-dria by mitochoncrial PEP-carboxykinase.
That the glutamate oxaloacetate transaminase reaction plays an important role in gluco-neogenesis in eel liver, as shown in Fig. 12, is supported by the results of the effects of leucineand oleic acid on gluconeogenesis. Gluconeogenesis in eel liver is controlled by the amount ofmitochondrial glutamate which is affected by glutamate dehydrogenase. When leucine was addedto the reaction mixture, gluconeogenesis from pyruvate increased 1.5 to 2-fold and the amountof glutamate increased 3.7-fold. Increased glutamate seems to accelerate the transaminase reac-tion from oxaloacetate to aspartate in the mitochondria. The glutamate dehydrogenase purifiedfrom the mitochondrial fraction of the eel liver was stimulated 2.5-fold to the direction of gluta-mate formation by leucine, but 1.4-fold to the deamination direction (Hayashi et al. 1982a).
Furthermore, eel liver glutamate dehydrogenase was completely inhibited by 10 μM oleicacid or oleoyl-CoA. Addition of 2.5 mM oleic acid in the reaction mixture inhibited gluconeo-genesis from lactate and pyruvate by over 95%. At the same time, the amount of glutamate in theeel liver decreased significantly compared to that of the control. This decrease seems due to theinhibitory effect of oleic acid on glutamate dehydrogenase. However, 2.5 mM oleic acid did notinhibit O2 consumption and CO2 production in the eel hepatocytes.
Inui and Yokote (1975b) have reported that the hydrocortisone-administered eel stimulatesgluconeogenesis and the activity of glutamate oxaloacetate transaminase of the hydrocortisone-administered eel increases. They suggest some significance of aspartate in the amino acid me-tabolism of the eel. This seems to correspond to the important role of the aspartate–oxaloacetatepathway in gluconeogenesis of the eel liver.
5-2B. Glycogen metabolismsGlycogen stocked in eel liver is an important material as an energy source as well as lipid.
There are few quantitative investigations on glycogen synthesis in fish liver. Investigations havebecome possible by using cultured eel hepatocyes incubated with a glucose-free MEM me-dium–0.5% BSA and the hepatocytes synthesized glycogen from 10 mM pyruvate and lactate atthe rates of 81 (n = 4) and 33 (n = 2) μmol-glucose (g-cell)–1 h–1, respectively. Glycogen synthe-sis from pyruvate and lactate by cultured eel hepatocytes is higher than gluconeogenesis frompyruvate and lactate.
A remarkable characteristic on glycogen metabolism in eel liver is that the effect of gluca-gon on glycogen metabolism in the presence of 10 mM pyruvate was different from that in thepresence of 10 mM lactate. In mammalian liver, it is well known that glucagon stimulates glyco-gen degradation and gluconeogenesis, whereas insulin stimulates glycogen synthesis and inhib-its gluconeogenesis (Darnell et al. 1990). However, glucagon at 10–6 and 10–7 M in the presence

50 Studies on Eel Liver Functions Using Perfused Liver and Primary Cultured Hepatocytes
Aqua-BioScience Monographs VOL. 1 NO. 2 2008
of 10 mM pyruvate did not stimulate glycogen degradation, but the same concentrations ofglucagon in the presence of 10 mM lactate stimulated glycogen degradation. Glycogen synthe-sis from 10 mM pyruvate was observed even if 10–6 and 10–7 M glucagon was present. Further-more, glycogen synthesis from 5 mM 14C-pyruvate by eel hepatocytes incubated with a serum-and insulin-free WE medium, which contains 11 mM glucose, was stimulated by 2.5 × 10⁻⁷ Mglucagon 2.5-fold compared with glycogen synthesis without glucagon. As stimulatory effectsof glucose on glycogen synthesis have been reported by Ui and Tokumitsu (1979), glucose in aWE medium also seems to stimulate glycogen synthesis in the eel hepatoctes.
In the presence of both glucagon and insulin at 2.5 × 10⁻⁷ M, glycogen synthesis from 5 mM14C-pyruvate was further stimulated 10 times higher than glycogen synthesis in the absence ofglucagon and insulin. In the presence of insulin alone, glycogen synthesis from 5 mM 14C-pyruvatewas slightly stimulated by 18% compared with the control. These results show that glycogensynthesis from pyruvate was enhanced by the addition of glucose and insulin. However, thereason why glycogen synthesis from pyruvate, not from lactate, was stimulated by glucagonremains to be clarified in future.
Inui and Yokote (1975a, b) reported that liver glycogen content increased in the alloxanizedeel and hydrocortisone-administered eel. Alloxan is well known for destroying the islet B cellsand the alloxan-treated eel induces insulin deficiency. The alloxanized eel increased blood glu-cose and liver glycogen. They suggest that gluconeogenesis from amino acids was stimulated inthe alloxanized eel. Similarly, the administration of hydrocortisone to the eel stimulated gluco-neogenesis. Both the alloxan-treated eel and the hydrocortisone-administered eel stimulatedgluconeogenesis and glucagon also stimulated gluconeogenesis in the cultured eel hepatocytes.Therefore, the stimulation of gluconeogenesis may induce glycogen synthesis. The mechanismof glucagon action on glycogen synthesis from pyruvate seems to be an interesting problem.
5-3. Lipoprotein metabolisms in eel liver
5-3A. Lipoprotein synthesized by cultured eel hepatocytesThere are three characteristics of lipoprotein synthesized by cultured eel hepatocyes. The
first one is that the synthesized and secreted lipoprotein is only one kind of lipoprotein and it isa VLDL-like lipoprotein. As shown in Table 12, chemical compositions of the lipoprotein were69.0% triglycerides, 14.7% phospholipid, 3.8% free cholesterol, 0.36% cholesterol ester, and12.0% protein. The density of the lipoprotein is 1.06 g mL–1. These properties represent VLDL-like lipoprotein and the rate of secretion of the lipoprotein was very high at 10.9 ± 4.34 μgprotein per mg cell protein per 24 h, which was 39 times higher than that of rat (Bell-Quint andForte 1981). The high synthesis and secretion of the lipoprotein by eel hepatocytes seem toreflect the high concentration of eel serum lipoproteins. Although HDL is a main lipoprotein ineel serum, cultured eel hepatocytes do not synthesize and secrete HDL. The lipoprotein synthe-sized by the hepatocytes may be converted to LDL and HDL after secretion. Experiments on theconversion from secreted VLDL-like lipoprotein to HDL have not yet been performed, but apoAIand AII proteins of the secreted lipoprotein were easily transferred to artificial liposomes (Yu etal. 1992). Furthermore, free apoAI and AII in the secreted proteins were detected by anti apoAIor AII antibody (Katoh et al. 2000). These free apoAI and AII seem to be converted to HDLmediated through ABCA1 protein in plasma membranes of peripheral tissues (Tsujita et al.2005; Brunham et al. 2006).
The second characteristic is the components of apolipoproteins of the lipoprotein. In spiteof VLDL-like lipoprotein, it contains apoAI and AII as the main components. Another maincomponent of the lipoprotein is apoB48, but apoB100 is not contained. These characteristics ofapolipoprotein components are the same in eel serum VLDL and LDL. Main apolipoprotein ofmammalian VLDL is apoB100, and apoAI and AII are not contained in mammalian VLDL.ApoAI and AII are the main components of mammalian HDL. Eel serum HDL also consists ofapoAI and AII but both consist of two isomers. The two apoAI have 28 kDa and differentN-terminal amino acid sequences and the two apoAII have 14 kDa and identical N-terminalamino acid sequences (Kondo et al. 2001). Because protein in mammalian apoB48 is a component

Studies on Eel Liver Functions Using Perfused Liver and Primary Cultured Hepatocytes 51
Aqua-BioScience Monographs VOL. 1 NO. 2 2008
of chylomicron, the lipoprotein synthesized and secreted by cultured eel hepatocytes is alsocharacterized as chylomicron-like lipoprotein.
The third characteristic is that the lipoprotein synthesis and secretion are controlled by theamounts of intracellular lipids of the hepatocytes in cooperation with external factors. Thyrox-ine (10–8 M) and HDL (2.6 mg mL–1) stimulated the lipoprotein synthesis and secretion. Thyrox-ine also stimulated lipogenesis in the hepatocytes and thereby the amounts of intracellular lipidssuch as cholesterol, phospholipid, and triglycerides increased. At the same time, thyroxine stimu-lated the efflux of lipids to extracellular medium. Almost all extracellular lipids are associatedwith the lipoprotein in the medium. The effect of thyroxine on the incorporation of 3H-leucineand 14C-acetate into the secreted proteins including lipoprotein revealed that thyroxine specifi-cally stimulated the incorporation of 3H-leucine and 14C-acetate into the lipoprotein.
Addition of HDL to the hepatocytes induced an increase of intracellular phospholipid andcholesterol ester, which are the main lipids of HDL. The amount of secreted lipoprotein in-creased by 2-fold by the addition of HDL and the incorporation of 14C-leucine into the secretedlipoprotein increased by the additon of HDL, but there was no change in the incorporation intoother secreted proteins. From the results of the effects of thyroxine and HDL on the synthesisand secretion of lipoproein, it is concluded that stimulation of the synthesis and secretion oflipoprotein is induced when the amount of intracellular lipids of hepatocytes increases. Eel liver,different from cod liver, does not store lipids and excess liver lipids seem to transport immedi-ately from a liver to serum through the secreted VLDL-like lipoprotein. Because eel musclecontains high amounts of lipid, about 20% of wet weight, the lipid of eel muscle seems to betransported through the secreted lipoprotein.
5-3B. HDL metabolismWe found that eel serum HDL functioned as stimulators of lipoprotein and vitellogenin
synthesis and secretion. Eel HDL is also believed to play a key role in the process of reversecholesterol transport. Excess cholesterol is transporated to the liver by HDL and metabolized tobile acids in the liver to eliminate into the intestine. In any way, HDL binds specifically to eelhepatocytes and probably binds to the HDL receptor of the hepatocytes. However, the ligand forthe HDL receptor have not been identified in fish. In mammals, the ligand for HDL receptors isknown to be apoAI (Acton et al. 1996). However, apoAI or AII of eel serum HDL did notfunction as the ligand for the HDL receptor, as shown in Fig. 24 and Table 19. This seems to bedue to a high concentration of HDL in eel serum, actually the HDL concentration was calculatedas 1.25 × 10⁻⁵ mol L–1. Whereas the Kd value for the HDL receptor of eel hepatocytes wasdetermined to be 40 μg protein HDL mL–1, which corresponds to 1 × 10⁻⁷ mol L–1. The HDLconcentration was calculated on the assumption that the concentration of eel serum HDL is about500 mg dL–1 and the molecular weight of HDL is 400,000. Each HDL molecule contains fiveapoAI and AII molecules as described in Section 4-4C.
Ganglioside GM4 was purified from eel serum HDL and stimulated the binding of FITC-HDL to hepatocytes and to plasma membrane proteins (Fig. 27, Table 19). GM1 inhibited bind-ing of FITC-HDL to plasma membrane proteins (Fig. 27). Furthermore, in the presence of non-labeled HDL incubated preliminarily with GM4, the binding of FITC-HDL to the eel hepatocyteswas inhibited (Table 19). These results show that GM4 in eel HDL is the ligand for the HDLreceptor. The molar ratio of apoAI to GM4 was calculated as 20. As 1 molecule of HDL contains5 molecules of apoAI and AII, 1 molecule of HDL among 4 molecules of HDL contains 1 moleculeof GM4. If the hypothesis that 1 molecule of HDL contains 20 molecules of GM4 is acceptable,the concentration of the HDL with GM4 is 1/80 of the HDL without GM4. Namely, the concen-tration of HDL with GM4 is calculated as 1.56 × 10⁻⁷ mol L–1, which is comparable with Kd
value of 1 × 10⁻⁷ mol L–1.This is the first report that GM4 is the ligand for the HDL receptor. Further investigations
on the HDL receptor of fish including eel are necessary. Scavenger receptor BI (SR-BI) is themost well investigated as the HDL receptor in mammals. Recently, SR-BI of Atlantic salmonhas been cloned (Kleveland et al. 2006). This has revealed that expressed salmon SR-BI hasapproximately 80 kDa on reducing SDS-PAGE. Among eel plasma membrane proteins, 80 kDa
52 Studies on Eel Liver Functions Using Perfused Liver and Primary Cultured Hepatocytes
Aqua-BioScience Monographs VOL. 1 NO. 2 2008
protein was also detected by ligand blotting with FITC-HDL, but this 80 kDa protein has not yetbeen cloned.
5-3C. Induction of vitellogenin synthesis by cultured eel hepatocytesCharacteristic of vitellogenin induction in cultured eel hepatocytes by estradiol-17β (E2)
is the necessity of a pharmacological dose of E2. If cultured hepatocytes were prepared from animmature eel, 10–4 M E2 would be necessary for vitellogenin induction. However, if culturedhepatocytes were prepared from the immature eel injected preliminarily with E2, vitellogeninwould be induced by 10–6 M E2, which is a physiological concentration, but in the absence of10–6 M E2 vitellogenin would not be induced in the same hepatocytes. Todo et al. (1995) havereported that the Kd value of E2 receptor is known to be of nM order. An E2 concentration suchas 10–4 M is not necessary to bind to an E2 receptor, perhaps the amount of E2 receptor inimmature eel hepatocytes seems to be too small to bind to E2. Cultured hepatocytes preparedfrom an immature eel preliminarily injected E2 seems to be present in a large amount of E2receptor. E2 probably not only induces vitellogenin but also the E2 receptor in vivo.
5-4. General Discussion
Glucose, glycogen, and lipids are important energy materials. These materials seem toplay important roles in the spawning migration of eel. Gluconeogenesis, glycogen synthesis,and lipoprotein synthesis, therefore, also seem to play important roles.
Gluconeogenesis, glycogen synthesis, and lipoprotein synthesis also are all important liverfunctions. Perfused eel liver, isolated eel hepatocytes, and cultured eel hepatocytes have made itpossible to quantitatively investigate all these important liver functions.
Gluconeogenesis was investigated by using perfused eel livers and isolated eel hepatocytes,and a novel pathway for gluconeogenesis in eel liver has been clarified which is different fromthose in rat and pigeon livers.
Glycogen synthesis and degradation was investigated by using cultured eel hepatocytesand unique results were as follows: Glucagon at 10–6 and 10–7 M in the presence of 10 mMpyruvate did not stimulate glycogen degradation but the same concentrations of glucagon in thepresence of 10 mM lactate stimulated glycogen degradation. Glycogen synthesis from 10 mMpyruvate was observed, even if 10–6 and 10–7 M glucagon was present. These results suggest thatthe effect of glucagon on glycogen metabolism in eel liver is different from that in mammalianliver.
Lipoprotein synthesis and secretion was investigated by using cultured eel hepatocytes. Ingeneral, fish serums including eel serum contain high concentrations of lipoproteins. The pri-mary function of lipoproteins is to transport lipids between tissues although the reason why eelserum contains high concentrations of lipoproteins is uncertain. The lipoprotein secreted bycultured eel hepatocytes was found to be VLDL-like lipoprotein. The rate of synthesis and se-cretion of VLDL-like lipoprotein by cultured eel hepatocytes was over 30 times higher than thatof VLDL by cultured rat hepatocytes. This seems to reflect the high concentrations of eel serumlipoproteins.
Perfused eel liver, isolated eel hepatocytes, and cultured eel hepatocytes are all usefulmethods for investigating the metabolism of eel. However, some improvements in these meth-ods are necessary. For example, the usefulness of eel serum instead of FBS for cultured eelhepatocytes must be examined in future.
AcknowledgmentsThe authors wish to thank Drs. F.-G. Yu, M.-Q. Tang, D. Ndiaye, M. Komatsu, and H. Katoh of the
Faculty of Fisheries, Kagoshima University, for discussions. We also wish to thank Prof. Matsuda of theFaculty of Fisheries, Kagoshima University, for helping us to analyze lactate dehydrogenase isozymes.Thanks are also due to Prof. M. Ito of the Department of Bioscience and Biotechnology, Kyusyu Univer-sity, for giving us advice on the study of gangliosides, to Mr. S. Yamamoto of the Kagoshima PrefecturalFisheries Technology and Development Center for catching silver and yellow eels in the Sendai River,Kagoshima and to Prof. S. Watabe of the Division of Aquatic Bioscience, the University of Tokyo for

Studies on Eel Liver Functions Using Perfused Liver and Primary Cultured Hepatocytes 53
Aqua-BioScience Monographs VOL. 1 NO. 2 2008
giving us an opportunity to submit this review. We also wish to give sincere thanks to the late Prof.emeritus Z. Ooshiro of the Faculty of Fisheries, Kagoshima University for encouragement during all thestudies and to sincerely thank the late Prof. emeritus S. Utida of the Ocean Research Institute, the Univer-sity of Tokyo, for giving advice on the study on gluconeogenesis. All works were supported in part by aGrant-in-Aid for General Research C (03660215), by a Grant-in-Aid for Basic Research C (07660274)and B (10460095) from the Ministry of Education, Culture, Sports, Science and Technology, Japan.
ReferencesActon S, Rigotti A, Landschulz KT, Xu S, Hobbs HH, Krieger M. Identification of scavenger receptor SR-
BI as a high density lipoprotein receptor. Science 1996; 271: 518–520.Anderson JH, Nicklas WJ, Blank B, Refine C, Williamson JR. Transfer of carbon and hydrogen across the
mitochondrial membrane in the control of gluconeogenesis. In: Söling HD, Willms B (eds). Regula-tion of Gluconeogenesis. Georg Thieme Verlag, Stuttgart; Academic Press, New York, London.1971; pp. 293–315.
Arinze IJ, Rowley DL. Gluconeogenesis by isolated guinea pig liver parenchymal cells. Biochem. J. 1975;152: 393–399.
Arinze IJ, Garber AJ, Hanson RW. The regulation of gluconeogenesis in mammalian liver. J. Biol. Chem.1973; 248: 2266–2274.
Asami O, Nakamura T, Mura T, Ichihara A. Identification of trypsin inhibitor in bovine pituitary extractsas a survival factor for adult rat hepatocytes in primary culture. J. Biochem. 1984; 95: 299–309.
Babin PJ. Apolipoproteins and the association of egg yolk proteins with plasma high density lipoproteinsafter ovulation and follicular atresia in the rainbow trout (Salmo gairdneri). J. Biol. Chem. 1987;262: 4290–4296.
Babin PJ, Vernier J-M. Plasma lipoproteins in fish. J. Lipid Res. 1989; 30: 467–489.Bailey GS, Wilson AC. Homologies between isoenzymes of fishes and those of high vertabrates: Evi-
dence for multiple H4 lactate dehydrogenases in trout. J. Biol. Chem. 1968; 243: 5843–5853.Bell-Quint J, Forte T. Time-related changes in the synthesis and secretion of very low density, low density
and high density lipoproteins by cultured rat hepatocytes. Biochim. Biophys. Acta 1981; 663: 83–98.
Bernard C. When the starting point of experimental research is an hypothesis of a theory. In: Green HC(translator). An Introduction to the Study of Experimental Medicine. Dover Publications, New York.1957; pp. 162–171.
Berry MN. The development of techniques for the preparation of hepatic parenchymal cell suspensions—A history and rationale. In: Tager JM, Söling HD, Williamson JR (eds). Use of Isolated Liver Cellsand Kidney Tubules in Metabolic Studies. North-Holland Publishing Company, Amsterdam. 1976;pp. 131–138.
Berry MN, Friend DS. High-yield preparation of isolated rat liver paranchymal cells. J. Cell Biol. 1969;43: 506–520.
Bissell DM, Mammaker LE, Meyer UA. Parenchymal cells from adult rat liver in nonproliferating monol-ayer culture. J. Cell Biol. 1973; 59: 722–734.
Blennemann B, Leahy P, Kim T-S, Freak HC. Tissue-specific regulation of lipogenic mRNAs by thyroidhormone. Mol. Cell. Endocrinol. 1995; 110: 1–8.
Böttger I, Wieland D, Bridiczka D, Pette D. Intracellular locarization of pyruvate carboxylase and phos-phoenolpyruvate carboxykinase in rat liver. Eur. J. Biochem. 1969; 8: 113–119.
Brunham LR, Kruit JK, Iqbal J, Fievet C, Timmins JM, Pape TD, Coburn BA, Bissada N, Staels B, GroenAK, Hussain MM, Parks JS, Kuipers F, Hayden MR. Intestinal ABCA1 directly contributes to HDLbiogenesis in vivo. J. Clin. Invest. 2006; 116: 1052–1062.
Chatterjee S, Kwiterovich PO. Glycosphingolipids of human plasma lipoproteins. Lipids 1976; 11: 462–466.
Chisada S, Horibata Y, Hama Y, Inagaki M, Furuya N, Okino N, Ito M. The glycosphingolipid receptor forVibrio trachuri in the red sea bream intestine is a GM4 ganglioside which contains 2-hydroxy fattyacids. Biochem. Biophys. Res. Commun. 2005; 333: 367–373.
Chung BH, Wilkinson T, Greer JC, Segrest JP. Preparative and quantitative isolation of plasma lipoproteins:Rapid, single discontinuous density gradient ultracentrifugation. J. Lipid Res. 1980; 21: 284–291.
Clark JTR. The glycosphingolipids of human plasma lipoproteins. Can. J. Biochem. 1980; 59: 412–417.Cornell NW, Lund P, Krebs HA. The effect of lysine on gluconeogenesis from lactate in rat hepatocytes.
Biochem. J. 1974; 142: 327–337.Darnell J, Lodish H, Baltimore D. Insulin and glucagon: Hormonal regulation of blood glucose levels. In:
Darnell J, Lodish H, Baltimore D. Molecular Cell Biology. 2nd ed. Science American Books, NewYork. 1990; pp. 743–748.

54 Studies on Eel Liver Functions Using Perfused Liver and Primary Cultured Hepatocytes
Aqua-BioScience Monographs VOL. 1 NO. 2 2008
Dave G, Johansson-Sjöbeck M-L, Larsson Å, Lewander K, Lidman U. Metabolic and hematological ef-fects of starvation in the European eel, Anguilla anguilla L. Comp. Biochem. Physiol. A 1975; 52:423–430.
Dessau W, Adelmann BC, Timpl R. Identification of the sites in collagen-chains that bind serum antigelatinfactor (cold-insoluble globin). Biochem. J. 1978; 169: 55–59.
Elliot KRF, Pogson CI, Smith SA. Permeability of the liver cell membrane to quinolinate. Biochem. J.1977; 164: 283–286.
Enat R, Jefferson DM, R-Opazo N, Gatmaitan Z, Leinwand LA, Reid LM. Hepatocyte proliferation invitro: Its dependence on the use of serum-free hormonally defined medium and substrata of extra-cellular matrix. Proc. Natl. Acad. Sci. USA 1984; 81: 1411–1415.
Everse J. Barnett RE, Thorne CJR, Kaplan NO. The formation of ternary complexes by diphosphopyrid-ine nucleotide-dependent dehydrogenases. Arch. Biochem. Biophys. 1971; 143: 444–460.
Exton JH, Park CR. Control of gluconeogenesis in liver. J. Biol. Chem. 1967; 242: 2622–2636.Fine IH, Kaplan NO, Kuftinec D. Developmental changes of mammalian lactic dehydrogenases. Bio-
chemistry 1963; 2: 116–121.Fishman PH. Role of membrane ganliosides in the binding and action of bacterial toxins. J. Membr. Biol.
1982; 69: 85–97.Garber AJ, Hanson RW. The interrelationships of the various pathways forming gluconeogenic precursors
in guinea pig liver mitochondria. J. Biol. Chem. 1971; 246: 589–598.Gevers W. The regulation of phosphoenolpyruvate synthesis in pigeon liver. Biochem. J. 1967; 103: 141–
152.Glass C, Pittman RC, Civen M, Steinberg D. Uptake of high-density lipoprotein-associated apoprotein
A-I and cholesterol esters by 16 tissues of the rat in vivo and by adrenal cells and hepatocyes invitro. J. Biol. Chem. 1985; 260: 744–750.
Gómez-Lechón MJ, Castell JV. The cultutre of liver cells. In: Doyle A, Griffiths JB, Newell DG (eds).Cell & Tissue Culture; Laboratory Procedures. John Wiley & Sons, Chichester, New York, Weinheim,Brisbane, Singapore, Toronto. First published 1993, updated 1994; 12B:13.1–12B:13.8.
Gumbmann M, Tappel AL. Pyruvate and alanine metabolism in carp liver mitochondria. Arch. Biochem.Biophys. 1962; 98: 502–515.
Hakomori S. Glycosphingolipids in cellular interaction and oncogenesis. Ann. Rev. Biochem. 1981; 50:733–764.
Haslam JM, Griffiths DE. Factors affecting the translocation of oxaloacetate and L-malate into rat livermitochondria. Biochem. J. 1968; 109: 921–928.
Hayashi S. Gluconeogenesis. In: Nagayama F (ed). Metabolism in Fish. Kouseisha Kouseikaku, Tokyo.1983; pp. 23–34 (in Japanese).
Hayashi S. Primary culture of eel hepatocytes. Iden 1988; 42(7): 6–11 (in Japanese).Hayashi S. Tissue culture of fishes—Culture of eel and carp hepatocytes. In: Miyachi S, Saga N, Matsunaga
T (eds). Labo-Manual of Marine Biotechnology. Shokabo, Tokyo. 1991; pp. 44–57 (in Japanese).Hayashi S. Chemical cell biology of eel. In: Ozawa T, Hayashi S. Science of Eels. Kouseisha Kouseikaku,
Tokyo. 1999; pp. 71–120 (in Japanese).Hayashi S, Komatsu M. Primary culture of eel hepatocytes—Synthesis and secretion of lipoprotein. In:
Doyle A, Griffiths JB, Newell DG (eds). Cell & Tissue Culture; Laboratory Procedures. John Wiley& Sons, Chichester, New York, Weinheim, Brisbane, Singapore, Toronto. First published 1993,updated 1998; 23A:2.1–23A:2.10.
Hayashi S, Ooshiro Z. Gluconeogenesis and glycolysis in isolated perfused liver of the eel. Nippon SuisanGakkaishi 1975a; 41: 201–208.
Hayashi S, Ooshiro Z. Incorporation of 14C-lactate into glucose by perfused eel liver. Nippon SuisanGakkaishi 1975b; 41: 791–796.
Hayashi S, Ooshiro Z. Preparation of isolated cells of eel lver. Nippon Suisan Gakkaishi 1978; 44: 499–503.
Hayashi S, Ooshiro Z. Gluconeogenesis in isolated liver cells of the eel, Anguilla japonica. J. Comp.Physiol. B 1979; 132: 343–350.
Hayashi S, Ooshiro Z. Gluconeogenesis and energy metabolism in the isolated liver cells of the silver andyellow eel. Nippon Suisan Gakkaishi 1985a; 51: 117–120.
Hayashi S, Ooshiro Z. Effect of oleic acid on gluconeogenesis in the isolated liver cells of eel. NipponSuisan Gakkaishi 1985b; 51: 447–452.
Hayashi S, Ooshiro Z. Primary culture of the freshly isolated liver cells of the eel. Nippon Suisan Gakkaishi1985c; 51: 765–771.
Hayashi S, Ooshiro Z. Effects of glucagon, insulin, and the eel serum in the eel liver cells in primaryculture. Nippon Suisan Gakkaishi 1985d; 51: 1123–1127.
Studies on Eel Liver Functions Using Perfused Liver and Primary Cultured Hepatocytes 55
Aqua-BioScience Monographs VOL. 1 NO. 2 2008
Hayashi S, Ooshiro Z. Primary culture of the eel hepatocytes in the serum-free medium. Nippon SuisanGakkaishi 1986; 52: 1641–1651.
Hayashi S, Yu F-G. Lipoprotein synthesis and secretion by cultured eel (Anguilla japonica) hepatocytes.Comp. Biochem. Physiol. B 1993; 105: 443–448.
Hayashi S, Ise K, Itakura T, Ooshiro Z. Biochemical properties of glutamate dehydrogenase purified fromeel liver. Nippon Suisan Gakkaishi 1982a; 48: 697–701.
Hayashi S, Ooshiro Z, Itakura T. Stimulatory effect of ethanol on gluconeogenesis from lactate in theisolated liver cells of the eel. Nippon Suisan Gakkaishi 1982b; 48: 1789–1793.
Hayashi S, Ooshiro Z, Itakura T, Masuda Y. Biochemical properties of the lactate dehydrogenase purifiedfrom the eel liver. Nippon Suisan Gakkaishi 1985; 51: 79–85.
Hems R, Ross BD, Berry MN, Krebs HA. Gluconeogenesis in the perfused rat liver. Biochem. J. 1966;101: 284–292.
Inui Y, Yokote M. Gluconeogenesis in the eel—II Gluconeogenesis in the alloxanized eel. Nippon SuisanGakkaishi 1975a; 41: 291–300.
Inui Y, Yokote M. Gluconeogenesis in the eel—IV Gluconeogenesis in the hydrocortisone-administeredeel. Nippon Suisan Gakkaishi 1975b; 41: 973–981.
Jomain-Baum M, Hanson RW. Regulation of hepatic gluconeogenesis in the guinea pig by fatty acids andammonia. J. Biol. Chem. 1975; 250: 8978–8985.
Katoh H, Ge Y-P, Ndiaye D, Hayashi S. Distribution of apolipoprotein A-I and A-II in serum, secretedproteins by cultured hepatocytes, and the plasma membrane of hepatocytes in eel. Fish. Sci. 2000;66: 579–585.
Keppler D, Decker K. Glycogen. In: Bergmeyer HU, Bergmeyer J, Graßl M (eds). Methods of EnzymaticAnalysis. Verlag Chemie GmbH, Weinheim. 1984; pp. 11–18.
Kivatinitz SC, Favini P, Ghidoni R. Ganglioside released by the perfused rat liver are associated to highdensity lipoprotein. Biochem. Int. 1992; 26: 821–829.
Kleveland EJ, Syvertsen BL, Ruyter B, Vegusdal A, Jørgensen SM, Gjøen T. Characterization of scaven-ger receptor class B, type I in Atlantic salmon (Salmo salar L.). Lipids 2006; 41: 1017–1027.
Komatsu M, Hayashi S. Pharmacological dose of estradiol-17β induces vitellogenin synthesis in culturedhepatocytes of immature eel Anguilla japonica. Fish. Sci. 1997; 63: 989–994.
Komatsu M, Hayashi S. Optimal conditions for estradiol-17β induced vitellogenin synthesis by culturedhepatocytes of eel Anguilla japonica. Fish. Sci. 1998; 64: 658–659.
Kondo H, Watabe S. Growth promoting effects of carp serum components on goldfish culture cells. Fish.Sci. 2006; 72: 884–888.
Kondo H, Kawazoe I, Nakaya M, Kikuchi K, Aida K, Watabe S. The novel sequences of major plasmaapolipoproteins in the eel Anguilla japonica. Biochim. Biophys. Acta 2001; 1531: 132–142.
Krebs HA. The effect of ethanol on the metabolic activities of the liver. Adv. Enz. Reg. 1968; 6: 467–480.Krebs HA, Gascoyne T, Notton BM. Generation of extramitochondrial reducing power in gluconeogen-
esis. Biochem. J. 1967; 102: 275–282.Kumagai A, Hayashi S. Participation of high-density lipoprotein in vitellogenesis in Japanese eel
hepatocytes. Comp. Biochem. Physiol. B 2005; 140: 543–550.Kumagai A, Chiseda S, Kamei Y, Ito M, Hayashi S. Ganglioside from eel serum high density lipoprotein
(HDL) and its role as a ligand for HDL binding protein. Comp. Biochem. Physiol. B 2007; 147:635–644.
Kunst A, Draeger B, Ziegenhorn J. Colorimetric methods with glucose oxidase and peroxidase. In:Bergmeyer HU, Bergmeyer J, Graßl M (eds). Methods of Enzymatic Analysis. Verlag Chemie GmbH,Weinheim. 1984; pp. 178–185.
Lamprecht W, Heinz F. Pyruvate. In: Bergmeyer HU, Bergmeyer J, Graßl M (eds). Methods of EnzymaticAnalysis. Verlag Chemie GmbH, Weinheim. 1984; pp. 570–577.
Lardy HA, Paetkau V, Walter P. Paths of carbon in gluconeogenesis and lipogenesis: The role of mito-chondria in supplying precursors of phosphoenolpyruvate. Proc. Natl. Acad. Sci. USA 1965; 53:1410–1415.
Larsson Å, Lewander K. Metabolic effects of starvation in the eel, Anguilla anguilla L. Comp. Biochem.Physiol. A 1973; 44: 367–374.
Leitersdorf E, Stein O, Eisenberg S, Stein Y. Uptake of rat plasma HDL subfractions labeled with [3H]cholesteryl linoleil ether or with 125I by cultued rat hepatocytes and adrenal cells. Biochim. Biophys.Acta 1984; 796: 72–82.
Li YT, Sugiyama E, Ariga T, Nakayama J, Hayama M, Hama Y, Nakagawa H, Tai T, Maskos K, Li SC,Kasama T. Association of GM4 ganglioside with the membrane surrounding lipid droplets in sharkliver. J. Lipid Res. 2002; 43: 1019–1025.

56 Studies on Eel Liver Functions Using Perfused Liver and Primary Cultured Hepatocytes
Aqua-BioScience Monographs VOL. 1 NO. 2 2008
Lin C-T, Palmer W, Wu J-Y, Chan L. Estrogen induction of very low density apolipoprotein II synthesis,a major avian liver yolk protein, involves the recruitment of hepatocytes. Endocrinology 1986; 118:538–544.
March SC, Parikh I, Cuatrecasa P. A simplified method for cyanogen bromide activation of agarose foraffinity chromatography. Anal. Biochem. 1974; 60: 149–152.
McKay MC, Lee RF, Smith MAK. The characterization of the plasma lipoproteins of the channel catfishIchtalurus punctatus. Physiol. Zool. 1985; 58: 693–704.
Meijer AJ, Gimpel JA, Deleeuw G, Tischler ME, Tager JM, Williamson JR. Interrelationships betweengluconeogenesis and ureogenesis in isolated hepatocytes. J. Biol. Chem. 1978; 253: 2308–2320.
Miller LL. History of isolated liver perfusion and some still unsolved problems. In: Bartosek I, GuaitaniA, Miller LL (eds). Isolated Liver Perfusion and Its Application. Raven Press, New York. 1973;pp. 1–9.
Miller LL, Bly CG, Watson ML, Bale WF. The dominant role of the liver in plasma protein synthesis—Adirect study of the siolated perfused rat liver with the aid of lysine-ε-14C. J. Exptl. Med. 1951; 94:431–453.
Mitchel YB, Rifici VA, Edler HA. Characterization of the specific binding of rat apolipoprotein E-defi-cient HDL to rat hepatic plasma membranes. Biochim. Biophys. Acta 1987; 917: 324–332.
Morrison JR, McPherson GA, Fidge NH. Evidence for two sites on rat liver plasma membranes whichinteract with high density lipoproteins 3. J. Biol. Chem. 1992; 267: 13205–13209.
Ndiaye D, Hayashi S. Effect of docosahexaenoic acid on lipoprotein synthesis and secretion by culturedeel hepatocytes. Cell Struct. Funct. 1996; 21: 307–315.
Ndiaye D, Hayashi S. A lipoprotein secreted by cultured hepatocytes of silver or yellow eel: Comparisonwith their plasma lipoproteins. Comp. Biochem. Physiol. B 1997a; 116: 209–216.
Ndiaye D, Hayashi S. Stimulative effect of thyroxine on lipogenesis and lipoprotein synthesis by culturedeel hepatocytes. Fish. Sci. 1997b; 63: 304–309.
Ndiaye D, Mori Y, Tanaka Y, Sakata T, Miki H, Sakakibara T, Sato M, Hayashi S. Effect of specificbinding of high density lipprotein to eel hepatocytes on their secretion of lipoprotein. Cell Struct.Funct. 1995; 20: 301–310.
Noll F. L-(+)-Lactate. In: Bergmeyer HU, Bergmeyer J, Graßl M (eds). Methods of Enzymatic Analysis.Verlag Chemie GmbH, Weinheim. 1984; pp. 582–588.
Nordlie RC, Lardy HA. Mammalian liver phosphoenolpyruvate carboxykinase activity. J. Biol. Chem.1963; 238: 2259–2263.
Ogihara M. Correlation between lactate dehydrogenase isozyme patterns of mammalian livers and dietaryenvironment. In: Markert CL (ed). Isozymes, Vol. 2. Academic Press, New York. 1975; pp. 157–170.
Rognstad R, Katz J. Gluconeogenesis in the kidney cortex. Biochem. J. 1970; 116; 483–491.Saito M, Kitamura H, Sugiyama K. Liver gangliosides of various animal ranging from fish to mammalian
species. Comp. Biochem. Physiol. B 2001; 129: 747–758.Sasaki M. Glucose, serum (plasma). In: Shibata S, Sasaki M. Methods of Ultra Micro Analysis in Clinical
Chemistry. Kin Poo Do, Kyoto. 1969; pp. 160–167 (in Japanese).Sensabaugh GF, Kaplan NO. A lactate dehydrogenase specific to the liver of gadoic fish. J. Biol. Chem.
1972; 247: 585–593.Senn HJ, Orth M, Fitzke E, Wieland H, Gerok W. Gangliosides in normal human serum concentration,
pattern and transport by lipoproteins. Eur. J. Biochem. 1989; 181: 657–662.Söling HD, Kleineke J. Species dependent regulation of hepatic gluconeogenesis in higher animals. In:
Hanon RW, Mehlman MA (eds). Gluconeogenesis, Its Regulation in Mammalian Species. JohnWiley & Sons, New York, London, Sydney, Toronto. 1976; pp. 369–462.
Söling HD, Willms B, Friedrichs D, Kleineke J. Regulation of gluconeogenesis by fatty acid oxidation inisolated perfused livers of non-starved rats. Eur. J. Biochem. 1968; 4: 364–372.
Söling HD, Willms B, Kleineke J, Gehlhoff M. Regulation of gluconeogenesis in the guinea pig liver.Eur. J. Biochem. 1970; 16: 289–302.
Söling HD, Willms B, Kleineke J. Regulation of gluconeogenesis in rat and guinea pig liver. In: SölingHD, Willms B (eds). Regulation of Gluconeogenesis. Georg Thieme Verlag, Stuttgart; AcademicPress, New York, London. 1971; pp. 210–226.
Tang M-Q, Ando S, Yamada S, Hayashi S. The trypsin-catalyzed activation of glutamate dehydrogenasepurified from eel liver. J. Biochem. 1992; 111: 655–661.
Tarlow DM, Watkins PA, Reed RE, Miller RS, Zwergel EE, Lane MD. Lipogenesis and the synthesis andsecretion of very low density lipoproein by avian liver cells in nonproliferating monolayer culture.J. Cell Biol. 1977; 73: 332–353.

Studies on Eel Liver Functions Using Perfused Liver and Primary Cultured Hepatocytes 57
Aqua-BioScience Monographs VOL. 1 NO. 2 2008
Todo T, Adachi S, Saeki F, Yamauchi K. Hepatic estrogen receptors in the Japanese eel, Anguilla japonica:Characterization and changes in binding capacity during artificially-induced sexual maturation. Zool.Sci. 1995; 12: 789–794.
Todo T, Adachi S, Yamauchi K. Molecular cloning and characterization of Japanese eel estrogen receptorcDNA. Mol. Cell. Endocrinol. 1996; 119: 37–45.
Tsujita M, Wu C-A, Abe-Dohmae S, Usui S, Okazaki M, Yokoyama S. On the hepatic mechanism of HDLassembly by the ABCA1/apoAI pathway. J. Lipid Res. 2005; 46: 154–162.
Tutwiler GF, Brentzel HJ. Relation of oxidtion of long-chain fatty acids to gluconeogenesis in the perfusedliver of the guinea pig. Eur. J. Biochem. 1982; 124: 465–470.
Ui M, Tokumitsu Y. Isolated hepatocytes as an in vitro system useful for studying metabolic regulation.Protein Nucleic Acid Enzyme 1979; 24: 3–13 (in Japanese).
Walton MJ, Cowey CB. Gluconeogenesis by isolated hepatocytes from rainbow trout Salmo gairdneri.Comp. Biochem. Physiol. B 1979; 62: 75–79.
Whitt GS, Shaklee JB, Markert CL. Evolution of the lactate dehydrogenase isozymes of fishes. In: MarkertCL (ed). Isozymes, Vol. 4. Academic Press, New York. 1975; pp. 381–400.
Williamson JR, Kreisberg RA, Felts PW. Mechanism for the stimulation of gluconeogenesis by fatty acidsin perfused rat liver. Proc. Natl. Acad. Sci. USA 1966; 56: 247–254.
Yokoyama S. ABCA1-mediated generation of HDL and its nontranscriptional regulation. Seikagaku 2004;76: 532–538 (in Japanese).
Yu F-G, Ando S, Hayashi S. Characterization of lipoprotein secreted by cultured eel hepatocytes and itscomparison with serum lipoproteins. Cell Struct. Funct. 1991; 16: 347–355.
Yu F-G, Ando S, Hayashi S. Conversion of the lipoprotein secreted by cultured eel hepatocytes to highdensity lipoprotein. Comp. Biochem. Physiol. B 1992; 103: 321–327.