Bilirubin Kinetics in Intact Rats and Isolated Perfused Liver
13
Bilirubin Kinetics in Intact Rats and Isolated Perfused Liver EVIDENCE FOR HEPATIC DECONJUGATION OF BILIRUBIN GLUCURONIDES JOHN GOLLAN, LYDIA HAMMAKER, VOJTECH LICKO, and RUDI SCHMID, Department of Medicine, the Liver Center, and Cardiovascular Research Institute, University of California School of Medicine, San Francisco, California 94143 A B S T R A C T Most previous compartmental models describing bilirubin transport and metabolism in the liver have been validated solely by analysis of the plasma disappearance of radiolabeled bilirubin in hu- man subjects. We now have determined the trans- port kinetics of a bilirubin tracer pulse by analysis of plasma, liver, and bile radioactivity data from 30 intact rats. Plasma [3H]bilirubin disappearance was best de- scribed by the sum of three exponentials, and a six-com- partment model, derived by simulation analysis, was necessary and adequate to describe all experimental data. Examination of the injected radiolabeled bili- rubin by extraction with hexadecyltrimethylam- monium bromide and thin-layer chromatography re- vealed that 6.6% (mean) of the original pigment had been degraded to labeled nonbilirubin derivatives dur- ing preparation of the tracer dose. This material ex- hibited a significantly longer half-life (mean 50.6 min) of the plasma terminal exponential than that of authen- tic radiobilirubin (20.6 min). In isolated perfused rat liver, the kinetics of [3H]bilirubin in perfusate and bile readily fitted the proposed model. Compatibility of the model with the data obtained, both in the isolated liver and in vivo, required that a fraction of bilirubin con- jugated in the liver be deconjugated and returned to the plasma. Deconjugation of bilirubin glucuronides was evalu- ated directly by infusion of bilirubin monogluc- uronides, containing '4C in the glucuronosyl group, into rats with an external bile fistula. Since metabolic degradation of hydrolyzed 14C-labeled glucuronic acid This paper was presented in part in November 1979 at the Annual Meeting of the American Association for the Study of Liver Disease (1). Address reprint requests to Dr. Gollan. Receivedfor publication 31 March 1980 and in revisedform 5 November 1980. yields 14CO2, this was measured in expired air. Whereas 86% of the administered labeled pigment was re- covered in bile, 7% of the label appeared in "4CO2. These findings directly validate a portion of the pro- posed kinetic model and suggest that hepatic deconju- gation of a small fraction of bilirubin glucuronides is a physiological event. Deconjugation may also account, at least in part, for the presence of increased concen- trations of unconjugated bilirubin in the plasma of pa- tients with cholestasis. INTRODUCTION Kinetic analysis and mathematical modeling of plasma bilirubin-IXa (bilirubin)l disappearance curves have provided important insight into the complex processes of hepatic bilirubin transport and metabolism (2). Al- though in early studies large doses of unlabeled pig- ment had been used (3), the subsequent availability of isotopically labeled bilirubin of high specific activity (4, 5) permitted experiments to be performed under more physiological conditions using tracer doses of the pigment. These investigations (2, 6-11), which pro- vided a measure of the rates of hepatic bilirubin clear- ance and bilirubin production, resulted in the formula- tion of a three-compartment model that adequately de- scribed the metabolism of unconjugated bilirubin. In addition, more complex models have been proposed to accommodate the bilirubin fractions derived from turn- over of hepatic heme and hemoproteins (12-14). These models have been used to interpret data derived from plasma radiobilirubin disappearance studies in various human disorders associated with unconjugated hyperbilirubinemia (13, 15-19). 1 Abbreviations used in this paper: bilirubin, bilirubin-IXa; BMG, bilirubin monoglucuronide; BDG, bilirubin diglu- curonide: TLC, thin-layer chromatography. J. Clin. Invest. ©D The American Society for Clinical Investigation, Inc. - 0021-9738/81104/1003/13 $1.00 Volume 67 April 1981 1003 -1015 1003
Transcript of Bilirubin Kinetics in Intact Rats and Isolated Perfused Liver
Bilirubin Kinetics in Intact
Rats and Isolated Perfused Liver
EVIDENCE FOR HEPATIC
DECONJUGATION OF BILIRUBIN GLUCURONIDES
JOHN GOLLAN, LYDIA HAMMAKER, VOJTECH LICKO, and RUDI SCHMID, Departmentof Medicine, the Liver Center, and Cardiovascular Research Institute,University of California School of Medicine, San Francisco, California 94143
A B S T R A C T Most previous compartmental modelsdescribing bilirubin transport and metabolism in theliver have been validated solely by analysis of theplasma disappearance of radiolabeled bilirubin in hu-man subjects. We now have determined the trans-port kinetics of a bilirubin tracer pulse by analysis ofplasma, liver, and bile radioactivity data from 30 intactrats. Plasma [3H]bilirubin disappearance was best de-scribed by the sum ofthree exponentials, and a six-com-partment model, derived by simulation analysis, wasnecessary and adequate to describe all experimentaldata. Examination of the injected radiolabeled bili-rubin by extraction with hexadecyltrimethylam-monium bromide and thin-layer chromatography re-vealed that 6.6% (mean) of the original pigment hadbeen degraded to labeled nonbilirubin derivatives dur-ing preparation of the tracer dose. This material ex-hibited a significantly longer half-life (mean 50.6 min)of the plasma terminal exponential than that ofauthen-tic radiobilirubin (20.6 min). In isolated perfused ratliver, the kinetics of [3H]bilirubin in perfusate and bilereadily fitted the proposed model. Compatibility of themodel with the data obtained, both in the isolated liverand in vivo, required that a fraction of bilirubin con-jugated in the liver be deconjugated and returned tothe plasma.
Deconjugation of bilirubin glucuronides was evalu-ated directly by infusion of bilirubin monogluc-uronides, containing '4C in the glucuronosyl group,into rats with an external bile fistula. Since metabolicdegradation of hydrolyzed 14C-labeled glucuronic acid
This paper was presented in part in November 1979 at theAnnual Meeting of the American Association for the Study ofLiver Disease (1).Address reprint requests to Dr. Gollan.Receivedfor publication 31 March 1980 and in revisedform
5 November 1980.
yields 14CO2, this was measured in expired air. Whereas86% of the administered labeled pigment was re-covered in bile, 7% of the label appeared in "4CO2.These findings directly validate a portion of the pro-posed kinetic model and suggest that hepatic deconju-gation of a small fraction of bilirubin glucuronides is aphysiological event. Deconjugation may also account,at least in part, for the presence of increased concen-trations of unconjugated bilirubin in the plasma of pa-tients with cholestasis.
INTRODUCTION
Kinetic analysis and mathematical modeling of plasmabilirubin-IXa (bilirubin)l disappearance curves haveprovided important insight into the complex processesof hepatic bilirubin transport and metabolism (2). Al-though in early studies large doses of unlabeled pig-ment had been used (3), the subsequent availabilityof isotopically labeled bilirubin ofhigh specific activity(4, 5) permitted experiments to be performed undermore physiological conditions using tracer doses of thepigment. These investigations (2, 6-11), which pro-vided a measure of the rates of hepatic bilirubin clear-ance and bilirubin production, resulted in the formula-tion of a three-compartment model that adequately de-scribed the metabolism of unconjugated bilirubin. Inaddition, more complex models have been proposed toaccommodate the bilirubin fractions derived from turn-over ofhepatic heme and hemoproteins (12-14). Thesemodels have been used to interpret data derivedfrom plasma radiobilirubin disappearance studies invarious human disorders associated with unconjugatedhyperbilirubinemia (13, 15-19).
1 Abbreviations used in this paper: bilirubin, bilirubin-IXa;BMG, bilirubin monoglucuronide; BDG, bilirubin diglu-curonide: TLC, thin-layer chromatography.
J. Clin. Invest. ©D The American Society for Clinical Investigation, Inc. - 0021-9738/81104/1003/13 $1.00Volume 67 April 1981 1003 -1015
1003
All of these investigations were carried out in hu-mans and hence validation of the proposed compart-mental models was restricted to analysis of data ob-tained from a single compartment, e.g., plasma radio-bilirubin disappearance. Indeed, in only two subjectswere data obtained from bile, namely in an individualwith an external bile fistula (8) and in a patient withGilbert's syndrome in whom bile was collected fromthe duodenum (13). To minimize the assumptions re-quired in formulating a model and thus to reduce in-herent ambiguities and uncertainties, it is desirable toverify experimentally as many of the proposed com-partments as possible. Although use of experimentalanimals permits serial sampling of bile and liver, ani-mal studies with radiolabeled bilirubin have beencarried out only in intact rats to define plasma disap-pearance (20, 21) and in isolated rat liver perfused withan erythrocyte-containing medium to determine bili-rubin kinetics in perfusate and bile (22). With rosebengal dye, on the other hand, experiments in rats havebeen reported in which plasma, liver, and intestinalcontents were sampled serially (23).
In the present study a new and more sensitive pro-cedure for quantitation of plasma bilirubin has beenused, obviating the use of the Weber-Schalm solvent-partition method (24) that has been widely adopted(8, 22, 25) despite its documented inaccuracies (8,26-28). Using this procedure we have examined thehepatic transport kinetics of radiobilirubin in 30 intactrats and developed a compartmental model that de-scribed all experimental data obtained from plasma,liver, and bile. The proposed model, which was vali-dated by kinetic studies in isolated rat liver perfusedwith a heme-free fluorocarbon medium, differs from ex-isting models in predicting that a fraction of bilirubinglucuronides in the liver undergoes deconjugation withreturn of unconjugated bilirubin so formed to theplasma. This prediction was verified experimentally bymeasurement of 14CO2 production in rats infused withbilirubin [14C]monoglucuronide.
METHODS
Chemicals and radiolabeled pigmentsBilirubin consisting of at least 94% IXa isomer was obtained
from Koch-Light Lab., Ltd. (Colnbrook, Buckinghamshire,U. K.) or Porphyrin Products (Logan, Utah) and recrystallizedbefore use (29). [3H]Bilirubin (sp act 43 ,uCi/4tmol) preparedbiosynthetically (4) from the bile of rats injected with 8-amino[3,5-3H]levulinic acid (1.2 Ci/mmol, New England Nuclear,Boston, Mass.) was stored in vacuo in the dark and recrys-tallized to constant specific activity before use. Bilirubin-IXa 1-0-acyl ,8-D-mono-[U-_4C]glucuronide (BMG) was pre-pared by incubating bilirubin-IXa and UDP-[U-_4C]gluc-uronic acid (231 mCi/mmol, New England Nuclear) withdigitonin-activated liver microsomes from rats pretreatedwith phenobarbital (administered for 7 d in drinking water,0.1% wt/vol). Details of the incubation, extraction, and
chromatographic isolation of BMG have been described (30,31). The pigment was quantitated spectrophotometrically as-suming E450 60 x 103 liter- mol-' * cm-' for BMG in methanol.The yield of labeled BMG was 30% and the preparation con-tained 90-93% authentic BMG in addition to 4% BDG and3-6% nonradioactive unconjugated bilirubin (32). Wheneluted from silica gel with methanol and promptly evaporatedto dryness and stored in the dark under argon at -20°C, BMGpreparations were stable for at least 2 d. Immediately beforeinjection, the BMG was dissolved directly in normal ratserum, whereas [3H]bilirubin was dissolved in a small volumeof 0.1 M NaOH and then added to 14 vol of rat serum. Allprocedures were carried out in subdued light to minimizephotodegradation of pigments.
[3H]Bilirubin kinetics-intact ratsFed male Sprague-Dawley rats (Simonsen Laboratories,
Inc., Gilroy, Calif.) weighing 375±5 g (±SEM) were used.During the experiments they were warmed by infrared lamps.The left jugular vein was cannulated with PE-10 tubing (ClayAdams Div., Becton, Dickinson & Co., Parsippany, N. J.)under ether anesthesia, and in experiments of <30 min dura-tion light ether anesthesia was maintained throughout thestudy. The animals were hydrated by infusion of 5% (wt/vol)glucose in aqueous 0.15 M NaCl (1.5 ml/h) in studies lasting>5 min. A bolus of 0.05 ,umol [3H]bilirubin in a total volumeof 0.3 ml was administered through the jugular cannula im-mediately after dissolving the pigment in serum. Additionalexperimental details relating to the collection of samples areoutlined below.Plasma disappearance. A PE-50 cannula was inserted into
the left carotid artery to permit rapid collection of blood intoheparinized Natelson capillary tubes (Scientific Products Inc.,McGaw Park, Ill.). Plasma disappearance of [3H]bilirubin wasmeasured in 16 rats for up to 120 min after injection. Fourseries of experiments were performed during which six toeight blood samples of 0.2 ml were obtained at different butoverlapping time intervals after injection: (a) at 20-s intervalsfrom 30 to 150 s, (b) at 1-min intervals from 1 to 5 min (c)at 5-min intervals from 5 to 30 min, and (d) at 10, 20, 30, 45,60, 90, and 120 min. The capillary tubes were centrifuged andthe plasma was removed for measurement oftotal radioactivityand unconjugated [3H]bilirubin (see Analytical procedures).To ascertain that plasma bilirubin disappearance was not af-fected by anesthesia, [3H]bilirubin was injected into four re-strained rats at least 60 min after cessation of anesthesia andblood samples were obtained at the intervals outlined above.
Liver. Total radioactivity in liver was measured in 11separate experiments at intervals ranging from 5 to 120 minafter intravenous injection of [3H]bilirubin. Each experi-ment was terminated by rapid cannulation of the portal veinand perfusion of the liver with 35 ml of ice-cold 0.154 M KCI.The liver was resected promptly and weighed (mean liverweight, 12.8±0.5 g), and a 25% (wt/vol) homogenate was pre-pared in 0.154 M KCI solution. Radioactivity was then deter-mined in duplicate in 0.4-ml aliquots of homogenate and theresults were calculated for total liver.
Bile. After a series ofpreliminary studies that had definedoptimal experimental conditions, biliary excretion of [3H]bili-rubin was examined in a group of three rats placed in wirerestraining cages following cannulation ofthe bile duct with a10-cm length of PE-50. Bile was collected into tared tubesand bile flow was determined gravimetrically. After a 30-mincontrol period, when it was ensured that bile flow was con-stant, [3H]bilirubin was administered as an intravenous bolus.Bile was then collected continuously for 2.5-min periods overthe initial 30 min, for 5-min periods over the next 30 min, and
1004 J. Gollan, L. Hammaker, V. Licko, and R. Schmid
as a single collection over the ensuing 60 min. Radioactivitywas measured in a 50-,ul aliquot of each bile sample.
[3H]Bilirubin kinetics -isolated perfusedliverIsolated rat livers were perfused with a hemoglobin-free
medium consisting of a perfluorochemical emulsion as oxy-gen-carrier in a Krebs-Ringer bicarbonate solution (Fluosol-43, Alpha Therapeutic Corp., Los Angeles, Calif.). In addi-tion fraction V bovine serum albumin (1% wt/vol, SigmaChemical Co., St. Louis, Mo.), 22.3 ,uM sodium tauro-cholate (Calbiochem-Behring Corp., American Hoechst Corp.,San Diego, Calif.) and penicillin (100 U/ml) were includedin the medium. This solution was thoroughly mixed, passedthough a 10 ,(M Millipore filter (Millipore Corp., Bedford,Mass.), and the pH adjusted to 7.45 with 0.1 M NaHCO3. Inpreliminary studies it was ascertained that the constituents ofFluosol-43 did not bind bilirubin.The perfusion system, housed in a thermostatically con-
trolled lucite cabinet, contained 50 ml of perfusate that wasrecirculated by means of a peristaltic pump (Multiperpex2115, LKB Instruments, Bromma, Sweden). The medium wasstirred in a glass reservoir and then passed in sequencethrough a membrane oxygenator (33) comprising 4 m ofcoiledSilastic tubing (0.147 cm i.d., 0.196 cm o.d., Dow-CorningCorp., Midland, Mich.), a temperature-sensitive probe con-nected to a thermostat (maintained at 370C), a stainless steelfilter screen (Millipore Corp.), a bubble trap and pressuregauge, and eventually the portal vein through a teflon cannula.The perfusate was oxygenated initially with a mixture of95%02 and 5% CO2 at a flow rate of 400 ml/min until just beforethe isolated liver was placed in the circuit, at which time100% 02 was introduced and continued for the rest of theexperiment.Male Sprague-Dawley rats weighing 360-380 g were used
as liver donors. In general the operative technique de-scribed by Hems et al. (34) was used. Under ether anesthesiathe bile duct was cannulated with PE-10 tubing. The portalvein was cannulated with a 16 gauge catheter (Angiocath,Deseret Pharmaceuticals, Sandy, Utah), the liver was flushedwith 400 IU heparin (Liquaemin) in 0.8 ml 0.15 M NaCl Per-fusion was commenced with an oxygenated Krebs-HenseleitRinger bicarbonate solution (35) containing 2% (wt/vol) glu-cose, at about 8 ml/min. The interval between interruption ofportal blood flow and commencing perfusion amountedto <40 s. The inferior vena cava was then cannulated abovethe diaphragm; the liver was dissected from the animal, trans-ferred to the perfusion chamber on nylon mesh, and connectedto the recirculating Fluosol-43 medium. A constant perfusionrate of 25 ml/min was maintained in all experiments, with aportal pressure of -3 cmH2O. To stabilize bile flow, sodiumtaurocholate was infused into the reservoir at a rate of 0.56,tmol/min. All perfusions were conducted in dim light to pre-vent photodegradation of bilirubin.
After a 30-min equilibration period, [3Hlbilirubin (0.05,mol) was added as a bolus to the reservoir. Perfusate sam-ples (0.5 ml) were removed from the reservoir at frequent in-tervals for 120 min. The samples were centrifuged at 27,000 gfor 10 min to separate the fluorocarbon particles and totalradioactivity was measured in aliquots of supernatant fluid.Similarly, bile collected periodically for 120 min into taredtubes was weighed and the radioactivity was determined. Thevolume ofcirculating perfusate was adjusted during the courseof the experiments to replace loss caused by the removal ofsamples.
In preliminary experiments, the 1% (wt/vol) bovine serum
albumin added to the Fluosol-43 perfusate was shown tostabilize the [3H]bilirubin and prevent its oxidative degrada-tion. The perfusate pH declined slowly from pH 7.4 to 7.25during the 2-h experimental period. Viability of perfusedlivers was satisfactory at the end of the 2.5-h perfusion periodas reflected by the normal appearance on electron microscopy,stable perfusate lactic dehydrogenase and transaminase ac-tivity, and normal hepatic oxygen consumption (2.6-2.9Amol/min per g liver) (36). Bile flow decreased from 1.52+0.17,ul/min per g liver (1.02+0.06 ml/h) during the control periodto 1.07±0.09 ,ul/min per g liver after 2-h perfusion.
Analytical proceduresTotal radioactivity was measured in aliquots of whole
plasma (25-50 .ul) after mixing with 1 ml Soluene-350 (Pack-ard Instrument Co., Downers Grove, Ill.), bleaching with 0.2ml isopropyl alcohol and 0.2 ml 30% hydrogen peroxide, andadding 10 ml Dimilume (Packard Instrument Co.). Authen-tic unconjugated [3H]bilirubin was determined in eachplasma sample by the following method. Immediately afterseparation of the plasma, an aliquot (0.1 ml) was mixedwith 0.1 ml rat plasma containing 0.04 ,tmol of unlabeled car-rier bilirubin. After storing the mixture overnight at -20°C, itwas extracted by a procedure developed by Dr. Colin Berry.2Water (0.8 ml) and 1.55-ml extraction mixture (chloroform/methanol, 1:2.1 vol/vol, containing hexadecyltrimethylam-monium bromide [cetrimide], 5 mg/ml) were added and thesolution mixed and centrifuged. The yellow organic phasewas applied directly to precoated thin-layer chromatography(TLC) plates (Silica-gel 60, 5763, 0.25-mm thickness, MerckAG, Darmstadt, Germany) and developed in the dark for -60min with chloroform-methanol-water (10:5:1, vol/vol). In pre-liminary experiments it had been ascertained that in this sys-tem (Rf 0.90) and also in chloroform-acetic acid (99:1, vol/vol) (37), [3H]bilirubin radioactivity migrated as a single bandand cochromatographed with authentic bilirubin. The yellowbilirubin band was scraped from the plate and extracted twicewith a total of 4 ml chloroform. The absorption of the super-natant fluid at 454 nm was measured and the solution thenevaporated. The residue was dissolved in Soluene-350 andradioactivity was determined after preparation of the sampleas described above. Specific activity ofthe extracted bilirubinwas computed, and the total [3H]bilirubin radioactivity in theoriginal plasma sample was obtained by multiplying the spe-cific activity by the amount of carrier added. The contributionof native unlabeled bilirubin in the plasma sample was as-sumed to be negligible in relation to the amount of carrieradded.An aliquot of each dose of [3H]bilirubin injected into intact
animals or the liver perfusion medium was analyzed by thecetrimide extraction and TLC procedure as described above.When the computed specific activity ofthe extracted bilirubinwas multiplied by the amount ofpigment in the dose plus theadded carrier, the isotope content of authentic [3H]bilirubinwas found to be consistently lower (6.6+0.3%) than the totalradioactivity of the injected dose. This difference appeared tobe the result of degradation of a small fraction of the addedpigment to labeled diazo-negative derivatives (4, 38), oc-curring during the brief period when the pigment was dis-solved in 0.1 M NaOH before its addition to serum (4, 38,39). A difference between the computed isotope in authentic[3H]bilirubin and total radioactivity was found in all plasmasamples collected from intact rats that had been given a tracerpulse of [3H]bilirubin. This appeared to reflect the presence
2 Personal communication.
Bilirubin Kinetics in the Rat 1005
in the administered dose of labeled degradation products co-injected with the authentic [3H]bilirubin, but direct quantita-tion of these degradation products in the small collectedplasma samples was beyond the resolution of the analyticalmethods available. Although it is theoretically possible thatthe fraction of total label in plasma that corresponded tolabeled bilirubin degradation products might also have in-cluded some labeled conjugated bilirubin, none could beidentified by TLC of plasma extracts.
Radioactivity was determined in aliquots of the adminis-tered dose of [3H]bilirubin, plasma, liver, and bile afterpreparation of the samples using Soluene-350, isopropyl-alcohol, hydrogen peroxide, and Dimilume as describedabove. Radioactive counting was performed in a liquid scintil-lation spectrometer (Beckman LS-250, Beckman Instruments,Fullerton, Calif.). All samples were counted for 40,000counts or 10 min to ensure an error in net count rate of<1%. Counting efficiency determined with a [3H] toluene in-ternal standard was used to correct counts to disintegrationsper minute. All data obtained from plasma, liver, and bile wereexpressed as a fraction oftotal 3H-radioactivity (disintegrationsper minute) in the administered dose.
Data analysis
Preliminary kinetic profiles of the data from intact animalsand isolated perfused liver were obtained by resolving theplasma (total 3H-activity or 3H-unconjugated bilirubin) andperfusate (total 3H-activity) disappearance curves into theirexponential components. The data, expressed as a fraction ofdose per milliliter of plasma or perfusate, were fitted to sumsof two and three exponential functions by a nonlinear leastsquares method, weighted by the reciprocal of the square ofconcentration (40). The function used took the form:
n
p(t) = I Aj exp(-Xjt), (1)J=1
where p denotes plasma concentration; t, time; Aj, interceptof the j-th exponential; and xi, decay rate coefficient of thej-th exponential.From the parameters of the exponential fit, initial distribu-
tion volume (V) (milliliters) was computed from theequation:
V 1 (2)
J=1
and the total plasma clearance rate (C, milliliters perminute) was estimated as follows:
C 1 1 (3)j p(t)dt XA
To characterize the kinetics of hepatic bilirubin transport,a variety of models were examined. This was accomplishedby testing visually the degree of fit between the experimentaldata and numerically integrated differential equations de-scribing the model (achieved by adjustment offractional trans-fer constants). In this search, the Euler method (41) was used,and implemented on a desk-top computer (HP 9825A Hewlett-Packard Co., Palo Alto, Calif.) interfaced with a HP 9872Aplotter. In keeping with current concepts ofbilirubin metabo-lism, four distinct pools were considered in intact rats: plasma,extravascular (intra- and extrahepatic), hepatic, and biliary.
The models were examined for their ability to fit the experi-mentally obtained data on plasma disappearance, hepatic con-tent, and biliary excretion of injected [3H]bilirubin. The mostappropriate model was selected and then tested for its abilityto fit the data obtained from isolated perfused liver.
In the final stage of fitting the model to data from both in-tact animals and perfused liver, an objective criterion, sum ofsquares weighted by reciprocal variances, was employedusing the HP 9825A desk-top computer. Sensitivity analysiswas also performed, which delineates the degree of certaintywith which each parameter was estimated with respect to theminimization of the sum of squares. The sensitivity is ex-pressed as fractional second difference of the sum of squareswhen the parameter changes by 1%. The greater the sensi-tivity, the more confidence can be placed on the parameterand the less uncertainty is involved in its estimation.
Statistical methods.Results are shown throughout as mean and standard errors.
Student's t test was used to estimate significance of the dif-ferences between mean values.
Deconjugation of BMG in vivoBecause the model that fitted the experimental data
suggested that a portion of bilirubin glucuronides formed inthe liver was hydrolyzed, an experiment was devised to testthis possibility directly. The experimental approach was basedon the assumption that "4C-labeled glucuronic acid hydro-lyzed from bilirubin ['4C]monoglucuronide (prepared bio-synthetically from UDP-[U- 4C]glucuronic acid) would bemetabolized in the liver with formation of 14CO2 and "4C-labeled xylulose. The latter compound then would be furtherdegraded in the hexose monophosphate shunt to "4CO2 (42).Hence, for each mole of BMG hydrolyzed, between 1 and 6mol of '4CO2 would result. The experiments were performedin rats with external biliary drainage to exclude the possibilityof intestinal deconjugation and reabsorption of 14C.The jugular vein and bile duct were cannulated in four
Sprague-Dawley rats (225±5 g). The animals were placed inseparate glass metabolic chambers and 5% glucose in aqueous0.15 M NaCl was infused continuously at 1.5 ml/h. After a con-trol period of 30 min, 0.08 ,umol [14C]BMG in 0.7 ml rat serumwas injected intravenously as a bolus. Bile and expired "4CO2were collected for 20 min intervals over the 1st h and 30 minintervals for a further 3 h. Cumulative excretion of radioac-tivity in bile samples was determined in a liquid scintillationspectrometer (counting efficiency, 94%) and expressed as afraction of the injected dose.The "4CO2 collection system was similar to that described
previously (43). Air from the animal chamber, drawn undervacuum, was dried with Aquasorb (Mallinckrodt, St. Louis,Mo.), and the "4CO2 trapped in two tubes placed in series, eachcontaining 4 ml of ethanolamine:methoxyethanol (1:1, vol/vol). 1-ml aliquots of this solution were added to 4 mlmethanol, 1 ml methoxyethanol, and 12 ml Liquiflor-toluene(New England Nuclear), and the radioactivity measuredwith a counting efficiency of 90%. Efficiency of the CO2 trainwas 95%, as determined by the recovery of a known amountof"4CO2 released in the animal chamber. "4CO2 production wasexpressed as a percentage of the administered radioactivity.The extent of bilirubin deconjugation was calculated on theassumption that the liberated labeled glucuronic acid moietywas completely metabolized to 6 mol of "4CO2; this yielded aminimal estimate of bilirubin glucuronide hydrolysis.
1006 J. Gollan, L. Hammaker, V. Licko, and R. Schmid
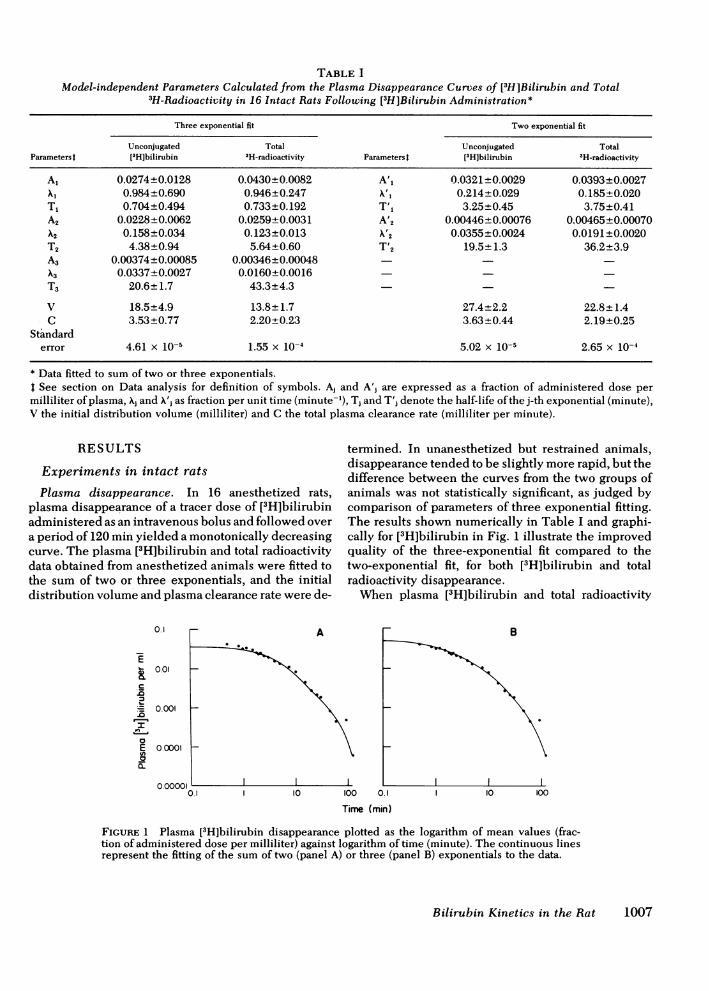
TABLE IModel-independent Parameters Calculated from the Plasma Disappearance Curves of [3H]Bilirubin and Total
3H-Radioactivity in 16 Intact Rats Following [3H]Bilirubin Administration*
Three exponential fit Two exponential fit
Unconjugated Total Unconjugated TotalParameterst ['Hlbilirubin 3H-radioactivity Parameterst ['H]bilirubin 3H-radioactivity
Al 0.0274+0.0128 0.0430+0.0082 A'1 0.0321±0.0029 0.0393+0.0027A1 0.984+0.690 0.946+0.247 X', 0.214+0.029 0.185+0.020T1 0.704±0.494 0.733±0.192 T'1 3.25±0.45 3.75+0.41A2 0.0228±0.0062 0.0259+0.0031 A'2 0.00446±0.00076 0.00465±0.00070A2 0.158±0.034 0.123±0.013 X'2 0.0355±0.0024 0.0191±0.0020T2 4.38±0.94 5.64±0.60 T'2 19.5± 1.3 36.2±3.9A3 0.00374±0.00085 0.00346+0.00048 -A3 0.0337±0.0027 0.0160±0.0016T3 20.6± 1.7 43.3±4.3 -
V 18.5±4.9 13.8±1.7 27.4±2.2 22.8+1.4C 3.53±0.77 2.20+0.23 3.63+0.44 2.19±0.25
Standarderror 4.61 x 10⁻⁵ 1.55 x 10⁻⁴ 5.02 x 10⁻⁵ 2.65 x 10⁻⁴
* Data fitted to sum of two or three exponentials.t See section on Data analysis for definition of symbols. Aj and A'j are expressed as a fraction of administered dose permilliliter of plasma, Xj and X'j as fraction per unit time (minute-'), Tj and T'j denote the half-life of the j-th exponential (minute),V the initial distribution volume (milliliter) and C the total plasma clearance rate (milliliter per minute).
RESULTS
Experiments in intact rats
Plasma disappearance. In 16 anesthetized rats,plasma disappearance of a tracer dose of [3H]bilirubinadministered as an intravenous bolus and followed overa period of 120 min yielded a monotonically decreasingcurve. The plasma [3H]bilirubin and total radioactivitydata obtained from anesthetized animals were fitted tothe sum of two or three exponentials, and the initialdistribution volume and plasma clearance rate were de-
ol_ ~~~~AE. A
0.01
0.001
I
E 0000 _c
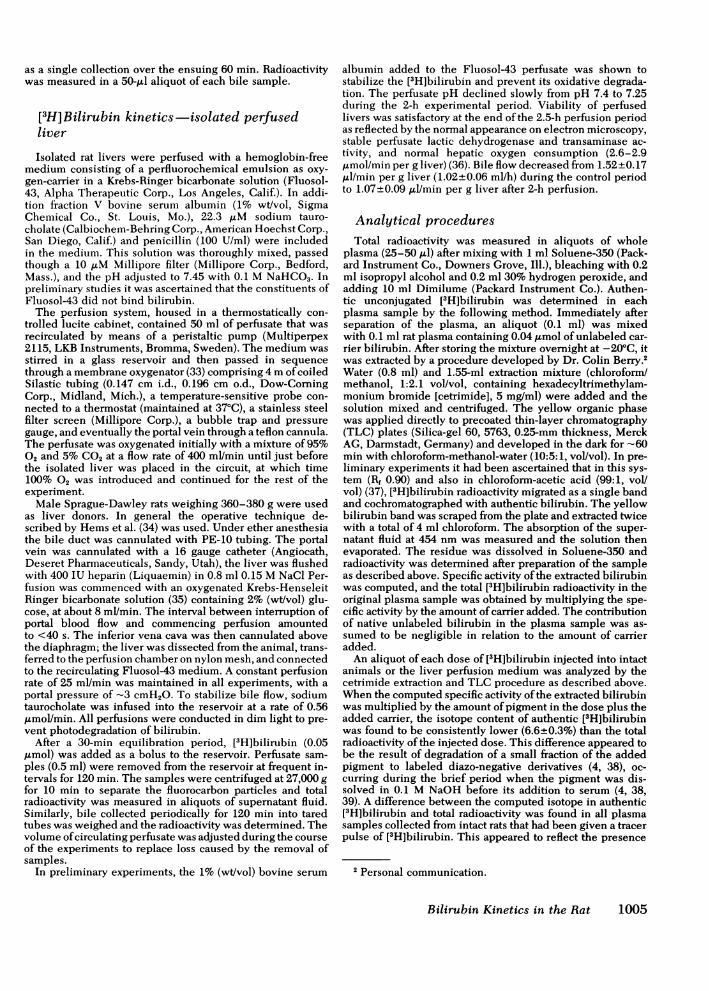
termined. In unanesthetized but restrained animals,disappearance tended to be slightly more rapid, but thedifference between the curves from the two groups ofanimals was not statistically significant, as judged bycomparison of parameters of three exponential fitting.The results shown numerically in Table I and graphi-cally for [3H]bilirubin in Fig. 1 illustrate the improvedquality of the three-exponential fit compared to thetwo-exponential fit, for both [3H]bilirubin and totalradioactivity disappearance.When plasma [3H]bilirubin and total radioactivity
100 0.1
Time (min)
FIGURE 1 Plasma [3H]bilirubin disappearance plotted as the logarithm of mean values (frac-tion of administered dose per milliliter) against logarithm of time (minute). The continuous linesrepresent the fitting of the sum of two (panel A) or three (panel B) exponentials to the data.
Bilirubin Kinetics in the Rat 1007
(including labeled degradation products) were com-pared, the clearance rate of the latter was considerablyslower (Table I). Thus, 5 min after isotope administra-tion, 84% (mean) ofthe total radioactivity in plasma waspresent as authentic [3H]bilirubin, and this declinedprogressively to 67% after 30 min, 37% after 60 min and13% after 120 min. Whereas the half-life ofthe first twoexponentials of [3H]bilirubin and of total radioactivityplasma disappearance were statistically not different,the half-life of the terminal exponential was signifi-cantly shorter for [3H]bilirubin (20.6+1.7 min) than fortotal radioactivity (43.3±4.3 min). This observation in-dicates that the labeled bilirubin degradation productshave a much slower plasma disappearance (tl/2 = 50.6+ 13.6 min) than authentic [3H]bilirubin.Liver. Total radioactivity in liver was determined
experimentally in 11 rats at various intervals after [3H]bilirubin injection and results were calculated as a frac-tion of the administered dose. Because of the smallamount of isotope present in the liver, separate analy-sis of [3H]bilirubin, labeled bilirubin degradationproducts, and conjugated bilirubin was not possible.Because no liver samples could be obtained during theinitial rapid hepatic uptake phase, the radioactivity datawere fitted to only two exponentials. The values com-puted for Aj, expressed as a fraction of administereddose in liver; Xj, min-1; and T, min (see Data analysissection in Methods for definition of symbols) were asfollows: A, = 0.710±0.126, A2 = 0.073+0.012, XA= 0.121±0.016, X2 = 0.013±0.002, T1 = 5.75±0.76,T2 = 53.4+8.2.
Bile. In three rats with an external bile fistula, bileflow throughout the 120 min of the experiment re-mained constant and averaged 1.7, 1.7, and 1.5 ml/h.With the tip of the 10-cm bile cannula placed <1 cmfrom the liver, the extrahepatic transit time elapsing be-fore sample collection was -1 min. After injection of[3H]bilirubin, extraction and TLC of labeled pigmentsin bile showed that at least 98% of all radioactivity waspresent in conjugated bilirubin; labeled bilirubindegradation products could not be detected. Cumula-tive excretion in bile of the injected dose of [3H]bili-rubin was 94.0±0.2% in 2 h, which compared favor-ably with previously published findings (44, 45).Compartmental model of [3H]bilirubin kinetics.
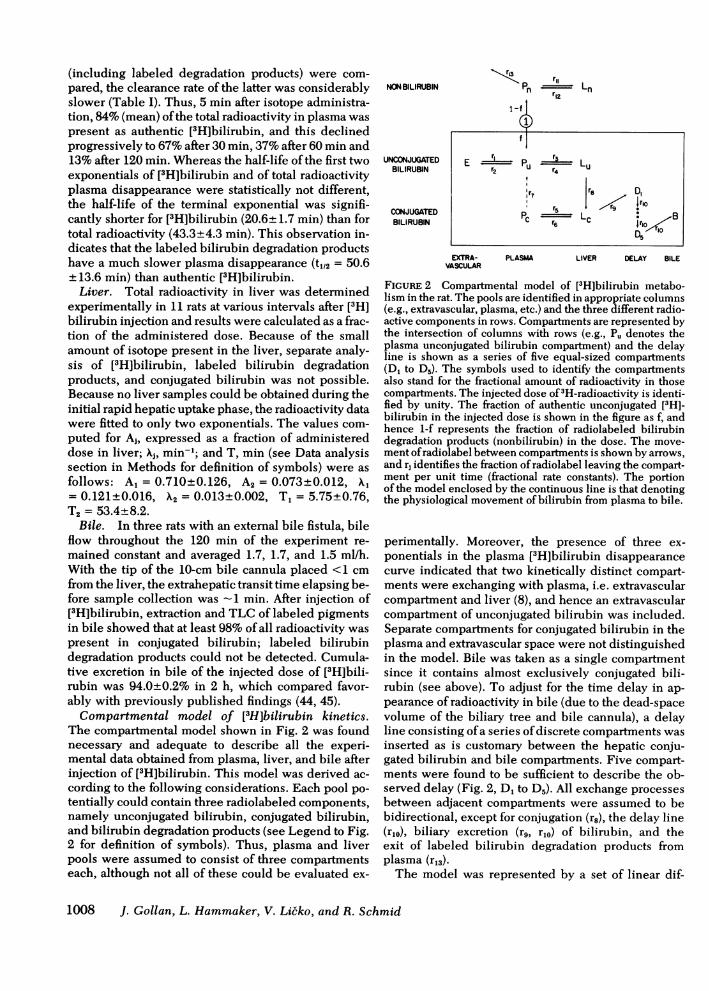
The compartmental model shown in Fig. 2 was foundnecessary and adequate to describe all the experi-mental data obtained from plasma, liver, and bile afterinjection of [3H]bilirubin. This model was derived ac-cording to the following considerations. Each pool po-tentially could contain three radiolabeled components,namely unconjugated bilirubin, conjugated bilirubin,and bilirubin degradation products (see Legend to Fig.2 for definition of symbols). Thus, plasma and liverpools were assumed to consist of three compartmentseach, although not all of these could be evaluated ex-
NON BILIRUBIN
UNCONJUGATEDBILIRUBIN
CONJUGATEDBILIRUBIN
EXTRA-VASCULAR
r,3
r12-f
1
r2 r4 Lu
tr7 I, D
PC r56 Lc I r,oPC Lc B
r6 ~~~~~~~~IrioD5 "l
PLASMA LIVER DELAY BILE
FIGuRE 2 Compartmental model of [3H]bilirubin metabo-lism in the rat. The pools are identified in appropriate columns(e.g., extravascular, plasma, etc.) and the three different radio-active components in rows. Compartments are represented bythe intersection of columns with rows (e.g., Pu denotes theplasma unconjugated bilirubin compartment) and the delayline is shown as a series of five equal-sized compartments(D1 to D5). The symbols used to identify the compartmentsalso stand for the fractional amount of radioactivity in thosecompartments. The injected dose of3H-radioactivity is identi-fied by unity. The fraction of authentic unconjugated [3H]-bilirubin in the injected dose is shown in the figure as f, andhence 1-f represents the fraction of radiolabeled bilirubindegradation products (nonbilirubin) in the dose. The move-ment ofradiolabel between compartments is shown by arrows,and rj identifies the fraction ofradiolabel leaving the compart-ment per unit time (fractional rate constants). The portionof the model enclosed by the continuous line is that denotingthe physiological movement of bilirubin from plasma to bile.
perimentally. Moreover, the presence of three ex-ponentials in the plasma [3H]bilirubin disappearancecurve indicated that two kinetically distinct compart-ments were exchanging with plasma, i.e. extravascularcompartment and liver (8), and hence an extravascularcompartment of unconjugated bilirubin was included.Separate compartments for conjugated bilirubin in theplasma and extravascular space were not distinguishedin the model. Bile was taken as a single compartmentsince it contains almost exclusively conjugated bili-rubin (see above). To adjust for the time delay in ap-pearance of radioactivity in bile (due to the dead-spacevolume of the biliary tree and bile cannula), a delayline consisting ofa series ofdiscrete compartments wasinserted as is customary between the hepatic conju-gated bilirubin and bile compartments. Five compart-ments were found to be sufficient to describe the ob-served delay (Fig. 2, D, to D5). All exchange processesbetween adjacent compartments were assumed to bebidirectional, except for conjugation (r8), the delay line(r1o), biliary excretion (r9, r,O) of bilirubin, and theexit of labeled bilirubin degradation products fromplasma (rl3).The model was represented by a set of linear dif-
1008 J. Gollan, L. Hammaker, V. Licko, and R. Schmid
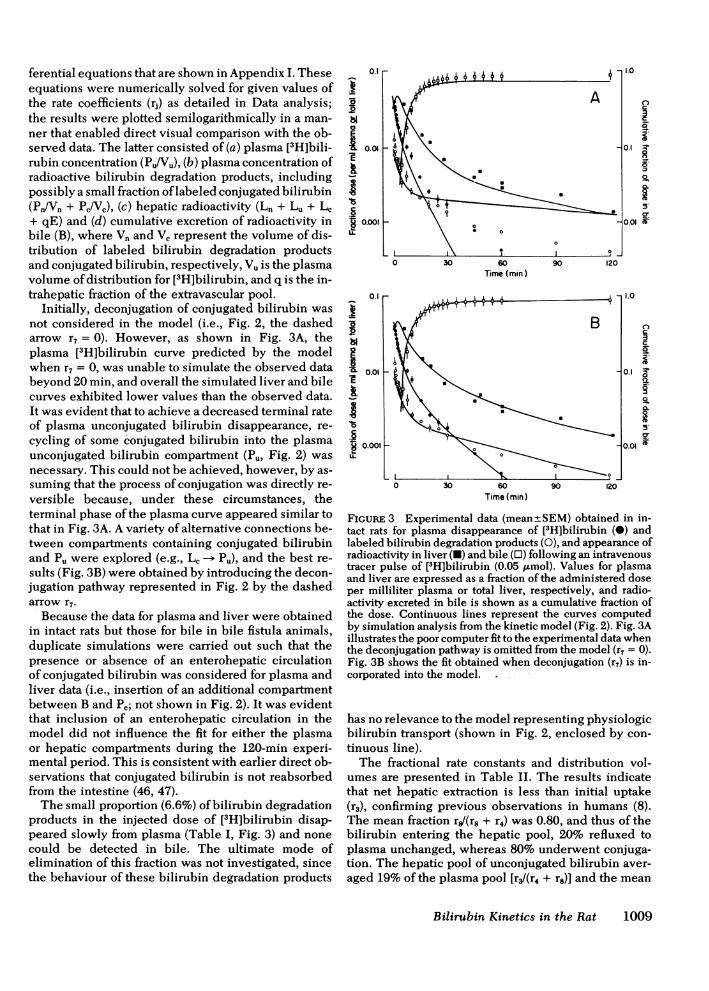
ferential equations that are shown in Appendix I. Theseequations were numerically solved for given values ofthe rate coefficients (rj) as detailed in Data analysis;the results were plotted semilogarithmically in a man-ner that enabled direct visual comparison with the ob-served data. The latter consisted of (a) plasma [3H]bili-rubin concentration (Pu/Vu), (b) plasma concentration ofradioactive bilirubin degradation products, includingpossibly a small fraction oflabeled conjugated bilirubin(Pn/Vn + Pc/Vc), (c) hepatic radioactivity (Ln + Lu + Lc+ qE) and (d) cumulative excretion of radioactivity inbile (B), where Vn and Vc represent the volume of dis-tribution of labeled bilirubin degradation productsand conjugated bilirubin, respectively, Vu is the plasmavolume ofdistribution for [3H]bilirubin, and q is the in-trahepatic fraction of the extravascular pool.
Initially, deconjugation of conjugated bilirubin wasnot considered in the model (i.e., Fig. 2, the dashedarrow r7 = 0). However, as shown in Fig. 3A, theplasma [3H]bilirubin curve predicted by the modelwhen r7 = 0, was unable to simulate the observed databeyond 20 min, and overall the simulated liver and bilecurves exhibited lower values than the observed data.It was evident that to achieve a decreased terminal rateof plasma unconjugated bilirubin disappearance, re-cycling of some conjugated bilirubin into the plasmaunconjugated bilirubin compartment (Pu, Fig. 2) wasnecessary. This could not be achieved, however, by as-suming that the process of conjugation was directly re-versible because, under these circumstances, theterminal phase of the plasma curve appeared similar tothat in Fig. 3A. A variety of alternative connections be-tween compartments containing conjugated bilirubinand Pu were explored (e.g., Lc -- Pu), and the best re-sults (Fig. 3B) were obtained by introducing the decon-jugation pathway represented in Fig. 2 by the dashedarrow r7.Because the data for plasma and liver were obtained
in intact rats but those for bile in bile fistula animals,duplicate simulations were carried out such that thepresence or absence of an enterohepatic circulationof conjugated bilirubin was considered for plasma andliver data (i.e., insertion of an additional compartmentbetween B and Pc; not shown in Fig. 2). It was evidentthat inclusion of an enterohepatic circulation in themodel did not influence the fit for either the plasmaor hepatic compartments during the 120-min experi-mental period. This is consistent with earlier direct ob-servations that conjugated bilirubin is not reabsorbedfrom the intestine (46, 47).The small proportion (6.6%) of bilirubin degradation
products in the injected dose of [3H]bilirubin disap-peared slowly from plasma (Table I, Fig. 3) and nonecould be detected in bile. The ultimate mode ofelimination of this fraction was not investigated, sincethe behaviour of these bilirubin degradation products
t
.10EI0.01
.EB 0.X0111
Time (min)
0.1 rt5.1181
106
-gkiIt9.I.-
It11
0.01 F
0.001 F
1.0
0
3_5-0
0.1 -a50
5'
0.01 CD
1.0
C-)
o
3
EDa
0
01. 0.a.SI
nrt l CD
~~~~~~~~~~~~~~~~~~~~~~~~~~~~~__
0 30 60 90 120Time (min)
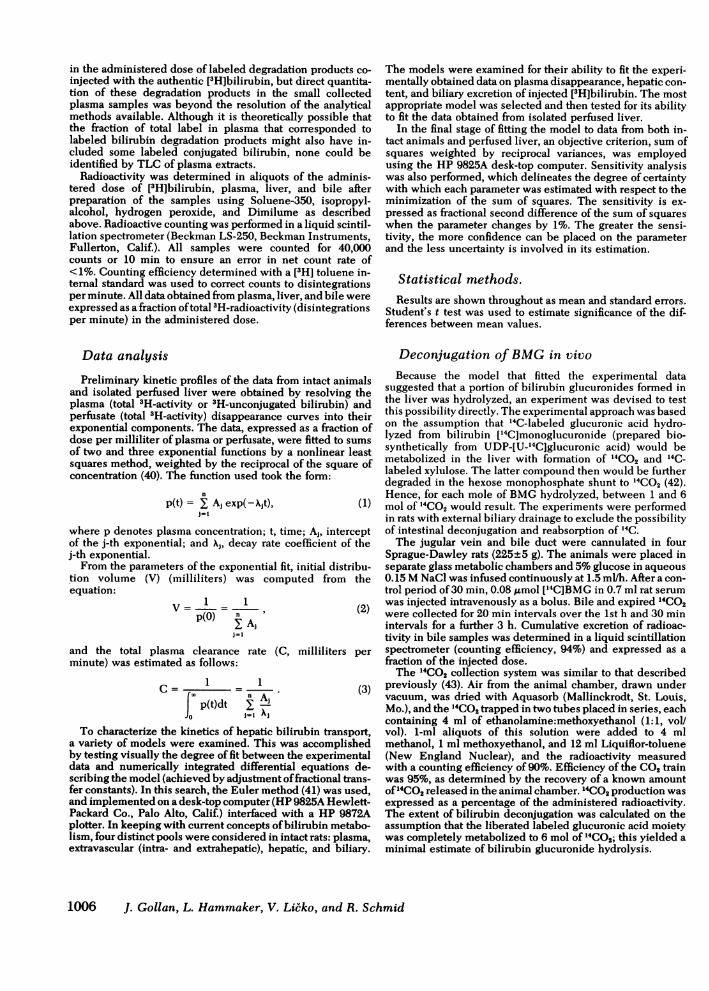
FIGuRE 3 Experimental data (mean±SEM) obtained in in-tact rats for plasma disappearance of [3H]bilirubin (0) andlabeled bilirubin degradation products (0), and appearance ofradioactivity in liver (U) and bile (OJ) following an intravenoustracer pulse of [3H]bilirubin (0.05 ,/Lmol). Values for plasmaand liver are expressed as a fraction of the administered doseper milliliter plasma or total liver, respectively, and radio-activity excreted in bile is shown as a cumulative fraction ofthe dose. Continuous lines represent the curves computedby simulation analysis from the kinetic model (Fig. 2). Fig. 3Aillustrates the poor computer fit to the experimental data whenthe deconjugation pathway is omitted from the model (r7 = 0).Fig. 3B shows the fit obtained when deconjugation (r7) is in-corporated into the model.
has no relevance to the model representing physiologicbilirubin transport (shown in Fig. 2, enclosed by con-tinuous line).The fractional rate constants and distribution vol-
umes are presented in Table II. The results indicatethat net hepatic extraction is less than initial uptake(r3), confirming previous observations in humans (8).The mean fraction r&/(r8 + r4) was 0.80, and thus of thebilirubin entering the hepatic pool, 20% refluxed toplasma unchanged, whereas 80% underwent conjuga-tion. The hepatic pool of unconjugated bilirubin aver-aged 19% of the plasma pool [r3/(r4 + r8)] and the mean
Bilirubin Kinetics in the Rat 1009
0.01
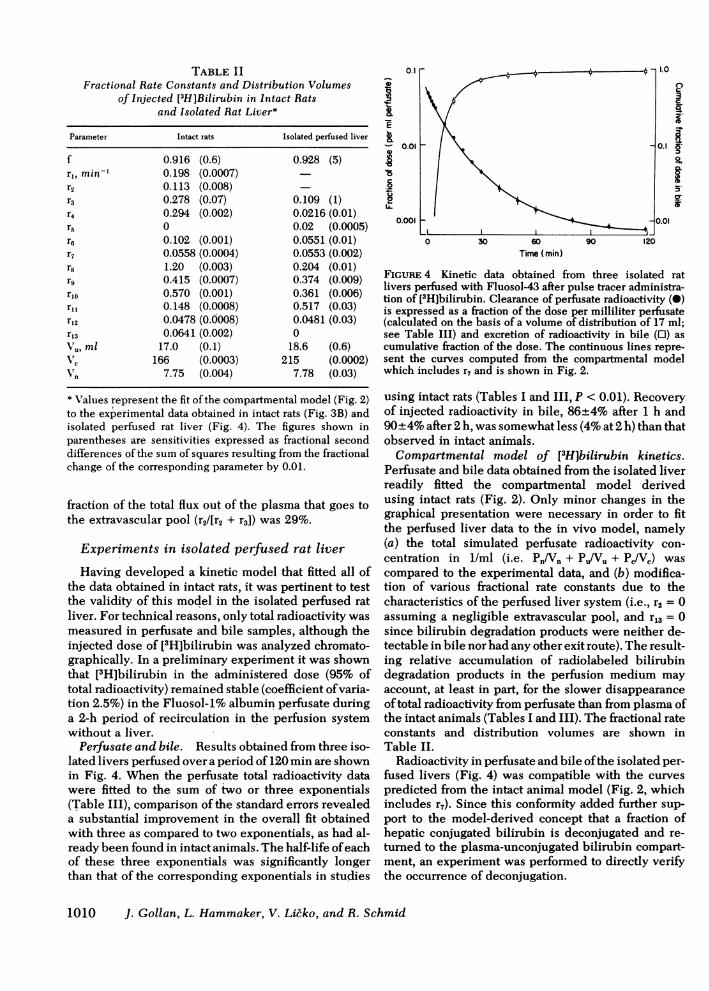
TABLE IIFractional Rate Constants and Distribution Volumes
of Injected [3H]Bilirubin in Intact Ratsand Isolated Rat Liver*
Parameter Intact rats Isolated perfused liver
f 0.916 (0.6) 0.928 (5)r1,min, 0.198 (0.0007)r2 0.113 (0.008)r3 0.278 (0.07) 0.109 (1)r4 0.294 (0.002) 0.0216 (0.01)r5 0 0.02 (0.0005)r6 0.102 (0.001) 0.0551 (0.01)r7 0.0558 (0.0004) 0.0553 (0.002)r8 1.20 (0.003) 0.204 (0.01)rg 0.4 15 (0.0007) 0.374 (0.009)r1o 0.570 (0.001) 0.361 (0.006)ril 0.148 (0.0008) 0.517 (0.03)r12 0.0478 (0.0008) 0.0481 (0.03)r13 0.0641 (0.002) 0Vu, ml 17.0 (0.1) 18.6 (0.6)V7c166 (0.0003) 215 (0.0002)Vn 7.75 (0.004) 7.78 (0.03)
* Values represent the fit of the compartmental model (Fig. 2)to the experimental data obtained in intact rats (Fig. 3B) andisolated perfused rat liver (Fig. 4). The figures shown inparentheses are sensitivities expressed as fractional seconddifferences of the sum of squares resulting from the fractionalchange of the corresponding parameter by 0.01.
fraction of the total flux out of the plasma that goes tothe extravascular pool (r2/[r2 + r3]) was 29%.
Experiments in isolated perfused rat liver
Having developed a kinetic model that fitted all ofthe data obtained in intact rats, it was pertinent to testthe validity of this model in the isolated perfused ratliver. For technical reasons, only total radioactivity wasmeasured in perfusate and bile samples, although theinjected dose of [3H]bilirubin was analyzed chromato-graphically. In a preliminary experiment it was shownthat [3H]bilirubin in the administered dose (95% oftotal radioactivity) remained stable (coefficient ofvaria-tion 2.5%) in the Fluosol-1% albumin perfusate duringa 2-h period of recirculation in the perfusion systemwithout a liver.Perfusate and bile. Results obtained from three iso-
lated livers perfused over a period of 120 min are shownin Fig. 4. When the perfusate total radioactivity datawere fitted to the sum of two or three exponentials(Table III), comparison of the standard errors revealeda substantial improvement in the overall fit obtainedwith three as compared to two exponentials, as had al-ready been found in intact animals. The half-life ofeachof these three exponentials was significantly longerthan that of the corresponding exponentials in studies
0.l -.-
0.01 0.10
0.001L0.010 30 60 90 120
Time (min)
FIGURE 4 Kinetic data obtained from three isolated ratlivers perfused with Fluosol-43 after pulse tracer administra-tion of [31H]bilirubin. Clearance of perfusate radioactivity (0)is expressed as a fraction of the dose per milliliter perfusate(calculated on the basis of a volume of distribution of 17 ml;see Table III) and excretion of radioactivity in bile (0) ascumulative fraction of the dose. The continuous lines repre-sent the curves computed from the compartmental modelwhich includes r7 and is shown in Fig. 2.
using intact rats (Tables I and III, P < 0.01). Recoveryof injected radioactivity in bile, 86±4% after 1 h and90+4% after 2 h, was somewhat less (4% at 2 h) than thatobserved in intact animals.Compartmental model of [3H]bilirubin kinetics.
Perfusate and bile data obtained from the isolated liverreadily fitted the compartmental model derivedusing intact rats (Fig. 2). Only minor changes in thegraphical presentation were necessary in order to fitthe perfused liver data to the in vivo model, namely(a) the total simulated perfusate radioactivity con-centration in 1/ml (i.e. Pn/Vn + Pj/Vu + PJVC) wascompared to the experimental data, and (b) modifica-tion of various fractional rate constants due to thecharacteristics of the perfused liver system (i.e., r2 = 0assuming a negligible extravascular pool, and r13 = 0since bilirubin degradation products were neither de-tectable in bile nor had any other exit route). The result-ing relative accumulation of radiolabeled bilirubindegradation products in the perfusion medium mayaccount, at least in part, for the slower disappearanceoftotal radioactivity from perfusate than from plasma ofthe intact animals (Tables I and III). The fractional rateconstants and distribution volumes are shown inTable II.
Radioactivity in perfusate and bile ofthe isolated per-fused livers (Fig. 4) was compatible with the curvespredicted from the intact animal model (Fig. 2, whichincludes r,). Since this conformity added further sup-port to the model-derived concept that a fraction ofhepatic conjugated bilirubin is deconjugated and re-turned to the plasma-unconjugated bilirubin compart-ment, an experiment was performed to directly verifythe occurrence of deconjugation.
1010 J. Gollan, L. Hammaker, V. Licko, and R. Schmid
^
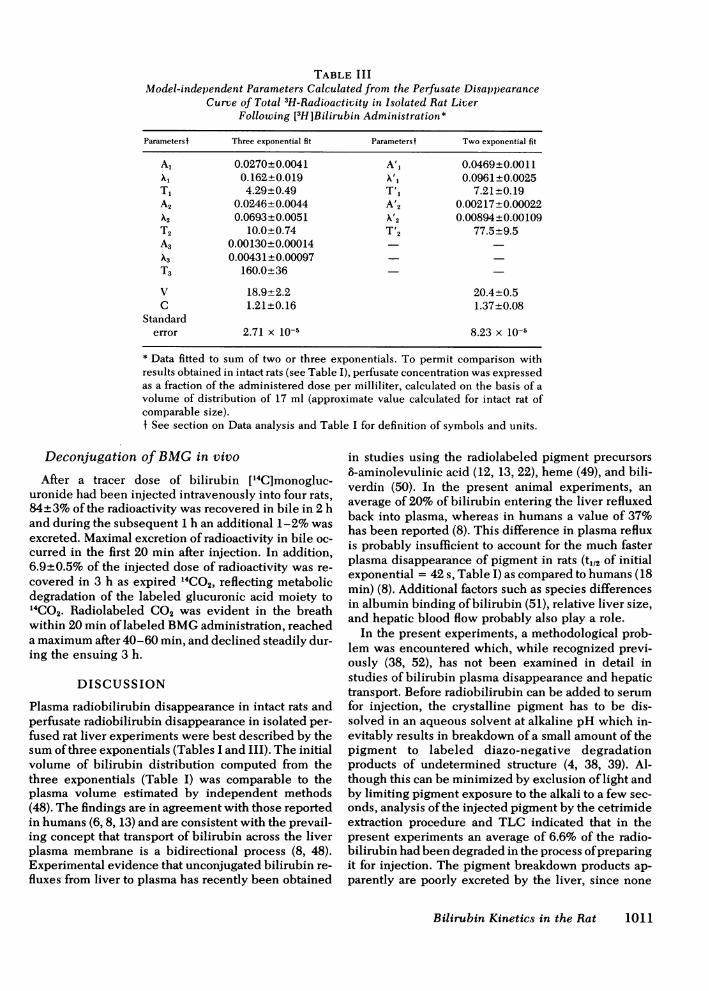
TABLE IIIModel-independent Parameters Calculated from the Perfusate Disappearance
Curve of Total 3H-Radioactivity in Isolated Rat LiverFollowing [3H]Bilirubin Administration*
Parametersf Three exponential fit Parametersi Two exponential fit
Al 0.0270+0.0041 A'l 0.0469±0.0011XI 0.162+0.019 X'I 0.0961±+0.0025T, 4.29+0.49 T'1 7.21+0.19A2 0.0246+0.0044 A'2 0.00217+0.00022X2 0.0693+0.0051 Xf2 0.00894+0.00109T2 10.0+0.74 T'2 77.5+9.5A3 0.00130±0.00014X3 0.00431±0.00097T3 160.0±36
V 18.9±2.2 20.4+0.5C 1.21+0.16 1.37±0.08
Standarderror 2.71 x 10⁻⁵ 8.23 x 10⁻⁵
* Data fitted to sum of two or three exponentials. To permit comparison withresults obtained in intact rats (see Table I), perfusate concentration was expressedas a fraction of the administered dose per milliliter, calculated on the basis of avolume of distribution of 17 ml (approximate value calculated for intact rat ofcomparable size).f See section on Data analysis and Table I for definition of symbols and units.
Deconjugation of BMG in vivo
After a tracer dose of bilirubin [14C]monogluc-uronide had been injected intravenously into four rats,84±3% of the radioactivity was recovered in bile in 2 hand during the subsequent 1 h an additional 1-2% wasexcreted. Maximal excretion of radioactivity in bile oc-curred in the first 20 min after injection. In addition,6.9±0.5% of the injected dose of radioactivity was re-covered in 3 h as expired G4CO2, reflecting metabolicdegradation of the labeled glucuronic acid moiety to14CO2. Radiolabeled CO2 was evident in the breathwithin 20 min oflabeled BMG administration, reacheda maximum after 40-60 min, and declined steadily dur-ing the ensuing 3 h.
DISCUSSION
Plasma radiobilirubin disappearance in intact rats andperfusate radiobilirubin disappearance in isolated per-fused rat liver experiments were best described by thesum ofthree exponentials (Tables I and III). The initialvolume of bilirubin distribution computed from thethree exponentials (Table I) was comparable to theplasma volume estimated by independent methods(48). The findings are in agreement with those reportedin humans (6, 8, 13) and are consistent with the prevail-ing concept that transport of bilirubin across the liverplasma membrane is a bidirectional process (8, 48).Experimental evidence that unconjugated bilirubin re-fluxes from liver to plasma has recently been obtained
in studies using the radiolabeled pigment precursors8-aminolevulinic acid (12, 13, 22), heme (49), and bili-verdin (50). In the present animal experiments, anaverage of 20% of bilirubin entering the liver refluxedback into plasma, whereas in humans a value of 37%has been reported (8). This difference in plasma refluxis probably insufficient to account for the much fasterplasma disappearance of pigment in rats (t1/2 of initialexponential = 42 s, Table I) as compared to humans (18min) (8). Additional factors such as species differencesin albumin binding ofbilirubin (51), relative liver size,and hepatic blood flow probably also play a role.
In the present experiments, a methodological prob-lem was encountered which, while recognized previ-ously (38, 52), has not been examined in detail instudies of bilirubin plasma disappearance and hepatictransport. Before radiobilirubin can be added to serumfor injection, the crystalline pigment has to be dis-solved in an aqueous solvent at alkaline pH which in-evitably results in breakdown of a small amount of thepigment to labeled diazo-negative degradationproducts of undetermined structure (4, 38, 39). Al-though this can be minimized by exclusion of light andby limiting pigment exposure to the alkali to a few sec-onds, analysis of the injected pigment by the cetrimideextraction procedure and TLC indicated that in thepresent experiments an average of 6.6% of the radio-bilirubin had been degraded in the process ofpreparingit for injection. The pigment breakdown products ap-parently are poorly excreted by the liver, since none
Bilirubin Kinetics in the Rat 1011
could be detected in bile and recovery of total radio-activity in bile fell 6% short ofthat injected. It was. to beexpected, therefore, that the labeled degradationproducts would disappear from plasma more slowlythan authentic radiobilirubin. This was indeed thecase, as the half-life of the terminal exponential of totalradioactivity (including degraded bilirubin) was sig-nificantly longer (P < 0.001) than that of authentic[3H]bilirubin (Table I, Fig. 3). This observation im-plies that in studies of bilirubin kinetics, analyticalmethods should be used that specifically measureradiobilirubin rather than merely extractable radio-activity. For example, in a previous investigation ofplasma bilirubin kinetics in rats (20), which used a con-ventional solvent extraction procedure (8, 24), thehalf-life of the terminal exponential was dispropor-tionately longer in relation to those of the first two ex-ponentials than in the present study (Table I). In cal-culating certain model-independent parameters suchas bilirubin production rate and hepatic bilirubin clear-ance (2, 7-10) from kinetic studies in humans, apparentslowing of the terminal exponential of plasma disap-pearance due to the presence of labeled bilirubindegradation products would result in substantial un-derestimation of the actual values. In the presentstudies in intact animals, we therefore expressedplasma disappearance in terms of authentic radiobili-rubin rather than total radioactivity. Although the modeof elimination of the water-soluble bilirubin degrada-tion products was not investigated, they probably areexcreted preferentially in the urine (4, 38).When the model-derived curves were applied to the
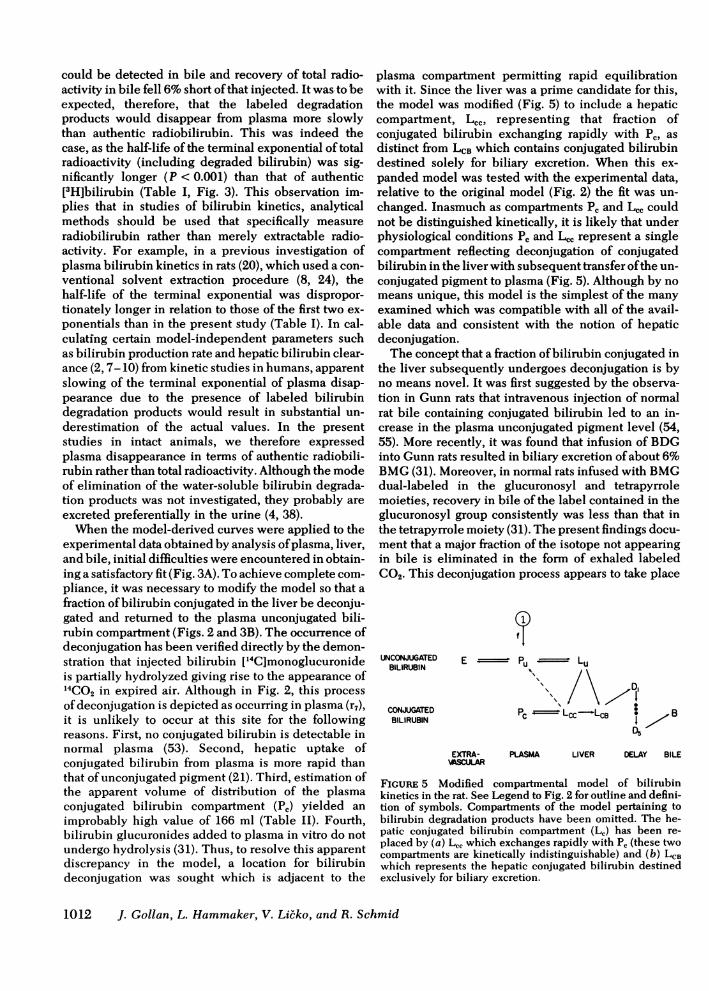
experimental data obtained by analysis ofplasma, liver,and bile, initial difficulties were encountered in obtain-ing a satisfactory fit (Fig. 3A). To achieve complete com-pliance, it was necessary to modify the model so that afraction ofbilirubin conjugated in the liver be deconju-gated and returned to the plasma unconjugated bili-rubin compartment (Figs. 2 and 3B). The occurrence ofdeconjugation has been verified directly by the demon-stration that injected bilirubin [14C]monoglucuronideis partially hydrolyzed giving rise to the appearance of14CO2 in expired air. Although in Fig. 2, this processofdeconjugation is depicted as occurring in plasma (r7),it is unlikely to occur at this site for the followingreasons. First, no conjugated bilirubin is detectable innormal plasma (53). Second, hepatic uptake ofconjugated bilirubin from plasma is more rapid thanthat of unconjugated pigment (21). Third, estimation ofthe apparent volume of distribution of the plasmaconjugated bilirubin compartment (P,) yielded animprobably high value of 166 ml (Table II). Fourth,bilirubin glucuronides added to plasma in vitro do notundergo hydrolysis (31). Thus, to resolve this apparentdiscrepancy in the model, a location for bilirubindeconjugation was sought which is adjacent to the
plasma compartment permitting rapid equilibrationwith it. Since the liver was a prime candidate for this,the model was modified (Fig. 5) to include a hepaticcompartment, Lcc, representing that fraction ofconjugated bilirubin exchanging rapidly with Pc, asdistinct from LCB which contains conjugated bilirubindestined solely for biliary excretion. When this ex-panded model was tested with the experimental data,relative to the original model (Fig. 2) the fit was un-changed. Inasmuch as compartments Pc and LCC couldnot be distinguished kinetically, it is likely that underphysiological conditions Pc and LCC represent a singlecompartment reflecting deconjugation of conjugatedbilirubin in the liver with subsequent transfer ofthe un-conjugated pigment to plasma (Fig. 5). Although by nomeans unique, this model is the simplest of the manyexamined which was compatible with all of the avail-able data and consistent with the notion of hepaticdeconjugation.The concept that a fraction ofbilirubin conjugated in
the liver subsequently undergoes deconjugation is byno means novel. It was first suggested by the observa-tion in Gunn rats that intravenous injection of normalrat bile containing conjugated bilirubin led to an in-crease in the plasma unconjugated pigment level (54,55). More recently, it was found that infusion of BDGinto Gunn rats resulted in biliary excretion ofabout 6%BMG (31). Moreover, in normal rats infused with BMGdual-labeled in the glucuronosyl and tetrapyrrolemoieties, recovery in bile of the label contained in theglucuronosyl group consistently was less than that inthe tetrapyrrole moiety (31). The present findings docu-ment that a major fraction of the isotope not appearingin bile is eliminated in the form of exhaled labeledCO2. This deconjugation process appears to take place
UNCONJUGATEDBILIRUBIN
CONJUGATEDBILIRUBIN
E - Pu Lu
\ /\ /DIPc Lcc-LCB i / B
P5
EXTRA-.SCULAR
PLASMA LIVER DELAY BILE
FIGuRE 5 Modified compartmental model of bilirubinkinetics in the rat. See Legend to Fig. 2 for outline and defini-tion of symbols. Compartments of the model pertaining tobilirubin degradation products have been omitted. The he-patic conjugated bilirubin compartment (LC) has been re-placed by (a) L, which exchanges rapidly with P, (these twocompartments are kinetically indistinguishable) and (b) LCBwhich represents the hepatic conjugated bilirubin destinedexclusively for biliary excretion.
1012 J. Gollan, L. Hammaker, V. Licko, and R. Schmid
largely or exclusively in the liver, as the experimentswere performed in animals with an external bile fistula,thereby excluding the intestinal tract as a site of de-conjugation. We have not investigated the mecha-nism(s) of hepatic pigment deconjugation, but haveeliminated reversible transglucuronidation (i.e., 1 molBDG + 1 mol bilirubin 2 mol BMG) as a possiblemechanism by experiments in Gunn rats (31). Theabundance of /3-glucuronidase in the liver (56, 57)and the association of 8-glucuronidase activity withbilirubin granules in cholestatic liver (54) suggest thatthis enzyme may be involved in the process. However,inasmuch as neither the distribution nor the transport ofconjugated bilirubin in the hepatocyte are understood,the physiological role of this hydrolytic enzyme in pig-ment deconjugation remains conjectural.The present findings collectively provide direct
validation of the proposed compartmental model forbilirubin transport in the liver (Fig. 5). They suggestthat hepatic deconjugation of a minor fraction of bili-rubin glucuronides is a normally occurring metabolicevent. This observation may offer a plausible explana-tion for the frequent occurrence of increased plasmalevels ofunconjugated bilirubin in patients with chole-stasis (53). It further indicates that a portion ofthe BMGexcreted in normal bile (58-61) may be derived fromhydrolysis of BDG. It is possible that hepatic decon-jugation is a more general mechanism, involving otherendogenous substances and xenobiotics that form gluc-uronides. Indeed, preliminary findings with the mor-phine antagonist naltrexone suggest that it undergoespartial hepatic deconjugation.3
APPENDIXThe mathematical model corresponding to Fig. 2 is describedby the following set of ordinary linear differential equationswith constant coefficients:
Pn = -(r11 + rl3)Pn + r12Ln, (1)
Ln= rlPn - r12Ln, (2)
E = r2Pu - r,E, (3)
Pu= r1E - (r2 + r3)Pu + r4Lu + r7Pc, (4)LU= r3Pu - (r4 + r8)Lu, (5)Pc = r6Lr - (r5 + r7)Pc, (6)Le= rL,Lu - (r6 + r9)L, + r5Pc, (7)1 = rgLc - r1OD1, (8)
D5 = rio(D4 - D5), (9)B = r1oD5. (10)
with the initial conditions:
3 V. Li6ko. Unpublished observation.
P"(O) = 1 - f (11)
P"(0) = f (12)
and all others zero initial conditions. Entities designated bycapital letters are total fractional amounts in the appropriatecompartments.
ACKNOWLEDGMENTS
This study was supported by National Institutes of Healthresearch grants AM-21899, AM-11275, and P50AM-18520. Weare indebted to Ms. D. Fedorchak for valuable editorial assist-ance. The authors also wish to express their gratitude to Dr.Colin Berry, Chesham, England for allowing us to use hismethod for extraction of bile pigments before publication.
REFERENCES
1. Gollan, J., L. Hammaker, V. Licko, N. Blanckaert, and R.Schmid. 1979. Hepatic deconjugation of bilirubinglucuronides: a normal metabolic pathway. Gastro-enterology. 77: A14 (Abstr.)
2. Carson, E. R., and E. A. Jones. 1979. Use of kinetic analy-sis and mathematical modeling in the study of meta-bolic pathways in vivo. Applications to hepatic organicanion metabolism. N. Engl. J. Med. 300: 1016-1027.
3. Billing, B. H., R. Williams, and T. G. Richards. 1964. De-fects in hepatic transport ofbilirubin in congenital hyper-bilirubinaemia: an analysis of plasma bilirubin disap-pearance curves. Clin. Sci. 27: 245-257.
4. Ostrow, J. D., L. Hammaker, and R. Schmid. 1961. Thepreparation ofcrystalline bilirubin-C14.J. Clin. Invest. 40:1442-1452.
5. Barrett, P. V. D., F. X. Mullins, and N. I. Berlin. 1966.Studies on the biosynthetic production of bilirubin-C'4.An improved method utilizing 8-amino-levulinic acid-4-14C in dogs.J. Lab. Clin. Med. 68: 905-912.
6. Araki, Y., and M. Kashima. 1968. Mathematical analysisof bilirubin dynamics in man. In Ikterus. K. Beck, editor.F. K. Schattauer, Verlag, Stuttgart, W. Germany. 35-45.
7. Barrett, P. V. D., P. D. Berk, M. Menken, and N. I. Berlin.1968. Bilirubin tumover studies in normal and pathologicstates using bilirubin-'4C. Ann. Int. Med. 68: 355-377.
8. Berk, P. D., R. B. Howe, J. R. Bloomer, and N. I. Berlin.1969. Studies of bilirubin kinetics in normal adults.J. Clin. Invest. 48: 2176-2190.
9. Bloomer, J. R., P. D. Berk, R. B. Howe, and N. I. Berlin.1971. Interpretation of plasma bilirubin levels based onstudies with radioactive bilirubin. (JAMA) J. Am. Med.Assoc. 218: 216-220.
10. Berk, P. D., J. R. Bloomer, R. B. Howe, T. F. Blaschke,and N. I. Berlin. 1972. Bilirubin production as a measureof red cell life span. J. Lab. Clin. Med. 79: 364-378.
11. Owens, D., E. A. Jones, and E. R. Carson. 1977. Studieson the kinetics of unconjugated [14C]bilirubin metab-olism in normal subjects and patients with compensatedcirrhosis. Clin. Sci. Mol. Med. 52: 555-570.
12. Jones, E. A., R. Shrager, J. R. Bloomer, P. D. Berk, R. B.Howe, and N. I. Berlin. 1972. Quantitative studies of thedelivery ofhepatic synthesized bilirubin to plasma utiliz-ing 8-aminolevulinic acid-4-14C and bilirubin-3H in man.J. Clin. Invest. 51: 2450-2458.
13. Kirshenbaum, G., D. M. Shames, and R. Schmid. 1976.An expanded model of bilirubin kinetics: effect offeeding, fasting, and phenobarbital in Gilbert's syn-drome.J. Pharmacokinet. Biopharm. 4: 115-155.
14. Jones, E. A., J. R. Bloomer, P. D. Berk, E. R. Carson, D.
Bilirubin Kinetics in the Rat 1013
Owens, and N. I. Berlin. 1977. Quantitation of hepaticbilirubin synthesis in man. In The Chemistry andPhysiology of Bile Pigments. P. D. Berk and N. I.Berlin, editors. Department of Health, Education andWelfare Publication No. (National Institutes of Health)77-1100, Government Printing Office, Washington, D. C.189-205.
15. Berk, P. D., J. R. Bloomer, R. B. Howe, and N. I. Berlin.1970. Constitutional hepatic dysfunction (Gilbert's syn-drome). A new definition based on kinetic studies withunconjugated radiobilirubin. Am. J. Med. 49: 296-305.
16. Bloomer, J. R., P. D. Berk, R. B. Howe, and N. I. Berlin.1971. Bilirubin metabolism in congenital nonhemolyticjaundice. Pediatr. Res. 5: 256-264.
17. Frezza, M., G. Perona, R. Corrocher, R. Cellerino, M. A.Bassetto, and G. De Sandre. 1973. Bilirubin-3H kineticstudies: pattern ofnormals, Gilbert's syndrome and hemo-lytic states. Acta Hepato-Gastroenterol. 20: 363-371.
18. Black, M., J. Fevery, D. Parker, J. Jacobsen, B. H. Billing,and E. R. Carson. 1974. Effect of phenobarbitone onplasma [14C]bilirubin clearance in patients with uncon-jugated hyperbilirubinaemia. Clin. Sci. Mol. Med. 46:1-17.
19. Berk, P. D., B. F. Scharschmidt, J. G. Waggoner, and S. C.White. 1976. The effect of repeated phlebotomy on bili-rubin turnover, bilirubin clearance and unconjugatedhyperbilirubinemia in the Crigler-Najjar syndrome andthe jaundiced Gunn rat: application of computers to ex-perimental design. Clin. Sci. Mol. Med. 50: 333-348.
20. Scharschmidt, B. F., P. D. Berk, and J. G. Waggoner. 1973.Bilirubin (BR) kinetics in the normal rat. Clin. Res. 21:523. (Abstr.)
21. Shupeck, M., A. W. Wolkoff, B. F. Scharschmidt, J. G.Waggoner, and P. D. Berk. 1978. Studies on the kineticsof purified conjugated bilirubin-3H in the rat. Am. J. Gas-troenterol. 70: 259-264.
22. Anwer, M. S., and R. Gronwall. 1976. A compartmentalmodel for bilirubin kinetics in isolated perfused rat liver.Can. J. Physiol. Pharmacol. 54: 277-286.
23. Glaser, W., W. D. Gibbs, and G. A. Andrews. 1959. Themechanism of removal of rose bengal from the plasma ofthe rat. J. Lab. Clin. Med. 54: 556-561.
24. Weber, A. Ph., and L. Schalm. 1962. Quantitative separa-tion and determination of bilirubin and conjugated bili-rubin in human serum. Clin. Chim. Acta. 7: 805-810.
25. Wolkoff, A. W., J. N. Ketley, J. G. Waggoner, P. D. Berk,and W. B. Jakoby. 1978. Hepatic accumulation and intra-cellular binding of conjugated bilirubin. J. Clin. Invest.61: 142-149.
26. Perrelli, W. V., and C. J. Watson. 1970. Comparison of theWeber-Schalm method with the Ducci-Watson modifica-tion of the Malloy-Evelyn method for serum bilirubindetermination. Clin. Chem. 16: 239-246.
27. Broderson, R. 1972. Localization of bilirubin pools in thenon-jaundiced rat, with a note on bilirubin dynamics innormal human adults and in Gilbert's syndrome. Scand.J. Clin. Lab. Invest. 30: 95-106.
28. Ostrow, J. D., and S. T. Boonyapisit. 1978. Inaccuraciesin measurement ofconjugated and unconjugated bilirubinin bile with ethyl anthranilate diazo and solvent-partitionmethods. Biochem. J. 173: 263-267.
29. McDonagh, A. F., and F. Assisi. 1972. The ready isomeri-zation of bilirubin IX-a in aqueous solution. Biochem.J. 129: 797-800.
30. Blanckaert, N., F. Compernolle, P. Leroy, R. Van Houtte,J. Fevery, and K. P. M. Heirwegh. 1978. The fate of bili-rubin-IXa glucuronide in cholestasis and during storagein vitro: intramolecular rearrangement to positionalisomers of glucuronic acid. Biochem. J. 171: 203-214.
31. Blanckaert, N., J. L. Gollan, and R. Schmid. 1980.Mechanism of bilirubin diglucuronide formation inintact rats. J. Clin. Invest. 65: 1332-1342.
32. Blanckaert, N., J. Gollan, and R. Schmid. 1979. Bilirubindiglucuronide synthesis by a UDP-glucuronic acid-dependent enzyme system in rat liver microsomes. Proc.Natl. Acad. Sci. (U. S. A.) 76: 2037-2041.
33. Hamilton, R. L., M. N. Berry, M. C. Williams, and E. M.Severinghaus. 1974. A simple and inexpensive membrane"lung" for small organ perfusion. J. Lipid Res. 15:182- 186.
34. Hems, R., B. D. Ross, M. N. Berry, and H. A. Krebs. 1966.Gluconeogenesis in the perfused rat liver. Biochem. J.101: 284-292.
35. Dawson, R. M. C., and W. H. Elliott. 1959. In Data forBiochemical Research. R. M. C. Dawson, D. C. Elliott,W. H. Elliott, and K. M. Jones, editors. Clarendon Press,Oxford. 208.
36. Ross, B. D. 1972. Perfusion techniques in biochemistry.Clarendon Press, Oxford. 199.
37. McDonagh, A. F., and F. Assisi. 1971. Commercial bili-rubin: a trinity of isomers. FEBS (Fed. Eur. Biochem.Soc.) Lett. 18: 315-317.
38. Ostrow, J. D., R. Schmid, and D. Samuelson. 1963. Theprotein-binding of 14C-bilirubin in human and murineserum. J. Clin. Invest. 42: 1286-1299.
39. Lightner, D. A., A. Cu, A. F. McDonagh, and L. A. Palma.1976. On the autoxidation ofbilirubin. Biochem. Biophys.Res. Commun. 69: 648-657.
40. Dixon, W. J. 1974. In BMD Biomedical programs (pro-gram BMD07RT). University of California Press,Berkeley, Calif. 387-396.
41. Simon, W. 1972. In Mathematical Techniques for Physi-ology and Medicine. Academic Press, Inc., New York.112-126.
42. Mayes, P. A. 1979. Metabolism ofcarbohydrate. In Reviewof Physiological Chemistry. H. A. Harper, V. W. Rodwell,and P. A. Mayes, editors. Lange Medical Publications,Los Altos, California. 294-320.
43. Landaw, S. A., E. W. Callahan, and R. Schmid. 1970.Catabolism of heme in vivo: comparison of the simul-taneous production of bilirubin and carbon monoxide. J.Clin. Invest. 49: 914-925.
44. Lester, R., and P. D. Klein. 1966. Bile pigment excretion:a comparison ofthe biliary excretion ofbilirubin and bili-rubin derivatives. J. Clin. Invest. 45: 1839-1846.
45. Blanckaert, N., K. P. M. Heirwegh, and Z. Zaman. 1977.Comparison of the biliary excretion of the four isomers ofbilirubin-IX in Wistar and homozygous Gunn rats.Biochem. J. 164: 229-236.
46. Lester, R., and R. Schmid. 1963. Intestinal absorption ofbile pigments. I. The enterohepatic circulation of bili-rubin in the rat. J. Clin. Invest. 42: 736-746.
47. Lester, R., and R. Schmid. 1963. Intestinal absorption ofbile pigments. II. Bilirubin absorption in man. N. Engl.J. Med. 269: 178-182.
48. Scharschmidt, B. F., J. G. Waggoner, and P. D. Berk. 1975.Hepatic organic anion uptake in the rat. J. Clin. Invest.56: 1280-1292.
49. Farrell, G. C., J. L. Gollan, and R. Schmid. 1980. Efflux ofbilirubin into plasma following hepatic degradation ofexogenous heme. Proc. Soc. Exp. Biol. Med. 163: 504-509.
50. Gollan, J. L., A. F. McDonagh, and R. Schmid. 1977. Bili-verdin IXa: a new probe ofhepatic bilirubin metabolism.Gastroenterology. 72: 1186. (Abstr.)
51. Schmid, R., I. Diamond, L. Hammaker, and C. B. Gunder-sen. 1965. Interaction of bilirubin with albumin. Nature(Lond.). 206: 1041-1043.
52. Schmid, R., and L. Hammaker. 1963. Metabolism and dis-
1014 J. Gollan, L. Hammaker, V. Licko, and R. Schmid
position of C'4-bilirubin in congenital nonhemolyticjaundice.J. Clin. Invest. 42: 1720-1734.
53. Blanckaert, N., P. M. Kabra, F. A. Farina, B. E. Stafford,L. J. Marton, and R. Schmid. 1980. Measurement of bili-rubin and its mono- and diconjugates in human serum byalkaline methanolysis and high-performance liquidchromatography. J. Lab. Clin. Med. 96: 198-212.
54. Acocella, G., L. T. Tenconi, R. Armas-Merino, S. Raia,and B. H. Billing. 1968. Does deconjugation of bilirubinglucuronide occur in obstructive jaundice? Lancet. I:68-69.
55. Okolicsanyi, L., P. Mangenat, and J. Frei. 1968. Deconju-gation of bilirubin glucuronide by the liver. Lancet. I:1173-1174.
56. Fishman, W. H., and A. J. Anlyan. 1947. ,8-Glucuronidaseactivity in human tissues. Some correlations withprocesses of malignant growth and with the. physiologyof reproduction. Cancer Res. 7: 808-817.
57. Musa, B. U., R. P. Coe, and U. S. Seal. 1965. Purifi-cation and properties of human liver /3-glucuronidase. J.Biol. Chem. 240: 2811-2816.
58. Jansen, F. H., and B. H. Billing. 1971. The identificationof monoconjugates of bilirubin in bile as amide deriva-tives. Biochem. J. 125: 917-919.
59. Fevery, J., B. Van Damme, R. Michiels, J. De Groote, andK. P. M. Heirwegh. 1972. Bilirubin conjugates in bile ofman and rat in the normal state and in liver disease. J.Clin. Invest. 51: 2482-2492.
60. Gordon, E. R., T-H. Chan, K. Samodai, and C. A. Goresky.1977. The isolation and further characterization ofthe bili-rubin tetrapyrroles in bile-containing human duodenaljuice and dog gall-bladder bile. Biochem. J. 167: 1-8.
61. Blanckaert, N. 1980. Analysis of bilirubin and bilirubinmono- and diconjugates. Determination of their rela-tive amounts in biological samples. Biochem. J. 185:115-128.
Bilirubin Kinetics in the Rat 1015