Student Retention Literature review v - Attract Project · The first trial aimed to test and...
44
Student Retention Literature review v.2 ATTRACT WP8 Sub-Report Ed. Ulla Rintala & Anna-Kaarina Kairamo Aalto University 20.9.2012
Transcript of Student Retention Literature review v - Attract Project · The first trial aimed to test and...

Student Retention Literature review v.2 ATTRACT WP8 Sub-Report
Ed. Ulla Rintala & Anna-Kaarina Kairamo Aalto University
20.9.2012

2
Structure of work in the ATTRACT WP8 “Student retention”
A significant proportion of engineering and technology students fail to graduate. Student retention is
an increasing concern in many institutions of higher education. High non-completion rates are
undesirable for several reasons. Retention not only has an impact on individual students and their
families, but also produces a ripple effect on the postsecondary institutions, the workforce and the economy.
ATTRACT – Enhance the Attractiveness of Studies in Science and Technology – is a European
Commission supported project aiming to increase knowledge and inform practice about student
recruitment and retention in engineering and technology education. The project aims to compare
situations in the partner countries, broaden national discussion at European level, and design and field-test a number of interventions in the field. The project runs from January 2010 to October 2012.
ATTRACT Work Package 8 “Student Retention” elaborates the complex phenomenon of student
retention in different countries and partner universities and is looking for good practices to increase
student retention and completion rates through so-called field trials. In the first half of the project, a comparative study of state-of-the-art knowledge and practices in
student retention in different countries and universities was gathered and put in relation to an extensive
literature review. In order to review and compare the status in different participating countries,
information about partners’ education systems, funding and selection mechanisms, institutional
progression rules and student progression monitoring systems were gathered. Additionally, the partners provided statistics and other evidence on retention as well as described their current retention
policies, strategies and successful initiatives both at national and at institutional level. All this
information was gathered in country reports and in a student retention comparison framework.
At the same time, it was also decided that the project should test the usability of an instrument called
“What Works in Student Retention?” which mainly aims to assess the perceptions and the specific causes of attrition and the factors that may affect retention in higher education.
In the second half of the project, a number of field trials were conducted, based on the findings of
country reports, literature review and discussions in partner meetings. The WP8 working group agreed
to explore deeper the different practices carried out by the participating universities. The chosen trials provided different approaches to information and actions:
• Footprint
• Working with questionnaires
• Interaction, academic integration, tutoring and mentoring The first trial aimed to test and evaluate a method of visualizing and monitoring student retention in
a so-called footprint in selected fields of programs and test how different organizations’ information system are able to provide comparative information.
The purpose of the second trial was to benchmark practices in gathering information from large
groups of students on their perceptions of studies, orientation, study choices and academic integration.

3
The third trial focused on the issue of interaction between students and staff with special emphasis
on the interaction supporting academic integration of students and student progression, and the early
identification of students at risk. Within this trial, good practices in different universities were
collected. Finally, the project resulted in further analysis of findings and exchange of ideas and experiences as
well as formulation of a common glossary and providing conclusions and recommendations regarding
student retention in higher engineering education. The work done and conclusions made in the
ATTRACT Work Package 8 “Student Retention” are summed up in the ATTRACT final report. The
final report includes as appendices also the “Student retention comparison framework” and the “Case studies on academic integration, tutoring and mentoring” work out by Work Package 8 group.
In addition, publicly available are the following sub-reports of work carried out in Work Package 8
“Student Retention”: o Selected country reports o Student retention literature review o What works in student retention? o Footprint report o Knowing our students – workshop report
The reports are available at ATTRACT project website http://attractproject.org
This report is the literature review of Work Package 8.

4
Contents
1. Glossary .............................................................................................................................. 5
2. Introduction ........................................................................................................................ 8
3. Student retention as a phenomenon .................................................................................... 9 3.1 Concepts and definitions .........................................................................................................9 3.2 Retention indicators ..............................................................................................................10 3.3 Statistical review of the retention phenomenon ....................................................................12 3.4 Why is student retention an issue in science and technology? .............................................17
4. Modeling student retention ............................................................................................... 19 4.1 Different approaches to student retention .............................................................................19 4.2 Synthesis of various theories .................................................................................................20 4.3 Academic and social integration ...........................................................................................22 4.4 Studies in engineering ...........................................................................................................24 4.5 First-year experience .............................................................................................................26
5. National approaches to the phenomenon and related studies ........................................... 31 5.1 Belgium .................................................................................................................................31 5.2 Finland ..................................................................................................................................32 5.3 Ireland ...................................................................................................................................33 5.4 Portugal .................................................................................................................................34 5.5 Sweden ..................................................................................................................................35
References ................................................................................................................................ 38

5
1. Glossary This glossary gives an overview of some of the specific terms related to student retention in higher
education. The glossary is not intended to be exhaustive, but to define a common set of concepts, valid
for retention studies conducted within the scope of the ATTRACT project. Some educational terms
have also been added. Whenever possible, the definitions were retrieved from the ECTS Users’ Guide,
the OECD Glossary on Education Terms or the Life Long Learning Programme Glossary.
Terms and concepts
Definitions
Academic integration
One of two complementary processes by which students become part of the higher education context. Academic integration is seen as having two dimensions. The structural, and more formal, part represents meeting explicit standards of the education, such as passing sufficient grades. The normative, and more informal, part represents coming to terms with the more implicit normative structure of the education, such as valuing certain things more than others. This process is an integral part of theoretical models for student retention, such as the Student Integration Model (Tinto, 1975; 1987) and the Student Attrition Model (Bean, 1983).
Advice Involves a brief consultation in order to give someone accurate and adequate information, and to give suggestions about the implications of that information; this may involve the use of counseling skills, and of information technology and other forms of accessing data. (Pereira 1997)
Attrition The process of students leaving their education, primarily due to institutional structures and processes. The process is an important part of Beans (1983) Student Attrition Model and draws on an organizational perspective. Sometimes the term is used to describe all processes making students leave their education.
Attrition rate The percentage of students who leave education within a specified period of time. Coaching Working with the student, identifying his or her skills, needs and aims, developing
a coaching plan that he or she agrees to, owns and wants to action, then working with the student to help him or her achieve it. (Wisker et al. 2008)
Completion rate
The percentage of students who graduate.
Counseling A range of activities such as information, assessment, orientation and advice to assist learners to make choices relating to education and training programs or employment opportunities. (The LLP Glossary)
Counselor Someone who focuses on facilitating a student’s work, always respecting the student’s values and working with the student’s resources; the counselor creates a trusting relationship with a positive climate in order to permit the student’s expression of feelings and clarification of life situations. (Wisker et al. 2008)
Credit (ECTS) Quantified means of expressing the volume of learning based on the workload students need in order to achieve the expected outcomes of a learning process at a specified level. One ECTS credit generally corresponds to 25–30 hours of work. One Academic year consists of 60 ECTS credits. (The ECTS Users’ Guide)
Dropout (1) The act of leaving university prematurely (commonly before completing a degree). (2) A student who leaves university prematurely (commonly before completing a degree).
Dropout, Permanent
(1) The act of leaving university prematurely and never returning. (2) A student who leaves university prematurely and never returns.
Dropout, Temporary
(1) The act of leaving education temporarily and returning later. (2) A student who leaves the education temporarily and returns later. Often used synonymously with Stopout.

6
Dropout rate The proportion of students who leave the specified level in the educational system without obtaining a first qualification. (The OECD Glossary)
Early warning system
Monitoring system for identifying students likely to fail academically or to encounter serious problems assimilating into the college environment. (Beck and Davidson 2001)
First-year experience
Students' experiences of their studies during their first year of study. The term is also used about institute initiatives to enhance and improve student experiences during this time. (Willis 2008)
First-year student questionnaire
Questionnaire to students during or after their first year of study students to learn about their first year experience.
Graduate A former student who has achieved an academic degree. Graduation The act of achieving or conferring an academic degree. Graduation rate
Graduation rates – a measurement practice used by for example OECD – usually represent the estimated percentage of an age cohort that has completed certain type of education (net graduation rate) or the number of graduates, regardless of their age, divided by the population at the typical graduation age (gross graduation rate (The OECD Glossary)
Guidance A range of activities such as information, assessment, orientation and advice to assist students to make choices relating to education and training programs or employment opportunities. (The LLP Glossary)
Incoming student questionnaire
Questionnaire to beginners/incoming students to learn more about background of students and to increase knowledge of the impact of different recruitment initiatives.
Learning Outcomes
Statements of what a learner is expected to know, understand and be able to do after successful completion of a process of learning. (The ECTS Users’ Guide)
Mentor A role model who offers support to another person. A mentor has knowledge and experience in an area and shares it with the person being mentored. (The LLP Glossary)
Mentoring Broadly encompasses a more experienced, possibly older, peer mentoring someone less experienced, to empower and enable them to develop necessary skills so that he or she can be effective as a learner, depending on the context, and to enhance his or her own personal coping strategies, sense of self-worth and success. (Wisker et al. 2008)
Non-persister A student who leaves university prematurely. Peer mentor/ tutor
Students who are trained and supervised to provide practical assistance and personal support to persons of similar age or experience, including problem-solving, decision-making, listening, mutual sharing, and action planning. (Wisker et al. 2008)
Persistence The desire and action of students to remain in higher education and complete their degree. (Berger et al. 2012)
Persister A student who enrolls in university and remains enrolled. Program, Educational
A set of educational components based on learning outcomes that are recognized for the award of a specific qualification. (The ECTS Users’ Guide)
Progression The process which enables learners to pass from one stage of a qualification to the next and to access educational programs that prepare for qualifications at a higher level that those he/she already possesses. (The ECTS Users’ Guide)
Progression rules
Set of rules that define conditions for learners’ progression within qualifications and towards other qualifications. (The ECTS Users’ Guide)
Retention The ability of an institution to retain students from admission to graduation. (Berger et al. 2012)
Retention rate The percentage of a defined group of students who remain in education for some defined time.
Retention policy/strategy
A formal policy or strategy by the university regarding how to work on improving retention.
Social One of two complementary processes by which students become part of the higher

7
integration education context. Social integration represents the congruency between a student and the social environments of the education. This process concerns both interaction with peers and between university staff and students. Social integration is an integral part of theoretical models for student retention, such as the Student Integration Model (Tinto 1975, 1987) and the Student Attrition Model (Bean 1983).
Stopout (1) The act of leaving education temporarily and returning later. (2) A student who leaves the education temporarily and returns later. Often used synonymously with Temporary dropout.
Survival rate The proportion of new entrants to the specified level of education who successfully complete a first qualification. (The OECD Glossary)
Tutor An experienced and competent professional who will support the learner during the learning process. (The LLP Glossary)
Tutoring Any activity of guidance, counseling or supervision of a learner by an experienced and competent professional. (The LLP Glossary)
Withdrawal, Forced
Dropout from university studies arising from insufficient levels of academic performance, from the breaking of established rules or as a result of some external events. (Tinto 1975, 1993)
Withdrawal, Voluntary
Leaving university studies based on students’ own decisions. (Tinto 1975, 1993)
Work load An indication of the time students typically need to complete all learning activities (such as lectures, seminars, projects, practical work, self-study and examinations) required to achieve the expected learning outcomes. (The ECTS Users’ Guide)

8
2. Introduction A significant proportion of engineering and technology students fail to graduate. Student retention is
an increasing concern in many institutions of higher education. High non-completion rates are
undesirable for several reasons. Retention not only has an impact on individual students and their
families, but also produces a ripple effect on the postsecondary institutions, the workforce and the
economy. Or as Levitz et al. (1999) have elegantly put it “as budgets tighten, competition for students increases, resources shrink and regents, legislatures, taxpayers, and prospective students and their
families take up the cry for institutional accountability, institutions that put students first will succeed,
even excel, just as their students will”.
Student retention is a topic that has involved considerable research interest especially in the UK and
USA but also increasingly in Europe. Differences in assumptions and contexts, however, mean that findings applicable in one part of the world may be more or less irrelevant in other parts. There are
differences between countries, educational sectors and even areas of study in terms of retention. In this
report outcomes of studies both in general and in engineering education, outside and inside of the
partner countries, are discussed to understand the complexity of the phenomenon. A synthesis of literature is also presented in the ATTRACT final report, but with less detail. The
present report begins with an overview of the retention phenomenon itself (Chapter 3), stating its
relevance in technology and engineering education, then proceeding to a conceptual analysis of
student retention, including a synthesis of various models and theories reflecting upon the question of
differences between general and engineering universities, the different factors contributing to staying/leaving, and especially the first-year experience (Chapter 4). Also national approaches to
student retention in the partner countries are presented (Chapter 5).

9
3. Student retention as a phenomenon This chapter gives an overview of the phenomenon and discusses some of the most used terms and
definitions related to student retention based on literature review. We also recommend the reader to
have a look at the Glossary provided in the beginning of this report. References are made to glossary,
literature review and especially the OECD's annual Education at a Glance.
3.1 Concepts and definitions
There is currently much interest not only in access to higher education but also in student success.
Not surprisingly, concern about high dropout rates in higher education has also increased over the years, since “although participation in higher education has expanded significantly in recent years, the
proportional figure for dropout has remained relatively stable” at least in the UK (Thomas 2002).
There is also a large body of international research and theory exploring the impact of various
individual, social and organizational factors on student retention in higher education (Tinto 1975, 1993; Benn 1982; Astin 1984; Johnes 1990; Pascarella and Terenzini 1991; Moortgat 1997; Berger
and Braxton 1998; Ozga and Sukhnandan 1998; and Thomas 2002).
In the 1960’s John Summerskill (1962) showed that within each type of institution, institutional
retention rates vary between 18% and 88%. Summerskill also suggested developing a standard
formula for measuring student retention so that the reported rates could be accurately compared. Almost five decades later, however, such a formula does not yet exist but the concept of retention and
its appropriate measurement tools still remain ambiguous (Hagedorn, 2006). The following elaborates
some of the most used definitions related to student retention, while the different measurement
practices are discussed more in detail in chapter 3.2.
The difficulty with international comparison often lies in the differences between national systems, concepts and performance indicators. This is also the case with student retention – a complex,
confusing and context dependent concept – which is not only difficult to define in universal terms but
also rather challenging to measure and control. It has, however, been suggested that withdrawal from
university can arise either from voluntary withdrawal or from forced withdrawal (academic dismissal). While voluntary withdrawal is based on students’ own dropout decisions, forced withdrawal usually arises from insufficient levels of academic performance or from the breaking of established
rules concerning proper social and academic behavior. (Tinto 1993). A student who enrolls in
university and remains enrolled until degree completion is usually referred to as a university persister.
A student who leaves the university without earning a degree and never returns, in turn, is a non-persister or dropout. While these definitions are rather simple and easy to understand, student paths
are rarely this direct or straightforward (Hagedorn 2006).
Retention and dropout are also widely used concepts and typically defined as two sides of the same
coin. Simplistically, retention is staying in university until completion of a degree and dropping out is leaving university prematurely (Hagedorn 2006). The concept of retention, however, is far more complicated due to the prevalence of student enrolment in several different institutions throughout
their educational career (Astin 1971). Former dropouts may also return and transform into “non-

10
dropouts” either in the same institution where they previously dropped out or in another institution
(Hagedorn 2006). It has also been pointed out that “many who leave university do not see themselves
as failures, but rather see their time in post-secondary education as a positive process of self-discovery
that has resulted in individual, social and intellectual maturation” (Tinto,1987). Thus, student retention should be further complicated to consider students’ educational goals.
Persistence and retention (attainment) are terms often used interchangeably. The American National
Center for Education Statistics (NCES), however, has differentiated the terms by using retention as an
institutional measure and persistence as a student measure. In other words, “institutions retain and
students persist”. Another term commonly used with retention is attrition which is the process of students leaving their education, primarily due to institutional structures and processes. Finally, two
important terms are also graduate and graduation. A graduate is usually considered as a former
student who has achieved an academic degree. So he/she has persisted. However, not all persisters
graduate. A graduate can, therefore, claim only one institution regardless of enrolment at other
universities. (Hagedorn 2006) In addition, at least four basic types of retention – institutional, system, in the major (discipline) and
in a particular course – have been distinguished (Hagedorn,2006):
• Institutional retention is the most basic and easy to understand. In essence, it is the measure of the proportion of students who remain at the same institution from year to year.
• System retention, in turn, focuses on the student. Using system persistence as a measure, a
student who leaves one institution to attend another one is not considered as a non-persister but a persister.
• Retention within a major or discipline takes a more limited view of the topic by viewing
retention within a major area of study, discipline or a specific department.
• The smallest unit of analysis is retention within a particular course which measures retention by course completion.
It is also worth noting that depending on the terminology used, the phenomenon of retention may
have quite a different connotation: while in the USA researchers often use the word “persistence” to indicate students who persist in pursuing their degree and not dropping out, in Europe many
researchers prefer to use the term “retention” which implies that it is the universities that need to
retain their students (Van Stolk et al. 2007). This also shows that the phenomenon can be viewed
from very different perspectives. Also in the ATTRACT project we have used the word “retention”
to describe the overall phenomenon. However, besides retention the project has also dealt with issues such as progression, dropout and graduation.
3.2 Retention indicators
As can be seen from a wide variety of statistics, there is no single formula for measuring student
retention. According to various sources, however, there seems to be six dominant measurement
practices – namely retention rates, dropout rates, attrition rates, completion rates, survival rates, and
graduation rates – that are the most commonly accepted and widely used. Definitions and formulas both at national and at institutional level, however, tend to vary (see table 1). Some terms may also be
used interchangeably.

11
Table 1. Measuring student retention – definitions and examples of formulas.
Measure Definition Examples of common formulas (among the ATTRACT partners)
Attrition rate
The percentage of students who leave education within a specified period of time
Completion rate
The percentage of students who graduate • Finnish Ministry of Education and Culture: the remainder of 100 % - dropout rate, where the dropout rate is the ratio of dropouts to dropouts and graduates in total
• OECD/Portuguese Ministry for Science and Education: the ratio of the number of students who graduate from an initial degree during the reference year to the number of new entrants in this degree n years before, with n being the number of years of full-time study required to complete the degree
Dropout rate
The proportion of students who leave the specified level in the educational system without obtaining a first qualification (The OECD Glossary)
• Finnish Ministry of Education and Culture: the ratio of dropouts to dropouts and graduates in total
• Statistics Finland: the ratio of dropouts to all students
• IST: the ratio of dropouts year n / n+1 to enrollments year n-1 / n (= dropout rate in year n/ n+1)
Graduation rate
The estimated percentage of an age cohort that has completed certain type of education (net graduation rate) or the number of graduates, regardless of their age, divided by the population at the typical graduation age (gross graduation rate) (The OECD Glossary)1
Retention rate
The percentage of a defined group of students who remain in education for some defined time
Survival rate
The proportion of new entrants to the specified level of education who successfully complete a first qualification (The OECD Glossary)
Sometimes the performance indicators or data-monitoring systems that are in place do not
necessarily allow for the tracking of students in a way that would meet the national or institutional 1 In some countries the graduation rate corresponds more to the completion rate indicator described above. In the Swedish context for example, graduation rates are usually specified as the proportion of graduates within a certain number of years subsequent to the start of an education. Also national throughput measurements include the graduation rate indicator which is measured by carrying out follow-up of beginner students after three, five, seven and eleven years to find out what percentage of those has graduated.

12
definitions, and vice versa. For example in the Irish context, where student withdrawal is defined in
terms of non-presence, students who remain recorded as present within a given program are deemed to
be retained, while those recorded as non-present are withdrawn. Within these parameters any student
who repeats a given year or who changes program within their original institution is classified as present and thus retained. The current data-monitoring system, however, does not allow for the
tracking of students across different institutions, and as a result an undergraduate who transfers from
one institution to another is classified as not having progressed. (HEA 2010)
It is also worth noting that single measures of student retention usually do not tell the whole story.
The existing concepts and indicators seldom cover all students and as such may provide inaccurate measures of student retention. Generally, the formulas tend to exclude for example part-time students,
returning students, and transfers. (Hagedorn 2006) In one of the ATTRACT WP8 trials (Footprint) we
also tested in practice how comparable the different indicators used by different universities are.
3.3 Statistical review of the retention phenomenon
In order to get a better picture of the phenomenon, let us have a closer look at some of the
educational statistics provided mainly by the Organization for Economic Cooperation and Development (OECD). These statistics also give us a good starting point for international comparison.
Tertiary graduation rates indicate a country’s capacity to produce workers with advanced,
specialized knowledge and skills. In OECD countries, there are strong incentives to obtain a tertiary
qualification, including higher salaries and better employment prospects. Tertiary education varies
widely in structure and scope among countries, and graduation rates are influenced by both the degree of access to these programs and the demand for higher skills in the labor market. (OECD 2011)
In 2009, graduation rates for tertiary-type A programs2 averaged 39 % among the 27 OECD
countries with comparable data. The proportion ranges from around 20 % in Mexico and Turkey to 50
% or more in Iceland, New Zealand, Poland and the Slovak Republic. Disparities in graduation rates
are even greater between women and men. The gender gap in favor of women is especially wide in Iceland, Poland and the Slovak Republic (more than 25 percentage points), while in Germany, Mexico
and Switzerland, there is practically no gender gap. In contrast, in Japan and Turkey, more men than
women graduate from tertiary-type A education. (OECD 2011)
Furthermore, an average of 10 % of today’s young adults in the OECD countries complete tertiary-type B education3. Only in Canada, Ireland, Japan, New Zealand and Slovenia more than 20 % of
students graduate from these types of programs. International students make a significant contribution
to tertiary graduation rates in a number of countries. For countries with a high proportion of
international students, such as Australia, New Zealand and the United Kingdom, graduation rates are
artificially inflated. This is because all international graduates are, by definition, first-time graduates, 2 Tertiary-type A programs are largely theory-based and are designed to provide qualifications for entry into advanced research programs and professions with high requirements in knowledge and skills. The institutional framework may be universities or other institutions, and the duration of the programs ranges from three years (e.g. the honors bachelor’s degree in many colleges in Ireland and the United Kingdom, and the licence in France) to five or more years (e.g. the Diplom in Germany). (OECD 2011) 3 Tertiary-type B programs are classified at the same level of competence as those more theory-based programs, but are often of shorter duration (usually two to three years) and vocationally-oriented. Generally, they are not intended to lead to university-level degrees, but rather to lead directly to the labor market. (OECD 2011)

13
regardless of their previous education in other countries. (OECD 2011). The first-time graduation rates
from tertiary-type A and B programs are presented in figure 1.
Figure 1. First-time graduation rates for tertiary-type A and B programs (1995 and 2009) (Education
at a Glance 2011, chart A3.2).
In every country for which comparable data are available, tertiary-type A graduation rates increased
between 1995 and 2009. The increase was particularly steep between 1995 and 2000, then leveled off. On average among the OECD countries with available data, tertiary-type A graduation rates have risen
by 19 percentage points over the past 14 years while rates for tertiary-type B programs have been
stable. In comparison, while doctorates represent a minor proportion of tertiary programs, the number
of doctoral graduates has been growing at an annual rate of 5 % since 2000. (OECD 2011)
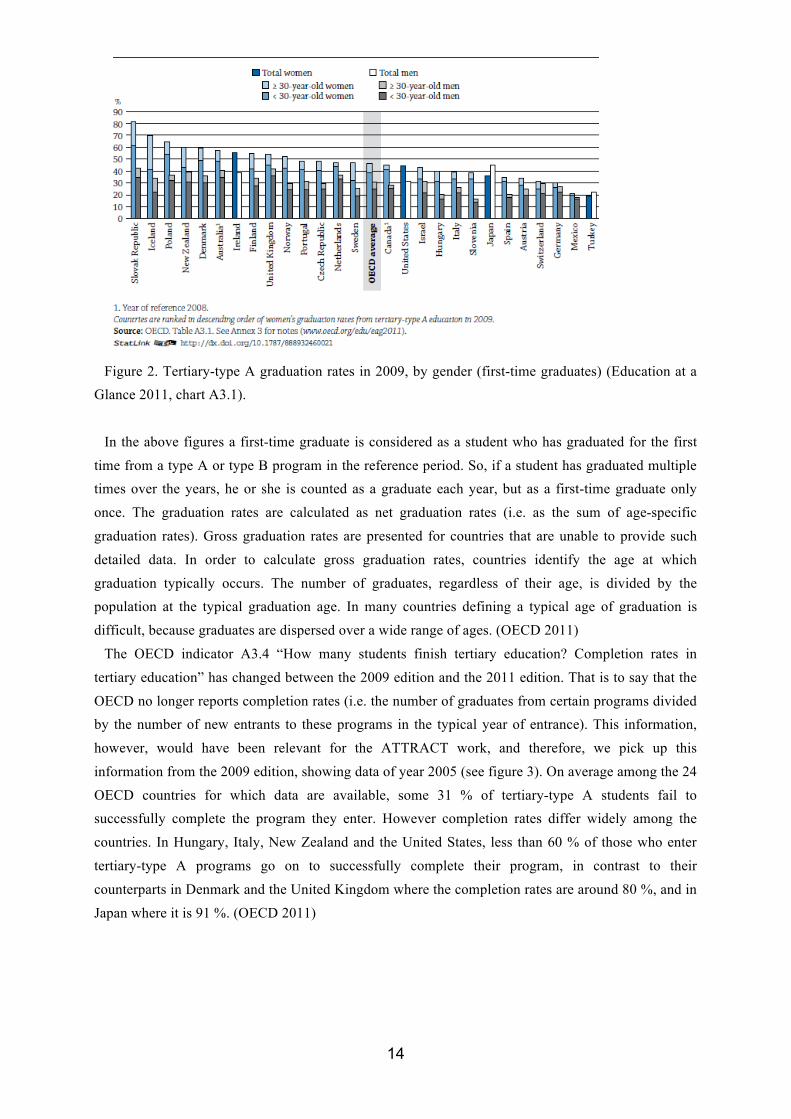
Based on current patterns of graduation, it is estimated that an average of 46 % of today’s women and 31 % of today’s men in the OECD countries will complete tertiary-type A education (largely
theory-based) over their lifetimes. Only 39 % of women and 25 % of men will do so before the age of
30. In some countries, it is common for students older than 30 to graduate from tertiary-type A
programs. More than 30 % of women in Iceland and Sweden who graduate from these programs, and more than 30 % of men in Iceland and Israel who do so, are over 30. (OECD 2011). The tertiary-type
A graduation rates are presented by gender in figure 2.
14
Figure 2. Tertiary-type A graduation rates in 2009, by gender (first-time graduates) (Education at a Glance 2011, chart A3.1).
In the above figures a first-time graduate is considered as a student who has graduated for the first
time from a type A or type B program in the reference period. So, if a student has graduated multiple times over the years, he or she is counted as a graduate each year, but as a first-time graduate only
once. The graduation rates are calculated as net graduation rates (i.e. as the sum of age-specific
graduation rates). Gross graduation rates are presented for countries that are unable to provide such
detailed data. In order to calculate gross graduation rates, countries identify the age at which
graduation typically occurs. The number of graduates, regardless of their age, is divided by the population at the typical graduation age. In many countries defining a typical age of graduation is
difficult, because graduates are dispersed over a wide range of ages. (OECD 2011)
The OECD indicator A3.4 “How many students finish tertiary education? Completion rates in
tertiary education” has changed between the 2009 edition and the 2011 edition. That is to say that the
OECD no longer reports completion rates (i.e. the number of graduates from certain programs divided by the number of new entrants to these programs in the typical year of entrance). This information,
however, would have been relevant for the ATTRACT work, and therefore, we pick up this
information from the 2009 edition, showing data of year 2005 (see figure 3). On average among the 24
OECD countries for which data are available, some 31 % of tertiary-type A students fail to successfully complete the program they enter. However completion rates differ widely among the
countries. In Hungary, Italy, New Zealand and the United States, less than 60 % of those who enter
tertiary-type A programs go on to successfully complete their program, in contrast to their
counterparts in Denmark and the United Kingdom where the completion rates are around 80 %, and in
Japan where it is 91 %. (OECD 2011)

15
Figure 3. Tertiary-type A completion rates in 2005 (first-time graduation) (source: Education at a Glance 2009, table A3.4).
What comes to statistics available for science and engineering, examining the number of graduates
in science-related fields (science and engineering, manufacturing and construction) per 100,000 25–34
year-olds in employment, might also be of interest to the ATTRACT work. The number of science graduates (all tertiary levels) per 100,000 employed persons ranges from below 1,000 in Hungary to
above 2,500 in France, Korea and New Zealand (see figure 4). On the other hand, it is also worth
noting that this indicator does not provide information on the number of graduates actually employed
in scientific fields or, more generally, the number of those using their degree-related skills and knowledge at work.
Figure 4. Tertiary graduates in science-related fields among 25–34 year-olds in employment, by
gender (2009) (Education at a glance 2011, chart A4.6).
0 10 20 30 40 50 60 70 80 90
100
Japa
n D
enm
ark
Uni
ted
Kin
gdom
G
erm
any
Bel
gium
(Fl.)
C
anad
a (Q
uebe
c)
Port
ugal
Fi
nlan
d A
ustr
alia
A
ustr
ia
Net
herl
ands
Sl
ovak
Rep
ublic
Sw
itze
rlan
d Sw
eden
O
EC
D a
vera
ge
Cze
ch R
epub
lic
Nor
way
Ic
elan
d Fr
ance
Po
land
M
exic
o N
ew Z
eala
nd
Hun
gary
U
nite
d St
ates
It
aly

16
On the other hand, as the figures above show, in terms of different variables (e.g. entry, graduation
and completion rates) two countries may have similar graduation rates but significant differences in
the other two variables. Thus, we have to be careful when analyzing these figures. As aforementioned, tertiary education also varies widely in structure and scope among countries, and thus graduation rates
for instance are influenced by both the degree of access to these programs and the demand for higher
skills in the labor market. (OECD 2011).
Also employment before and after graduation matters. Kivinen and Nurmi (2011) for instance have
added yet another dimension to the issue, namely labor market relevance. As figure 5 shows, in countries like Finland where study times are typically long, the university graduates are able to find
employment in positions corresponding to their educational background faster than in some other
countries, where study times are perhaps not as long. This is partly believed to result from the
combination of work and study at earlier stages (Kivinen and Nurmi 2011, Aho et al. 2012).
Figure 5. University students’ careers in 12 European countries (Kivinen and Nurmi 2011).

17
3.4 Why is student retention an issue in science and technology?
Student retention has already for long been among the most widely researched areas in higher
education. The generalizability of research in this field, however, is problematic due to cultural and structural differences between countries, universities and even programs where research is done. In
recent years, much effort has been put in attracting young people to engineering. However, once the
students are in universities, there is another challenge: how to retain them? In Sweden for instance,
where the number of new entrants to engineering programs has grown by 50 % in the last 15 years, the graduation rates have simultaneously declined significantly. This illustrates a common problem; the
students apply for engineering degrees, but the universities fail to retain them (Forsman 2011).
Van den Bogaard (2011) has also pointed out that engineering students tend to drop out of university
more often and they take a longer time to graduate than their peers in non-engineering programs. For
example in Sweden, around 7000 students register in Master’s programs in engineering each year. A national survey (HSV 2009), however, shows that around 2200 of them drop out of this type of
engineering education. The same survey also shows that only about 37 % of the students graduate
within the nominal study time (in 2005/2006 and 2006/2007), whereas the typical study time tends to
be the nominal study time + one year for approximately 70 % of the graduates and the nominal study
time + 2 years for approximately 86 % of the graduates. Another interesting example comes from the Netherlands where at Delft University of Technology
(DUT) for instance around 35–50 % of the students leave without a diploma, and the students who
graduate take 7.2 years on average for a 5-year program (Van den Bogaard 2011). Furthermore, in
Finland at Aalto University, approximately 85 % of all the applicants actually enroll in the university, and some 26 % of those aiming for a Master’s degree drop out. These figures cover all students in the
field of engineering, economics and art. The de facto percentage of dropouts – when the study time
has been at least 12 years – is approximately 32 %. The number of dropouts is the highest among
engineering students. (Nivaro 2012)
On the other hand, in Belgium the situation is somewhat different. Compared to the global data of all KU Leuven programs, the Faculty of Engineering has slightly better scores: engineering students
persist better than others. A possible explanation for this could be the fact that engineering education
is often a “well-considered” choice. Engineering is considered difficult so the students want to be sure
about their choice of study. Consequently, students who succeed in their first year really want to
persist in their effort. In terms of progression, however, the Faculty of Engineering at KU Leuven is not that different: approximately 50 % of the starting bachelor students obtain their degree in three
years and an extra 15–20 % in four years. The dropout rate has also increased from 25 % in 2005 to 30
% in 2007. In general, student progression for university students in Flanders is 77 %, which means
that students obtain 77 % of the credits they could, despite the length of their educational program. Nevertheless, student retention is an increasing concern in many institutions of higher education.
High dropout rates are undesirable for several reasons. Hagedorn (2006) for example has expressed
that “retention not only has an impact on the individual and his/her family but also produces a ripple
effect on the postsecondary institutions, the work force and the economy”. Indeed, retention is one of
the most common ways students, parents and stakeholders evaluate the effectiveness of institutions of

18
higher education. A positive reputation increases the university’s attractiveness. Furthermore, when a
student drops out from a university, the institutional resources are not spent wisely (Hagedorn 2006)
Retention also has a significant workforce effect, when the non-persisting students do not have the
university education and credentials to enter the professional workforce (Andrade et al. 2002).

19
4. Modeling student retention This chapter explores some of the most influential theories behind student departure. In this section,
we will also reflect upon the question of differences between general and engineering universities in
terms of student retention. References are made to literature review, country reports and comparison
framework.
4.1 Different approaches to student retention
As aforementioned, the issue of retention may be approached from a wide variety of perspectives.
Also the experiences and challenges related to student retention may vary depending on the perspective or actor in question; (inter)national policy makers, higher education institutions, teachers,
tutors, instructors and learners all have different views of the phenomenon (see figure 6). Generally,
we can divide different actors into three major strands, which represent the different approaches of
perspectives. Macro level represents ideology, social context and policy-making, meso level institutional conditions, and micro level classroom and peer interactions. The levels of motivation,
activities and goals may also vary.
Figure 6. Different levels of motivation, activities and goals (Becher 1994).
As Becher (1994) has demonstrated, comparative studies in higher education tend to focus on
macro-level contrasts between the structures of one system and another. However, this leaves some important issues unexplored, as the approach overlooks the significant internal distinctions of different
disciplines. Furthermore, there is the tendency for the administrators to lay down uniform
specifications to be observed across the whole range of programs. Yet different programs are also
influenced by the ecosystem of the industrial field they educate their students to. For example the attractiveness of e.g. civil engineering and also the willingness of students to complete their civil
engineering studies are above all influenced by the economic situation in the construction industry.
This represents the organizational meso level. Enquiries at micro level would appear less prone to this

20
limitation. (Becher 1994) reminds us that within each level there are sub-systems that need to be taken
into consideration. Forsman (2011) for instance has identified four nested systems that can be
described as (1) university support issues, (2) institutional quality and reputation issues, (3)
students’ social issues, and (4) students’ degree program issues. It is also worth noting that education cannot be seen as separate from its context: values that are
prevalent in a society are reflected in the way education is organized and who has access to education
(McLean 1995, Wiegersma 1989). A striking example of this is the selection process. Even within
Europe there are significant differences between countries. The education systems may be based on
similar values, but education is organized in many different ways (see also the ATTRACT WP6 final report). This observation of differences is of high importance, because the differences in systems
imply that seemingly similar phenomena like failure or dropout are understood in different ways
within systems and carry a different weight. In other words, failure has different implications for
different students depending on the context. (Van den Bogaard 2011)
4.2 Synthesis of various theories
Over the years several theories have been developed to explain the dropout phenomenon. Psychological models of educational persistence such as those by Summerskill (1962), Marks (1967),
Rossmann and Kirk (1970), Waterman and Waterman (1972), and Ethington (1990) all emphasize the
impact of individual abilities and dispositions upon student departure, and try to distinguish stayers
and leavers in terms of attributes of personality. These models also see that retention and departure are
primarily the reflection of individual actions and therefore are largely due to the ability or willingness of the individual to successfully complete the task associated with university attendance. Moreover,
these models invariably see student departure as reflecting some sort of shortcoming or weakness in
the individual. (Tinto, 1993)
The psychological view of student departure, however, is only a partial truth. According to Cope
and Hannah (1975), there is no one “departure-prone” personality, which is uniformly associated with student departure. Sharp and Chason (1978), in turn, have argued that individual behavior is as much a
function of personality as well as of the environment where the individual find helself. The
psychological theories, hence, tend to ignore the forces that represent the impact that institutions have
upon their students’ behavior. They also suggest that student attrition could be substantially reduced either by improving students’ skills, or by selecting the individuals who possess the personality traits
most appropriate for university work. However, there is no widespread evidence to support this
argument. (Tinto 1993)
The environmental theories of student departure such as those by Kamens (1971), Pincus (1980),
Iwai and Churchill (1982), Stampen and Cabrera (1986, 1988), and Braxton and Brier (1989) are at the other end of the spectrum. They emphasize the impact of wider social, economic and organizational
forces on the behavior of students within institutions. These may include for example students’ social
status and race (social), economic hardships (economic), and faculty-student ratios (organizational).
These theories, however, focusing on the external forces in the process of student persistence, are
seldom able to explain the different forms of student departure that arise within institutions. In addition, many of these factors tend to be of just secondary importance to other conditions as well as

21
short-term in character. Therefore, they cannot explain the continuing long-term patterns of student
departure. (Tinto 1993)
Over the years also other theories and models have been, several of them trying to explain the
complex phenomenon of student retention as well as to understand and inform the various institutional interventions aiming to diminish student dropout. One of the most dominant theories is Tinto’s
Student Integration Model, according to which the processes of interaction between the individual
and the institution lead to differing individuals to drop out from institutions of higher education. Thus,
Tinto’s model emphasizes the importance of academic and social integration of students in the
prediction of student retention. (Tinto 1987, 1993) The processes of academic and social integration are discussed more in detail in chapter 4.3. Another rather influential theory has been the Student Attrition Model presented by Bean, which builds upon process models of organizational turnover
(March and Simon 1958) and models of attitude-behavior interactions (Bentler and Speckart 1979,
1981). Bean has indeed argued that student attrition is analogous to turnover in work organizations
and stresses the importance of behavioral intentions as predictors of persistence behavior. The Student Attrition Model also recognizes that factors external to the institution can play a major role in
affecting students’ attitudes and decisions. (Bean 1980)
Continued work in the area suggests that both these models have a predictive value and that
educational persistence (see figure 7) is a product of a complex set of interactions among personal (e.g. explanations that relate to the students themselves, such as background, motivation and study
approaches), institutional (e.g. explanations directly associated with the education, such as objectives,
content, teaching, institutional climate, guidance and counseling) and external (e.g. statements that
relate to the student's ambient surroundings, such as financial situation, housing, work and leisure
time) factors where a successful match between the student and the institution is particularly important (Cabrera et al. 1992, Hede and Wikander 1990). Indeed, the most important actors in the nexus of
issues related to student retention are arguably the students and university staff (Tinto 1997).
Figure 7. Factors contributing to student progression and completion (adapted from Ruutu 2010).

22
4.3 Academic and social integration
As aforementioned Tinto (1975, 1993) has formulated a theoretical model that explains the processes
of interaction between the individual and the institution that lead to differing individuals to drop out from institutions of higher education. The model has its roots in Durkheim’s theory of suicide,
according to which, suicide is more likely to occur when individuals are insufficiently integrated in the
society (Durkheim 1961). William Spady (1970), in turn, being the first to apply Durkheim’s theory of
suicide to dropout, argued that when one views the university as a social system with its own value and social structures, dropout from that social system can be treated in a manner analogous to that of
suicide in the wider society.
The Student Integration Model argues that the process of dropout from university can be viewed as a
longitudinal process of interactions between the individual and the academic and social systems of the
university during which a person’s experiences in those systems continually modify his goals and institutional commitments in ways which lead to persistence or to varying forms of dropout (see figure
8). While the academic system concerns itself almost entirely with the formal education of students,
the social system centers about the daily life and personal needs of the various members in the
institution, especially the students. There is also a difference between the formal (e.g. classrooms,
laboratories, extracurricular activities) and informal (e.g. the day-to-day interactions between faculty, staff and students) worlds of the university. (Tinto 1975, 1993)
Figure 8. Student Integration Model (adapted from Tinto 1993).
According to Tinto (1993), integration to the academic system of the university, especially in its
formal components, is seen as directly linked to those forms of departure which arise from substantial incongruence or mismatch between the skills and abilities of the individual and the level of demand
placed by the academic system of the university. Academic difficulty typically reflects a situation in
which the demands of the academic system are too great. Academic boredom, in turn, often results
when the demands are not challenging enough. Incongruence may also result from a substantial
mismatch between the intellectual orientation of the student and that of the institution. (Tinto 1993)

23
Contact with faculty and staff may also influence student departure in many ways. Though the
presence of interaction does not by itself guarantee persistence, the absence of it almost always
enhances the likelihood of departure. Indeed, wide-ranging contact generally leads to higher
commitment and, therefore, serves to enhance the likelihood of persistence. The absence of interaction, in turn, results not only in lower commitment and possibly lower individual goals, but also
in the person’s isolation from the intellectual life of the university. Experiences in the formal and
informal social systems are also seen as leading to voluntary withdrawal. They may do so either in the
form of social incongruence or social isolation. Especially interactions among students (peer
interaction) in that system are viewed as central to the development of social bonds that serve to integrate the individual into the social communities of the university. (Tinto 1993)
Indeed, supportive peer relationships are crucial to the successful integration of students. Studies (for
example Yorke and Longden 2007) also show that especially engineering students tend to take a rather
pragmatic approach to seeking support often by turning to their peers instead of teachers for help. Also
student unions and associations play an important role in the integration process. This may occur for example through participating in the university’s tutoring activities, reception of new students and
various extracurricular activities (sports, culture, language courses, etc.).
There is also an important interplay between the different segments of the university (academic and
social, formal and informal) (see figure 9). Since these segments involve many of the same actors, events in one necessarily impact upon activities in the other. This may be the case in both positive and
negative ways. For example experiences in the informal academic system may influence one’s
experiences into the formal domain of that system, when rewarding interactions between faculty, staff
and students outside the classrooms and offices may lead directly to enhanced intellectual
development and, therefore, to greater intellectual integration in the academic system. They may also result in greater exposure of students to the multiple dimensions of academic work and, therefore,
indirectly lead to higher levels of formal performance. (Tinto 1975, 1993)
Figure 9. The relationship between different segments of the university (Rintala 2012).
24
Finally, several findings in the literature also show that student integration and involvement
evidently improve students’ academic success (Tinto 1975, 1993; Astin 1984, 1991; Parker and
Schmidt 1982; Ory and Braskamp 1988; Belch et al. 2001), which in turn significantly predicts student
retention (Allen 1999, Mitchel et al. 1999, Murtaugh et al. 1999, Veenstra et al. 2009, Wei and Bai 2010). Wei and Bai (2010) have also argued that academic integration has a direct effect on student
retention, whereas social integration has an indirect effect on student retention through university.
More recently, Tinto (2010) has also argued that students who find themselves in settings that hold
high expectations for their success, provide needed academic and social support, and frequent
feedback about their performance, and actively involve them, especially with other students and faculty, in learning are also more likely to succeed and continue within the institution.
Similarly Borland (2001–2002) has reminded us that although the early interventions designed to
diminish attrition have mainly concentrated on single programs or services, more recently the “holistic
approaches encompassing academic affairs, student affairs and administration have become the norm”.
In accordance with this general tendency, Berger has also reviewed organizational studies of undergraduate persistence and as a result generated a set of recommendations for organizational
practices that can lead to student success. These include:
• providing students with information and clear lines of communication about campus goals, values, policies and procedures
• providing opportunities for students to participate in organizational decision-making
• providing a campus environment characterized by fairness towards the students
• providing students with advocates
• building a shared meaning through authentic symbols that are used with integrity
• assessing student perceptions of organizational behavior on campus
Also Kuh (2001–2002), in accordance with Berger, has made a proposal for practices necessary for
cultivating student success. His proposal highlights the importance of:
• clarifying institutional values and expectations early and often to prospective and
matriculating students
• conducting comprehensive examination of the student experience inside and outside the classroom
• removing obstacles to student success associated with disciplinary cultures
• consistently using good practices in teaching, learning and retention programs
• intentionally tying the curriculum to students’ lives outside the classroom to bring students
ongoing contact with one another and with campus resources
4.4 Studies in engineering
Over the years also several studies into engineering education have been made. In what follows we
will provide an overview of some of the most interesting ones, as well as discuss how engineering
universities differ, if any, from general universities in terms of student retention and progression. This
chapter will mainly build upon on literature findings presented by Van den Bogaard (2011) in her
article “Explaining student success in engineering education in Delft University of Technology; a

25
synthesis of literature”. Studies both into general and engineering education conducted in the partner
universities and countries will be discussed more in detail in chapter 5.
Felder for instance, in collaboration with other authors, has published a notable series on chemical
engineering student performance and retention in the Journal of Engineering Education between 1993 and 1998 (Van den Bogaard 2011) looking at the effects of learning styles (Felder et al. 1993),
instruction (Felder 1995, Felder et al. 1998), gender (Felder et al. 1995) and rural/urban setting of the
school (Felder et al. 1994). They have argued that it is possible to identify students at risk already
early on based on their background variables and scores on Myers-Briggs Type Indicators4 (Felder et
al. 1993). Zhang et al. (2004) in turn have looked at graduation rates in engineering in 6 years after enrollment.
They have looked at nine universities and only considered six predictor variables. They have
discovered that there are differences in which variables matter significantly for each university.
Ohland et al. (2008) and Araque et al. (2009) have compared students who persist in engineering and
students who persist in non-engineering fields, and they have discovered no significant differences between students in how they rate the quality of their education, nor in time spent on studying.
Araque et al. (2009) have also profiled students who have dropped out of programs in arts,
humanities and computer engineering of a university in Southern Spain, and discovered that the three
models are different, but certain variables also appear repeatedly in the explanation of dropout in all programs. These are starting age, parental socio-economic status, academic performance, success,
average grade, prior education and in some cases also the number of rounds needed to pass. Students
with weak educational strategies and without persistence to achieve their aims in life have low
academic performance and low success rates which implies a high risk of abandoning the degree.
In the USA French et al. (2005) have followed two cohorts of engineering undergraduates in a large Midwestern university and found that SAT5 scores, high school rank and gender have a significant
positive effect on Grade Point Average (GPA), which is also a good predictor of re-enrolment together
with student motivation. Non-cognitive variables like motivation play a significant role in predicting
success in engineering. Other researchers have also looked at attributes of curriculum organization. Olds and Miller (2004) for instance have found that “average” engineering students who are selected
to take part in an integrated curriculum with a fostering learning community do significantly better
than their peers and reflect that the experience has a strong and positive effect on their college careers.
Tynjälä et al. (2005) have also looked at the relationships between characteristics of the learning
environment and students’ study orientations and study success in a technical university in Finland using GPA, credits per semester and students’ qualitative evaluation of their learning outcomes as
indicators. The findings indicate that students’ perceptions of the learning environment are related to
their study orientations which in turn are related to study success. A deep study strategy is found to be
the most important predictor of success. A surface strategy, low academic confidence and a lack of
self-regulation in turn are factors negatively related to study success. In other words, meaning-oriented 4 The Myers-Briggs Type Indicator (MBTI) assessment is a psychometric questionnaire designed to measure psychological preferences in how people perceive the world and make decisions. (Ref. Myers, Isabel Briggs with Peter B. Myers (1980, 1995). Gifts Differing: Understanding Personality Type. Mountain View, CA: Davies-Black Publishing.) 5 The SAT is a standardized test for college admissions in the United States.

26
and self-regulated students using a deep strategy show the most success, opposed to students who are
externally regulated using a surface approach.
Furthermore, Vogt (2008) has looked at the role faculty plays in student success, and she has found
that faculty distance lowers self-efficacy, academic confidence and GPA. Conversely, academic confidence has a positive effect on self-efficacy which in turn has strong positive effects on effort and
critical thinking. Finally, Seymour and Hewitt (1997) have carried out significant ethnographic work
in the field of engineering education by analyzing patters of persistence in sciences, math and
engineering in seven different types of 4-year institutions in the USA. The researchers have reported
not having found the switchers and non-switchers to be two different kinds of people; they do not differ by individual attributes of performance, attitude, or behavior to any degree sufficient to explain
why one group leaves and the other one stays.
Seymour and Hewitt (1997) have also found that the most common reasons for switching usually
arise from a set of problems which, to varying degrees, are shared by switchers and non-switchers
alike. What distinguishes the survivors from those who leave is the development of particular attitudes or coping strategies, both legitimate and collegiate. Serendipity also plays a part in persistence, often
in the form of intervention by faculty at a critical point in the student's academic or personal life.
However, switching decisions are never the result of a single overwhelming concern. They are always
the upshot of a push and pull process over time which typically involves reactions to problems with science, math and engineering (SME) majors, concerns about SME careers and the perceived merits of
academic or career alternatives. Furthermore, ability alone is not enough to stay in engineering since
also good students leave.
Furthermore, many researchers who have looked into student success in engineering education have
also included a great number of variables in their work and come up with a range of variables that is very similar to the one found in general education. Therefore, researchers like Van den Bogaard
(2011) for instance have also concluded that the variables that work in general education also apply to
engineering education, although conditions in the latter are somewhat different. On the other hand,
there are also researchers like Veenstra et al. 2009 who have argued that engineering education should be considered uniquely different from education in other disciplines, especially during the first year.
The first-year experience is discussed more in detail in the following chapter.
4.5 First-year experience
Various theories of dropout usually consider two points in time: the point of entry, and some later
time when dropout or persistence is determined (Simpson et al. 1980). It is believed that the forces that
lead to dropout in the early stages of academic career can be quite different from those that influence
dropout later. These may also differ for different types of students. (Tinto 1982). Factors that frequently appear as significant predictors of student retention may not appear significant to
graduation. One must, therefore, be careful in defining success in various longitudinal studies, as
variables which appear significant in the short run – that is before graduation – may not, in fact, be
significant in the longer run. (Zhang et al. 2004). Research has, however, shown that the first two
years at university are crucial for student retention. For example Mallinckrodt and Sedlacek (1987) have argued that the freshman attrition rates are typically greater than any other academic year and are

27
commonly as high as 20–30 %. Tinto (1993) and Tinto et al. (1994), in turn, have stated that 25 % of
university students drop out after their first year. Among all dropouts, 75 % leave university in the first
two years (Tinto 1987, 1988).
The first-year experience is highly significant not only in terms of predicting students’ on-going success in tertiary education, but also as it is the time when students are most vulnerable in terms of
academic failure, as well as most likely to experience social, emotional, and financial problems
(McInnis 2001). Furthermore, it has been established that the first few weeks at university have
important implications for students’ long-term engagement and persistence (Macdonald 1995, Erskine
2000). Beder (1997) for instance has pointed out that it is during the course of the first year when most students develop their appropriate identity and become socially integrated in the university, as well as
attain their learning skills and other general qualities.
Tinto (2010) has also shown that students who find themselves in settings that hold high
expectations for their success, provide academic and social support, and frequent feedback about their
performance, and finally that actively involve their students in learning are more likely to succeed and continue within the institution. The importance of support and feedback, involvement and relevant
learning are especially important during the first year, in which students acquire new skills, qualities,
and norms needed to learn and grow throughout their educational career (Beder 1997, Tinto 2002).
Unfortunately, however, the first year at university is often somewhat isolated and uninvolving as far as learning is concerned (Tinto 2002).
The process of entering university has been compared to the process of moving from one community
to another (Tinto 1988). It is a process where students must leave the familiar and begin again in an
unfamiliar environment. Tinto (1988) has proposed that the process of beginning university studies
consists of three distinct stages (see table 2) where student integration is fundamental in making the transition process successful (for example Terenzini and Pascarella 1977, Tinto 1988, Beder 1997,
Huon and Sankey 2002, Wilcox et al. 2005).
Table 2. Staged in the process of entering university (Tinto 1988).
1) Separation In this stage, the students disassociate themselves from their membership in prior communities (largely school and home environments). This is a process which is stressful for virtually all students.
2) Transition In this stage, students interact with others (faculty, staff and students) in the new environment and begin to make connections. This is a period where students have not quite separated themselves from the past, and not quite acquired the norms of academic and social interaction with the new context in which they are operating. The stressfulness of this stage largely depends on the degree to which the new environment relates to the old environment in which students have previously been operating. For some students, the process of transition may be minor and relatively seamless, while for others the transition may take considerable time and effort. In terms of withdrawing from study, it is during the first two stages that first-year students are seen to be at greatest risk (Hillman 2005).
3) Incorporation In this stage, students “face the problem of finding and adopting norms appropriate to the new setting and establishing competent memberships in the social and intellectual communities”. One key element in achieving the stage of incorporation is the students’ integration in the academic and social domains of the university (Tinto 1975, 1988, 1993).

28
As aforementioned, the first year is an important time for all students. However, the pressures on
students are numerous and many do not succeed, especially in the engineering are of studies, where a
combination of factors, including difficulty of the subject and mismatching of student and academic expectations, seem to have resulted in higher dropout rates than for many other subjects (HESA 2006).
Some researchers (for example Veenstra et al. 2009) have indeed argued that engineering education
should be considered uniquely different from education in other disciplines. They have also found that
general models of dropout such as those by Tinto (1975, 1993) do not adequately address engineering
student retention. This happens for a number of reasons. 1) A major in engineering (and in other pre-professional and professional programs) tends to
prepare a student for a specific career, whereas majors in liberal arts or sciences are less
focused on a career.
2) Focus of the freshman engineering curriculum is often on developing strong analytical skills
and problem-solving using technology, something which appears guite demanding for freshman in math and science courses.
3) Secondary education provides more “university-prep courses” for majors in liberal arts and
sciences than for engineering (at least in some countries).
4) Studies (for example Astin 1993) show that engineering students generally achieve less academic success (lower grades) in the first semester than other students.
Consequently, Veenstra et al. have developed a working model for freshman engineering retention
based on Tinto’s theory (see figure 10). In this model, emphasis is placed on the pre-university
characteristics as predictors for student academic success and retention. These characteristics include
high school academic achievement, quantitative skills, study habits, commitment to career and educational goals, confidence in quantitative skills, commitment to enrolled university, financial
needs, family support, and social engagement. Interestingly, a significant finding of a review of
empirical studies on student retention shows differences between pre-university characteristics for
engineering education studies compared to general university education studies. The most dominant pre-university characteristics defining this difference are “quantitative skills” and “confidence in
quantitative skills” (Veenstra et al. 2009), which are evidently much more significant in engineering
education.

29
Figure 10. Model for freshman engineering retention (adapted from Veenstra et al. 2009).
While both Tinto’s (1975, 1993) and Veenstra’s et al. (2009) models take into account the pre-
university characteristics of entering students and their impact on student retention, the primary focus at least in Tinto’s model is not on the student attributes but rather, as Tinto (1993) expressed it, on the
impact the institution itself has upon the dropout behaviors of its own students. Indeed, also other
issues matter. According to a First-Year Experience Survey, conducted by the Higher Education
Academy (2006), two key factors have been found to considerably influence the likelihood of withdrawal among first-year students: (1) students’ prior knowledge of their institution and their
program and (2) how stimulating they feel their teaching to be. On the other hand, there is no single
reason why (first-year) students leave university. As Shobrook (2003) has expressed it, it is important
that we conceptualize student progression as a series of interrelated processes and remember that each
student and their experiences are unique. Yet another perspective on the first-year experience is given by the Quality Assurance Agency for
Higher Education which has stated in its report (Mayes 2009) that the first-year experience is, as
aforementioned, “crucial not just for the quality of the learning experience that takes place during the
first year itself, but crucial for all later learning”, since “attitudes and habits acquired early on shape
the learners’ approach to study for the rest of their higher education experience, and beyond”. The report is also very valuable since it counts with the student’s active participation, exploring methods
“that more closely align the perspectives of the student and the institution”, and finding ways of
distributing responsibility for the educational outcomes more evenly between students and institutions.
The concepts of “engagement” and “empowerment” are presented under the umbrella question “How can an institutional culture acknowledge and help to shape the peer attitudes and norms that are
so influential in the first-year experience?”, and topics such as peer mentoring, peer-support and peer-
tutoring of the first-year students are explored. Furthermore, the report discusses issues like
establishing a culture of sharing learning outputs, encouraging engagement with employability issues
in the first-year curriculum and collaborative work that is carefully designed and carefully led to encourage the nurturing of peer relationships that engage with learning tasks. Finally, the report

30
stresses that the key to understanding what works more widely is to “acknowledge the context-bound
nature of the first-year experience” and also the importance of putting the emphasis, in the first-year
experience, on success rather than on the avoidance of failure. The first year in higher education
“should reward commitment, rather than reward doing just enough, and should strive to communicate to new students the privilege and excitement of the new opportunities in front of them”. (Mayes 2009)
Within the scope of this study David Nicol (2008) has also suggested that formative assessment and
feedback in the first year offers a powerful framework for analyzing formative assessment, relating
this concept to engagement, empowerment and academic and social integration (see figure 11) and
further identifying 12 formative assessment principles.
Figure 11. Assessment principles and their application to the first year (Nicol 2008).
Finally, the institutional challenges identified in the report Include producing an explicit strategy for
the first year, shifting resources into an increased provision for the first year, improving the quality of the data about the first-year experience, raising the status of first-year teaching and defining the
overarching learning outcome of the first year as “academic literacy”. Also Willis (2008) has
presented a detailed set of suggestions for enhancing the first year experience for engineering students
including the introduction of a pre-entry and induction audit, again providing a stimulating and supportive teaching and learning environment, and introducing a personal development plan (also
mentioned by Mayes 2009).

31
5. National approaches to the phenomenon and related studies
As we have already seen, the issue of student retention is of relevance at many different levels and,
apart from being very complex, a rather context-bound in nature. This is also the reason why it is so
important to look at the issue from national perspectives. Student retention is an important question
not only from the institutional perspective, but also at governmental level, particularly for agencies of education. Governmental initiatives to explore retention as well as to improve it can be found in many
countries. There are also many examples at university level of exploration projects and redemptive
programs. We have also found some examples of research initiatives to explore student retention.
These commonly draw on theories, such as the Student Integration Model (Tinto 1975, 1993), but also
some other models argue that success in higher education is largely dependent on a positive interaction between the individual and the university/educational program. This chapter gives an overview of
some of the most interesting studies carried out in some of the partner countries and universities.
References are made to country reports and comparison framework.
5.1 Belgium
In Belgium education is a regional authority: the Ministry of Education belongs to the Flemish (or
Walloon) government. Therefore, the situation explained below concerns only the Flemish part of the country, where KU Leuven is situated. It is also worth noting that at KU Leuven a bachelor student
who does not start his/her master’s program is considered as a dropout – also from the viewpoint of
employers.
Since dropout rates are considered to be rather low in Flanders (see chapter 3.4), there has been no
urge to conduct thorough research concerning retention. In general, however, it has been discovered that engineering students persist slightly better than others and that most dropouts occur between the
first and the second year. Reasons for withdrawal are as diverse as the number of withdrawals, but the
overall opinion has been that some starters seem to fail in assessing themselves concerning their
knowledge and skills for academic or engineering education.
Before 2003 engineering students in Flanders had to pass an entrance examination before entering the university. The abolition of this exam did not result in a spectacular rise in student numbers, but
the students entered the engineering programs less prepared. Consequently, the professors had
difficulties in coping with the contrast between expected and real level of prior knowledge. In other
words the starting cohort was much more heterogeneous from 2003 onwards. At KU Leuven this challenge is remediated before entry with online tests, summer courses for
secondary school students in their final year, and starting from 2012 with the so-called mathematics
calibration test. After the test, the participants receive feedback about their position regarding the
group and eventually about how to prepare for entry in the engineering program. The calibration test is
also believed to have predictive value for the success rates of the students and to allow for an estimation of the mathematical skills of the group, considered useful for the academic staff.

32
A possible and desirable side effect is also to influence teachers in secondary schools prepare their
students for the test. Moreover, the (academic) staff cooperates with teachers in order to improve the
preparation of youngsters for higher education, not only in the calibration test but also in various projects and working groups. At entry level the students are also coached by “monitors” (in English:
tutors) – that is professors or assistants – who explain difficult topics to the students, make exercises
with them in smaller groups, and give advice before and during the examination period. Students can
also make an appeal to the Study Advice Team for counseling.
As a conclusion, once the students have entered the program and succeeded in their first year, they also tend to persist until graduation. Hence, the focus at the Faculty of Engineering Science at KU
Leuven is on orienting incoming students and helping them to make the right choice of study. The
discussion on how to proceed is on-going: the mathematics calibration test is considered to be an
interesting pilot, which could also become of high importance in this discussion.
5.2 Finland
In international comparison the dropout phenomenon seems less significant in Finland. However, problems caused by long study times are not. An international comparison shows that Finnish
university graduates enter the labor market later than their European counterparts. In addition, Finnish
youth tend to start their academic studies relatively late compared to many other nationalities (Davies
et al. 2009).
On the other hand, other studies (e.g. Kivinen and Nurmi 2011) have also shown that Finnish university graduates are able to find employment faster than some of their European counterparts
despite the long study times. This may be the result of combining of work and study (Kivinen and
Nurmi 2011, Aho et al. 2012). Also the students emphasize the importance of internships / relevant
work experience during education (TEK 2012). Indeed, there seems to be three main elements under
discussion in Finland; (1) entry of students to the system (including admission and access), (2) progression and completion (including flexibility, course architecture and support), and (3) labor
market outcomes. (Ministry of Education 2007, 2010; OECD 2009)
In technical universities and faculties the progress of bachelor-level studies in the new two-tier study
structure has been followed in a national monitoring project “Monitoring, evaluating and developing study processes on the branch of technology” in 2005–2009 and afterwards. The premise for the study
was the reform of the university curriculum and degrees implemented in year 2005 in accordance with
the Bologna Declaration. (Erkkilä 2010) Flexibility in studying, work load, financial support,
effectiveness of teaching arrangements, interplay between work and study as well as student
counseling and support were issues often raised in the project. Furthermore, the study showed that students entering on the basis of their matriculation examination
results gained on average the most credits in the first three years of studies, whereas students who
entered based on their entrance examination results gained the least credits. These findings can be
attributed, at least in part, to the fact that students admitted based on their matriculation examination
results have already achieved high grades in mathematics and sciences in upper secondary school. This is particularly significant since in many degree programs the first year is comprised mainly of

33
mathematics and physics, so prior achievement in these areas is an advantage. (Pakarinen 2010) The
study also showed that student progression was the slowest among those students who had not been
able to complete their compulsory mathematics courses during the first three years of study – the
nominal study time for completing a Bachelor’s degree (Rantanen and Liski 2009). On the other hand, the above results do not take into account factors such as a student’s background, motivation,
financial circumstances, or quality of learning, all of which can also affect progression. (Pakarinen
2010)
Also other initiatives have been taken at Aalto University to study student retention, particularly in
engineering programs. Rintala (2012) for instance has studied the impact of academic and social integration on first-year students’ expectations and commitment in the degree program of Bioproduct
technology at Aalto University. She has found that the positive evolution of expectations and sense of
commitment during the first year are evidently interlinked, but that the role of interaction between the
student and the university is also rather complex. Rintala has also discovered significant differences
between individual students. Ruutu (2010) has emphasized the role of academic and social integration in student progression in her study on “Progressing and Promoting Freshman Studies in
Communications Engineering – Integrating Students to The Scientific Community” at Aalto
University.
Another rather recent study conducted at the University of Oulu also shows some rather interesting results about engineering students and their study paths; “Students with satisfactory learning results in
upper secondary school do better than expected in their university studies, whereas students with
better success in upper secondary school underachieve in their university studies. Furthermore,
students whose success is better than average during the first academic year are also better in the
following years.” In other words, prior performance in upper secondary school does not correlate with performance in university. However, good performance during the first year evidently correlates with
good performance at later stages and vice versa. (Honkanen 2011).
The awareness of universities on student retention has risen over last years. There are manifold
actions already taken and to be taken by them. One of the major changes taking place in Aalto is the bachelor’s degree program reform. As a result of the reform, first-year studies will place particular
emphasis on providing personal study guidance, encouraging students to study full-time and
monitoring student progression more systematically. The new programs will be launched at the
beginning of the 2013/2014 academic year.
5.3 Ireland
In Ireland feeling that the students have made the “wrong choice of program” has been identified as
the most significant factor contributing to dropout among higher education students (e.g. Baird 2002, Mathews and Mulkeen 2002). On the other hand, program choice is also demonstrated to become a
less significant factor as students proceed further with their studies. (Baird 2002) The fact that the
majority of students are withdrawing from programs, which they initially ranked among their top three
preferences, also indicates a disparity between students' expectations of a program before entering
third level, and their experiences of it upon arrival.

34
Several examinations of dropout in Ireland have also attempted to ascertain whether or not there is a
correlation between the number of points a student achieves in the Leaving Certificate examinations,
and subsequent withdrawal from third level. The findings demonstrate somewhat various results. The
relationship between Leaving Certificate points awarded and performance at third level seem to vary, among other things, according to the field of study. (Lynch et al. 1999) Some researchers (e.g.
Mathews and Mulkeen 2002), however, have found a correlation between mathematics achievement at
Leaving Certificate and student progression at third level.
Research carried out for the Irish Higher Education Authority (HEA) adds a further dimension to the
issue. The research has looked at data from all seven universities in Ireland and found a relationship between completion rates and the points required at entry (that is the minimum point requirement for
entry into a given program which a student must either meet or exceed). The results demonstrate the
following; “in programs with high entry points, 81.7 % of students graduate on time and only 9.2 %
fail to complete the program for which they first enrolled. In the case of programs with medium entry
points, 72 % graduate on time and 15.2 % do not complete their programs. In programs with low entry points and programs with restricted entry, less than two-thirds of the students graduate on time and a
fifth does not complete the program.” (Morgan et al. 2001). Finally, other research in Ireland also
highlights the fact that most withdrawing students return to third-level study within a year of their
initial departure, either at the same university or elsewhere (IUA). Mathews and Mulkeen (2002), in turn, have stated that only a very small percentage of students leave third-level education entirely.
5.4 Portugal
In Portugal the Ministry of Science, Technology and Higher Education (2007) developed a measure
comprising the release of innovative pedagogical pilot projects and research/diagnosis projects aiming
to reduce the dropout rate in higher education by half. The measure was accomplished with the release
of a special program entitled “School achievement, and combat against dropout and underachievement
in H.E.”, in which 23 intervention projects and 5 research projects were selected. As an example, one of the projects included a case study, conducted in the Engineering Faculty of Oporto University, in
which the representation of school success and failure concerning management bodies, student support
offices, teachers and students was analyzed. The study discovered that for the students, dropout means
above all incapacity of adaptation to higher education and failure of the student support offices and of the management strategy. The student support offices in turn perceived it as a vocational problem,
while teachers blamed the management for unawareness of the problem, high number of students per
class, the obligation to attend the classes, and the low motivation of students to attend the classes. The
management also identified the last two items as being a problem, in addition to vocational issues and
course preference. In terms of school success, the students identified some best practices that could promote school
success. These included for example the introduction of more motivating pedagogical practices and
the presentation of explanations on the impact of class subjects on professional life. The student
support offices in turn mentioned the introduction of more flexible pedagogical practices, the creation
of socialization areas versus traditional higher education in the classroom, and the communication between all higher education agents as practices to be promoted. Furthermore, the teachers found that

35
they should invest more time in teaching rather than in research. They also advocated the introduction
of pedagogical practice seminars and the submission of pedagogical surveys as potential best
practices. Finally, the management bodies mentioned the need to identify students’ learning profiles as
they enter university, the implementation of learning evaluation diagnosis instruments, the early course unit planning (identifying the required volume of working hours), the creation of student
support offices, and a better communication between all management structures within the institution
in order to increase academic success.
Another project studying the academic success and strategies in science and engineering programs
concluded that the absence of pedagogical activity support units in Portugal implies difficulties in the implementation of intervention strategies. In the project students identified the teachers’ motivation
and interest showed in them, the proposal of extra class assignments, the encouragement of
autonomous work with teacher feedback, the teachers’ guidance during school activities and a good
relationship between students and teachers as pedagogically positive aspects. On the other hand, they
also identified low encouragement to do autonomous work, low feedback to the students’ work, and low incentive to group work as pedagogically negative aspects. Measures that were found to have a
positive impact on students’ academic success in turn included for example the diversity of evaluation
methods, the correlation between old subjects and new subjects, more exercises, more interactive and
dynamic classes with students’ participation. The students also found that teachers could give more feedback and promote group work, be more in touch with the students, as well as be more available
and motivated. The teachers responsible for the classes with lower grades in turn explained that
students’ underachievement was mainly due to their approach to the class, lack of study strategies, low
commitment and endeavor, low autonomy and prejudice related to the class.
Some Portuguese researchers question an evaluation of academic success considering uniquely retention or persistence rates, and consider academic success an inclusive concept, where cognitive
and metacognitive skills, as well as behavioural and communication skills should be considered, since
they’re of paramount importance for the student, the HEI’s, and for the employers of HE students
(Tavares & Huet Silva, 2001).
5.5 Sweden
The Swedish National Agency for Higher Education, sometimes in collaboration with Statistics
Sweden and different government agencies, has measured and explored student retention since the mid
1960’s. This has resulted in a number of different reports and recommendations. “Strengthened
support for studies” (2009) evaluated and provided proposals on how the new regulations for student
grants could stimulate higher throughput. “Studies – Career – Health” (2007) evaluated the university colleges’ and universities’ work with educational guidance, career counseling and student health.
Another national report on “Good examples of how universities and university colleges work with
educational guidance, career counseling and student health care” (2007) also provided suggestions on
a number of practical steps that can be of benefit and applied in practice. The need for a good
grounding prior to university studies and how this grounding affects study results at university has also been evaluated in “The Link between grades in upper-secondary school and achievements at

36
university” (2007) and in “Beginner students and mathematics; mathematics teaching during the first
years of technical and scientific education” (2005). Of particular interest has been the report "Reasons
for study departure” (2010) which explores reasons for study departure given by students leaving
vocational programs before achieving a degree. A number of universities and university colleges in Sweden have also conducted studies regarding
student retention. An early work in the field was Hede and Wikander's (1990) study on “Interruptions
and study delays in legal educations; a follow-up of the admissions round fall term 1983 at Uppsala
University”. In the study, the authors created a model that assumes three principal reasons – similar to
the ones described in chapter 4.3 – for student departure. Many studies have also provided suggestions on how to prevent students from dropping out of university, by for example offering individual,
academic and social support measures and by providing feedback that can serve as an early warning
system. The measures outlined include systematic monitoring of academic performance, student
counseling, career guidance, strengthening the student's professional image and relations with
employers, various forms of mentoring programs, measures to strengthen the contact and affinity between teachers and students, and teaching efforts.
Among technical universities and university colleges, Linköping University has conducted studies
involving technology students' views on life as a student as well as proposals for and evaluations of
interventions designed to prevent students from dropping out. The project “Young Engineer” has also reported about the problems and difficulties in various engineering courses and the need for better
grounding especially in mathematics. Wikberg-Nilsson at Luleå University (LTU) in turn has
evaluated the situation, provided suggestions and studied measures to support increased throughput in
the report on “Mentoring for Students” (2008). Other studies and proposals for action include for
example “the LTU model for increased throughput and dropping out of program courses” 2006–2007 at Luleå University. Finally, Stockholm Academic Forum has published a study entitled “Hope or
drop out?” (2007) which deals with those students who decide to persist. A lot of research emanating
from both universities and other interested parties has also touched upon the study of psychosocial
aspects and student life. Mental health problems, stress and even burnout are highlighted as a concern in most of the studies.
Furthermore, the research group in Physics Education Research at Uppsala University has explored
student retention and related issues in physics and engineering programs since 2005. The studies have
underlined the importance of students’ experiences of the disciplinary and educational discourse
(Johannsen 2007). The gender perspectives of the educational experience have also been investigated (Danielsson 2009). Andersson and Linder (2010) for example have studied the relations between
motives, academic achievement and retention in the first year in the degree program of Engineering
Physics at Uppsala University. In their study four different discourse models of how students explain
their reasoning for enrolling in the program were identified. These models included “program
student”, “engineer to be”, “cosmic explorer” and “convenience student”. The group using the program student model showed the highest fraction of successful students, whereas a majority of the
students using the engineer to be model were unsuccessful or left the program. Students using the
convenience student model in turn had the largest fraction of unsuccessful and leaving students. On

37
the other hand, even more recent studies at Uppsala University have also shown that the different
student profiles as well as their impact on student success can also vary over the years.
Recently initiatives at the Physics Education Research group have also produced materials for
research-based initiatives to improve student retention (Andersson Chronholm and Andersson 2011). Recent work of the group has explored the complexity of issues behind student retention (Forsman
2011, Forsman, Linder, Moll, Fraser, and Andersson 2012), and Forsman (2011) for instance has done
research on students’ networked interaction and how it can provide researchers with (1) a deeper
understanding of how students’ network interaction is dependent on, but not determined by, the social
and academic systems of the university (Tinto, 1987, 1993, 1997), and (2) show indicators for academic success.
In “Young Engineer” project 72 Master of Science in Engineering programs were compared related
to the size of the program and success of studies. This study shows no evidence for correlation.
Program size as such obviously does not give better study environment for the students in Sweden.
Another finding of the same project was that number of credits after nominal study time correlates with the number of credits after one year in these 72 programs. Therefore, good results in year one
could be a predictor for good results further on in the program.
Gothenburg University made 2007 a national statistical investigation concerning what subjects in
upper secondary school had the greatest impact on number of taken credits in the first year of higher education. The investigation clearly expresses the correlation between higher grades in math and
physics and better results during the first year of higher education for engineering programs and for
studies of economy. Studies made in KTH confirm the conclusions of the Gothenburg study.
In Sweden incorrect choice, dissatisfaction with education, poor academic performance, and lack of
social contacts have been identified as the most significant factors contributing to dropout. In the Swedish project “Young Engineer” in turn an interview survey indicated that the students who stay
and intend to graduate usually give two reasons: first, they say that the main factor for study success is
to get study mates and form a study group early, preferably in the first semester. Second, they argue
that those who drop out “where not meant to be engineers” since they did not socialize with the study culture.

38
References Aho, S. Hynninen, S-M. Karhunen, H. and Vanttaja, M. (2012) Student employment and its impacts.
Ministry of Employment and the Economy (MEE) Publications (in Finnish), Employment and
entrepreneurship, 26/2012, 110 pp.
Allen, D. (1999) Desire to finish college: An empirical link between motivation and persistence.
Research in Higher Education, 40, pp. 461–485. Andersson Chronholm, J. and Andersson, S. (2011). Lär för din framtid – så lyckas du med
högskolestudier. Studentlitteratur: Lund, Sverige.
Andrade, S.J. Stigall, S. Kappus, S.S. Ruddock, M and Oburn, M. (2002) A Model Retention Program
for Science and Engineering Students: Contributions of the Institutional Research Office. U.S.: Texas.
Araque, F. Roldan, C. and Salguero, A. (2009) Factors influencing university dropout rates. Computers and Education, 53, pp. 563–574.
Astin, A.W. (1971) Predicting Academic Performance in College: Selectivity Data for 2300 American
Colleges. New York: The Free Press.
Astin, A.W. (1984) Student involvement: A developmental theory for higher education. Journal of College Student Personnel, 25, pp. 297–308.
Astin, A.W. (1991) What really matters in general education: Provocative findings from a national
study of student outcomes. Address presented at the Association of General and Liberal Studies
Meeting, Seattle.
Astin, A.W. (1993) Engineering Outcomes. ASEE Prism (1993, September): pp. 27–30. Baird, K. (2002) An inquiry into withdrawal from college, a study conducted at Trinity College
Dublin by the Research Team, Student Counselling Service [online]. [Retrieved 3.8.2010]. Available:
http://www.tcd.ie/Student_Counselling/research/retention.php
Bean, J.P. (1980) Dropouts and turnover: The Synthesis and Test of a Casual Model of Student
Attrition. Research in Higher Education, 12(2), pp. 155–187. Bean, J.P. (1983). The application of a model of turnover in work organizations to the student attrition
process. Review of Higher Education, 6(2), 129–148.
Becher, T. (1994) The Significance of Disciplinary Differences. Studies in Higher Education Volume
19, No. 2, pp. 151–161. Beck, H.P. and Davidson, W. (2001) Establishing an early warning system: Predicting Low Grades in
College Students from Survey of Academic Orientation Scores. Research in Higher Education, Vol
42, No 6, December 2001.
Beder, S. (1997) Addressing the Issues of Social and Academic Integration for First Year Students. A
Discussion Paper, December 1997. Belch, H.A. Gebel, M. and Mass, G. M. (2001) Relationship between student recreation complex use,
academic performance, and persistence of first-time freshmen. NASPA Journal, 38(2), pp. 254–268.
Benn, R. (1982) Higher education: non-standard students and withdrawals. Journal of Further and
Higher Education, 19(3), pp. 3–12.

39
Bentler, P.M. and Speckart, G. (1979) Models of attitude-behavior relations. Educational Research
Journal, 22, pp. 35–64.
Bentler, P.M. and Speckart, G. (1981) Attitudes “cause” behaviors: a structural equation analysis.
Journal of Personality and Social Psychology, 40, pp. 226–238. Bereday, G.Z.F. (1964) Comparative method in education. London, Holt, Rinehart and Winston.
Berger, J.B. and Braxton, J.M. (1998) Revising Tinto’s Interactionalist Theory of Student Departure
through theory elaboration: Examining the role of organizational attributes in the persistence process.
Research in Higher Education, 39(2), pp. 103–119.
Berger, J.B., Ramírez, G.B. and Lyons, S. (2012) Past to Present – A Historical Look at Retention in Seidman, A. (Ed.) College Student Retention – Formula for Student Success, Plymouth: Rowman &
Littlefield Publishers.
Braxton, J. and Brier, E. (1989) Melding organizational and interactional theories of student attrition:
A path analytic study. The Review of Higher Education, 13, pp. 47–61.
Cabrera, A. F., Castaneda, M. B., Nora, A., and Hengstler, D. (1992) The Convergence Between Two Theories of College Persistence. Journal of Higher Education 63(2), pp. 143–164.
Cope, R. and Hannah, W. (1975) Revolving college doors. New York: John Wiley and Sons.
Davies, J. Weko, T. Kim, L. and Thulstrup, E. (2009) OECD Reviews of Tertiary Education: Finland
[online]. Organization for Economic Co-operation and Development (OECD), Paris. [Retrieved 4.10.2010]. Available: http://www.oecd.org/dataoecd/51/29/37474463.pdf
Durkheim, E. (1961) Suicide. (J. Spaulding and G. Simpson, trans). Glencoe: The Free Press.
Erkkilä, M. (2010) Teknillistieteellisen alan opintoprosessien seuraaminen, arviointi ja kehittäminen
[online] [updated 14.7.2010]. [Retrieved 4.10.2010]. Available:
http://opetuki2.tkk.fi/p/opintojenseuranta/ Erskine, J. (2000) Surveying the UNIPREP orientation program at the University of New South
Wales: The beginning of the transition process into university. Journal of the Australian and New
Zealand Student Services Association, 16, pp. 43–54.
Ethington, C. A. (1990) A psychological model of student persistence. Research in Higher Education, 31, pp. 279–293.
Felder, R.M. Forrest, K.D. Baker-Ward, L. Dietz, E.J. and Mohr, P.H. (1993). A longitudinal study of
engineering student performance and retention I. Success and failure in the introductory course.
Journal of Engineering Education, 82(1), pp. 15–21.
Felder, R.M. Mohr, P.H. Dietz, E.J. and Baker-Ward, L. (1994) A longitudinal study of engineering student performance and retention II. Rural/urban student differences. Journal of Engineering
Education, 83(X), pp. 209–217.
Felder, R.M. (1995) A longitudinal study of engineering student performance and retention IV.
Instructional methods. Journal of Engineering Education, 84(4), pp. 361–367.
Felder, R. M. Felder, G.N. Mauney, M. Hamrin jr, Ch. E. Dietz, E.J. (1995) A longitudinal study of engineering student performance and retention III. Gender differences in student performance and
attitudes. Journal of Engineering Education, 84(2), pp. 151–163.

40
Felder, R.M. Felder, G.N. Dietz, J.E. (1998) A longitudinal study of engineering student performance
and retention V. Comparisons with traditionally-taught students. Journal of Engineering Education,
87(4), pp. 469–480.
Finnish Ministry of Education : Opetusministeriö (2007) Opintojen keskeyttämisen vähentämisen toimenpideohjelma [online]. Keskustelumuistio 8.2.2007. Opetusministeriön monisteita 2007:2.
[Retrieved 4.10.2010]. Available:
http://www.minedu.fi/export/sites/default/OPM/Julkaisut/2007/liitteet/opm_monisteita_2.pdf?lang=fi
Finnish Ministry of Education : Opetusministeriö (2010) Ei paikoillanne, vaan valmiit, hep! [online].
Opetusministeriön työryhmämuistioita ja selvityksiä 2010:11. [Retrieved 4.10.2010]. Available: http://www.minedu.fi/export/sites/default/OPM/Julkaisut/2010/liitteet/tr11.pdf?lang=fi
Forsman, J. (2011) Exploring using complexity thinking to extend the modelling of student retention
in higher education physics and engineering. Thesis for the degree of Licentiate of Philosophy in
Physics within the specialization Physics Education Research, Uppsala University. 130 pp.
Forsman, J. Linder, C. Moll, R. Fraser, D. and Andersson, S. (2012). A new approach to modelling student retention through an application of complexity thinking. Studies in Higher Education.
French, B.F. Immekus, J.C. and Oakes, W. (2005) An examination of indicators of engineering
students' success and persistence. Journal of Engineering Education, 94(4), pp. 419–425
Habley, W. & McClanahan, R. (2004). What Works in Student Retention – All Survey Colleges. ACT, Inc. Iowa City, IA.
Hagedorn, L.S. (2006) How to Define Retention: A New Look at an Old Problem. Transfer and
Retention of Urban Community College Students (TRUCCS). 26 pp.
HEA (2010). A Study of Progression in Irish Higher Education. Dublin: Higher Education Authority.
Hede, G. and Wikander, L. (1990) Interruptions and Study Delays in Legal Educations. A Follow-Up of the Admissions round Autumn Term 1983 at Uppsala University.
HESA (2006) Performance indicators in higher education in the UK 2004/2005. Higher Education
Statistics Agency (HESA).
Hillman, K. (2005) The first year experience: The transition from secondary school to University and TAFE in Australia. Camberwell: Australian Council for Educational Research.
Honkanen, S. (2011) Tekniikan ylioppilaiden valmistumiseen johtavien opintopolkujen mallintaminen
– perusteena lukiossa ja opiskelun alkuvaiheessa saavutettu opintomenestys. Väitöskirja. Oulun
yliopisto, Teknillinen tiedekunta, Prosessi- ja ympäristötekniikan osasto. 178 pp.
HSV (2009) Mått för genomströmning i utbildning på grund- och avancerad nivå. Rapport 2009:29 R. Högskoleverket. 80 pp.
Huon, G. and Sankey, M. (2002) The transition to university: Understanding differences in success.
Paper presented at 6th Pacific Rim Conference on First Year in Higher Education, Christchurch NZ,
July 2002.
Iwai, S.I. and Churchill, W.D. (1982) College attrition and the financial support systems of students. Research in Higher Education, 17, pp. 105–113.
Johnes, J. (1990) Determinants of student wastage in higher education. Studies in Higher Education,
15(1), pp. 87–100.

41
Kamens, D. (1971) The college “charter” and college size: Effects on occupational choice and college
attrition. Sociology of Education, 44, pp. 270–296.
Kivinen, O. and Nurmi, J. (2011) Opiskelun nopeus ja työmarkkinarelevanssi – korkeakoulupolitiikan
dilemma? Yhteiskuntapolitiikka 76 (2011):5, pp. 687–691. Levitz, R. S., Noel, L., & Richter, B. J. (1999) Strategic moves for retention success. New directions
for higher education, 108(4), pp. 31–49.
Lynch, K. Brannick, T. Clancy, P. and Drudy, S. (1999). Points and performance in higher education:
A study of the predictive validity of the points system. Research Paper No. 4 for the Commission on
the Points System. Dublin: Stationery Office. Mallinckrodt, B. and Sedlacek, W. E. (1987) Student retention and the use of campus facilities by
race. NASPA Journal, 24, pp. 28–32.
Macdonald, C. (1995). What do new students gain from a one week orientation program? Journal of
the Australian and New Zealand Student Services Association, 5, pp. 4–13.
March, J.C. and Simon, H. (1958) Organizations. New York: Wiley. Mathews, N. and Mulkeen, S. (2002) 'Staying the Course? A Study of Student Retention: UCD
entrants 1999-2001'. Ireland: University College Dublin.
Mayes, T. (2009) Quality Enhancement Themes: The First Year Experience. Overview of the
Enhancement Theme 2006–08: The aims, achievements and challenges. The Quality Assurance Agency for Higher Education, Scotland, 25 pp.
McInnis, C. (2001) Researching the first year experience: Where to from here? Higher Education
Research and Development, 20(2), pp. 105–114.Marks, E. (1967) Student perceptions of college
persistence and their intellective, personality and performance correlates. Journal of Educational
Psychology, 58, pp. 210–211. McLean, M. (1995) Educational Traditions Compared. Content, teaching and learning in industrialized
countries. London: David Fulton Publishers.
Mitchel, D. F. Goldman, B. A. and Smith, M. (1999) Change factors affecting college matriculation: A
re-analysis. Journal of the First-Year Experience and Students in Transition, 11, pp. 75–92. Moortgat, M. (1997) Retention Rates Research Project.
Morgan, M. Flanagan, R. and Kellaghan T. (2001) A Study of Non-Completion in Undergraduate
Courses. Dublin: Higher Education Authority.
Murtaugh, P. A. Burns, L. D. and Schuster, J. (1999) Predicting the retention of university students.
Research in Higher Education, 40, pp. 355–371. Nicol, D. (2008) Quality Enhancement Themes, The First Year Experience. Transforming Assessment
and Feedback: Enhancing Integration and Empowerment in the First Year. Centre for Academic
Practice and Learning Enhancement (CAPLE), University of Strathclyde, 74 pp.
Nivaro, H. (2012) Kuinka moni opiskelija lopettaa kesken? Talouselämä [online] [updated 17.4.2012].
[Retrieved 13.9.2012]. Available: http://www.talouselama.fi/uutiset/kuinka+moni+opiskelija+lopettaa+kesken/a2095552
OECD (2009) Education at a Glance 2009: OECD indicators, OECD Publishing [online].
Organization for Economic Cooperation and Development (OECD), Paris. [Retrieved 13.9. 2012].

42
Available: http://www.oecd-ilibrary.org/education/education-at-a-glance-2009_eag-2009-
en;jsessionid=36b38x41cvnnu.delta
OECD (2011) Education at a Glance 2011: OECD indicators, OECD Publishing [online].
Organization for Economic Cooperation and Development (OECD), Paris. [Retrieved 13.9.2012]. Available: http://www.oecd-ilibrary.org/education/education-at-a-glance-2011_eag-2011-en
Ohland, M.W. Sheppard, S.D. Lichtenstein, G. Eris, O. Chachra, D. and Layton, R.A. (2008)
Persistence, Engagement, and Migration in Engineering Programs. Journal of Engineering Education,
97(3), pp. 259–278.
Olds, B.M. and Miller, R.L. (2004) The effect of a first-year integrated engineering curriculum on
graduation rates and student satisfaction: a longitudinal study. Journal of Engineering Education,
January 2004, pp. 23–35.
Ory, J.C. and Braskamp, L.A. (1988) Involvement and growth of students in three academic programs.
Research in Higher Education, 28, pp. 116–129.
Ozga, J. and Sukhnandan, L. (1998) Undergraduate non-completion: developing an explanatory
model. Higher Education Quarterly, 52(3), pp. 316–333. Pakarinen, P. (2010) Aalto-yliopiston teknillisten alojen kandidaattivaiheen opintojen eteneminen
lukuvuosina 2005–2010. Aalto-yliopisto. Tutkimuksen ja opetuksen strateginen tuki. Opetuksen
kehittämistiimi. 34 pp.
Parker, J. and Schmidt, J. (1982) Effects of college experience. In H. Mitzel, ed. Encyclopedia of
Educational Research (5th ed.) New York: The Free Press. Pascarella, E. and Terenzini, P. (1991) How College Affects Students: Findings and Insights from
Twenty Years of Research. San Francisco: Jossey-Bass Inc.
Pereira, A. (1997) Helping Students Cope: Peer Counseling in Higher Education, PhD Dissertation,
University of Hull. Pincus, F. (1980) The false promise of community colleges: Class conflict and vocational education.
Harvard Educational Review, 50, pp. 332–361.
Portuguese Ministry of Science, Technology and Higher Education: GPEARI, Gabinete de
Planeamento, Estratégia, Avaliação e Relações Internacionais/Ministério da Ciência e Ensino Superior
(2007), Sucesso Escolar no Ensino Superior: Diplomados em 2004/2005. Rantanen, E. and Liski, E. (2009) Valmiiksi tavoiteajassa? Teknillisen korkeakoulun Opetuksen ja
opiskelun tuen julkaisuja 3/2009. Espoo.
Rintala, U. (2012) The Impact of Academic and Social Integration on First-Year Students’
Expectations and Commitment – Case: The Degree Program of Bioproduct Technology. Master’s
Thesis. Aalto University, 72 pp. Rossmann, J. E. and Kirk, B. A. (1970) Factors related to persistence and withdrawal among
university students. Journal of Counseling Psychology, 17, pp. 55–62.
Ruutu, J. (2010) Progressing and Promoting Freshman Studies in Communications Engineering –
Integrating Students to The Scientific Community (in Finnish). Master’s Thesis. Aalto University. Seymour, E. and Hewitt, N.M. (1997) Talking about leaving. Why undergraduates leave the sciences.
Boulder CO, Westview Press.
43
Sharp, L. F. and Chason, L.R. (1978) Use of moderator variables in predicting college student
attrition. Journal of College Student Personnel, 19, pp. 388–393.
Shobrook, S. (2003) Enhancing Engineering Undergraduate Progression: Strategies and Cases – Pre-
entry, induction and transfer issues. PROGRESS project. Spady, W. (1970) Dropouts from higher education: An interdisciplinary review and synthesis.
Interchange 1970, 1, pp. 64–85.
Stage, F. (1989) Reciprocal effects between the academic and social integration of college students.
Research in Higher Education, 30, pp. 517–530.
Stampen, J.O. and Cabrera, A.F. (1986) Exploring the effects of student aid on attrition. The Journal of Student Financial Aid, 16, pp. 28–40.
Stampen, J.O. and Cabrera, A.F. (1988) The targeting and packaging of student financial aid and its
effects on attrition. Economics and Education Review, 7, pp. 29–46.
Standaert, R. (2007) Vergelijken van onderwijssystemen. Leuven, Acco.
TEK (2012) Kysely tekniikan alan vastavalmistuneille. Tulosten esittely 9.5.2012. Tekniikan akateemiset (TEK).
Tavares, J. & Huet Silva, I. (2001) Sucesso Académico no Ensino Superior – Um olhar sobre o
Professor Universitário, Pedagogia na Universidade, Actas do III Simpósio da UTL, pp 149 – 154
Terenzini, P.T. and Pascarella, E.T. (1977) Voluntary freshman attrition and patterns of social and academic integration in a university: A test of a conceptual model. Research in Higher Education, 6,
pp. 25–43.
The ECTS Users’ Guide [online]. [Retrieved 13.4.2012]. Available:
http://ec.europa.eu/education/lifelong-learning-policy/doc/ects/guide_en.pdf
The Lifelong Learning Programme 2007–2013 – Glossary [online]. [Retrieved 3.4.2012]. Available: http://ec.europa.eu/education/programmes/llp/guide/glossary_en.html
The OECD Glossary of Education Terms [online]. [Retrieved 3.4.2012]. Available:
http://www.oecd.org/dataoecd/45/17/33692376.pdf
Thomas, L. (2002) Student Retention in Higher Education: the role of institutional habitus J. Education Policy, vol. 17, No 4, pp. 423–442.
Tinto, V. (1975) Dropout from Higher Education: A Theoretical Synthesis of Recent Research.
Review of Educational Research vol. 45, pp. 80-125.
Tinto, V. (1982) Limits of Theory and Practice in Student Attrition. The Journal of Higher Education
vol. 53, No. 6, pp. 687–700. Tinto, V. (1987) Leaving College: Rethinking the Causes and Cures of Student Attrition. Chicago, IL:
The University of Chicago Press.
Tinto, V. (1988). Stages of student departure: Reflections on the longitudinal character of student
leaving. Journal of Higher Education, 59(4), pp. 438–455.
Tinto, V. (1993) Leaving College: Rethinking the Causes and Cures of Student Attrition (2nd ed.). Chicago, IL: The University of Chicago Press.
Tinto, V. Russo, P. and Kadel, S. (1994) Constructing educational communities: Increasing retention
in challenging circumstances. Community College Journal, 64, pp. 26–30.

44
Tinto, V. (1997) Classroom as Communities: Exploring the Educational Character of Student
Persistence. Journal of Higher Education, 68(6), pp. 599–623.
Tinto, V. (2002) Taking Student Retention Seriously: Rethinking the First Year of College. A speech
presented at the annual meeting of the American Association of Collegiate Registrars and Admission Officers, April 15, 2002, Minneapolis, Minnesota.
Tinto, V. (2010) From Theory to Action: Exploring the Institutional Conditions for Student Retention.
Higher Education: Handbook of Theory and Research 25. J.C. Smart (Ed.), pp. 51–89.
Tynjälä, P. Salminen, R. T. Sutela, T. Nuutinen, A. and Pitkänen, S. (2005) Factors related to study
success in engineering education. European Journal of Engineering Education, 30(2), pp. 221–231. Van den Bogaard, M. (2011) Explaining student success in engineering education in Delft University
of Technology; a synthesis of literature. WEE2011, September 27–30, 2011, Lisbon, Portugal.
Van Stolk, C., Tiessen, J., Clift, J., Levitt, R. (2007). Student Retention in Higher Education Courses.
International Comparison. Cambridge, RAND Europe.
Veenstra, C.P. Dey, E.L. and Herrin, G.D. (2009) A Model for Freshman Engineering Retention. Advances in Engineering Education. American Society for Engineering Education. Winter 2009.
Vogt, C. M. (2008) Faculty as a critical juncture in student retention and performance in engineering
programs. Journal of Engineering Education, 97(1), pp. 27–36.
Waterman, A. S. and Waterman C. K. (1972) Relationship between freshman ego identity status and subsequent academic behavior: A test of the predictive validity of Marcia’s categorization system of
identity status. Developmental Psychology, 6, pp. 179.
Wei, P. and Bai, H. (2010) Testing and Estimating Direct and Indirect Effects of an Intervention
Program on College Student Retention: A Structural Model. Enrollment Management Journal, Spring
2010, pp. 10–26. Wiegersma, S. (1989) Innovatie van het hoger onderwijs. Groningen: Wolters Noordhoff.
Wilcox, P. Winn, S. and Fyvie-Gauld, M. (2005) “It was nothing to do with the university, it was just
the people”: The role of social support in the first-year experience of higher education. Studies in
Higher Education, 30(6), pp. 707–722. Willis, L. (2008) Enhancing the First Year Experience for Engineering Students – an Engineering
Subject Centre Guide. The Higher Education Academy.
Wisker, G., Exley, K., Antoniou, M. & Ridley, P. (2008) Working one-to-one with students. N.Y. &
London: Routledge.
Yorke, M. and Longden, B. (2007) The first-year experience in higher education in the UK. The Higher Education Academy.
Zhang, G. Anderson, T. Ohland, M. Carter, R. and Thorndyke, B. (2004) Identifying Factors
Influencing Engineering Student Graduation and Retention: A Longitudinal and Cross-Institutional
Study. Journal of Engineering Education, Oct 2004.