Z/ Z - parliament.nsw.gov.au · Z/.^ X^’ -'-X,#-^ / Zr t, ^^ *
Structure and Photocatalytic Activity of Ti 1-xM xO2(δ (M ) W, V, Ce, Zr, Fe, and Cu)Synthesized by Solution Combustion Method
K. Nagaveni,† M. S. Hegde,† and Giridhar Madras* ,‡
Solid State and Structural Chemistry Unit, Indian Institute of Science, Bangalore-560012, India, andDepartment of Chemical Engineering, Indian Institute of Science, Bangalore-560012, India
ReceiVed: May 15, 2004; In Final Form: August 12, 2004
The W, V, Ce, Zr, Fe, and Cu metal ion substituted nanocrystalline anatase TiO2 was prepared by solutioncombustion method and characterized by XRD, Raman, BET, EPR, XPS, IR TGA, UV absorption, andphotoluminescence measurements. The structural studies indicate that the solid solution formation was limitedto a narrow range of concentrations of the dopant ions. The photocatalytic degradation of 4-nitrophenol underUV and solar exposure was investigated with Ti1-xMxO2(δ. The degradation rates of 4-nitrophenol with thesecatalysts were lesser than the degradation rates of 4-nitrophenol with undoped TiO2 both with UV exposureand solar radiation. However, the photocatalytic activities of most metal ion doped TiO2 are higher than theactivity of the commercial TiO2, Degussa P25. The decrease in photocatalytic activity is correlated withdecrease in photoluminescence due to electron states of metal ions within the band gap of TiO2.
Introduction
TiO2, mainly in the anatase phase, has been employed forthe degradation of several environmental contaminants underUV.1-4 Several attempts have been made to improve theperformance of TiO2 as a photocatalyst under UV illuminationand to extend its absorption and conversion capacity into thevisible portion of the solar spectrum. Asahi et al.5 reported thatdoping of TiO2 by nitrogen, to TiO2-xNx, shifts its opticalabsorption into the visible region ofλ < 500 nm. A similarstudy was reported by Khan et al.6 on a chemically modified,carbon substituted TiO2 absorbing light at wavelengths below535 nm. Recently, a carbon doped titania, TiO2-2xCxV-
O2- bysolution combustion method, was synthesized that had an opticalabsorption below 600 nm and enhanced solar photocatalyticactivity7 compared to commercial Degussa P25. Hence, dopingof anionic species such as C, N, F, or S for O (2p) seems to beeffective in reducing the band gap and enhancing the photoac-tivity of TiO2.
The influence of various transition metal ions on thephotoactivity of pure TiO2 for many reactions has also beenstudied with the aim of improving the efficiency of thephotocatalytic process.9-19 It has been hypothesized that theaddition of transition metals to titania increases the rate ofphotocatalytic oxidation, due to the electron scavenging by themetal ions at the semiconductor surface through the followingreaction: Mn+ + e-
CB f M(n-1)+, where Mn+ representstransition metal ions.8 This reaction prevents electron-holerecombination and results in an increased rate of formation of•OH radical.
Even though metal ion doping effects on the reactivity ofTiO2 have been extensively studied, there is a considerablecontroversy.8-21 Some investigators report that doping of ionssuch as V5+, Cu2+, Fe3+, and W6+ in TiO2 increases its
photoactivity, whereas others have shown that doping can reducethe photoactivity. Reasons for lower or higher activity comparedto pure TiO2 are not yet clear.
Most of these metal doped TiO2’s reported in the literatureare prepared by coprecipitation and incipient wet impregnationmethod. In the impregnation method, substitution of metal ionsin the bulk TiO2 crystallites is not likely to occur, and at best,substitution may take place on the surfaces.9,14 In the copre-cipitation method, postheat processing of mixed metal hydrox-ides yields metal doped TiO2. This high temperature, long timeheating may separate out the dopant metal ions into respectivemetal oxides and in many cases they segregate on the surfaces.18
Therefore, preparation of Ti1-xMxO2(δ (M) transition metalions) in anatase phase is critical to assess the effect of metalion doping toward photocatalysis.
The solution combustion method is a novel technique inproducing metal substituted oxides.22-24 Unlike traditionalmethods, in the combustion synthesis, a temperature up to 700-800°C is reached for a few seconds and the material is quenchedto 300 °C quickly. Since this method is a solution process, ithas all the advantages of wet chemical processes such as controlof stoichiometry, doping of desired amount of transition metalions. The present work was aimed at producing metal ionsubstituted TiO2 by the solution combustion method andstudying the influence of substitution on structure, extent ofsubstitution and performance as a photocatalyst. The metal ionschosen for doping are lower valent (Cu2+, Fe3+), isovalent (Ce4+,Zr4+), and higher valent (W6+, V5+) ions. The photodegradationof 4-nitrophenol in aqueous suspension was used as a probereaction to evaluate the photoactivity of the metal doped TiO2.
Experimental Section
Synthesis of the Catalyst.The TiO2 employed in the presentstudy was prepared by the solution combustion method. In atypical combustion synthesis, a Pyrex dish (300 cm3) containingan aqueous redox mixture of titanyl nitrate (2g) and glycine(0.8878 g) in 15 mL of water was introduced into the muffle
† Solid State and Structural Chemistry Unit.‡ Department of Chemical Engineering.* To whom correspondence should be addressed. E-mail: giridhar@
chemeng.iisc.ernet.in. Fax:+91-80-360-0683.
20204 J. Phys. Chem. B2004,108,20204-20212
10.1021/jp047917v CCC: $27.50 © 2004 American Chemical SocietyPublished on Web 11/25/2004
furnace preheated to 350°C. The solution undergoes dehydrationand a spark appears at one corner, which spreads throughoutthe mass yielding a voluminous solid product.25-27
Metal substituted TiO2 was prepared by the solution combus-tion method by taking precursors ZrO(NO3)2‚H2O, (NH4)2Ce-(NO3)6, NH4VO3, H2WO4, Cu(CO3)Cu(OH)2, and Fe(NO3)3‚9H2O. The dopant concentrations varied between 1 and 10 atom%. The combustion mixture for the preparation of 5 atom %Fe/TiO2 contained titanyl nitrate, ferric nitrate, and glycine inthe mole ratio 0.95:0.05:1.14. Metal doped TiO2 samplesdisplayed various colors depending on the kind of metal ionsused: Ce and Zr doped samples were dark yellow, Cu dopedsamples were green in color, V and Fe doped samples werebrownish, and W doped TiO2’s were pale yellow in color.
Characterization of the Combustion Product. X-ray dif-fraction (XRD) patterns of the powders were recorded withSiemens D5005 diffractometer with Cu KR radiation (λ )1.5418 Å) at a scan rate of 1°/min. Rietveld profile fitting hasbeen carried out to show the metal ion substitution for Ti4+
sites. Crystallite size was determined using the Scherrer equation
where FWHMhkl is the full width at half-maximum of anhklpeak atθ value. The Brunauer-Emmett-Teller (BET) surfacearea was determined using standard BET apparatus (NOVA-1000, Quantachrome, USA). The crystal structure was furtheranalyzed by Raman spectroscopy (Bruker RFS 100/S). EPRspectra of pure and metal doped TiO2 were obtained usingBruker ER 2000D spectrometer operating in the X-band(frequency ∼ 9.43 GHz). The as-synthesized catalyst wassubjected to gravimetric-differential thermal analysis (TG-DTA)(Perkin-Elmer- Pyris Diamond) to determine the adsorbed water.FTIR studies were carried out in the 400-4000 cm-1 frequencyrange in the transmission mode (Perkin-Elmer, USA, FTIR-Spectrum-1000). X-ray photoelectron spectroscopy (XPS) ofthese materials was recorded on an ESCA-3 Mark II spectrom-eter (VG Scientific Ltd. England) using Al KR radiation (1486.6eV). UV-vis absorption spectra of TiO2 powders were obtainedfor the dry pressed disk samples using a UV-vis spectropho-tometer (GBC Cintra 40, Australia) between 270 and 800 nmrange and absorption spectra were referenced to BaSO4. Eachsample was dry-pressed into a 10-mm diameter round diskcontaining about 150 mg. The photoluminescence measurementswere performed on a luminescence spectrometer (Perkin-ElmerLS 55) at room temperature under the excitation light of 285nm. The conditions are fixed as far as possible in order tocompare the photoluminescence signals directly.
Photocatalytic Evaluation. All of the experiments werecarried out using a cylindrical annular batch photoreactor. Thedesign and operation of the reactor have been discussed in detailelsewhere.25 A medium pressure mercury vapor (MPML) lampof 125 W (Mysore Lamps, India) was placed inside the reactorafter carefully removing the outer shell. The lamp radiatedpredominantly at 365 nm (3.4 eV). All the solar experimentswere carried out in a cylindrical borosilicate glass reactor withi.d., of 8 cm and 400 cm3 volume. Direct sunlight was used inthe present study, and the average solar intensity was 0.753 kW/m2. Samples were collected at regular intervals for subsequentanalysis by a UV-vis spectrophotometer (Shimadzu, UV-2100).4-Nitrophenol was selected as a model pollutant for thephotocatalytic degradation experiments because it is nonvolatileand a common contaminant in industrial wastewater. All
degradations were performed in an open system wherein thetop surface of the photoreactor was open to air providing enoughoxygen for the oxidative degradation of pollutants. The reactionwas carried out at 25°C, maintained by circulating water inthe annulus of the reactor and samples were collected at regularintervals for subsequent analysis by a UV-vis spectrophotom-eter (Shimadzu, UV-2100). For degradation experiments, 1 kg/m3 of the catalyst and 0.5 mM 4-nitrophenol was selected as itgives the highest degradation rate using combustion synthesizedTiO2.27
Results
XRD Studies.Ti1-xCuxO2-δ. XRD patterns of pure TiO2 andCu ion substituted titania are shown in Figure 1. The patterncan be indexed to the TiO2 anatase phase only, and no rutile orbrookite impurities are detected. Cu doped titania does not showmeasurable CuO diffraction peaks up to 7.5 atom % and CuOlines are observed at 10 atom % Cu/TiO2. To examine theexpected CuO peak intensity in the XRD pattern, CuO nano-particles prepared by the combustion method were physicallymixed with pure anatase TiO2 to 7.5 atom % CuO. The XRDpattern of the physical mixture shows intense peaks due to CuOalong with anatase TiO2 [Figure 1d].
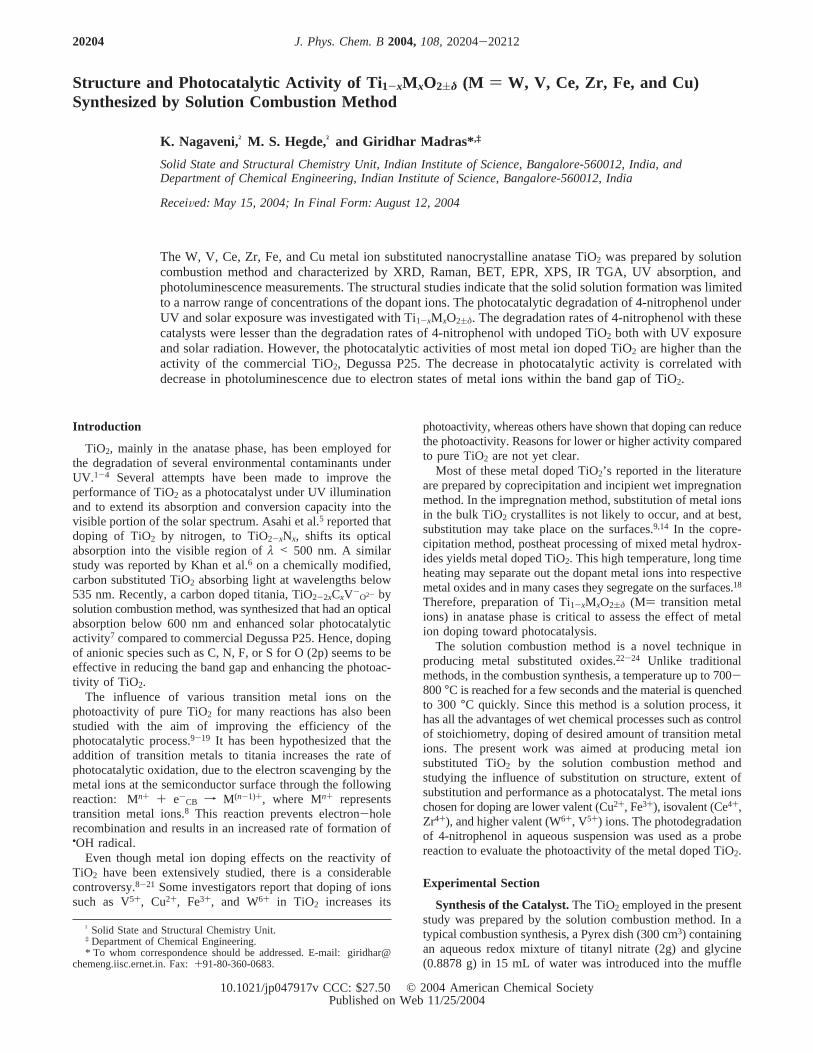
Rietveld refinement of slow scanned (0.3°/min) data of 7.5atom % Cu/TiO2 was carried out by varying 16 parameters suchas overall scale factor, background parameters, unit cell, shapeand isotropic thermal parameters, and oxygen occupancy usingthe Fullprof-98 program. Rietveld is a least-square fit method,where the difference between the observed and the calculatedparameters from the proposed model is minimized. Threerefinable parameters, namely,RBragg, RF (Rstructure factor), andRP (R pattern), where the first two parameters deal with onlythe Bragg peaks, whereas the third one accounts for thebackground pattern and Bragg peaks, are used. The observed,calculated, and difference X-ray diffraction patterns of 7.5 atom
Figure 1. X-ray diffraction pattern of (a) combustion synthesized TiO2,(b) 7.5 atom % Cu/TiO2, (c) 10 atom % Cu/TiO2, (d) physical mixtureof 7.5% CuO+ TiO2.
L )(0.9λ180)
(πFWHMhkl cosθ)
Structure and Photocatalytic Activity of Ti1-xMxO2(δ J. Phys. Chem. B, Vol. 108, No. 52, 200420205
% Cu/TiO2 are given in Figure 2. A good agreement betweenthe observed and calculated patterns was observed. TheRBragg,RF, andRP, values are 3.26, 2.40, and 4.08%, respectively. Thelattice parametera ) 3.782(3) Å andc ) 9.481(7)1 Å. Thefitting is good as seen fromR factor values. Pure TiO2 wasalso refined, and theRBragg, RF, andRP values of undoped titaniaare 2.45, 1.53, and 4.87%, respectively. The lattice parametersfor pure TiO2 area ) 3.7904 (5) Å andc ) 9.5067 (1) Å. TheDebye-Waller factor for the Ti ion indeed decreases from 0.43to 0.35 from pure TiO2 to Cu/TiO2 indicating an increase inthe electron density at the Ti sites in Cu doped titania. Further,R factors increase if the Cu ion is not taken into account in therefinement of Cu/TiO2. The Rietveld refinement indicated Cu2+
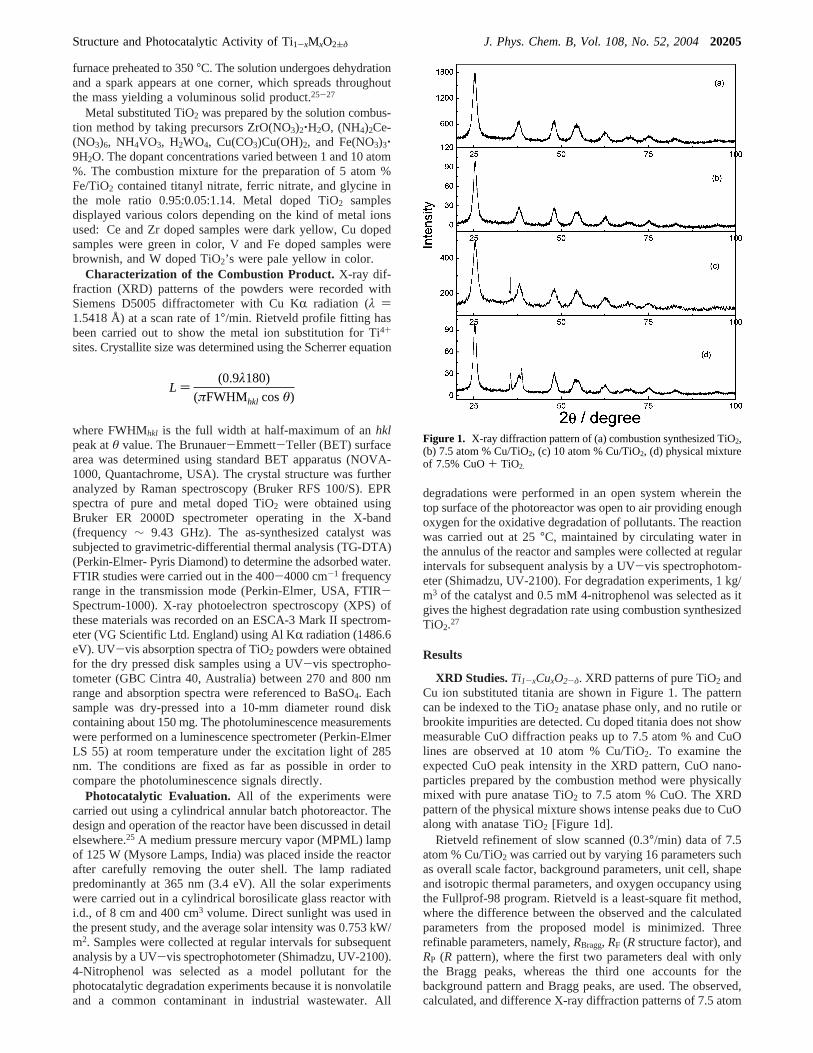
ion substitution in the combustion synthesized TiO2 matrix. Theredox property of the Cu2+ ion will be different if the Cu2+ ionis substituted in TiO2 compared to that of CuO, which can beexamined by temperature programmed reduction (TPR) inhydrogen. Figure 3 shows an TPR profile of 5 atom % Cu/TiO2. The peak reduction temperature of the Cu2+ ion in Cu/TiO2 prepared by the solution combustion method is∼ 200°C,which is lower than that of pure CuO at 270°C. The volumeof hydrogen (H2) used in the reaction is estimated taking CuOas the standard. For CuO, the molar (H2/CuO) ratio was unityfor the reaction, H2 + CuO f Cu + H2O. The H2/Cu molarratio in 5 atom % Cu/TiO2 was 2, which is twice that which isrequired to reduce Cu2+ ions in Cu/TiO2. This cannot beaccounted even if we assume that all of the Cu ions are presentas CuO. If the Cu2+ ion is substituted, part of the Ti4+ ions canbe reduced to the lower valent Ti ion along with Cu2+ to Cu0.
The XRD, Rietveld refinement and TPR studies suggest thatCu2+ is substituted in Ti4+ at least up to 7.5%.
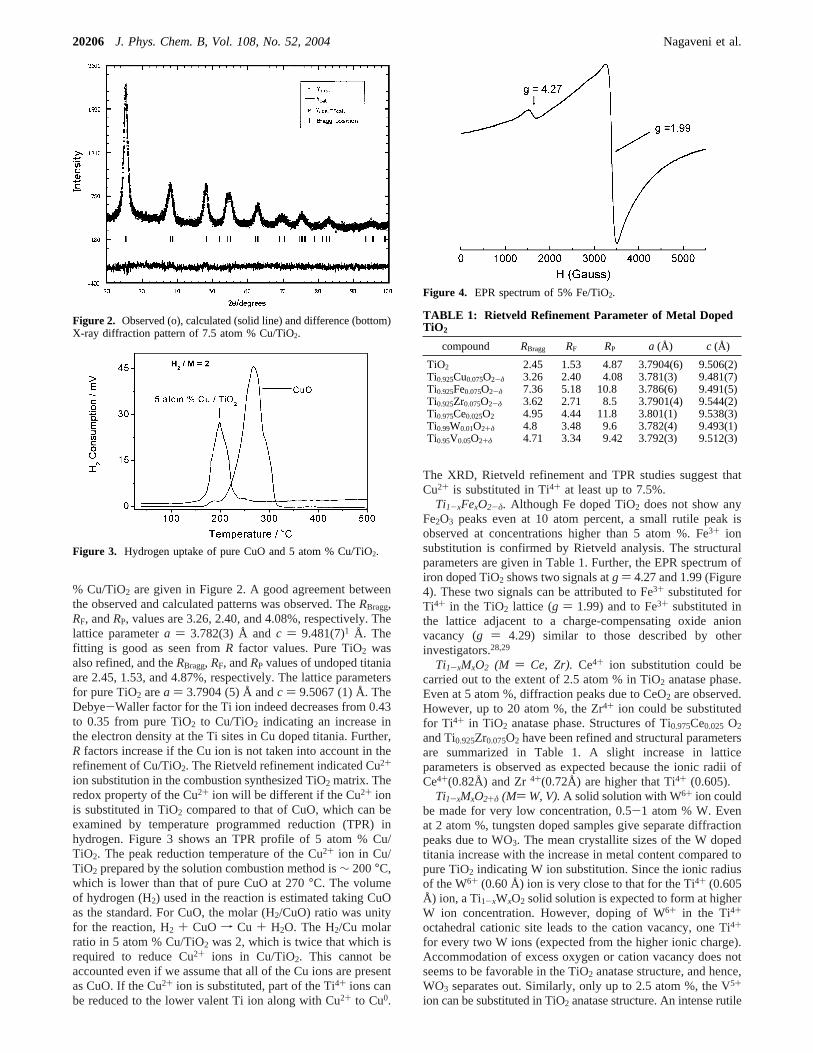
Ti1-xFexO2-δ. Although Fe doped TiO2 does not show anyFe2O3 peaks even at 10 atom percent, a small rutile peak isobserved at concentrations higher than 5 atom %. Fe3+ ionsubstitution is confirmed by Rietveld analysis. The structuralparameters are given in Table 1. Further, the EPR spectrum ofiron doped TiO2 shows two signals atg ) 4.27 and 1.99 (Figure4). These two signals can be attributed to Fe3+ substituted forTi4+ in the TiO2 lattice (g ) 1.99) and to Fe3+ substituted inthe lattice adjacent to a charge-compensating oxide anionvacancy (g ) 4.29) similar to those described by otherinvestigators.28,29
Ti1-xMxO2 (M ) Ce, Zr). Ce4+ ion substitution could becarried out to the extent of 2.5 atom % in TiO2 anatase phase.Even at 5 atom %, diffraction peaks due to CeO2 are observed.However, up to 20 atom %, the Zr4+ ion could be substitutedfor Ti4+ in TiO2 anatase phase. Structures of Ti0.975Ce0.025 O2
and Ti0.925Zr0.075O2 have been refined and structural parametersare summarized in Table 1. A slight increase in latticeparameters is observed as expected because the ionic radii ofCe4+(0.82Å) and Zr4+(0.72Å) are higher that Ti4+ (0.605).
Ti1-xMxO2+δ (M) W, V).A solid solution with W6+ ion couldbe made for very low concentration, 0.5-1 atom % W. Evenat 2 atom %, tungsten doped samples give separate diffractionpeaks due to WO3. The mean crystallite sizes of the W dopedtitania increase with the increase in metal content compared topure TiO2 indicating W ion substitution. Since the ionic radiusof the W6+ (0.60 Å) ion is very close to that for the Ti4+ (0.605Å) ion, a Ti1-xWxO2 solid solution is expected to form at higherW ion concentration. However, doping of W6+ in the Ti4+
octahedral cationic site leads to the cation vacancy, one Ti4+
for every two W ions (expected from the higher ionic charge).Accommodation of excess oxygen or cation vacancy does notseems to be favorable in the TiO2 anatase structure, and hence,WO3 separates out. Similarly, only up to 2.5 atom %, the V5+
ion can be substituted in TiO2 anatase structure. An intense rutile
Figure 2. Observed (o), calculated (solid line) and difference (bottom)X-ray diffraction pattern of 7.5 atom % Cu/TiO2.
Figure 3. Hydrogen uptake of pure CuO and 5 atom % Cu/TiO2.
Figure 4. EPR spectrum of 5% Fe/TiO2.
TABLE 1: Rietveld Refinement Parameter of Metal DopedTiO2
compound RBragg RF RP a (Å) c (Å)
TiO2 2.45 1.53 4.87 3.7904(6) 9.506(2)Ti0.925Cu0.075O2-δ 3.26 2.40 4.08 3.781(3) 9.481(7)Ti0.925Fe0.075O2-δ 7.36 5.18 10.8 3.786(6) 9.491(5)Ti0.925Zr0.075O2-δ 3.62 2.71 8.5 3.7901(4) 9.544(2)Ti0.975Ce0.025O2 4.95 4.44 11.8 3.801(1) 9.538(3)Ti0.99W0.01O2+δ 4.8 3.48 9.6 3.782(4) 9.493(1)Ti0.95V0.05O2+δ 4.71 3.34 9.42 3.792(3) 9.512(3)
20206 J. Phys. Chem. B, Vol. 108, No. 52, 2004 Nagaveni et al.

peak was observed for 5 atom % V/TiO2. Only a small changein the lattice parameters is seen as expected (Table 1).
Thus, structural refinements show that only up to 7.5 atom% Cu2+, and 2.5 atom % Ce4+, 1 atom % W6+ ions could besubstituted for Ti4+ ion in anatase phase. Though Fe3+ and V5+
ions can be substituted for Ti4+ ion, both the substitution showsmall rutile impurity. Only Zr4+ could be substituted up to 20atom %. These studies indicate that the solid solution formationof TiO2 with transition metal ions is restricted to a very narrowrange of dopant ion concentrations.
Thermal Stability of Solid Solutions. To find the stabilityof metal doped titania, samples were heated at differenttemperatures for 24 h. At 500°C, only 3.5% CuO has separatedfrom 5 atom % Cu/TiO2, as seen from the relative intensitiesof CuO and solid solution diffraction peaks. Heat treatment ofthe Fe doped TiO2 at 500°C for 24 h showed diffraction linesdue to Fe2TiO5 oxide phase along with anatase and small rutilephase. It has been found that Cu and Fe dopant ions acceleratethe anatase-rutile phase transition. ZrO2 peaks were notobserved on heat treatment at 650°C for 24 h. At 650°C, pureTiO2 shows an intense rutile peak, whereas both Ce4+ and Zr4+
substituted TiO2 stabilize anatase phase, prevent phase trans-formation. The complete transformation of vanadium dopedsamples to rutile occurs by heat treatment at 600°C, whereasless than 5% transformation is obtained for the undoped sampletreated in an identical condition. Vanadium is known to catalyzephase transformation from anatase to rutile.30 Thus, stability ofsolid solution decreases with long time heating. This also suggestthat the preparation methods involving long time heating processgive lesser amount of metal ion substituted TiO2 compared tosolution combustion method.
Raman Studies.Raman spectra of metal doped titania areshown in Figure 5. In general, the Raman spectrum of TiO2 ischaracterized by a strong band at 144 cm-1, three mid intensitybands at 396, 517, and 639 cm-1, and a weak band at 196 cm-1.These six peaks correspond to the six fundamental vibrationalmodes of anatase TiO2 with the symmetries of Eg, Eg, B1g, A1g,B1g, and Eg, respectively. Raman spectra of 2.5 atom % ceriumand 7.5 atom % zirconium doped titania show a typical spectraof anatase TiO2. According to the literature,31 six Raman activemodes (A1g + 3Eg + 2B1g) are expected fort-ZrO2 (space groupP42/nmc), whereas for the fluorite structure of CeO2 (spacegroup Fm3m), only one mode (F2g) is Raman active.32 NoRaman lines due to CeO2 or ZrO2 are observed in the abovemetal doped samples. These results indicate the solid solution
formation in the above samples, which is consistent with theXRD measurements.
Specific Surface Area Measurements.The specific surfaceareas of all of the metal substituted TiO2’s were determined(Table 2), and it was found that incorporation of metal ionsleads to a decrease in the specific surface area of TiO2. Thedecrease of the surface area could be attributed to the increasein mean crystallite sizes of the metal doped samples, as evidentfrom the X-ray patterns of the W6+ and V5+ doped samples.Moreover, as the metal content is further increased, the specificsurface area decreases. The decrease of the surface area withthe increase in metal content can be attributed to the separationof the dopant metal oxide species dispersed on the surface. Thepresence of such oxides on the surface at higher concentrationsis confirmed by XRD measurements. Even though Zr dopedsamples have less surface area compared to the undopedcounterpart, the surface area increases with the increase in themetal content. This can be due to the surface solid solutionformation that prevents particle growth.
XPS Studies.Ti (2p3/2,1/2) peaks at 459.0 and 464.8 eV showthat Ti is in +4 state in all of the metal doped titania. Nosignificant variation in the binding energy of Ti (2p) wasobserved upon doping metal ions in any of the metal ionsubstituted oxides. Core level binding energies of the dopantmetal ions indicate that dopant ions are present in their highestoxidation state (Fe3+, Cu2+, W6+, V5+ Zr4+, and Ce4+).33
Binding energies are summarized in Table 3.Figure 6 shows the valence band region of pure TiO2 and
metal doped TiO2. In pure TiO2, Ti atoms are in the+4oxidation state and the valence band contains only the O2- (2p)contribution. Accordingly, an increase in electron density occursat about 3 eV, corresponding to the band gap of TiO2. However,in Cu/TiO2, Cu2+ (3d) electrons should lie above the O (2p)band similar to that in CuO. Indeed, appreciable electron densitybelow the fermi level (EF) and above the O (2p) band edge wasobserved in the valence band of Cu/TiO2. In the case of Fe/TiO2, the Fe3+ (3d) band is just above the O2- (2p) band. Thus,
Figure 5. Raman spectra of TiO2, 2.5 atom % Ce/TiO2, 7.5 atom %Zr/TiO2.
TABLE 2: BET Surface Area of Metal Doped Samples
catalyst BET surface area (m2/g)
TiO2 2401 atom % W/TiO2 1412 atom % W/TiO2 1192.5 atom % V/TiO2 1375 atom % V/TiO2 1102.5 atom % Ce/TiO2 975 atom % Ce/TiO2 1307.5 atom % Ce/TiO2 1272.5 atom % Zr/TiO2 1135 atom % Zr/TiO2 1337.5 atom % Zr/TiO2 1462.5 atom % Fe/TiO2 685 atom % Fe/TiO2 647.5 atom % Fe/TiO2 58
TABLE 3: Binding Energies of Dopant Metal Ions
compound binding energy
7.5 atom % Zr/TiO2 Zr 3d5/2 182.2Zr 3d3/2 184.4
5 atom % V/TiO2 V 2p3/2 517.0V 2p1/2 523.0
2.5 atom % Ce/TiO2 Ce3d5/2 883.3Ce3d3/2 900.1
2.5 atom % Fe/TiO2 Fe 2p3/2 711.8Fe 2p1/2 722.8
5 atom % Cu/TiO2 Cu 2p3/2 934.8Cu 2p1/2 954.7
Structure and Photocatalytic Activity of Ti1-xMxO2(δ J. Phys. Chem. B, Vol. 108, No. 52, 200420207
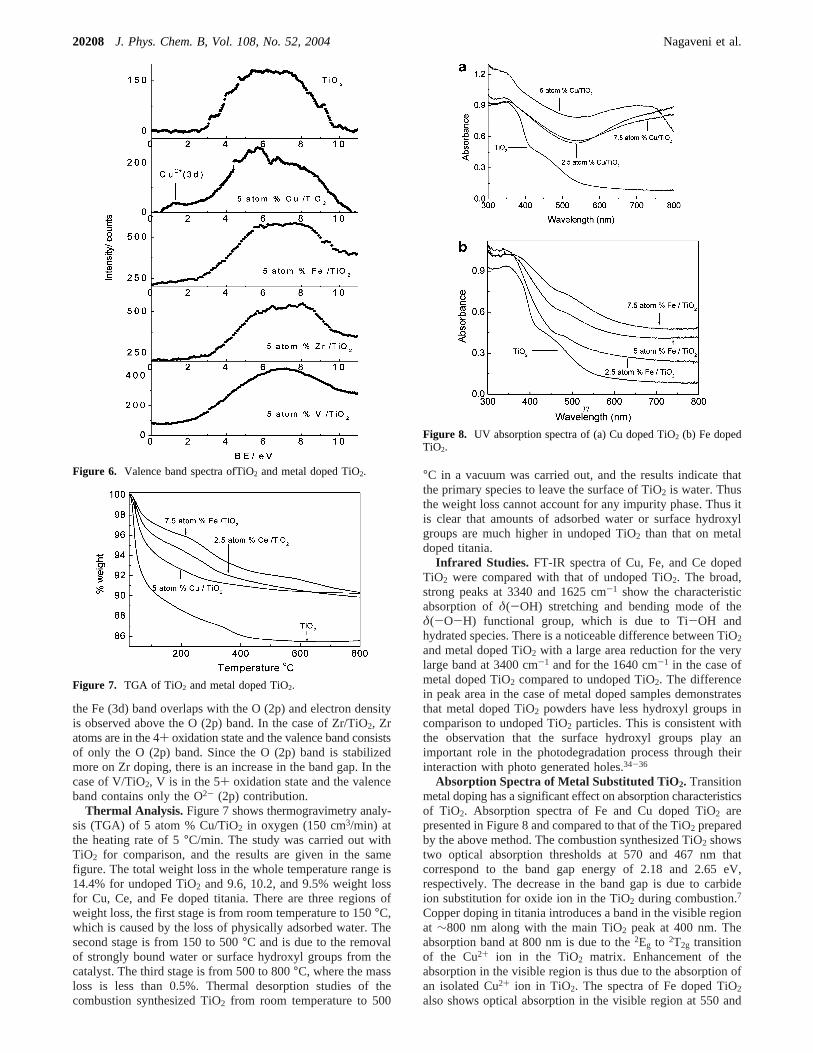
the Fe (3d) band overlaps with the O (2p) and electron densityis observed above the O (2p) band. In the case of Zr/TiO2, Zratoms are in the 4+ oxidation state and the valence band consistsof only the O (2p) band. Since the O (2p) band is stabilizedmore on Zr doping, there is an increase in the band gap. In thecase of V/TiO2, V is in the 5+ oxidation state and the valenceband contains only the O2- (2p) contribution.
Thermal Analysis. Figure 7 shows thermogravimetry analy-sis (TGA) of 5 atom % Cu/TiO2 in oxygen (150 cm3/min) atthe heating rate of 5°C/min. The study was carried out withTiO2 for comparison, and the results are given in the samefigure. The total weight loss in the whole temperature range is14.4% for undoped TiO2 and 9.6, 10.2, and 9.5% weight lossfor Cu, Ce, and Fe doped titania. There are three regions ofweight loss, the first stage is from room temperature to 150°C,which is caused by the loss of physically adsorbed water. Thesecond stage is from 150 to 500°C and is due to the removalof strongly bound water or surface hydroxyl groups from thecatalyst. The third stage is from 500 to 800°C, where the massloss is less than 0.5%. Thermal desorption studies of thecombustion synthesized TiO2 from room temperature to 500
°C in a vacuum was carried out, and the results indicate thatthe primary species to leave the surface of TiO2 is water. Thusthe weight loss cannot account for any impurity phase. Thus itis clear that amounts of adsorbed water or surface hydroxylgroups are much higher in undoped TiO2 than that on metaldoped titania.
Infrared Studies. FT-IR spectra of Cu, Fe, and Ce dopedTiO2 were compared with that of undoped TiO2. The broad,strong peaks at 3340 and 1625 cm-1 show the characteristicabsorption ofδ(-OH) stretching and bending mode of theδ(-O-H) functional group, which is due to Ti-OH andhydrated species. There is a noticeable difference between TiO2
and metal doped TiO2 with a large area reduction for the verylarge band at 3400 cm-1 and for the 1640 cm-1 in the case ofmetal doped TiO2 compared to undoped TiO2. The differencein peak area in the case of metal doped samples demonstratesthat metal doped TiO2 powders have less hydroxyl groups incomparison to undoped TiO2 particles. This is consistent withthe observation that the surface hydroxyl groups play animportant role in the photodegradation process through theirinteraction with photo generated holes.34-36
Absorption Spectra of Metal Substituted TiO2. Transitionmetal doping has a significant effect on absorption characteristicsof TiO2. Absorption spectra of Fe and Cu doped TiO2 arepresented in Figure 8 and compared to that of the TiO2 preparedby the above method. The combustion synthesized TiO2 showstwo optical absorption thresholds at 570 and 467 nm thatcorrespond to the band gap energy of 2.18 and 2.65 eV,respectively. The decrease in the band gap is due to carbideion substitution for oxide ion in the TiO2 during combustion.7
Copper doping in titania introduces a band in the visible regionat ∼800 nm along with the main TiO2 peak at 400 nm. Theabsorption band at 800 nm is due to the2Eg to 2T2g transitionof the Cu2+ ion in the TiO2 matrix. Enhancement of theabsorption in the visible region is thus due to the absorption ofan isolated Cu2+ ion in TiO2. The spectra of Fe doped TiO2
also shows optical absorption in the visible region at 550 and
Figure 6. Valence band spectra ofTiO2 and metal doped TiO2.
Figure 7. TGA of TiO2 and metal doped TiO2.
Figure 8. UV absorption spectra of (a) Cu doped TiO2 (b) Fe dopedTiO2.
20208 J. Phys. Chem. B, Vol. 108, No. 52, 2004 Nagaveni et al.
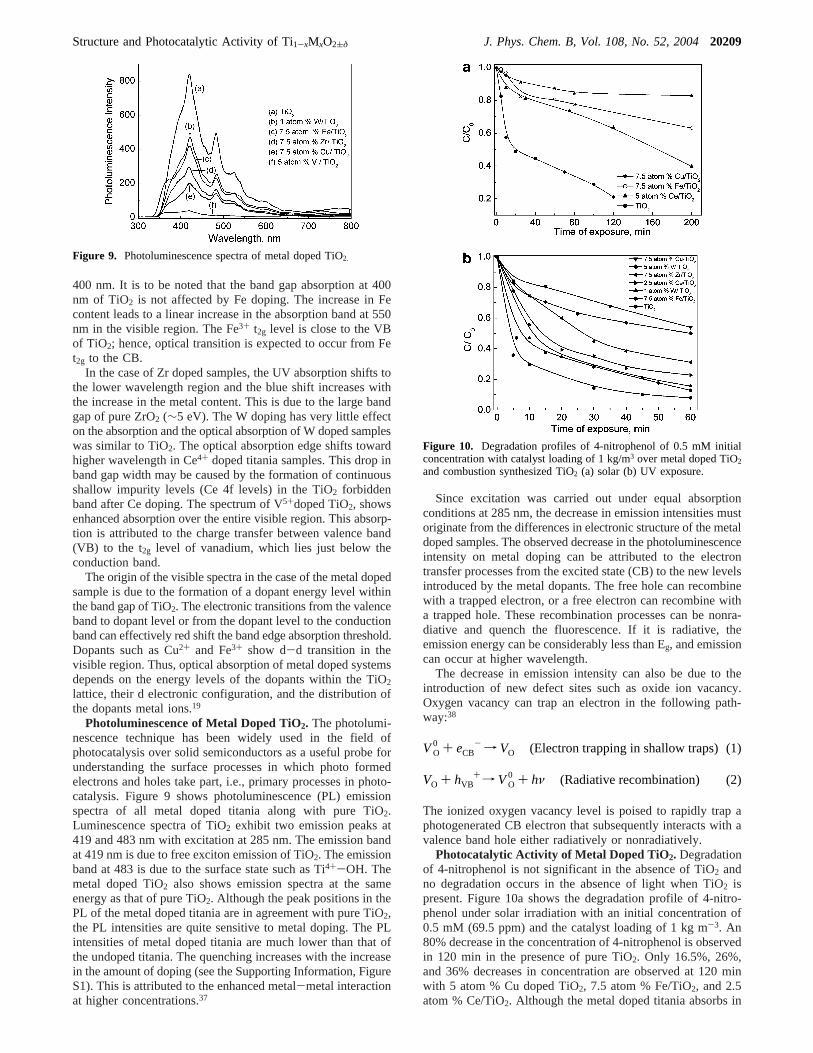
400 nm. It is to be noted that the band gap absorption at 400nm of TiO2 is not affected by Fe doping. The increase in Fecontent leads to a linear increase in the absorption band at 550nm in the visible region. The Fe3+ t2g level is close to the VBof TiO2; hence, optical transition is expected to occur from Fet2g to the CB.
In the case of Zr doped samples, the UV absorption shifts tothe lower wavelength region and the blue shift increases withthe increase in the metal content. This is due to the large bandgap of pure ZrO2 (∼5 eV). The W doping has very little effecton the absorption and the optical absorption of W doped sampleswas similar to TiO2. The optical absorption edge shifts towardhigher wavelength in Ce4+ doped titania samples. This drop inband gap width may be caused by the formation of continuousshallow impurity levels (Ce 4f levels) in the TiO2 forbiddenband after Ce doping. The spectrum of V5+doped TiO2, showsenhanced absorption over the entire visible region. This absorp-tion is attributed to the charge transfer between valence band(VB) to the t2g level of vanadium, which lies just below theconduction band.
The origin of the visible spectra in the case of the metal dopedsample is due to the formation of a dopant energy level withinthe band gap of TiO2. The electronic transitions from the valenceband to dopant level or from the dopant level to the conductionband can effectively red shift the band edge absorption threshold.Dopants such as Cu2+ and Fe3+ show d-d transition in thevisible region. Thus, optical absorption of metal doped systemsdepends on the energy levels of the dopants within the TiO2
lattice, their d electronic configuration, and the distribution ofthe dopants metal ions.19
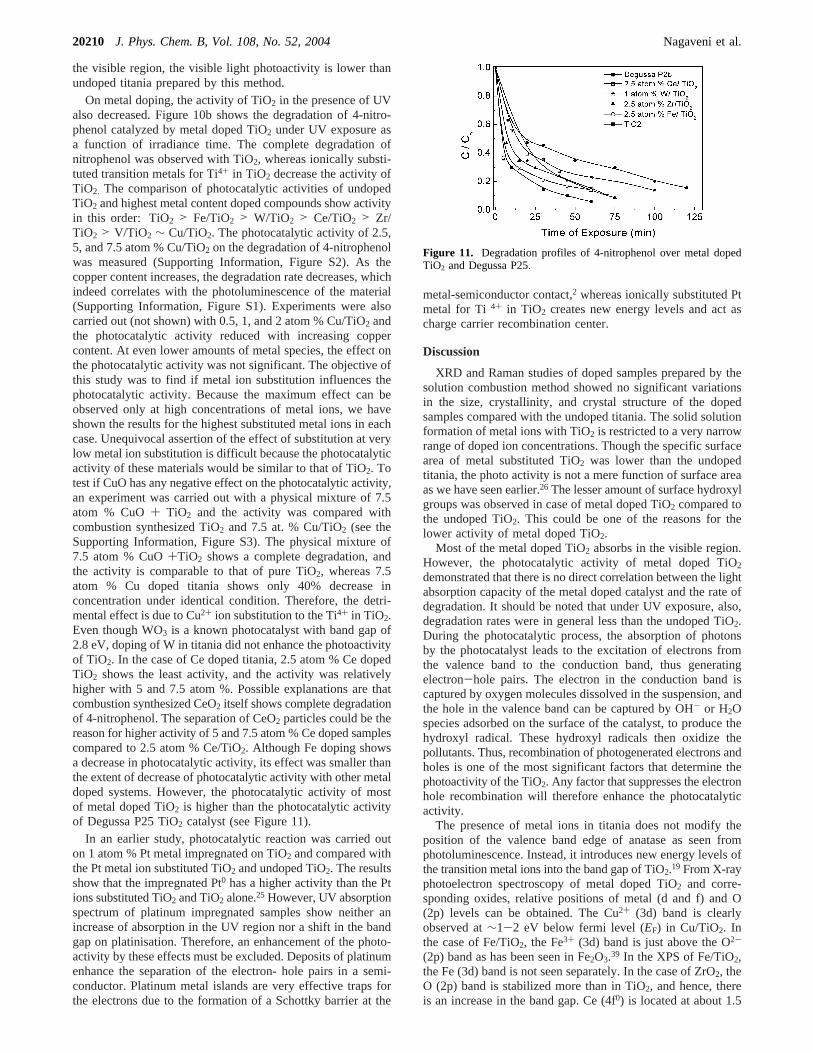
Photoluminescence of Metal Doped TiO2. The photolumi-nescence technique has been widely used in the field ofphotocatalysis over solid semiconductors as a useful probe forunderstanding the surface processes in which photo formedelectrons and holes take part, i.e., primary processes in photo-catalysis. Figure 9 shows photoluminescence (PL) emissionspectra of all metal doped titania along with pure TiO2.Luminescence spectra of TiO2 exhibit two emission peaks at419 and 483 nm with excitation at 285 nm. The emission bandat 419 nm is due to free exciton emission of TiO2. The emissionband at 483 is due to the surface state such as Ti4+-OH. Themetal doped TiO2 also shows emission spectra at the sameenergy as that of pure TiO2. Although the peak positions in thePL of the metal doped titania are in agreement with pure TiO2,the PL intensities are quite sensitive to metal doping. The PLintensities of metal doped titania are much lower than that ofthe undoped titania. The quenching increases with the increasein the amount of doping (see the Supporting Information, FigureS1). This is attributed to the enhanced metal-metal interactionat higher concentrations.37
Since excitation was carried out under equal absorptionconditions at 285 nm, the decrease in emission intensities mustoriginate from the differences in electronic structure of the metaldoped samples. The observed decrease in the photoluminescenceintensity on metal doping can be attributed to the electrontransfer processes from the excited state (CB) to the new levelsintroduced by the metal dopants. The free hole can recombinewith a trapped electron, or a free electron can recombine witha trapped hole. These recombination processes can be nonra-diative and quench the fluorescence. If it is radiative, theemission energy can be considerably less than Eg, and emissioncan occur at higher wavelength.
The decrease in emission intensity can also be due to theintroduction of new defect sites such as oxide ion vacancy.Oxygen vacancy can trap an electron in the following path-way:38
The ionized oxygen vacancy level is poised to rapidly trap aphotogenerated CB electron that subsequently interacts with avalence band hole either radiatively or nonradiatively.
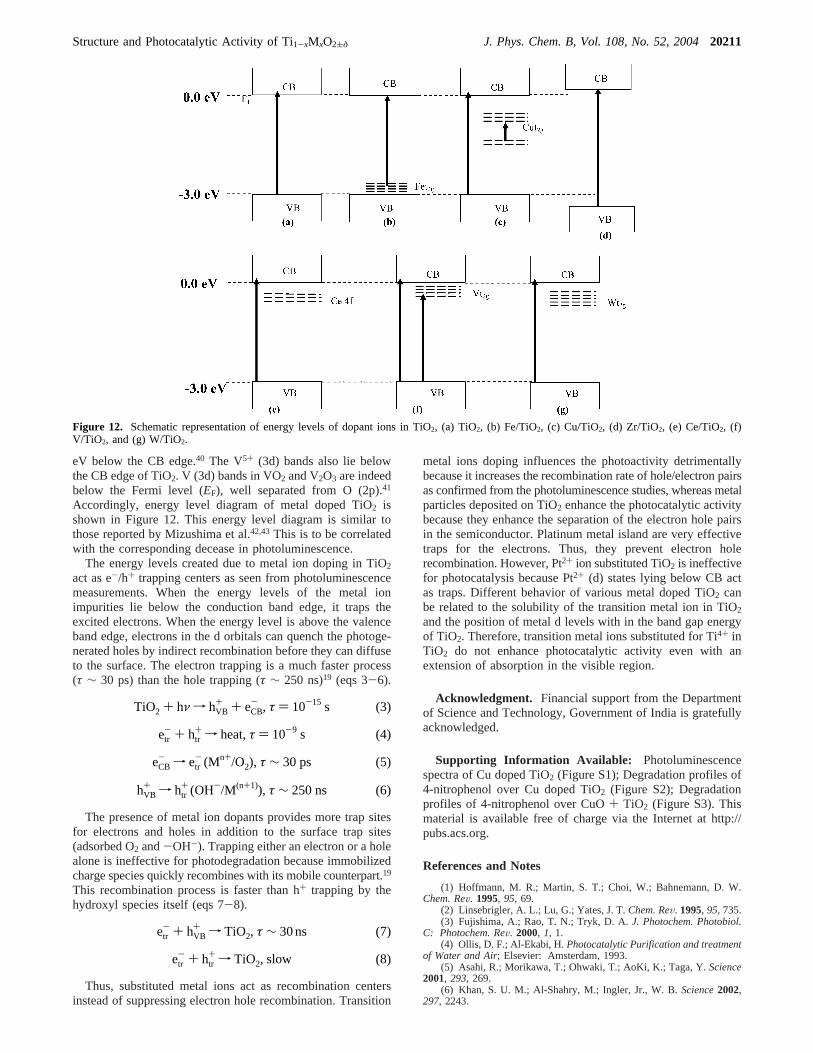
Photocatalytic Activity of Metal Doped TiO2. Degradationof 4-nitrophenol is not significant in the absence of TiO2 andno degradation occurs in the absence of light when TiO2 ispresent. Figure 10a shows the degradation profile of 4-nitro-phenol under solar irradiation with an initial concentration of0.5 mM (69.5 ppm) and the catalyst loading of 1 kg m-3. An80% decrease in the concentration of 4-nitrophenol is observedin 120 min in the presence of pure TiO2. Only 16.5%, 26%,and 36% decreases in concentration are observed at 120 minwith 5 atom % Cu doped TiO2, 7.5 atom % Fe/TiO2, and 2.5atom % Ce/TiO2. Although the metal doped titania absorbs in
Figure 9. Photoluminescence spectra of metal doped TiO2.
Figure 10. Degradation profiles of 4-nitrophenol of 0.5 mM initialconcentration with catalyst loading of 1 kg/m3 over metal doped TiO2and combustion synthesized TiO2 (a) solar (b) UV exposure.
VO0 + eCB
- f VO (Electron trapping in shallow traps) (1)
VO + hVB+ f VO
0 + hν (Radiative recombination) (2)
Structure and Photocatalytic Activity of Ti1-xMxO2(δ J. Phys. Chem. B, Vol. 108, No. 52, 200420209
the visible region, the visible light photoactivity is lower thanundoped titania prepared by this method.
On metal doping, the activity of TiO2 in the presence of UValso decreased. Figure 10b shows the degradation of 4-nitro-phenol catalyzed by metal doped TiO2 under UV exposure asa function of irradiance time. The complete degradation ofnitrophenol was observed with TiO2, whereas ionically substi-tuted transition metals for Ti4+ in TiO2 decrease the activity ofTiO2. The comparison of photocatalytic activities of undopedTiO2 and highest metal content doped compounds show activityin this order: TiO2 > Fe/TiO2 > W/TiO2 > Ce/TiO2 > Zr/TiO2 > V/TiO2 ∼ Cu/TiO2. The photocatalytic activity of 2.5,5, and 7.5 atom % Cu/TiO2 on the degradation of 4-nitrophenolwas measured (Supporting Information, Figure S2). As thecopper content increases, the degradation rate decreases, whichindeed correlates with the photoluminescence of the material(Supporting Information, Figure S1). Experiments were alsocarried out (not shown) with 0.5, 1, and 2 atom % Cu/TiO2 andthe photocatalytic activity reduced with increasing coppercontent. At even lower amounts of metal species, the effect onthe photocatalytic activity was not significant. The objective ofthis study was to find if metal ion substitution influences thephotocatalytic activity. Because the maximum effect can beobserved only at high concentrations of metal ions, we haveshown the results for the highest substituted metal ions in eachcase. Unequivocal assertion of the effect of substitution at verylow metal ion substitution is difficult because the photocatalyticactivity of these materials would be similar to that of TiO2. Totest if CuO has any negative effect on the photocatalytic activity,an experiment was carried out with a physical mixture of 7.5atom % CuO+ TiO2 and the activity was compared withcombustion synthesized TiO2 and 7.5 at. % Cu/TiO2 (see theSupporting Information, Figure S3). The physical mixture of7.5 atom % CuO+TiO2 shows a complete degradation, andthe activity is comparable to that of pure TiO2, whereas 7.5atom % Cu doped titania shows only 40% decrease inconcentration under identical condition. Therefore, the detri-mental effect is due to Cu2+ ion substitution to the Ti4+ in TiO2.Even though WO3 is a known photocatalyst with band gap of2.8 eV, doping of W in titania did not enhance the photoactivityof TiO2. In the case of Ce doped titania, 2.5 atom % Ce dopedTiO2 shows the least activity, and the activity was relativelyhigher with 5 and 7.5 atom %. Possible explanations are thatcombustion synthesized CeO2 itself shows complete degradationof 4-nitrophenol. The separation of CeO2 particles could be thereason for higher activity of 5 and 7.5 atom % Ce doped samplescompared to 2.5 atom % Ce/TiO2. Although Fe doping showsa decrease in photocatalytic activity, its effect was smaller thanthe extent of decrease of photocatalytic activity with other metaldoped systems. However, the photocatalytic activity of mostof metal doped TiO2 is higher than the photocatalytic activityof Degussa P25 TiO2 catalyst (see Figure 11).
In an earlier study, photocatalytic reaction was carried outon 1 atom % Pt metal impregnated on TiO2 and compared withthe Pt metal ion substituted TiO2 and undoped TiO2. The resultsshow that the impregnated Pt0 has a higher activity than the Ptions substituted TiO2 and TiO2 alone.25 However, UV absorptionspectrum of platinum impregnated samples show neither anincrease of absorption in the UV region nor a shift in the bandgap on platinisation. Therefore, an enhancement of the photo-activity by these effects must be excluded. Deposits of platinumenhance the separation of the electron- hole pairs in a semi-conductor. Platinum metal islands are very effective traps forthe electrons due to the formation of a Schottky barrier at the
metal-semiconductor contact,2 whereas ionically substituted Ptmetal for Ti 4+ in TiO2 creates new energy levels and act ascharge carrier recombination center.
Discussion
XRD and Raman studies of doped samples prepared by thesolution combustion method showed no significant variationsin the size, crystallinity, and crystal structure of the dopedsamples compared with the undoped titania. The solid solutionformation of metal ions with TiO2 is restricted to a very narrowrange of doped ion concentrations. Though the specific surfacearea of metal substituted TiO2 was lower than the undopedtitania, the photo activity is not a mere function of surface areaas we have seen earlier.26 The lesser amount of surface hydroxylgroups was observed in case of metal doped TiO2 compared tothe undoped TiO2. This could be one of the reasons for thelower activity of metal doped TiO2.
Most of the metal doped TiO2 absorbs in the visible region.However, the photocatalytic activity of metal doped TiO2
demonstrated that there is no direct correlation between the lightabsorption capacity of the metal doped catalyst and the rate ofdegradation. It should be noted that under UV exposure, also,degradation rates were in general less than the undoped TiO2.During the photocatalytic process, the absorption of photonsby the photocatalyst leads to the excitation of electrons fromthe valence band to the conduction band, thus generatingelectron-hole pairs. The electron in the conduction band iscaptured by oxygen molecules dissolved in the suspension, andthe hole in the valence band can be captured by OH- or H2Ospecies adsorbed on the surface of the catalyst, to produce thehydroxyl radical. These hydroxyl radicals then oxidize thepollutants. Thus, recombination of photogenerated electrons andholes is one of the most significant factors that determine thephotoactivity of the TiO2. Any factor that suppresses the electronhole recombination will therefore enhance the photocatalyticactivity.
The presence of metal ions in titania does not modify theposition of the valence band edge of anatase as seen fromphotoluminescence. Instead, it introduces new energy levels ofthe transition metal ions into the band gap of TiO2.19 From X-rayphotoelectron spectroscopy of metal doped TiO2 and corre-sponding oxides, relative positions of metal (d and f) and O(2p) levels can be obtained. The Cu2+ (3d) band is clearlyobserved at∼1-2 eV below fermi level (EF) in Cu/TiO2. Inthe case of Fe/TiO2, the Fe3+ (3d) band is just above the O2-
(2p) band as has been seen in Fe2O3.39 In the XPS of Fe/TiO2,the Fe (3d) band is not seen separately. In the case of ZrO2, theO (2p) band is stabilized more than in TiO2, and hence, thereis an increase in the band gap. Ce (4f0) is located at about 1.5
Figure 11. Degradation profiles of 4-nitrophenol over metal dopedTiO2 and Degussa P25.
20210 J. Phys. Chem. B, Vol. 108, No. 52, 2004 Nagaveni et al.
eV below the CB edge.40 The V5+ (3d) bands also lie belowthe CB edge of TiO2. V (3d) bands in VO2 and V2O3 are indeedbelow the Fermi level (EF), well separated from O (2p).41
Accordingly, energy level diagram of metal doped TiO2 isshown in Figure 12. This energy level diagram is similar tothose reported by Mizushima et al.42,43 This is to be correlatedwith the corresponding decease in photoluminescence.
The energy levels created due to metal ion doping in TiO2
act as e-/h+ trapping centers as seen from photoluminescencemeasurements. When the energy levels of the metal ionimpurities lie below the conduction band edge, it traps theexcited electrons. When the energy level is above the valenceband edge, electrons in the d orbitals can quench the photoge-nerated holes by indirect recombination before they can diffuseto the surface. The electron trapping is a much faster process(τ ∼ 30 ps) than the hole trapping (τ ∼ 250 ns)19 (eqs 3-6).
The presence of metal ion dopants provides more trap sitesfor electrons and holes in addition to the surface trap sites(adsorbed O2 and-OH-). Trapping either an electron or a holealone is ineffective for photodegradation because immobilizedcharge species quickly recombines with its mobile counterpart.19
This recombination process is faster than h+ trapping by thehydroxyl species itself (eqs 7-8).
Thus, substituted metal ions act as recombination centersinstead of suppressing electron hole recombination. Transition
metal ions doping influences the photoactivity detrimentallybecause it increases the recombination rate of hole/electron pairsas confirmed from the photoluminescence studies, whereas metalparticles deposited on TiO2 enhance the photocatalytic activitybecause they enhance the separation of the electron hole pairsin the semiconductor. Platinum metal island are very effectivetraps for the electrons. Thus, they prevent electron holerecombination. However, Pt2+ ion substituted TiO2 is ineffectivefor photocatalysis because Pt2+ (d) states lying below CB actas traps. Different behavior of various metal doped TiO2 canbe related to the solubility of the transition metal ion in TiO2
and the position of metal d levels with in the band gap energyof TiO2. Therefore, transition metal ions substituted for Ti4+ inTiO2 do not enhance photocatalytic activity even with anextension of absorption in the visible region.
Acknowledgment. Financial support from the Departmentof Science and Technology, Government of India is gratefullyacknowledged.
Supporting Information Available: Photoluminescencespectra of Cu doped TiO2 (Figure S1); Degradation profiles of4-nitrophenol over Cu doped TiO2 (Figure S2); Degradationprofiles of 4-nitrophenol over CuO+ TiO2 (Figure S3). Thismaterial is available free of charge via the Internet at http://pubs.acs.org.
References and Notes
(1) Hoffmann, M. R.; Martin, S. T.; Choi, W.; Bahnemann, D. W.Chem. ReV. 1995, 95, 69.
(2) Linsebrigler, A. L.; Lu, G.; Yates, J. T.Chem. ReV. 1995, 95, 735.(3) Fujishima, A.; Rao, T. N.; Tryk, D. A.J. Photochem. Photobiol.
C: Photochem. ReV. 2000, 1, 1.(4) Ollis, D. F.; Al-Ekabi, H.Photocatalytic Purification and treatment
of Water and Air; Elsevier: Amsterdam, 1993.(5) Asahi, R.; Morikawa, T.; Ohwaki, T.; AoKi, K.; Taga, Y.Science
2001, 293, 269.(6) Khan, S. U. M.; Al-Shahry, M.; Ingler, Jr., W. B.Science2002,
297, 2243.
Figure 12. Schematic representation of energy levels of dopant ions in TiO2, (a) TiO2, (b) Fe/TiO2, (c) Cu/TiO2, (d) Zr/TiO2, (e) Ce/TiO2, (f)V/TiO2, and (g) W/TiO2.
TiO2 + hν f hVB+ + eCB
- , τ ) 10-15 s (3)
etr- + htr
+ f heat,τ ) 10-9 s (4)
eCB- f etr
- (Mn+/O2), τ ∼ 30 ps (5)
hVB+ f htr
+ (OH-/M(n+1)), τ ∼ 250 ns (6)
etr- + hVB
+ f TiO2, τ ∼ 30 ns (7)
etr- + htr
+ f TiO2, slow (8)
Structure and Photocatalytic Activity of Ti1-xMxO2(δ J. Phys. Chem. B, Vol. 108, No. 52, 200420211

(7) Nagaveni, K.; Hegde, M. S.; Ravishankar, N.; Subbanna, G. N.;Madras. G.Langmuir2004, 20, 2900.
(8) Butler, E. C.; Davis, A. P.J. Photochem. Photobiol. A: Chem.1993, 70, 273.
(9) Di Paola, A.; Lopez, E. G.; Ikeda, S.; Marci, G.; Ohatani, B.;Palmisano, L.Catal. Today. 2002, 75, 87.
(10) Yu, J. C.; Lin, J.; Kwok, R. W. M.J. Phys. Chem. 1998, 102,5094.
(11) Fuerte, A.; Herna´ndez-Alonso, M. D.; Maira, A. J.; Martı`nez-Arias,A.; Fernandez-Garcı´a, M.; Conesa, J. C.; Soria, J.; Munuera, G.J. Catal.2002, 212, 1.
(12) Serpone, N.; Lawless, D.Langmuir1994, 10, 643.(13) Sclafani, A.; Palmisano, L.; Davi, E.J. Photochem. Photobiol. A:
Chem.1991, 53, 113.(14) Grzybowska, B.; Słoczynski, J.; Grabowski, R.; Samson, K.;
Gressel, I.; Wcisło, K.; Gengembre, L.; Barbaux, Y.Appl. Catal. A: Gen.2002, 230, 1.
(15) Yu, J. C.; Lin, J.; Kwok, R. W. M.J. Photochem. Photobiol. A:Chem.1997, 111, 199.
(16) Borgarello, E.; Kiwi, J.; Gra¨tzel, M.; Pelizzetti, E.; Visca, M.J.Am. Chem. Soc. 1982, 104, 2996.
(17) Lin, J.; Yu, J. C.; Lo, D.; Lam, S. K.J. Catal.1999, 183, 368.(18) Karakitsou, K. E.; Verykios, X. E.J. Phys. Chem.1993, 97,
1184.(19) Choi, W.; Termin, A.; Hoffmann, M. R.J. Phys. Chem.1994, 98,
13669.(20) Palmisano, L.; Augugliaro, V.; Sclafani, A.; Schiavello, M.J. Phys.
Chem. 1988, 92, 6710.(21) Luo, Z.; Gao, Q.-H.J. Photochem. Photobiol. A: Chem. 1992, 63,
367.(22) Priolkar, K. R.; Bera, P.; Sarode, P. R.; Hegde, M. S.; Emura, S.;
Kumashiro, R.; Lalla, N. P.Chem. Mater.2002, 14, 2120.(23) Bera, P.; Priolkar, K. R.; Sarode, P. R.; Hegde, M. S.; Emura, S.;
Kumashiro, R.; Lalla, N. P.Chem. Mater.2002, 14, 3591.
(24) Bera, P.; Gayen, A.; Hegde, M. S.; Lalla, N. P.; Spadaro, L.;Frusteri, F.; Aruna, F.J. Phys. Chem. B2003, 107, 6122.
(25) Sivalingam, G.; Nagaveni, K.; Hegde, M. S.; Madras, G.Appl.Catal. B: EnViron. 2003, 45, 23.
(26) Nagaveni, K.; Sivalingam, G.; Hegde, M. S.; Madras, G.Appl.Catal. B: EnViron. 2004, 48, 83.
(27) Nagaveni, K.; Sivalingam, G.; Hegde, M. S.; and Madras, G.EnViron. Sci. Technol.2004, 38 (5), 1600.
(28) Gratzel, M.; Howe, R. F.J. Phys. Chem.1990, 94, 2566.(29) Bickley, R. I.; Lees, J. S.; Tilley, R. J. D.; Palmisano, L.; Schiavello,
M. J. Chem. Soc., Faraday Trans.1992, 88, 377.(30) Martin, S. T.; Morrison, C. L.; Hoffmann, M. R.J. Phys. Chem.
1983, 98, 13695.(31) Yashima, M.; Arashi, H.; Kakihana, M.; Yoshimura, M.J. Am.
Ceram. Soc. 1994, 77, 1067.(32) Martinez-Arias, A.; Fernandez-Garcia, M.; Salamanca, L. N.;
Valenzuela, R. X.; Oria, J. C.J. Phys. Chem. B2000, 104, 4038.(33) Briggs, D.; Seah, M. P.Practical Surface Analysis by Auger and
X-ray Photoelectron Spectroscopy; John Wiley & Sons: New York, 1984.(34) Turchi, C. S.; Ollis, D. F.J. Catal.1990, 122, 178.(35) Sato, S.Langmuir1988, 4, 1156.(36) Bandara, J.; Mielczarski, J. A.; Kiwi, J.Langmuir, 1999, 15, 7680.(37) Kang, M.J. Mol. Catal. A: Chem. 2003, 197, 173.(38) Sooklal, K.; Cullum, B. S.; Angel, S. M.; Murphy, C. J.J. Phys.
Chem. B1996, 100, 4551.(39) Vasudevan, S.; Hegde, M. S.; Rao, C. N. R.J. Solid State Chem.
1979, 29, 253.(40) Sharma, D. D.; Hegde, M. S.; Rao, C. N. R.J. Chem. Soc., Faraday
Trans. 2 1981, 77, 1509.(41) Vasudevan, S.; Hegde, M. S.Pramana1979, 12, 151.(42) Mizushima, K.; Tanaka, M.; Ashi, A.; Iida, S.J. Phys. Chem. Soilds.
1979, 40, 1129.(43) Mizushima, K.; Tanaka, M.; Iida, S.J. Phys. Soc. Jpn.1972, 32,
1519.
20212 J. Phys. Chem. B, Vol. 108, No. 52, 2004 Nagaveni et al.


![cS^($(][X[+$T(ZR-]&*+(]!,[X#!R(T-*$+!]([#('-,+-#(N-([,(Z ...65 2014 0 A 55](https://static.fdocuments.net/doc/165x107/5f9a4b0411420c1de0100806/csxtzr-xrt-n-z-65-2014-0-a-55.jpg)