Preparation of DOPC and DPPC Supported Planar Lipid Bilayers for

Structural Properties of Archaeal Lipid Bilayers: Small-Angle X‑rayScattering and Molecular Dynamics Simulation StudyAndraz Polak,† Mounir Tarek,*,‡,§ Matija Tomsic,∥ Janez Valant,⊥ Natasa Poklar Ulrih,⊥ Andrej Jamnik,∥
Peter Kramar,† and Damijan Miklavcic*,†
†Faculty of Electrical Engineering, University of Ljubljana, Trzaska cesta 25, SI-1000 Ljubljana, Slovenia‡Universite de Lorraine, UMR 7565, F-54506 Vandoeuvre-les-Nancy, France§CNRS, UMR 7565, F-54506 Vandoeuvre-les-Nancy, France∥Faculty of Chemistry and Chemical Technology, University of Ljubljana, Askerceva c. 5, SI-1000 Ljubljana, Slovenia⊥Biotechnical Faculty, University of Ljubljana, Jamnikarjeva 101, SI-1000 Ljubljana, Slovenia
ABSTRACT: Aeropyrum pernix is an aerobic hyperthermophilic archaeon that growsin harsh environmental conditions and as such possesses unique structural and metabolicfeatures. Its membrane interfaces with the extreme environment and is the first lineof defense from external factors. Therefore, lipids composing this membrane have specialmoieties that increase its stability. The membrane of A. pernix is composed pre-dominantly of two polar lipids 2,3-di-O-sesterterpanyl-sn-glicerol-1-phospho-1′(2′-O-α-D-glucosyl)-myo-inositol (AGI) and 2,3-di-O-sesterterpanyl-sn-glicerol-1-phospho-myo-inositol (AI). Both have methyl branches in their lipid tails and ether linkages andcarbohydrates in their headgroup. These moieties significantly affect the structure anddynamics of the bilayer. To provide a molecular level insight into these characteristics,we used here Molecular Dynamics (MD) simulations of lipid bilayers of composition similar to those of the archaeal membranes.First, we show that the electron density profiles along the normal to the bilayers derived from the simulations are in good agreementwith the profiles obtained by the small-angle X-ray scattering (SAXS) technique, which provides confidence in the force fields used.Analyses of the simulation data show that the archaeal lipid bilayers are less hydrated than conventional phosphatidylcholine (PC)lipids and that their structure is not affected by the salt present in the surrounding solution. Furthermore, the lateral pressure in theirhydrophobic core, due to the presence of the branched tails, is much higher than that at PC-based lipid bilayers. Both the methylbranched tails and the special headgroup moieties contribute to slow drastically the lateral diffusion of the lipids. Furthermore, wefound that the lipid head groups associate via hydrogen bonding, which affects their reorientational dynamics. All together, our dataprovide links between the microscopic properties of these membranes and their overall stability in harsh environments.
1. INTRODUCTION
Archaea are microorganisms that survive and grow at harshenvironmental conditions and as such possess unique structuraland metabolic features. They can be grouped on the basis of theextreme environmental conditions as follows: into halophilesthat grow in high salt concentration, acidophiles that grow at lowpH, alcalophiles that grow at high pH, thermophiles that grow athigh temperatures, psychrophilic that grow at low temperatures,and many others.1−3 The membranes of archaea cells interfacewith the extreme environment and are the first line of defenseagainst external factors. Therefore, archaeal lipids that form thesemembranes have special moieties that increase their stability.They are composed in general by glycerophosphate head groups,ether linkages between glycerol moiety and hydrocarbon tails,methyl branching of hydrocarbon chains or hydrocarbon chainswith cyclopentane rings, and sometimes are rather bipolar lipidswith tetraether core and headgroup composed of carbohydrates.2
Aeropyrum pernix K1 is an aerobic hyperthermophilic archaeathat grows in a coastal solfataric vent at Kodakara, Juma Island,Japan. It can live in temperatures up to 100 °C. The optimalgrowth conditions of A. pernix are temperature between 90 and
95 °C, pH 7.0, and salinity of 3.5%. The shape of the cells isspherical with a diameter from 0.8 to 1.2 μm.4 Themembranes ofthese archaea are composed of two lipids: 2,3-di-O-sesterter-panyl-sn-glicerol-1-phospho-1′(2′-O-α-D-glucosyl)-myo-inositol(AGI) and 2,3-di-O-sesterterpanyl-sn-glicerol-1-phospho-myo-inositol (AI) with molar ratio of AI and AGI as 9:91 mol %.5 Ithas been shown that vesicles composed of AI and AGI lipids arevery stable, capable of encapsulating potential substances, andmay be uptaken into cells endocytotically.6,7 It was also foundthat these lipids are nontoxic to CACO-2 and Hep G2 cells,only mildly toxic to B1-6F1 and CHO cells, and very toxic toEA.hy926 cells.7
In this Article, we investigate the structural properties ofarchaeal lipid bilayer, composed of polar lipids isolated fromA. pernix, at different temperatures. The bilayers were firstinvestigated using the small-angle X-ray scattering (SAXS)technique, which provided corresponding thickness pair-distance
Received: April 14, 2014Revised: June 20, 2014Published: June 25, 2014
Article
pubs.acs.org/Langmuir
© 2014 American Chemical Society 8308 dx.doi.org/10.1021/la5014208 | Langmuir 2014, 30, 8308−8315

distribution functions and the electron density profiles. Thesewere then compared to the electron density profiles derivedfrom MD simulations. From the equilibrated bilayers in theMD simulation, we fully characterized the structural and electro-static properties of these bilayers. This study is an extension ofour previous study entitled “Electroporation of Archaeal LipidMembranes using MD Simulations”.8
2. MATERIALS AND METHODS2.1. Growth of Aeropyrum pernix K1. A. pernix was grown in a 1 L
flask at 92 °C. The maximal biomass was obtained by adding Na2S2O3 ×5H2O (1 g of per liter) (Alkaloid, Skopje, Macedonia) to Marine Broth2216 (Difco, Becton, Dickinson and Co., Sparks, U.S.) at pH 7.0(20 mM HEPES buffer) as described before.9 After growth, the cellswere harvested by centrifugation, washed, and lyophilized.2.2. Isolation and Purification of Lipids, and Vesicle
Preparation. The total polar lipid methanol fraction composed of 91mol % AGI and 9 mol % AI5 (average molecular mass, 1181.42 g mol−1)was purified from lyophilized A. pernix cells, as described previously.6
After isolation, the lipids were fractionated with adsorption chromatog-raphy.10 The liposomes were prepared by thin lipid film formationby drying the lipid sample on a rotary evaporator. The dried lipidfilms were then hydrated by 20 mM HEPES buffer pH 7.0 or deionizedwater (Milli-Q), temperature 45 °C. Multilamellar vesicles (MLV) wereprepared by vortexing the lipid suspensions vigorously for 10 min. MLVwere further transformed into large unilamellar vesicles (LUV) bysix freeze (liquid nitrogen) and thaw (warm water) cycles and bypressure-extruded 21 times through 400 nm polycarbonate membraneson an Avanti polar mini-extruder (Avanti Polar Lipids, Alabastr, AL), attemperature between 50 and 60 °C. The lipid concentration in thesamples for SAXS experiments was 10 mg/mL.2.3. Small-Angle X-ray Scattering (SAXS) Measurements.
SAXS measurements were performed on the modified Kratky compactcamera (Anton Paar KG, Graz, Austria)11 equipped with the focusingmultilayer optics for X-rays (Osmic, Max-Flux). The camera wasattached to a conventional X-ray generator Kristalloflex 760 (BrukerAXS GmbH, Karlsruhe, Germany) with a sealed X-ray tube (Cu Kα
X-rays with a wavelength λ = 0.154 nm) operating at 40 kV and 35 mA.The samples were measured in a standard quartz capillary with an outerdiameter of 1 mm and wall thickness of 10 μm. Position-sensitive detectorPSD-50M(M.BraunGmbH,Garching,Germany)was used for detection ofthe scattered x-rays in the small-angle regime of scattering vectors 0.1 < q <7.5 nm−1, where, q = 4π/γ·sin(ϑ/2), ϑ representing the scattering angle.To get sufficient measuring statistics, each sample was measured for aperiod of 20 h. Prior to the detailed data analysis, the scattering datawere corrected for the empty capillary and solvent scattering, and put onthe absolute scale using water as a secondary standard.12
2.4. Evaluation of SAXS Data. Experimental SAXS data wereevaluated utilizing the Generalized Indirect Fourier Transformation(GIFT) software package.13−18 There were no interlamellar interferencepeaks observed in the scattering curves in our case. Similarly, the maxi-mum dimension of the scattering particles (large unilamellar vesicles)wasmuch bigger than the size resolution of the SAXSmethod; therefore,solely the basic part of the GIFT, that is, the Indirect FourierTransformation (IFT) technique, was used.19,20 In such cases, one canstill extract the structural information on the thickness of the lipid bilayerfrom the scattering curves, because the thickness of the bilayer is usuallystill well within the experimental resolution of the SAXS method.For this purpose, the IFT technique is used in a special mode, whereI(q)q2 is cosine transformed into the real space yielding the thicknesspair distance distribution function pt(r).
20−22 In this procedure, aconsiderable cutoff must be applied to the scattering curves in theregime of very low q values to exclude the part of the scattering curvethat is strongly affected by the scattering contribution originating fromthe large dimensions of the lipid bilayer; in this way, solely the structuralinformation related to the thickness of the lamellar bilayer can beextracted. Such an approach is based on the thickness form factor, It(q),which represents the scattering due to the structure in perspective of thebilayer thickness and is completely model-free. The thickness form
factor can be written as the cosine transformation of the thickness pair-distance distribution function pt(r):
20−22
∫π π= =∞
I q q AI q A p r qr r( ) 2 ( ) 4 ( ) cos( ) d2t
0 t (1)
where r is the distance between two scattering centers within theparticle. The resulting pt(r) function serves as a tool for the deter-mination of the scattering particles geometry.19−23 At distances r biggerthan the thickness of the bilayer, the pt(r) function adopts the value ofzero and in this way provides a useful tool for the determination ofthe bilayer thickness. In addition, the scattering contrast profile acrossthe bilayer in direction perpendicular to its plane, which providesvaluable information on the bilayer internal structure, can be calculatedfrom the pt(r) function by a convolution square root operation utilizingthe DECON program:24−26
∫ ρ ρ= Δ ·Δ −−∞
∞p r z z r r( ) ( ) ( ) dt e e (2)
with Δρe(z) representing the local scattering contrast, that is, thedifference between the local electron density at distance z from the centerof symmetry (central plane in the middle of bilayer) and the averageelectron density of the sample ρe. To facilitate comparison of MD andSAXS results, in further text the scattering contrast profile ρe(z) will bereferred to simply as the electron density profile and denoted with thesymbol ρe(z). Note that r in pt(r) corresponds to the distance in real space(information on the overall bilayer thickness), but z in the electron densityprofile is determined with respect to the central plane of the bilayer.
2.5. MD Simulations. The molecular dynamics (MD) models andsimulations were adopted from our previous study.8 The MD simu-lations presented here were carried out using the program NAMD.27
The systems were examined in the NPT (constant number of atoms,pressure, and temperature) ensembles employing Langevin dynamicsand the Langevin piston method. The time step for integrating theequations of motion was set at 2.0 fs. Short- and long-range forces werecalculated every one and two time steps, respectively. Bonds betweenhydrogen and heavy atoms were constrained to their equilibrium value.Long-range, electrostatic forces were taken into account using theparticle mash Ewald (PME) approach.28,29 The structures of AI and AGImolecules, which compose the membrane of A. pernix, were suggestedbyMorii et al.5 TheMDmodels were built by combining the CHARMM36 lipid force field and the CHARMM 36 carbohydrate force field. Theparameters for ester linkages were adopted from Shinoda et al.30
First, the bilayer was composed of 64 lipids (6 AI and 58 AGI). Thecomposition of the bilayer was a molar ratio of 9:91, which was measuredexperimentally.5 The bilayer was surrounded by 10 283 water molecules, 144potassium(K+), and 80 chloride (Cl−) ions (∼0.45MKCl). That systemwasequilibrated for 120 ns at constant numbers of atoms, constant pressure(1 atm), and constant temperature (50 °C) (NPT). The system then wasreplicated twice in theX and Y directions of the bilayer plane to afford a largemembranepatch and equilibrated again at 90, 70, and25 °C(NPT) for 30ns.After the equilibration of systems at 70 and 25 °C, the potassium (K+) andchloride (Cl−) ions were removed, and then the counterions (Na+) wereadded to neutralize the systems and equilibrated again for the 30 ns. Thesystems with counterions (Na+) mimicked the situation during the SAXSexperiments. The electron density profiles of these two systems werecompared to electron density profiles obtained by experimental SAXS.These SAXS data weremeasured for the systems containing∼0.45MKCl.
In all of the simulated systems, the average area per lipid wasestimated by dividing the total area of the bilayer by the number of lipidsin each leaflet. The thickness of the bilayer was defined as the distancebetween the two highest peaks of the electron density profile. Thepositions of these peaks correspond to the location of the lipidphosphate groups in bilayer. The radial distribution functions (RDFs)were calculated using the VMD GofRGUI Plugin. The in-plane lateraldiffusion coefficients (D) of the lipids were estimated from the slopes ofthe mean squared displacements (MSDs) of the center of the moleculesin the interval from 5 to 15 ns according to
= ⟨| − − | ⟩→∞
Dd t
r t t r t1
2lim
1( ) ( )
tz0 0
2(3)
Langmuir Article
dx.doi.org/10.1021/la5014208 | Langmuir 2014, 30, 8308−83158309

where d = 2 is the number of translational degrees of freedom and t0 = 5 ns.The rotational motion of the head groups moieties was calculated
using the second rank reorientational autocorrelation function:
= ⟨ · − ⟩C t V t V( )12
3[ ( ) (0)] 12(4)
where V is unit vector defined in Figure 5A.All tof he analyses were performed on the data of the last 15 ns of each
simulation run.
We have also estimated the local pressure profiles31 along z, thebilayer normal, at various system configurations. The pressure profilesmay be calculated from simulations as
∑ ∑=Δ
⊗ − ⊗<
p zV
m f z z zv v F r( )1
[ ( , , )]i
i i ii j
ij ij i j(5)
where p(z) is the local pressure tensor in the slab centered on thecoordinate z, the sum over the kinetic term running over all atoms in theslab, and f(z,zi,zj) is a weighting function. The calculations were all
Figure 1. (A) Experimental SAXS curves of liposomes composed of archaeal lipids at 25 °C (red○) and 70 °C (○) on absolute scale and IFT fits for thelamellar symmetry (gray lines). (B) The corresponding results of the IFT evaluation for lamellar symmetry−thickness pair-distance distributionfunctions pt(r). (C) Electron density profiles ρe(z) determined on the basis of the experimental SAXS results obtained from the pt(r) functions by aconvolution square root operation. (D) Electron density profiles of archaeal lipid bilayers derived fromMD simulations. The electron density profiles ofliposomes composed of archaeal lipids at 25 °C (E) and 70 °C (F). The profiles are derived from MD simulations (archaeal lipids in water withcounterions Na+) (blue) and electron density profiles ρe(z) determined on the basis of the experimental SAXS results (black). These comparisons ofelectron density profiles between SAXS measurements and MD simulations have already been published by Polak et al.8
Langmuir Article
dx.doi.org/10.1021/la5014208 | Langmuir 2014, 30, 8308−83158310
performed on the fly27 from the simulations performed at constanttemperature and constant pressure. The lateral pressure profiles werecalculated using built-in function in NAMD. The simulation space ispartitioned into slabs, and one-half of the virial due to the interactionbetween two particles is assigned to each of the slabs containing theparticles. To evaluate local pressure, the Harasima contour was used.The algorithm is based on that of Lindahl and Edholm,32 with modi-fications to enable Ewald sums based on Sonne et al.33 The total virialcontains contributions from kinetic energy, bonded interactions,nonbonded interactions, and an Ewald sum. In lipid bilayers, thepressure profiles arise due to the amphipathic nature of the lipidscomposing it: the hydrophilic head groups are squeezed togetherto prevent exposure of the hydrophobic tails to the solvent leading toa negative lateral pressure, while the attractive dispersion forces andentropic repulsion between the lipid tails result mainly in a positivelateral pressure.
3. RESULTS AND DISCUSSION
The experimental SAXS curves of the vesicle sample composedof archaeal lipids at 25 and 70 °C are depicted in Figure 1A.These scattering curves show three broad scattering peaks thatare increasing in intensity with decreasing scattering vector q anda steep upturn of the scattering intensity at very low values of q.The broad scattering peaks occur in the q region correspondingto the thickness of the lipid bilayer, whereas the steep upturnat very low values of q occurs due to the very large overalldimensions of the bilayer that are above the resolution of theSAXS experiment. As the temperature increases, the broadscattering peaks decrease in intensity and shift toward higher qvalues. This indicates an increase in the bilayer thickness, whichpossibly leads also to a slight change in the scattering contrast ofthe bilayer.Because of the limited experimental resolution, the
information on the overall size of the vesicles is not completein these SAXS results; therefore, the steep upturn at low q needsto be cut off before the detailed IFT evaluation of the SAXS datacontaining information on the internal structure of the bilayer.The fits obtained by the IFT analysis are shown as gray linesin Figure 1A, whereas the resulting thickness pair-distancedistribution functions pt(r) are depicted in Figure 1B. Thesefunctions reveal a rather similar internal structure of thesebilayers in terms of the scattering contrast, with somewhat largeroverall thicknesses of the bilayer at lower temperature (6 nm at25 °C vs 5.5 nm at 70 °C). At higher temperature, the thermalenergy of lipid molecules is higher; the hydrophobic tails becomemore flexible and hydrophobic heads are hydrated to a lesserextent, and so therefore the lipid molecules can obviously packthemselves into thinner bilayers.The internal structure of the lipid bilayers is revealed in more
detail through the electron density profiles. These profiles wereobtained via convolution square root procedure of the experi-mentally obtained pt(r) functions and also by the MD simula-tions. The electron density profiles obtained by MD and SAXSmethod at 25 and 70 °C are shown in Figure 1. These profilesshow that the central part of the bilayer is negative, whereas theouter layers have the positive electron density in comparison tothe average electron density of the sample; the latter defines ρe =0. This is in agreement with the lower electron density of thehydrophobic hydrocarbon parts of the lipid molecules(comprising the central part of the lipid bilayer) in comparisonto the higher electron density of the polar headgroup parts ofthe lipid molecules (comprising the outer shells on each side ofthe bilayer). They also reveal the approximate thickness of thecentral hydrophobic part (∼3 nm) and the outer hydrophilic
shells of the bilayer (∼1.5 nm) and their slight changes with thetemperature. The comparison of the MD electron densityprofiles of the bilayers in two different buffers shows (water withcounterions (Na+) and 0.45 M KCl) that the buffer haspractically no effect on the electron density profile of the bilayer(data not shown). The shift in positions of the ρe(z) peaks thatis observed with the temperature increase corresponds to thechanges in the outer shells in the bilayers increases. Figure 1 alsoshows that the bilayers at lower temperatures are somewhatthicker.The comparison of electron density profiles derived from MD
simulations and SAXS results shows a good agreement. Slight dis-crepancies in the absolute values of ρe(z) can be noticed (Figure 1).These can arise either from the different nature of the twotechniques, from the numerical model of the system itself, or fromimpurities in the real samples that cannot be taken into account inthe simulations. Nevertheless, these results confirm the structuralaccuracy of the model and the force field used in our study.The time evolutions of the surface area per molecule (Am)
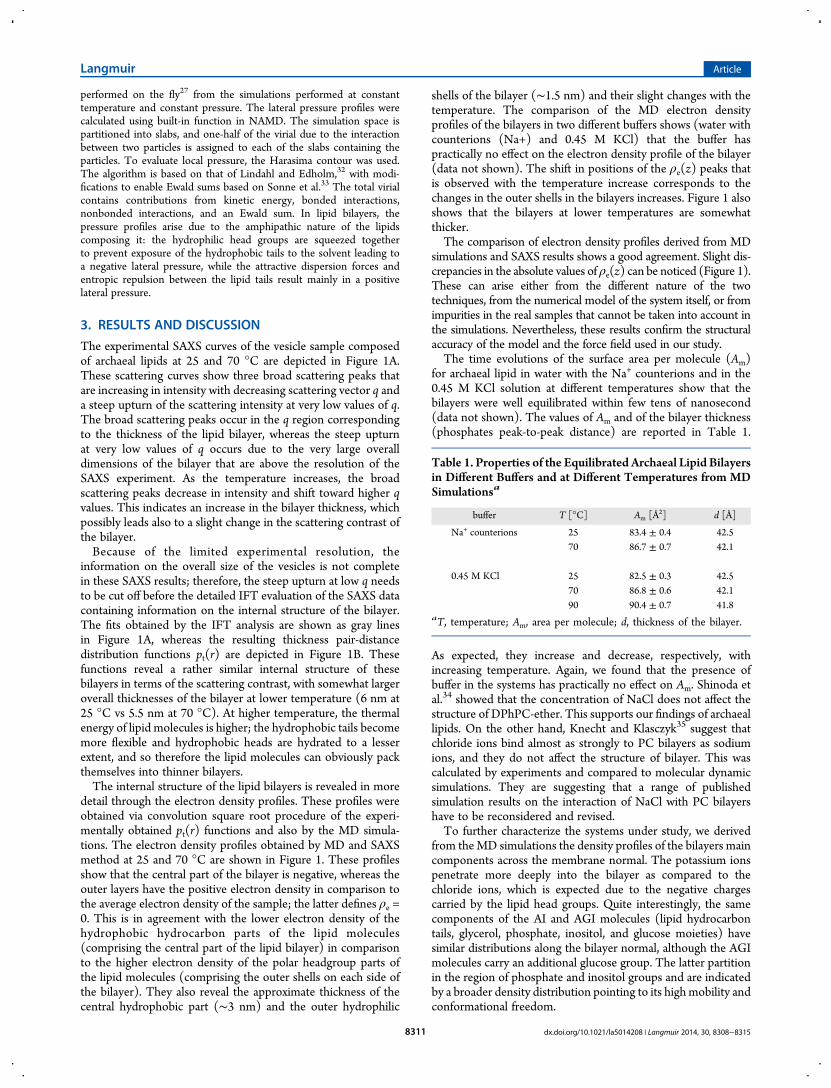
for archaeal lipid in water with the Na+ counterions and in the0.45 M KCl solution at different temperatures show that thebilayers were well equilibrated within few tens of nanosecond(data not shown). The values of Am and of the bilayer thickness(phosphates peak-to-peak distance) are reported in Table 1.
As expected, they increase and decrease, respectively, withincreasing temperature. Again, we found that the presence ofbuffer in the systems has practically no effect on Am. Shinoda etal.34 showed that the concentration of NaCl does not affect thestructure of DPhPC-ether. This supports our findings of archaeallipids. On the other hand, Knecht and Klasczyk35 suggest thatchloride ions bind almost as strongly to PC bilayers as sodiumions, and they do not affect the structure of bilayer. This wascalculated by experiments and compared to molecular dynamicsimulations. They are suggesting that a range of publishedsimulation results on the interaction of NaCl with PC bilayershave to be reconsidered and revised.To further characterize the systems under study, we derived
from theMD simulations the density profiles of the bilayers maincomponents across the membrane normal. The potassium ionspenetrate more deeply into the bilayer as compared to thechloride ions, which is expected due to the negative chargescarried by the lipid head groups. Quite interestingly, the samecomponents of the AI and AGI molecules (lipid hydrocarbontails, glycerol, phosphate, inositol, and glucose moieties) havesimilar distributions along the bilayer normal, although the AGImolecules carry an additional glucose group. The latter partitionin the region of phosphate and inositol groups and are indicatedby a broader density distribution pointing to its highmobility andconformational freedom.
Table 1. Properties of the Equilibrated Archaeal Lipid Bilayersin Different Buffers and at Different Temperatures from MDSimulationsa
buffer T [°C] Am [Å2] d [Å]
Na+ counterions 25 83.4 ± 0.4 42.570 86.7 ± 0.7 42.1
0.45 M KCl 25 82.5 ± 0.3 42.570 86.8 ± 0.6 42.190 90.4 ± 0.7 41.8
aT, temperature; Am, area per molecule; d, thickness of the bilayer.
Langmuir Article
dx.doi.org/10.1021/la5014208 | Langmuir 2014, 30, 8308−83158311

The average location of the lipid components with respectto the solvent indicates that hydration of the head groups in theselipids is quite different from that in simple lipid bilayers. Tocharacterize the latter, we have measured the radial distributionfunctions (RDF) of the solvent (water molecules) around thephosphorus atom in the archaeal lipids (Figure 2) and that ofPOPC and DPPC bilayers for the purpose of comparison. Thedata show that there is hardly any difference between thesedistribution functions for the two PC-based lipids, but a large onebetween PC and archaeal lipids. Furthermore, the RDFs at 70and 90 °C are exactly the same (data not shown). Table 2 reports
the coordination numbers and indicates that the phosphorushead groups in archaeal lipid are indeed less hydrated than thosein PC-based lipid bilayers.Interactions between the lipid components probably play a
major role in the stability of the bilayer. They moreover slow theoverall dynamics of the lipid head groups as well as the lateraldiffusion of the lipids, as we further quantify in the followingparagraphs. Because of the difference in interactions betweenthe headgroup moieties and the tails, one expects also a dif-ference in the pressure profiles along the membrane normalfor these archaeal and simple PC-based lipids with acyl chains.These profiles have been calculated and are reported togetherwith those of POPC and DPPC bilayer in Figure 3. Aside froma difference due to the change in bilayer hydrophobic corethickness, the peaks of the pressure at the interfacial regions aremuch higher in archaeal lipids as compared to PC-based lipids. Asit was observed, the archaeal lipid bilayers have a much largerpositive lateral pressure in the hydrophobic region.Turning back to the dynamical characteristics of the archaeal
lipid bilayer, we estimated the molecules lateral diffusion co-efficients D from the MSD curves by linear fitting (Figure 4).They indicate that archaeal lipids have much lower lateral diffu-sion than other phosphatidylcholine (PC) lipids at temperaturesabove the gel to liquid crystal phase transitions. For instance,the lateral diffusion coefficients of DPPC lipids (measuredexperimentally or estimated from MD simulations) amount to
∼1−4 × 10⁻⁷ cm2/s,36−38 and for 1,2-diphytanoyl-sn-glycero-3-phosphocholine (DPhPC)-ether at 25 °CD is∼4.8× 10⁻⁸ cm2/s.39
Figure 2. Radial distribution functions (RDFs).
Figure 3. Lateral pressure profile of archaeal lipid (red), POPC (black),and DPPC (blue) bilayers.
Table 2. Coordinate Number, the Number of Atoms in theFirst Shell around Phosphorous Atom in Archaeal Lipids,POPC, and DPPC
coordination number
atom pair archaeal lipid POPC DPPC
P−Hwater 4.60 5.87 5.64P−Owater 5.64 5.98 5.98P−water 3.98 5.45 5.20
Figure 4. Mean square displacement (MSD) of lipids in the bilayercomposed of archaeal lipids, POPC, and DPPC. The gray linear curves arefitted curves to the data from5 to 15 ns. From fitted curveswas the diffusioncoefficient (D) calculated. The D values of POPC, DPPC, and DPhPC-ester were determined on our unpublished and published MD system.40
Langmuir Article
dx.doi.org/10.1021/la5014208 | Langmuir 2014, 30, 8308−83158312

Figure 5 shows the orientations and reorientation autocorre-lation functions of the archaeal lipid headgroup components withrespect to the bilayer normal. We introduce here several vectorsalong these head groups to characterize the conformation of thelipids: VPino pointing from the phosphorus atom to the C-1 atomof inositol, Vino pointing from C-1 to C-4 atoms of the inositol(representing the orientation of the inositol), and Vglu pointing
from C-1 to C-4 of the glucose (representing the orientation ofglucose group) (Figure 5A). As the angles are not normallydistributed, we calculated median values of angles betweenvectors (Figure 5 and Table 3).We notice small differences in thedistribution of VPino and Vino in AGI molecules at differenttemperatures. The VPino and Vino in AI molecules have similardistributions at 70 and 90 °C. At 25 °C, there is a large change in
Figure 5. (A) AGI molecule with labeled vectors in the headgroup. The distributions of angle (α) between VPino, Vino, and Vglu, and normal to archaeallipid bilayers at 25, 70, and 90 °C (B−F). Vertical lines represent the median value of α. The graphs G−K present the reorientation autocorrelationfunction C(t). The data are derived from MD simulations.
Langmuir Article
dx.doi.org/10.1021/la5014208 | Langmuir 2014, 30, 8308−83158313

the conformation of the AI headgroup. It flips to almostperpendicular orientation with respect to the bilayer plane.The glucose in the headgroup has a bimodal distribution. Thismeans that the latter are tilted into or out of the bilayer.The reorientational autocorrelation functions provide insightinto the dynamics of the lipid head groups (Figure 5G, I, J, K).As expected, the time constants of the auto correlation decayare higher for larger temperatures, but we also observe thatheadgroup moieties of AI lipids are moving faster than theheadgroup moieties of AGI lipids. The presence of glucose in theAGI molecule appears to lower the dynamic of the headgroupmoieties, probably due to the formation of hydrogen bonds withsurrounding headgroup moieties. In comparison to simple PC-based lipids (e.g., DPPC), the dynamic of VPino reorientationeven at 90 °C is much slower than the dynamics of P−N vectorestimated at 50 °C (τ1/2 = 0.3 ns).41
4. SUMMARY AND CONCLUSIONSThe Aeropyrum pernix is a rare cell organism, whose membrane iscomposed predominantly of two polar lipids (AI and AGI).There is no report whether the AI and AGI molecules arerandomly distributed or aggregate in the membrane of A. pernix.Accordingly, in this study, we modeled archaeal lipid bilayersassuming a random distribution of its components. The bilayerswere simulated at a wide range of temperatures and at differentsalt concentrations. We considered in particular temperatureswhere the archaeal lipid bilayers are in the liquid crystallinephase. For comparison, DPhPC phospholipids that carry methylgroups in lipid tails as do AI and AGI lipids2 are also liquidcrystalline in a wide range of temperatures (−120 and 120 °C).42The structural properties of AI and AGI bilayers were calculatedand compared to electron density profiles extracted from SAXSmeasurements. The agreement obtained provided confidencein the force field parameters and protocols used in the MDsimulations.The properties of the archaeal bilayers as the average area
per lipid, the hydrophobic core thickness, the orientation of thelipid head-groups, and the dynamics of the lipids significantlychange with temperature in the range studied here (25−90 °C),while the salt nature and content seem to have no effect onthe structure of the bilayer (area per lipid and thickness).The presence of salt seems also to have a negligible effect onthe bilayer structure as the archaeal lipids associate throughhydrogen bonding between their headgroup moieties. Ascompared to PC-based lipid bilayers, the archaeal lipids headgroups are less hydrated than PC-based lipids.The in-plane dynamics of the archaeal lipids in the bilayers is
much slower than that of other PC-based lipids. The lateraldiffusion coefficient (D) of AI and AGI lipids is indeed lower thanthat of other PC-based lipids, even when comparing archaealbilayers at 90 °C and PC-based bilayers at 25 °C. The slowerdynamics is in part due the methyl-branches in the lipid tails,39
but, more importantly, due to the large sugar moieties of the lipidhead groups. Inositol and glucose indeed interact with each otherthrough hydrogen bonding. The orientation of the headgroupmoieties is quite similar at all temperatures studied with theexception of that of the AI molecule at 25 °C. The glucose in AGImolecules has a bimodal distribution (facing inward and outwardthe bilayer plane). The dynamics of the headgroup moietiesdescribed by reorientational correlation functions is faster atthe higher temperatures studied. Furthermore, this headgroupdynamics is faster for the AI head groups, as compared to AGI, asthe former are not only smaller, but lack the glucose groups thatform stable hydrogen bonds with neighboring lipids.The lateral pressure profile of archaeal lipid bilayers also shows
significant differences from that of PC-based lipid bilayers.In particular, the lateral pressure in the hydrophobic core is muchhigher, and the negative pressure due mainly to attractive forcesjust beneath the head groups is also much higher. The surfacetension of bilayers that corresponds to the integral of the pressureprofile along the bilayer is important for the function of membraneproteins and determines in general the elastic properties of lipidbilayers.43 The differences highlighted here, between simple PC-based lipids and archaeal lipids, relate directly to their interestingand unusual physical properties.
■ AUTHOR INFORMATION
Corresponding Authors*E-mail: [email protected].*Tel.: +386-14-768-456. E-mail: [email protected].
NotesThe authors declare no competing financial interest.
■ ACKNOWLEDGMENTS
This research was conducted within the scope of the EBAMEuropeanAssociated Laboratory. This workwas in part supported bythe Slovenian Research Agency (J2-3639, P1-0201, P2-0249, and P4-0121). This manuscript is a result of the networking efforts of COSTAction TD1104 (www.electroporation.net). Part of the calculationsof the paper was performed during the Short Term ScientificMissionGrant STSM [070113-021794] to A.P. Simulations were performedusing HPC resources from GENCI-CINES (Grant 2012−2013[076434]).
■ REFERENCES(1) Benvegnu, T.; Brard, M.; Plusquellec, D. Archaeabacteria BipolarLipid Analogues: Structure, Synthesis and Lyotropic Properties. Curr.Opin. Colloid Interface Sci. 2004, 8, 469−479.(2) Ulrih, N. P.; Gmajner, D.; Raspor, P. Structural andPhysicochemical Properties of Polar Lipids from Thermophilic Archaea.Appl. Microbiol. Biotechnol. 2009, 84, 249−260.(3) Ulrih, N. P.; Adamlje, U.; Nemec, M.; Sentjurc, M. Temperature-and pH-Induced Structural Changes in the Membrane of the
Table 3. Median Values of Angle (α) between VPino, Vino, and Vglu, and Normal to Archaeal Lipid Bilayers Composed of AI and AGIMolecules and Half Time Constant of Reorientation Autocorrelation Function (τ1/2) at 25, 70, and 90 °C
25 °C 70 °C 90 °C
vector molecule α [deg] τ1/2 [ns] α [deg] τ1/2 [ns] α [deg] τ1/2 [ns]
VPino AI 51.5 7.51 80.5 0.69 70.5 0.50VPino AGI 70.1 − 80.1 1.78 72.3 0.60Vino AI 50.4 5.54 72.1 0.75 69.5 0.19Vino AGI 64.2 − 70.5 1.94 66.5 0.69Vglu AGI 87.6 − 80.1 1.40 84.2 0.58
Langmuir Article
dx.doi.org/10.1021/la5014208 | Langmuir 2014, 30, 8308−83158314
Hyperthermophilic Archaeon Aeropyrum Pernix K1. J. Membr. Biol.2007, 219, 1−8.(4) Sako, Y.; Nomura, N.; Uchida, A.; Ishida, Y.; Morii, H.; Koga, Y.;Hoaki, T.; Maruyama, T. Aeropyrum Pernix Gen. Nov., Sp. Nov., aNovel Aerobic Hyperthermophilic Archaeon Growing at Temperaturesup to 100°C. Int. J. Syst. Bacteriol. 1996, 46, 1070−1077.(5) Morii, H.; Yagi, H.; Akutsu, H.; Nomura, N.; Sako, Y.; Koga, Y. ANovel Phosphoglycolipid Archaetidyl(glucosyl)inositol with TwoSesterterpanyl Chains from the Aerobic Hyperthermophilic ArchaeonAeropyrum Pernix K1. Biochim. Biophys. Acta, Mol. Cell Biol. Lipids 1999,1436, 426−436.(6) Gmajner, D.; Ota, A.; Sentjurc, M.; Ulrih, N. P. Stability of DietherC(25,25) Liposomes from the Hyperthermophilic Archaeon Aero-pyrum Pernix K1. Chem. Phys. Lipids 2011, 164, 236−245.(7) Napotnik, T. B.; Valant, J.; Gmajner, D.; Passamonti, S.; Miklavcic,D.; Ulrih, N. P. Cytotoxicity and Uptake of Archaeosomes Preparedfrom Aeropyrum Pernix Lipids. Hum. Exp. Toxicol. 2013.(8) Polak, A.; Tarek, M.; Tomsic, M.; Valant, J.; Ulrih, N. P.; Jamnik,A.; Kramar, P.; Miklavcic, D. Electroporation of Archaeal LipidMembranes Using MD Simulations. Bioelectrochemistry 2014.(9)Milek, I.; Cigic, B.; Skrt, M.; Kaletunc, G.; Ulrih, N. P. Optimizationof Growth for the Hyperthermophilic Archaeon Aeropyrum Pernix on aSmall-Batch Scale. Can. J. Microbiol. 2005, 51, 805−809.(10) Bligh, E. G.; Dyer, W. J. A Rapid Method of Total Lipid Extractinand Purification. Can. J. Biochem. Physiol. 1959, 37, 911−917.(11) Kratky, O.; Stabinger, H. X-Ray Small Angle Camera with Block-Collimation System an Instrument of Colloid Research. Colloid Polym.Sci. 1984, 262, 345−360.(12) Orthaber, D.; Bergmann, A.; Glatter, O. SAXS Experiments onAbsolute Scale with Kratky Systems Using Water as a SecondaryStandard. J. Appl. Crystallogr. 2000, 33, 218−225.(13) Weyerich, B.; Brunner-Popela, J.; Glatter, O. Small-AngleScattering of Interacting Particles. II. Generalized Indirect FourierTransformation under Consideration of the Effective Structure Factorfor Polydisperse Systems. J. Appl. Crystallogr. 1999, 32, 197−209.(14) Brunner-Popela, J.; Mittelbach, R.; Strey, R.; Schubert, K.-V.;Kaler, E. W.; Glatter, O. Small-Angle Scattering of Interacting Particles.III. D[sub 2]O-C[sub 12]E[sub 5] Mixtures and Microemulsions withN-Octane. J. Chem. Phys. 1999, 110, 10623.(15) Fritz, G.; Bergmann, A.; Glatter, O. Evaluation of Small-AngleScattering Data of Charged Particles Using the Generalized IndirectFourier Transformation Technique. J. Chem. Phys. 2000, 113, 9733.(16) Fruhwirth, T.; Fritz, G.; Freiberger, N.; Glatter, O. Structure andOrder in Lamellar Phases Determined by Small-Angle Scattering. J.Appl. Crystallogr. 2004, 37, 703−710.(17) Fritz, G.; Glatter, O. Structure and Interaction in Dense ColloidalSystems: Evaluation of Scattering Data by the Generalized IndirectFourier Transformation Method. J. Phys.: Condens. Matter 2006, 18,S2403−S2419.(18) Glatter, O. The Interpretation of Real-Space Information fromSmall-Angle Scattering Experiments. J. Appl. Crystallogr. 1979, 12, 166−175.(19) Glatter, O. A New Method for the Evaluation of Small-AngleScattering Data. J. Appl. Crystallogr. 1977, 10, 415−421.(20) Glatter, O. Evaluation of Small-Angle Scattering Data fromLamellar and Cylindrical Particles by the Indirect TransformationMethod. J. Appl. Crystallogr. 1980, 13, 577−584.(21) Iampietro, D. J.; Brasher, L. L.; Kaler, E. W.; Stradner, A.; Glatter,O. Direct Analysis of SANS and SAXS Measurements of CatanionicSurfactant Mixtures by Fourier Transformation. J. Phys. Chem. B 1998,102, 3105−3113.(22) Sato, T.; Sakai, H.; Sou, K.; Medebach, M.; Glatter, O.; Tsuchida,E. Static Structures and Dynamics of Hemoglobin Vesicle (HBV)Developed as a Transfusion Alternative. J. Phys. Chem. B 2009, 113,8418−8428.(23) Glatter, O. In Small Angle X-ray Scattering; Glatter, O., Kratky, O.,Eds.; Academic Press Inc. London Ltd.: London, 1983; p 119.
(24) Glatter, O. Convolution Square Root of Band-Limited Sym-metrical Functions and Its Application to Small-Angle Scattering Data. J.Appl. Crystallogr. 1981, 14, 101−108.(25) Glatter, O.; Hainisch, B. Improvements in Real-SpaceDeconvolution of Small-Angle Scattering Data. J. Appl. Crystallogr.1984, 17, 435−441.(26) Mittelbach, R.; Glatter, O. Direct Structure Analysis of Small-Angle Scattering Data from Polydisperse Colloidal Particles. J. Appl.Crystallogr. 1998, 31, 600−608.(27) Kale, L.; Skeel, R.; Bhandarkar, M.; Brunner, R.; Gursoy, A.;Krawetz, N.; Phillips, J.; Shinozaki, A.; Varadarajan, K.; Schulten, K.NAMD2: Greater Scalability for Parallel Molecular Dynamics. J.Comput. Phys. 1999, 151, 283−312.(28) Essmann, U.; Perera, L.; Berkowitz, M. L.; Darden, T.; Lee, H.;Pedersen, L. G. A Smooth Particle Mesh Ewald Method. J. Chem. Phys.1995, 103, 8577.(29) Darden, T.; York, D.; Pedersen, L. Particle Mesh Ewald: An Nlog(N) Method for Ewald Sums in Large Systems. J. Chem. Phys. 1993,98, 10089.(30) Shinoda, K.; Shinoda, W.; Baba, T.; Mikami, M. ComparativeMolecular Dynamics Study of Ether- and Ester-Linked PhospholipidBilayers. J. Chem. Phys. 2004, 121, 9648−9654.(31) Lindahl, E.; Edholm, O. Spatial and Energetic-EntropicDecomposition of Surface Tension in Lipid Bilayers from MolecularDynamics Simulations. J. Chem. Phys. 2000, 113, 3882.(32) Hess, B.; Kutzner, C.; van der Spoel, D.; Lindahl, E. GROMACS4: Algorithms for Highly Efficient, Load-Balanced, and ScalableMolecular Simulation. J. Chem. Theory Comput. 2008, 4, 435−447.(33) Sonne, J.; Hansen, F. Y.; Peters, G. H. Methodological Problemsin Pressure Profile Calculations for Lipid Bilayers. J. Chem. Phys. 2005,122, 124903.(34) Shinoda, K.; Shinoda, W.; Mikami, M. Molecular DynamicsSimulation of an Archaeal Lipid Bilayer with Sodium Chloride. Phys.Chem. Chem. Phys. 2007, 9, 643−650.(35) Knecht, V.; Klasczyk, B. Specific Binding of Chloride Ions to LipidVesicles and Implications atMolecular Scale. Biophys. J. 2013, 104, 818−824.(36) Pfeiffer, W.; Henkel, T.; Sackmann, E.; Knoll, W.; Richter, D.Local Dynamics of Lipid Bilayers Studied by Incoherent Quasi-ElasticNeutron Scattering. Europhys. Lett. 1989, 8, 201−206.(37) Essmann, U.; Berkowitz, M. L. Dynamical Properties ofPhospholipid Bilayers from Computer Simulation. Biophys. J. 1999,76, 2081−2089.(38) Hofsaß, C.; Lindahl, E.; Edholm, O. Molecular DynamicsSimulations of Phospholipid Bilayers with Cholesterol. Biophys. J. 2003,84, 2192−2206.(39) Shinoda, W.; Shinoda, K.; Baba, T.; Mikami, M. MolecularDynamics Study of Bipolar Tetraether Lipid Membranes. Biophys. J.2005, 89, 3195−3202.(40) Polak, A.; Bonhenry, D.; Dehez, F.; Kramar, P.; Miklavcic, D.;Tarek, M. On the Electroporation Thresholds of Lipid Bilayers:Molecular Dynamics Simulation Investigations. J. Membr. Biol. 2013,246, 843−850.(41) Niemela, P.; Hyvonen, M. T.; Vattulainen, I. Structure andDynamics of Sphingomyelin Bilayer: Insight Gained through SystematicComparison to Phosphatidylcholine. Biophys. J. 2004, 87, 2976−2989.(42) Andersson, M.; Jackman, J.; Wilson, D.; Jarvoll, P.; Alfredsson, V.;Okeyo, G.; Duran, R. Vesicle and Bilayer Formation of Diphytanoyl-phosphatidylcholine (DPhPC) and Diphytanoylphosphatidylethanol-amine (DPhPE) Mixtures and Their Bilayers’ Electrical Stability.Colloids Surf., B: Biointerfaces 2011, 82, 550−561.(43) Ollila, S. Lateral Pressure in Lipid Membranes and Its Role inFunction of Membrane Proteins. Ph.D. Thesis, Tampere University ofTechnology, 2010; p 70.
Langmuir Article
dx.doi.org/10.1021/la5014208 | Langmuir 2014, 30, 8308−83158315