Structural and molecular heterogeneity of calretinin...
22
RESEARCH ARTICLE Structural and molecular heterogeneity of calretinin-expressing interneurons in the rodent and primate striatum Farid N. Garas 1 | Eszter Kormann 1 | Rahul S. Shah 1 | Federica Vinciati 1 | Yoland Smith 2 | Peter J. Magill 1 | Andrew Sharott 1 1 Medical Research Council Brain Network Dynamics Unit, Department of Pharmacology, University of Oxford, Oxford, United Kingdom 2 Yerkes National Primate Research Center, Department of Neurology and Udall Center of Excellence for Parkinson’s Disease Research, Emory University, Atlanta, Georgia Correspondence Andrew Sharott and Peter J. Magill, MRC Brain Network Dynamics Unit, University of Oxford, Oxford, OX1 3TH, United Kingdom. Emails: andrew.sharott@pharm. ox.ac.uk; [email protected] Funding information Medical Research Council UK (MRC), Grant/Award Numbers: MC_UU_12020/5, MC_UU_12024/2, MC_UU_12024/1; Marie Curie European Re-integration Grant; Uni- versity of Oxford Clarendon Fund Scholar- ships and the MRC; Wellcome Trust Clinical Fellowship, Grant/Award Number: WT_RS_109030/Z/15/Z; MRC studentship; Yerkes National Primate Centre, Grant/ Award Number: P51OD011132. Abstract Calretinin-expressing (CR1) interneurons are the most common type of striatal interneuron in pri- mates. However, because CR1 interneurons are relatively scarce in rodent striatum, little is known about their molecular and other properties, and they are typically excluded from models of striatal circuitry. Moreover, CR1 interneurons are often treated in models as a single homogenous popula- tion, despite previous descriptions of their heterogeneous structures and spatial distributions in rodents and primates. Here, we demonstrate that, in rodents, the combinatorial expression of sec- retagogin (Scgn), specificity protein 8 (SP8) and/or LIM homeobox protein 7 (Lhx7) separates striatal CR1 interneurons into three structurally and topographically distinct cell populations. The CR1/Scgn1/SP81/Lhx72 interneurons are small-sized (typically 7–11 mm in somatic diameter), possess tortuous, partially spiny dendrites, and are rostrally biased in their positioning within stria- tum. The CR1/Scgn2/SP82/Lhx72 interneurons are medium-sized (typically 12–15 mm), have bipolar dendrites, and are homogenously distributed throughout striatum. The CR1/Scgn2/ SP82/Lhx71 interneurons are relatively large-sized (typically 12–20 mm), and have thick, infre- quently branching dendrites. Furthermore, we provide the first in vivo electrophysiological recordings of identified CR1 interneurons, all of which were the CR1/Scgn2/SP82/Lhx72 cell type. In the primate striatum, Scgn co-expression also identified a topographically distinct CR1 interneuron population with a rostral bias similar to that seen in both rats and mice. Taken together, these results suggest that striatal CR1 interneurons comprise at least three molecularly, structurally, and topographically distinct cell populations in rodents. These properties are partially conserved in primates, in which the relative abundance of CR1 interneurons suggests that they play a critical role in striatal microcircuits. KEYWORDS calretinin, interneuron, neuronal diversity, RRID: AB_10000342, RRID: AB_94259, RRID: AB_2228331, RRID: AB_2269934, RRID: AB_10864618, RRID: AB_2194626, RRID: AB_2064130, secretagogin, striatum 1 | INTRODUCTION The striatum is the major site of extrinsic inputs to the basal ganglia and mostly consists of GABAergic spiny projection neurons (SPNs) that target other basal ganglia nuclei. The output of SPNs is thought to be sculpted by an array of different types of striatal interneurons. GABAergic interneurons expressing the calcium-binding protein (CBP) calretinin (CR) are the most abundant class of interneuron in the pri- mate striatum (Cicchetti, Prensa, Wu, & Parent, 2000; Wu & Parent, 2000), and recent evidence suggests that newborn calretinin- expressing (CR1) neurons continue to be added to the adult striatum (Ernst et al., 2014; Wei et al., 2011). Despite this, CR1 interneurons ....................................................................................................................................................................................... This is an open access article under the terms of the Creative Commons Attribution License, which permits use, distribution and reproduction in any medium, pro- vided the original work is properly cited. V C 2017 The Authors The Journal of Comparative Neurology Published by Wiley Periodicals, Inc. J Comp Neurol. 2018;526:877–898. wileyonlinelibrary.com/journal/cne | 877 Received: 14 August 2017 | Revised: 27 November 2017 | Accepted: 28 November 2017 DOI: 10.1002/cne.24373 The Journal of Comparative Neurology
Transcript of Structural and molecular heterogeneity of calretinin...
R E S E A R CH AR T I C L E
Structural and molecular heterogeneity of calretinin-expressinginterneurons in the rodent and primate striatum
Farid N. Garas1 | Eszter Kormann1 | Rahul S. Shah1 | Federica Vinciati1 |
Yoland Smith2 | Peter J. Magill1 | Andrew Sharott1
1Medical Research Council Brain Network
Dynamics Unit, Department of
Pharmacology, University of Oxford, Oxford,
United Kingdom
2Yerkes National Primate Research Center,
Department of Neurology and Udall Center
of Excellence for Parkinson’s Disease
Research, Emory University, Atlanta, Georgia
Correspondence
Andrew Sharott and Peter J. Magill, MRC
Brain Network Dynamics Unit, University
of Oxford, Oxford, OX1 3TH, United
Kingdom. Emails: andrew.sharott@pharm.
ox.ac.uk; [email protected]
Funding information
Medical Research Council UK (MRC),
Grant/Award Numbers: MC_UU_12020/5,
MC_UU_12024/2, MC_UU_12024/1; Marie
Curie European Re-integration Grant; Uni-
versity of Oxford Clarendon Fund Scholar-
ships and the MRC; Wellcome Trust
Clinical Fellowship, Grant/Award Number:
WT_RS_109030/Z/15/Z; MRC studentship;
Yerkes National Primate Centre, Grant/
Award Number: P51OD011132.
AbstractCalretinin-expressing (CR1) interneurons are the most common type of striatal interneuron in pri-
mates. However, because CR1 interneurons are relatively scarce in rodent striatum, little is known
about their molecular and other properties, and they are typically excluded from models of striatal
circuitry. Moreover, CR1 interneurons are often treated in models as a single homogenous popula-
tion, despite previous descriptions of their heterogeneous structures and spatial distributions in
rodents and primates. Here, we demonstrate that, in rodents, the combinatorial expression of sec-
retagogin (Scgn), specificity protein 8 (SP8) and/or LIM homeobox protein 7 (Lhx7) separates
striatal CR1 interneurons into three structurally and topographically distinct cell populations. The
CR1/Scgn1/SP81/Lhx72 interneurons are small-sized (typically 7–11 mm in somatic diameter),
possess tortuous, partially spiny dendrites, and are rostrally biased in their positioning within stria-
tum. The CR1/Scgn2/SP82/Lhx72 interneurons are medium-sized (typically 12–15 mm), have
bipolar dendrites, and are homogenously distributed throughout striatum. The CR1/Scgn2/
SP82/Lhx71 interneurons are relatively large-sized (typically 12–20 mm), and have thick, infre-
quently branching dendrites. Furthermore, we provide the first in vivo electrophysiological
recordings of identified CR1 interneurons, all of which were the CR1/Scgn2/SP82/Lhx72 cell
type. In the primate striatum, Scgn co-expression also identified a topographically distinct CR1
interneuron population with a rostral bias similar to that seen in both rats and mice. Taken
together, these results suggest that striatal CR1 interneurons comprise at least three molecularly,
structurally, and topographically distinct cell populations in rodents. These properties are partially
conserved in primates, in which the relative abundance of CR1 interneurons suggests that they
play a critical role in striatal microcircuits.
K E YWORD S
calretinin, interneuron, neuronal diversity, RRID: AB_10000342, RRID: AB_94259, RRID:
AB_2228331, RRID: AB_2269934, RRID: AB_10864618, RRID: AB_2194626, RRID: AB_2064130,
secretagogin, striatum
1 | INTRODUCTION
The striatum is the major site of extrinsic inputs to the basal ganglia
and mostly consists of GABAergic spiny projection neurons (SPNs) that
target other basal ganglia nuclei. The output of SPNs is thought to be
sculpted by an array of different types of striatal interneurons.
GABAergic interneurons expressing the calcium-binding protein (CBP)
calretinin (CR) are the most abundant class of interneuron in the pri-
mate striatum (Cicchetti, Prensa, Wu, & Parent, 2000; Wu & Parent,
2000), and recent evidence suggests that newborn calretinin-
expressing (CR1) neurons continue to be added to the adult striatum
(Ernst et al., 2014; Wei et al., 2011). Despite this, CR1 interneurons.......................................................................................................................................................................................This is an open access article under the terms of the Creative Commons Attribution License, which permits use, distribution and reproduction in any medium, pro-
vided the original work is properly cited.VC 2017 The Authors The Journal of Comparative Neurology Published by Wiley Periodicals, Inc.
J Comp Neurol. 2018;526:877–898. wileyonlinelibrary.com/journal/cne | 877
Received: 14 August 2017 | Revised: 27 November 2017 | Accepted: 28 November 2017
DOI: 10.1002/cne.24373
The Journal ofComparative Neurology
remain the least well understood of the four “classical” striatal inter-
neuron types, and their in vivo firing properties have never been char-
acterized (Silberberg & Bolam, 2015; Tepper, Tecuapetla, Koos, &
Ibanez-Sandoval, 2010). CR1 interneurons in the neocortex (Miettinen,
Gulyas, Baimbridge, Jacobowitz, & Freund, 1992) are comprised of mul-
tiple cell types with distinct structural, molecular and physiological fea-
tures (Ascoli et al., 2008; Klausberger & Somogyi, 2008), and several
lines of evidence suggest that this may also be the case in striatum.
In both mice and rats, striatal CR1 interneurons can be separated
into at least two groups based on cell body size (Petryszyn, Beaulieu,
Parent, & Parent, 2014; Rymar, Sasseville, Luk, & Sadikot, 2004). In the
mouse, small-sized CR1 interneurons are more common in the rostral
and dorsal parts of striatum (Petryszyn et al., 2014). Many CR1 inter-
neurons in these areas of rodent striatum express the transcription fac-
tor SP8 (Wei et al., 2011) or the CBP secretagogin (Kosaka, Yasuda, &
Kosaka, 2017), but whether the expression of these molecules corre-
lates with soma size in these areas has not been investigated. In the
monkey striatum, three populations of CR1 interneurons have also
been described based on their structural properties (Parent, Fortin,
Cote, & Cicchetti, 1996; Petryszyn et al., 2014). In order of decreasing
prevalence, there is a group comprised of “medium-sized” (10–20 lm in
somatic diameter) CR1 cells (Wu & Parent, 2000), a group of “small-
sized” (10–12 lm) cells, and a group of “large-sized” (25–40 lm) cells.
Although there is no evidence of molecular divergence of small- and
medium-sized interneurons in primates, the large-sized CR1 interneur-
ons often co-express choline acetyltransferase (ChAT) (Cicchetti, Beach,
& Parent, 1998; Petryszyn et al., 2014). This represents an important
difference between the primate and rodent striatum, as neither mice
nor rats have interneurons co-expressing ChAT and CR (Figueredo-Car-
denas, Medina, & Reiner, 1996; Petryszyn et al., 2014). Without this
molecular correlate of large CR1 interneurons, it is unclear whether the
rodent striatum has two (Petryszyn, Parent, & Parent, 2017) or three
(Tepper et al., 2010) classes of CR1 interneuron.
In both rodents and primates, a more detailed quantification of the
molecular identity of CR1 neurons with different structural properties
is needed to better differentiate subtypes of CR1 interneuron. Such a
characterization could also provide greater understanding of the role of
these interneurons in patients with Huntington’s disease and Tourette
syndrome, where there is a preferential loss of large-sized striatal CR1
interneurons and relative sparing of the medium-sized cells (Cicchetti
et al., 2000; Kataoka et al., 2010). Using a combination of immunohis-
tochemistry and stereological cell counting, we demonstrate that the
selective expression of Scgn, as well as the transcription factors SP8
and Lhx7, within the CR1 interneuron population can be used to iden-
tify three cell “types” that can be distinguished from one another on
the basis of their structural properties and distribution within the dorsal
striatum of the rat and mouse. We also demonstrate that one of these
markers, Scgn, also identifies a subpopulation of CR-expressing inter-
neurons that is unevenly distributed throughout the caudate-putamen
in primates. Together these results provide further evidence of func-
tionally distinct subpopulations of CR1 interneurons in the rodent and
primate striatum.
2 | MATERIALS AND METHODS
2.1 | Preparation of rat and mouse brain tissue for
immunofluorescence and cell counting
The experimental procedures described below were carried out using
14 adult (3 months old, 280–350 g) male Sprague Dawley rats (Charles
River) and 6 adult, 3-month-old C57Bl/6J male mice (Charles River) in
accordance with the Animals (Scientific Procedures) Act, 1986 (UK).
After being deeply anaesthetized using isoflurane (4% v/v in oxygen),
each rat was given a lethal dose of pentobarbitone (1.3 g/kg; i.p.) fol-
lowed by transcardial perfusion with approximately 50 mL of 0.05 M
phosphate-buffered saline, pH 7.4 (PBS), followed by 300 mL of fixa-
tive (4% w/v paraformaldehyde with 0.1% w/v glutaraldehyde in 0.1 M
phosphate buffer, pH7.4 (PB)). This was followed by a third perfusion
of approximately 200 mL of fixative (4% w/v paraformaldehyde in PB).
Mice were deeply anesthetized with pentobarbitone and perfused
transcardially using 20 mL of PBS, followed by 20 mL of fixative (4%
w/v paraformaldehyde in 0.1 M PB). For both species, once the brain
was removed, the tissue was post-fixed in this solution for 24 hr at
48C. Using a vibrating microtome (Leica VT1000S), 50-mm-thick coronal
sections containing the striatum were cut and collected for immunoflu-
orescence processing. For some images, 50-mm-thick parasagittal sec-
tions were used to visualize the medial striatum.
2.2 | Indirect immunofluorescence
Sections were washed with PBS and pre-incubated for 2 hr in a solu-
tion consisting of 10% v/v NDS (normal donkey serum) and 0.3% v/v
Triton X-100 in PBS. After further washing using PBS, sections were
incubated overnight at room temperature in a solution of 0.3% v/v Tri-
ton X-100 in PBS containing primary antibodies (RRID: AB_10000342,
RRID: AB_94259, RRID: AB_2228331, RRID: AB_2269934, RRID:
AB_10864618, RRID: AB_2194626, RRID: AB_2064130; see Table 1
for details about the sources and dilutions of antibodies used). After
exposure to primary antibodies, sections were washed in PBS and incu-
bated overnight at room temperature in Triton-PBS which contained a
mixture of secondary antibodies (all raised in donkey) which were con-
jugated to the following fluorophores: DyLight 649 (1:500; Jackson
ImmunoResearch Laboratories); Cy3 (1:1,000; Jackson ImmunoRe-
search Laboratories); AlexaFluor-488 (1:500; Invitrogen); or AMCA
(1:250 dilution; Jackson ImmunoResearch Laboratories). To ensure min-
imal cross-reactivity, these antibodies were cross adsorbed by the man-
ufacturers. After further washing in PBS, sections were mounted on
glass slides (VWR Super Premium Microscope slides) using fluores-
cence mounting medium (Vectashield; Vector Laboratories), followed
by the addition of a coverslip.
2.3 | Sampling and cell-counting strategies
Using a series of partly overlapping, complementary immunofluores-
cence protocols, striatal neurons were tested for their combinatorial
expression of the molecular markers in Table 1. A version of design-
based stereology, the “modified optical fractionator” (Abdi et al., 2015;
878 | The Journal ofComparative Neurology
GARAS ET AL.
West, 1999), was used to generate unbiased cell counts, determine the
relative expression of molecular markers, and map distributions of stria-
tal interneurons. In all procedures performed, the accuracy of these
estimates was ensured by taking absolute counts of all neurons
expressing a given molecular marker, thereby allowing for a nearly pre-
cise definition of their distribution within the striatum.
For analyses of rat striatum, the expression of specific molecular
markers was quantified using 13 coronal striatal planes that traversed
almost the entire extent of the dorsal striatum (coordinates along the
rostral–caudal axis: 2.3, 1.8, 1.2, 0.6, 20.1, 20.5, 20.9, 21.3, 21.8,
22.2, 22.6, 23.0, and 23.3 mm from Bregma). For analyses of mouse
dorsal striatum, 9 coronal planes were used (coordinates: 1.7, 1.3, 0.9,
0.5, 0.2, 20.1, 20.5, 21.0, and 21.5 mm from Bregma). Sections from
different animals of the same species were matched to similar stereo-
taxic planes along the rostral-caudal axis (650 mm) using the appropri-
ate atlas (Franklin & Paxinos, 2008; Paxinos & Watson, 2007).
Once the chosen striatal coronal planes were identified and incu-
bated in primary and secondary antibodies, an epifluorescence micro-
scope (Carl Zeiss, AxioImager.M2) running Axiovision software (Carl
Zeiss) and equipped with a 20X (Numerical Aperture51.8) objective
and StereoInvestigator 9.0 software (MBF Biosciences) was used to
delineate the dorsal striatum. In order to image each fluorescence
channel, the following sets of filter cubes were used: AMCA (excitation
299–392 nm, beamsplitter 395 nm, emission 420–470 nm);
AlexaFluor-488 (excitation 450–490 nm, beamsplitter 495 nm, emis-
sion 500–550 nm); Cy3 (excitation 532–558 nm, beamsplitter 570 nm,
emission 570–640 nm); and DyLight 649 (excitation 625–655 nm,
beamsplitter 660 nm, emission 665–715 nm). The borders of the dorsal
and ventral striatum were determined using the boundaries defined in
standard stereotaxic atlases for rat (Paxinos & Watson, 2007) and
mouse (Franklin & Paxinos, 2008).
Once boundaries were delineated for a given section that had
undergone a given immunofluorescence protocol, the selected area was
subsequently captured by imaging a series of completely tessellated, z-
stacked images (with an optical step size of 1 mm) at depths 2–12 lm
from the upper surface of each section at the level of the striatum. This
was done using the 203 1.8 NA objective lens of an epifluorescence
microscope (as above). The thickness of the section was measured at
each counting site and then averaged to obtain a correction factor for
tissue shrinkage. The average section thickness was found to be 47.86
0.73 mm in rats meaning that the calculated shrinkage factor was
�4.4%. In mice, the average section thickness was found to be 46.56
0.66 mm, resulting in a calculated shrinkage factor of �7.0%. To mini-
mize confounds arising from surface irregularities, neuropil within a 2
lm “guard zone” at the upper surface was not imaged. By sampling sec-
tions in this manner, a 10 mm-thick “optical disector” was generated
which had abutting, unbiased 2D counting frames (3203 420 mm) con-
sisting of two perpendicular exclusion lines and two inclusion lines. This
was used to generate all stereological cell counts and molecular expres-
sion profiles presented in this study (Garas et al., 2016; Glaser, Greene,
& Hendricks, 2007; West, 1999, 2012), and allowed for the generation
of robust and unbiased stereological cell counts.
Captured images were analyzed and labeled neurons were counted
using StereoInvestigator 9.0 software (MBF Biosciences). A labeled
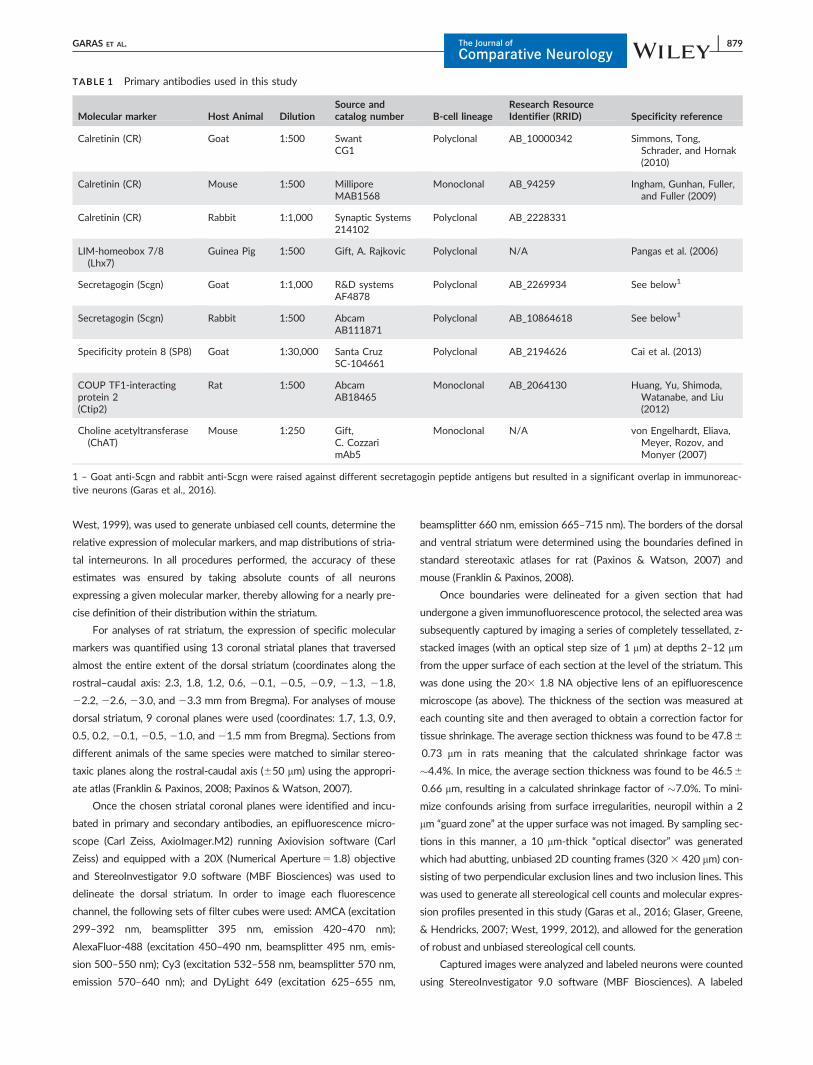
TABLE 1 Primary antibodies used in this study
Molecular marker Host Animal DilutionSource andcatalog number B-cell lineage
Research ResourceIdentifier (RRID) Specificity reference
Calretinin (CR) Goat 1:500 SwantCG1
Polyclonal AB_10000342 Simmons, Tong,Schrader, and Hornak(2010)
Calretinin (CR) Mouse 1:500 MilliporeMAB1568
Monoclonal AB_94259 Ingham, Gunhan, Fuller,and Fuller (2009)
Calretinin (CR) Rabbit 1:1,000 Synaptic Systems214102
Polyclonal AB_2228331
LIM-homeobox 7/8(Lhx7)
Guinea Pig 1:500 Gift, A. Rajkovic Polyclonal N/A Pangas et al. (2006)
Secretagogin (Scgn) Goat 1:1,000 R&D systemsAF4878
Polyclonal AB_2269934 See below1
Secretagogin (Scgn) Rabbit 1:500 AbcamAB111871
Polyclonal AB_10864618 See below1
Specificity protein 8 (SP8) Goat 1:30,000 Santa CruzSC-104661
Polyclonal AB_2194626 Cai et al. (2013)
COUP TF1-interactingprotein 2(Ctip2)
Rat 1:500 AbcamAB18465
Monoclonal AB_2064130 Huang, Yu, Shimoda,Watanabe, and Liu(2012)
Choline acetyltransferase(ChAT)
Mouse 1:250 Gift,C. CozzarimAb5
Monoclonal N/A von Engelhardt, Eliava,Meyer, Rozov, andMonyer (2007)
1 – Goat anti-Scgn and rabbit anti-Scgn were raised against different secretagogin peptide antigens but resulted in a significant overlap in immunoreac-tive neurons (Garas et al., 2016).
GARAS ET AL. The Journal ofComparative Neurology
| 879
neuron was counted if the top of its nucleus came into focus within
the optical disector. If the nucleus was already in focus at the top of
the optical disector, the neuron was excluded (West, 1999). As strongly
fluorescent cytoplasmic/nuclear markers can obscure nuclear bounda-
ries, delineation of these nuclei was achieved when necessary by incu-
bating the tissue for 10 min in a solution (1:100,000) of the DNA dye
40,6-diamidino-2-phenylindole (DAPI). DAPI was used solely to define
whether or not the nucleus of a given cell was within the optical disec-
tor and thus, DAPI signals were not included in any stereological counts
nor used to define somatic diameters. For a given molecular marker, X,
positive immunoreactivity (confirmed expression) was denoted as X1,
whereas undetectable immunoreactivity (no expression) was denoted
as X2. In all fluorescence analysis, a neuron was classified as not
expressing the tested marker only when positive immunoreactivity
could be observed in other cells on the same optical section as the
tested neuron. Each immunofluorescence protocol described in this
study was repeated in a minimum of three adult rats/mice. The data
obtained from each count was subsequently exported from StereoIn-
vestigator (MBF Biosciences) into Excel (Microsoft) or MATLAB (Math-
works), where they were pooled for further analysis.
2.4 | Calculations of section area, volume and
estimates of total cell number
Once the number of neurons expressing a marker or markers had been
counted and recorded for a given coronal plane, the volume of the striatum
in which these neurons had been counted was calculated using StereoIn-
vestigator 9.0 software (MBF Biosciences). The software uses a method
that is derivative of the point counting method (Oorschot, 1996). The vol-
ume of tissue within the optical disector was calculated by multiplying the
cross-sectional area by 10 mm. The density of labeled neurons was then
computed by dividing the total number of counted neurons by the volume
of the optical disector. By assuming that the density of immunoreactive
neurons is constant within the 50-mm-thick tissue section (corrected for tis-
sue shrinkage in mice and rats), then the calculated value for absolute den-
sity applies to the entire section. This absolute density value was calculated
for every coronal plane studied for all counted neurons, and the values
were plotted to demonstrate changes in density along the rostro-caudal
axis of the dorsal striatum. A calculation for an estimate of the mean den-
sity of counted neurons within the striatum was performed by computing
the mean of all densities for each coronal plane that was studied.
In order to calculate an estimate for the total number of a given
type of neuron in the striatum, the following equation (Oorschot, 1996)
was used:
N5Nv � V refð Þ;
where N is the estimate for the total number of neurons in the struc-
ture, Nv is the numerical or volume density, and V(ref) is the volume of
that structure.
The volume of the dorsal striatum in rats and mice was calculated
using the Cavalieri direct volume estimate (Gundersen & Jensen, 1987),
which involves multiplying the sum of the cross-sectional area of every
nth serial section multiplied by the fixed distance between each of the
sampled sections. The volume of the striatum in both rats and mice
was calculated using 13 and 9 equally spaced 50-mm-thick coronal sec-
tions, respectively (Gundersen & Jensen, 1987; Rymar et al., 2004). The
point counting method option of the StereoInvestigator 9.0 software
was used to obtain an estimate of each of the section’s cross-sectional
area. Briefly, this involved overlaying a grid of equally spaced points
over each delineation of the structure, and then counting the number
of points that lie within the contour of the structure (West, 1999). The
spacing of the points is often set such that approximately 150 points
lie within the entire of set of contours for a given structure. This allows
for an accurate measurement of each section’s area.
Once complete, the volume of the structure, V(ref), was calculated
according to the following (Oorschot, 1996; West, 1999):
V refð Þ5X
P � a pð Þ � t
where P is the number of points counted within a delineated contour, a
(p) is the area represented by each point, and t is the fixed distance
between each section. When calculated in this manner across the stria-
tum of six rats, the mean volume of the dorsal striatum was determined
to be 24.262.1 mm3, a value that resembles previous estimates
(Oorschot, 1996; Rymar et al., 2004). The mean volume of the mouse
striatum (n56 mice) was determined to be 9.460.5 mm3. Once the
value of V(ref) is determined, multiplying that volume by the mean neu-
ronal density yields an estimate for the total number of neurons for
that animal. Because most neuronal counts were performed across
three animals (a sample that is typical of stereological studies), in depth
statistics were deemed inappropriate, and so the value calculated from
each animal is plotted along with the mean.
In order to estimate the precision of this estimate for the volume of
striatum, the coefficient of error (CE) was calculated using the Stereo
investigator software. In all such studies, a CE (m51) less than 0.1 is
the agreed upon value which indicates that the level of variation in stria-
tal volume calculation between different animals is a product of biologi-
cal, rather than methodological variation (Gundersen, Jensen, Kieu, &
Nielsen, 1999). In this study, the coefficient of error was kept below the
value of 0.1 for each animal by first ensuring that each section’s cross
sectional area was calculated using approximately 150 points as per the
point counting method. Secondly, because each volume estimate was
performed using 13 striatal sections in the rat and 9 striatal sections in
the mouse, this ensured that the striatum cross-sectional area was
sampled at approximately every 9th section in the rat and every 7th
section in the mouse. This degree of sampling has previously been
shown to ensure a CE of less than 0.1 when estimating the volume of
complex structures (Schmitz & Hof, 2005; Slomianka & West, 2005).
2.5 | Topographical and statistical analysis of
interneuron distribution
The positions of individual interneurons and the volume of striatum cal-
culated by StereoInvestigator for each section were imported into
MATLAB (Mathworks, version: R2014b). Using previously described
analyses (Garas et al., 2016), we then performed quantitative analyses
of the spatial distribution of each cell type. Briefly, for all counted
880 | The Journal ofComparative Neurology
GARAS ET AL.
neurons in the dorsal striatum, horizontal, and vertical lines were first
placed from the position of each interneuron within a given coronal
plane. Each interneuron was then assigned a value of between 21 and
1 according to its relative distance from the medio-lateral and dorso-
ventral borders of striatum at that same coronal plane. Notably, these
two distance values were calculated according to the first points along
the striatal contours that were contacted by the horizontal and vertical
lines drawn from each neurons position. In this manner, the definition
of “medial” and “lateral” striatum was shifted depending on the position
of the interneuron in the dorso-ventral axis and vice versa. This method
of normalization therefore accommodates the irregular, ever changing
shape of the dorsal striatum when viewed over multiple coronal planes.
As each counted interneuron in a section was given a value for
each axis, and at least 3–6 animals were used for each protocol, this
sample size was deemed large enough to use the Wilcoxon signed-rank
test in order to determine if the mean relative value of a neural popula-
tion in a given coronal plane differed significantly from 0, a value indi-
cating an unbiased distribution along a given axis. For coronal planes in
which 5 or fewer neurons of a given class were counted within the
confines of the optical disector, the sample size was deemed too small
for the generation of reproducible statistics. The minimum significance
level for these statistical tests was taken to be p� .05, and is denoted
in plots by the presence of an asterisk (*). Mann-Whitney U tests where
used to compare the mean positional values of two different inter-
neuron populations along the medio-lateral or dorso-ventral axis within
a given coronal plane. The minimum significance level for these statisti-
cal tests was taken to be p� .05, and is denoted by the presence of a
box (w). Multiple comparisons across sections were corrected using
the false discovery rate (FDR) method (Noble, 2009).
2.6 | Measurements of mean somatic diameters of
interneurons
Immunofluorescent detection of markers that labeled the entirety of the
somata of certain classes of CR1 interneurons was used in order to
measure the somatic diameters of individual neurons in the dorsal stria-
tum of the rat, mouse and primate. A neuron was only measured if the
contours of its entire soma in all three dimensions were contained
within the 50-mm-thick section of tissue. As previously described
(Rymar et al., 2004), this was done in order to ensure that the longest
axis of a chosen neuron’s soma was imaged. The somatic diameter of a
labeled neuron was defined as the length of its longest axis, and was
measured using StereoInvestigator software. For a given class of inter-
neurons, the mean of all somatic diameters measured in this manner
was calculated. Statistical comparisons of multiple mean somatic diame-
ters (of multiple classes of interneuron) were performed using a Kruskal-
Wallis ANOVA followed by post hoc Dunn tests (where appropriate).
2.7 | Imaging of immunolabeled CR-expressing
neurons
As shown previously, the (partial) somatodendritic features of some
CR1 neurons can be visualized simply using immunohistochemistry
(Bennett & Bolam, 1993; Petryszyn et al., 2017; Tepper et al., 2010).
As such, the 403 lens (NA: 0.8) of a laser scanning confocal microscope
(Zeiss LSM 710) was used to image well-labeled CR-expressing inter-
neurons at multiple optical planes in order to form a z-stack to highlight
their somatodendritic structure. Single-plane images highlighting the
somata of these neurons were also taken in order to determine
whether these neurons co-expressed combinations of secretagogin,
SP8, and Lhx7. In order to illustrate the rostral bias of those CR1 inter-
neurons that co-expressed SP8, parasagittal sections containing the
medial striatum, the lateral ventricle and the subventricular zone were
co-labeled for CR and SP8. Imaging of these sections was performed
using the 53 (NA: 0.16) lens of a laser scanning confocal microscope
(Zeiss LSM 710) in which the shutter was left completely open (Naka-
mura, Sharott, & Magill, 2014).
2.8 | In vivo electrophysiological recording and
juxtacellular labeling of individual interneurons
Juxtacellular recording and labeling of neurons was performed in four
anesthetized male Sprague Dawley rats (280–350 g) in accordance
with the Animals (Scientific Procedures) Act 1986 (UK). As described
previously (Garas et al., 2016; Sharott, Doig, Mallet, & Magill, 2012),
induction of general anesthesia was achieved using 4% v/v isoflurane
in O2, and maintained with urethane (1.3 g/kg, i.p; ethyl carbamate;
Sigma) followed by supplemental doses of ketamine (30 mg/kg, i.p.;
Willows Francis) and xylazine (3 mg/kg i.p.; Bayer). Local anesthetic
was used to infiltrate the wound margins (0.5% w/v bupivacaine;
Astra). A stereotaxic frame (Kopf) was used to fix the animal in place,
and a homeothermic heating device (Harvard Apparatus) was used to
maintain the animal’s core body temperature at 3760.58C. Recording
of the electrocorticogram (ECoG) was performed directly above the
frontal (somatic sensory-motor) cortex (4.0 mm rostral and 2.0 mm lat-
eral of Bregma) (Paxinos & Watson, 2007), with the reference screw
being placed above the ipsilateral cerebellum (Abdi et al., 2015; Sharott
et al., 2012). The raw ECoG signal then underwent bandpass filtering
(0.3–1,500 Hz, 23 dB limits) and amplification (20003; DPA-2FS fil-
ter/amplifier; NPI Electronic Instruments) prior to its acquisition. Using
a computer-controlled stepper motor (IVM-1000; Scientifica),
standard-wall borosilicate glass electrodes (10–30 MX in situ with a tip
diameter of approximately 1.5 lm) filled with a 0.5 M solution of NaCl
containing neurobiotin (1.5% w/v; Vector Laboratories) were lowered
into the dorsal striatum (under stereotaxic guidance). The depth of the
electrode was recorded by the computer at a resolution of 0.1 lm.
Action potentials of individual striatal neurons (i.e., single-unit activity)
were subsequently recorded after being amplified (103) (Axoprobe-1A
amplifier; Molecular Devices), AC-coupled, amplified a further 1003,
and bandpass filtered at 300–5,000 Hz (DPA-2FS filter/amplifier). Both
the ECoG and single-unit activity were recorded at a sampling rate of
16.6 kHz using a Power1401 Analog-Digital converter and a PC run-
ning Spike2 acquisition and analysis software (Version 7.2; Cambridge
Electronic Design). As described previously, brain state was defined
based on the oscillatory content of the ECoG and categorized as either
slow-wave activity (SWA) or cortical activation (Garas et al., 2016;
GARAS ET AL. The Journal ofComparative Neurology
| 881
Magill, Bolam, & Bevan, 2000; Magill, Sharott, Bolam, & Brown, 2004;
Sharott et al., 2012)
Once a neuron was recorded, it was juxtacellularly labeled with
neurobiotin (Garas et al., 2016; Sharott et al., 2012). Such labeling was
achieved by sending positive current pulses (2–10 nA, 200 ms, 50%
duty cycle) through the electrode until the recorded single-unit activity
was “entrained” by the injection of current. Approximately 2–6 hr after
labeling, animals were given a lethal dose of ketamine (150 mg/kg) fol-
lowed by a transcardial perfusion with PBS, followed by fixative, as
described above.
2.9 | Tissue processing for identification of recorded
and juxtacellularly labeled interneurons
Using a vibrating microtome (VT1000S; Leica Microsystems), 50-lm-
thick coronal sections were serially collected and subsequently washed
in PBS for 10 min. Sections were then incubated for a minimum of 4 hr
in a solution of Triton PBS and Cy3-conjugated streptavidin (1:1,000;
Life Technologies). Sections were analyzed for Cy3 signal, and those
containing neurobiotin-labeled cells were isolated for further molecular
characterization by indirect immunofluorescence (Garas et al., 2016;
Sharott et al., 2012). Neurobiotin-labeled neurons appearing to possess
dendritic spines were defined as SPNs. In certain cases, they were also
tested for their expression of Ctip2, a nuclear marker that has been
shown to be expressed in the SPNs, but not in interneurons, in rodents.
Neurons that did not express Ctip2, or had aspiny dendrites, were
tested for their expression of one or more of the classical markers of
striatal interneurons: CR, parvalbumin, choline acetyltransferase, and
nitric oxide synthase. The initial molecular marker tested was guided by
the labeled cell’s somatodendritic structure and position within the
striatum. Once a positive expression of one of these markers was
established, no other classical marker was tested since these molecules
are rarely co-expressed in rodent striatal interneurons (Kawaguchi,
1993). Interneurons that expressed CR were further tested for their
expression of secretagogin (Garas et al., 2016; Mulder et al., 2009) and
Lhx7 (Pangas et al., 2006). All indirect immunofluorescence and subse-
quent epifluorescence and/or confocal imaging of neurobiotin-labeled
interneurons was performed using protocols described above for ster-
eological cell counting and structural imaging of different subtypes of
cells.
2.10 | Data selection and analysis regarding the firing
rate and regularity of identified striatal interneurons
Electrophysiological data were visually inspected, and epochs of robust
cortical SWA or cortical activation were selected based on previous
descriptions of these brain states (Garas et al., 2016; Sharott et al.,
2012; Sharott, Vinciati, Nakamura, & Magill, 2017). Recordings were
included for further analysis only when they were artifact free, and had
a minimum duration of 50 s regardless of the brain state (185637.4 s;
range 53–404 s). Spike sorting procedures such as template matching,
principal component analysis and clustering (Mallet et al., 2008) were
applied using Spike 2 software in order to isolate single-unit activity.
Isolation of a single unit was verified by the presence of a distinct
refractory period in the interspike interval (ISI) histogram. Further anal-
ysis was later conducted after having converted single-unit activity into
a binary digital event (Spike 2) which was subsequently imported and
analyzed using MATLAB software (Mathworks, version R2014b). Due
to the low probability of “detecting” CR1 neurons using “blinded” in
vivo recordings (see Results), only 4 CR1 interneurons were recorded
and successfully labeled in the manner described above. As such, the
average spike waveforms, firing rates and ISIs of all these recorded
interneurons are individually presented.
2.11 | Tissue preparation and indirect
immunofluorescence in the caudate and putamen of
the rhesus macaque
Monkey tissue used for stereological cell counting was obtained from
two female adult rhesus monkeys (Macaca mulatta, 4.5–8.5 kg) from
the Yerkes National Primate Research Center colony. All procedures
performed were in accordance with guidelines from the National Insti-
tute of Health and were approved by Emory’s Animal Care and Use
Committee. The highly experienced Yerkes veterinary staff took care
of the animals. The Yerkes National Primate Research Center is an
NIH-funded institution that is fully accredited by AAALAC, and regu-
larly inspected by USDA. All activities at the Center are in compliance
with federal guidelines. All experimental protocols concerning primates
are performed in strict accordance with the NIH Guide for the Care
and Use of Laboratory Animals and the PHS Policy on the Humane
Care and Use of Laboratory Animals, and are reviewed and approved
by the Emory IACUC before the proposed studies begin. Both monkeys
were anesthetized using an intravenous injection of pentobarbital
(100 mg/kg). This was followed by a transcardial perfusion with cold
oxygenated Ringer’s solution, and 2 L of a fixative solution containing
4% paraformaldehyde and 0.1% glutaraldehyde in PB (0.1 M, pH 7.4).
Each brain was then cut into 10-mm-thick blocks in the coronal plane,
which were subsequently cut into 50-mm-thick sections using a
vibrating-blade microtome. Sections containing the caudate/putamen
were collected for use in immunofluorescence and cell counting
procedures.
Immunofluorescence protocols were performed using 7 coronal
sections which extended from the head of the caudate nucleus to the
beginning of the tail of the caudate nucleus (coordinates along the
rostro-caudal axis: 4.1, 2.2, 0, 22.7, 25.2, 27.6, and 29.4 mm from
Bregma). The sections from each monkey were matched such that the
overall position of each section relative to Bregma (Paxinos, Huang, &
Toga, 2000) from one monkey was similar to that in the second animal.
These sections were washed with PBS and pre-incubated for 2 hr in a
solution consisting of 10% v/v NDS (normal donkey serum) and 0.3%
Triton-PBS.
Sections were incubated over three nights at room temperature in
a solution of Triton-PBS which contained primary antibodies against
Scgn and CR. Table 1 contains the details, source and the dilutions
used for these antibodies, as they did not differ from those used for rat
and mouse tissue. The tissue was then washed in PBS before being
882 | The Journal ofComparative Neurology
GARAS ET AL.
incubated overnight at room temperature in a solution of Triton-PBS
and one of the fluorophore-conjugated secondary antibodies. After fur-
ther washing in PBS, sections were mounted on glass slides (VWR
Super Premium Microscope slides) using fluorescence mounting
medium (Vectashield; Vector Laboratories), followed by the addition of
a coverslip. The caudate and putamen of each section were imaged
using a Zeiss Imager M2 epifluorescence microscope equipped with a
203 objective and StereoInvestigator 9.0 software. The delineation of
each structure was defined using the monkey brain atlas (Paxinos et al.,
2000) and was done on a section-by-section basis. Once delineated,
the acquisition and subsequent counting of labeled neurons was carried
out in precisely the same manner as was done in rodent tissue (see
above).
2.12 | Analysis of stereological cell counts in the
rhesus macaque
For each combination of immunofluorescence markers studied, the
number of labeled neurons was counted in the caudate or the putamen
(treated as separate structures) and recorded for a given coronal plane
using the same principles described for the rodent. The calculation of V
(ref) (i.e., an estimate of the volume of the caudate nucleus and the
putamen) could not be accurately performed due to the lack of rhesus
tissue containing the tail of the caudate nucleus (approximately 10 mm
of caudate was not acquired). As a result, this study could not accu-
rately report estimates for the total numbers of neurons in the entirety
of the caudate nucleus or the putamen. As such, the absolute density
for each counted neuron is presented rather than the total number, and
was calculated by averaging the density of counted neurons within
each coronal plane (as in the rat and mouse). This was done so that the
results obtained from counts of different neuronal populations in differ-
ent species performed in this study could be compared with one
another.
The distribution of all counted neurons in the caudate nucleus
and the putamen was analyzed and presented along the rostro-
caudal, dorso-ventral, and medio-lateral planes in the same manner
as for the dorsal striatum of rodents. Statistical analysis regarding
the distributional bias of counted neurons was also performed simi-
larly to what was done for the results obtained in rodent dorsal
striatum.
3 | RESULTS
3.1 | Topographically discrete populations of CR1
interneurons in the rat dorsal striatum can be
identified by the selective expression of Scgn
In the adult rat, the CBP secretagogin (Scgn) is expressed in a propor-
tion of striatal interneurons (Garas et al., 2016; Kosaka et al., 2017;
Mulder et al., 2009). We observed that some, but not all, CR1 inter-
neurons co-express Scgn (Figure 1a, b). In the CR1/Scgn1 neuron
population, the expression of these CPBs was relatively intense, such
that immunoreactivity for both markers could often be detected in
proximal dendrites as well as in somata (Figure 1a). Previous descrip-
tions of CR1 interneurons in the rat (Bennett & Bolam, 1993; Rymar
et al., 2004) and mouse (Petryszyn et al., 2014) have noted a strong
positional bias of these cells toward the rostral and medial borders
of the dorsal striatum. Unbiased stereological cell-counting revealed
that, first, CR1/Scgn1 interneurons (total neurons counted5462;
rats53), represent approximately 40% of the total density of CR1
interneurons in the rat dorsal striatum (Figure 1c), and secondly,
CR1/Scgn1 interneurons are mostly located in the rostral aspects
of striatum (Figure 1d, f). This CR1/Scgn1 interneuron population is
therefore unique among currently known types of striatal interneur-
ons in that they are highly concentrated in the rostral (“pre-commis-
sural”) striatum and virtually absent in striatal planes caudal to the
anterior commissure (Figure 1d, f). Analysis of the positioning of
CR1/Scgn1 interneurons also revealed a strong medial bias (Figure
1h) and dorsal bias (Figure 1i). In contrast, those CR1 interneurons
that did not co-express Scgn (CR1/Scgn2; total neurons
counted51031; rats53) were homogenously distributed through-
out the rostro-caudal axis (Figure 1e, g), medio-lateral axis (Figure
1e, h) and dorso-ventral axis (Figure 1e, i) of the rat striatum. In
summary, the selective co-expression of Scgn can be used to distin-
guish two topographically distinct populations of CR1 interneurons
in the dorsal striatum of the rat.
3.2 | The selective expression of Scgn is correlated
with differences in the somatic diameters of CR1
interneurons in the rat dorsal striatum
In accordance with previous studies of the rat dorsal striatum (Rymar
et al., 2004), the somatic diameters of all CR1 interneurons varied from
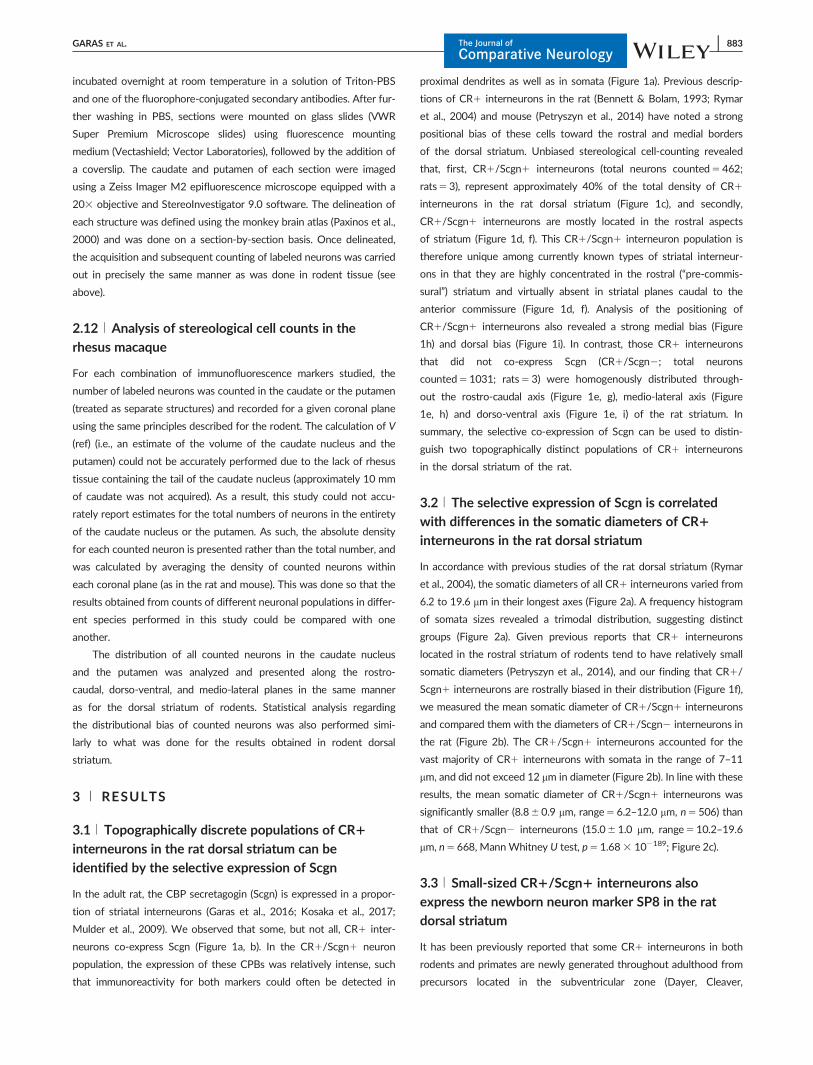
6.2 to 19.6 mm in their longest axes (Figure 2a). A frequency histogram
of somata sizes revealed a trimodal distribution, suggesting distinct
groups (Figure 2a). Given previous reports that CR1 interneurons
located in the rostral striatum of rodents tend to have relatively small
somatic diameters (Petryszyn et al., 2014), and our finding that CR1/
Scgn1 interneurons are rostrally biased in their distribution (Figure 1f),
we measured the mean somatic diameter of CR1/Scgn1 interneurons
and compared them with the diameters of CR1/Scgn2 interneurons in
the rat (Figure 2b). The CR1/Scgn1 interneurons accounted for the
vast majority of CR1 interneurons with somata in the range of 7–11
mm, and did not exceed 12 mm in diameter (Figure 2b). In line with these
results, the mean somatic diameter of CR1/Scgn1 interneurons was
significantly smaller (8.860.9 mm, range56.2–12.0 mm, n5506) than
that of CR1/Scgn2 interneurons (15.061.0 mm, range510.2–19.6
mm, n5668, MannWhitney U test, p51.683 102189; Figure 2c).
3.3 | Small-sized CR1/Scgn1 interneurons also
express the newborn neuron marker SP8 in the rat
dorsal striatum
It has been previously reported that some CR1 interneurons in both
rodents and primates are newly generated throughout adulthood from
precursors located in the subventricular zone (Dayer, Cleaver,
GARAS ET AL. The Journal ofComparative Neurology
| 883

Abouantoun, & Cameron, 2005; Inta, Cameron, & Gass, 2015), which
lies along the rostromedial borders the striatum. We therefore assessed
the co-expression of the transcription factor specificity protein 8 (SP8),
a marker of newly generated neurons (Chung, Medina-Ruiz, & Harland,
2014; Jiang, Zhang, You, & Liu, 2013), by CR1/Scgn1 and CR1/
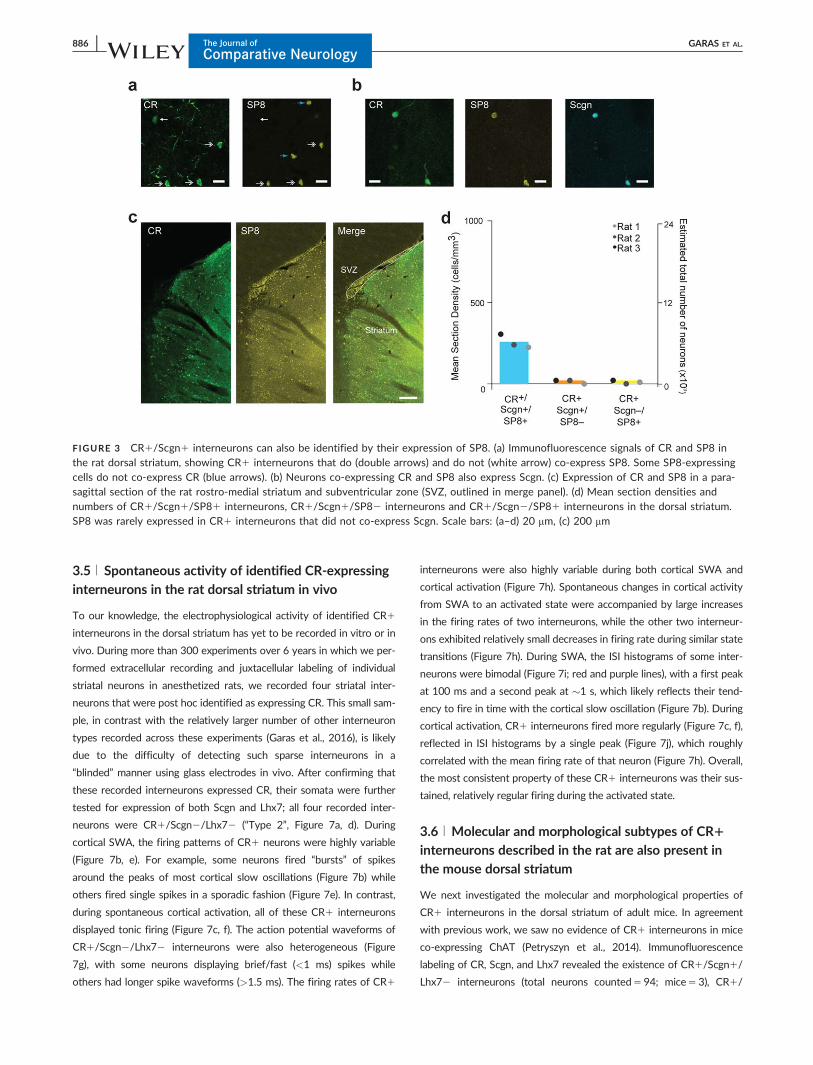
Scgn2 interneurons in the rat dorsal striatum (Figure 3). Interestingly,
while only some SP81 striatal neurons were found to co-express CR
(Figure 3a), nearly all CR1/Scgn1 interneurons co-expressed SP8
(99.760.7%, n53 rats; Figure 3b, d). Importantly, CR1/Scgn2 inter-
neurons very rarely co-expressed SP8 (Figure 3d). This suggests that
much of population of the rostrally biased, small-sized CR1/Scgn1
interneurons could be new born in adult striatum.
FIGURE 1 CR1/Scgn1 and CR1/Scgn– interneurons show different topographical distributions in the rat dorsal striatum. (a)Immunofluorescence signals of CR and Scgn in a rostral part of the rat dorsal striatum. Example CR1 interneurons that co-express Scgn(cells 1, 3 and 4) and a CR1 interneuron that does not co-express Scgn (cell 2). (b) Single-plane confocal micrographs of the numbered neu-rons in panel (a). Note the smaller size, and stronger immunofluorescent signals for CR, exhibited by the Scgn-expressing interneurons. Scalebars (a, b)520 mm. (c) The mean section density and estimated total number of all CR1, CR1/Scgn1 and CR1/Scgn2 interneurons acrossall 13 coronal sections of dorsal striatum. Note that CR1/Scgn1 interneurons make up �40% of all CR1 interneurons in the dorsal striatumof the rat. (d, e) Distributions of CR1/Scgn1 interneurons (d) and CR1/Scgn2 interneurons (e) across 13 coronal planes encompassing therostro-caudal axis of the dorsal striatum in a single rat, with each dot representing a single neuron in the 10 mm-thick optical disector. (f, g)Densities of CR1/Scgn1 neurons (f) and CR1/Scgn2 neurons (g) along the rostro-caudal axis of rat striatum. Note the decrease in densityof CR1/Scgn1 neurons when traversing from rostral to caudal striatum. (h, i) Medio-lateral (h) and dorso-ventral (i) distributions of CR1/Scgn1 interneurons (cyan line) and CR1/Scgn2 interneurons (green line) along 13 coronal planes. In coronal planes where less than 5 neu-rons were counted per animal, no relative topographical value is given. The presence of asterisks (*) indicate a distribution that is signifi-cantly biased in one direction along the specified axis (Wilcoxon Signed Rank test). Black squares (�) indicate a significant difference in thedistribution of the two populations along the specified axis within a given coronal plane (Wilcoxon Rank Sum test). All significant values are
indicated at p< .05. Data are means of the position of all neurons counted6 SEMs. (f–i) vertical dotted line on each plot shows the positionof the anterior commissure
884 | The Journal ofComparative Neurology
GARAS ET AL.
3.4 | Larger-sized CR1/Scgn2 interneurons express
the transcription factor Lhx7 in the rat dorsal striatum
Having shown that small-sized CR1 interneurons generally co-express
both Scgn and SP8, we further defined the molecular profile of the
larger-sized CR1/Scgn2 interneurons. While many larger-sized CR1
interneurons in the primate striatum co-express ChAT (Petryszyn et al.,
2014), in line with previous descriptions (Rymar et al., 2004), we could
not find any examples of CR1/ChAT1 neurons in the rat striatum (Fig-
ure 4a). In the mouse striatum, expression of the transcription factor LIM
homeobox protein 7 (Lhx7), also known as Lhx8 or L3 (Fragkouli, van
Wijk, Lopes, Kessaris, & Pachnis, 2009; Zhao et al., 2003), is important in
specifying the development (fate) of cholinergic interneurons (Fragkouli
et al., 2009). When immunoreactivity for Lhx7, CR, Scgn, and ChAT was
assessed, it was evident that Lhx7 is expressed by all ChAT1 interneur-
ons, but also by some CR1/Scgn2 neurons in rat dorsal striatum (Figure
4a, b). Importantly, the small-sized CR1/Scgn1 interneurons did not
express Lhx7 (Figure 4b). In order to investigate whether CR1/Scgn2/
Lhx71 and CR1/Scgn2/Lhx72 interneurons represented two distinct
populations, the somatic diameters of these two molecularly distinct sets
of CR1 interneurons were measured and compared with each other as
well as with the somatic diameters of CR1/Scgn1 interneurons (Figure
4c). The somatic sizes of the three, molecularly defined CR1 interneur-
ons subtypes were significantly different (Kruskal-Wallis ANOVA,
p51.3554 3 102209). The somatic diameter of CR1/Scgn2/Lhx71
interneurons (15.961.7 mm, range512.0–19.6 mm, n5460; Figure 4d)
was significantly larger than that of CR1/Scgn2/Lhx72 interneurons
(12.960.99 mm, range510.2–16.2 mm, n5208; post-hoc Dunn test;
Figure 4d). As expected, the somatic diameters of CR1/Scgn1/Lhx72
interneurons were also on average smaller than those of CR1/Scgn2/
Lhx72 interneurons (post-hoc Dunn test; Figure 4d). Taken together,
these results suggest that the CR1/Scgn2 interneurons in rat dorsal
striatum can be further subdivided into a medium-sized Lhx72 neurons
and relatively large-sized Lhx71 neurons.
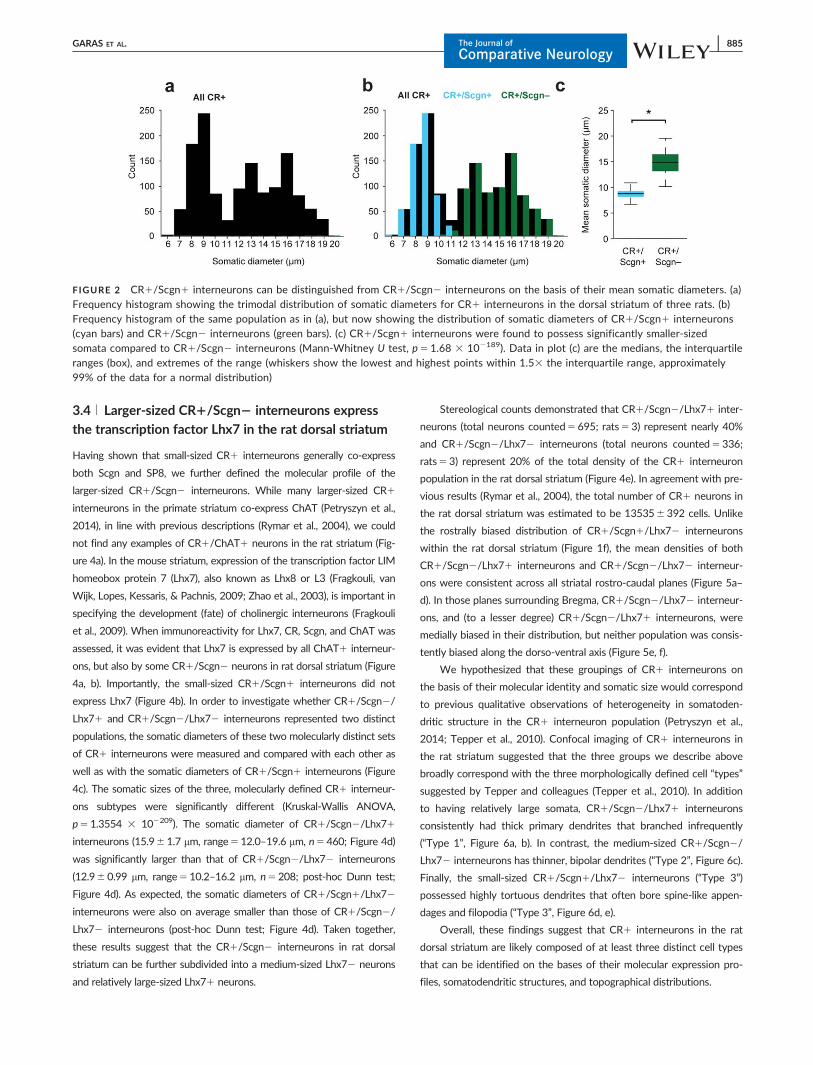
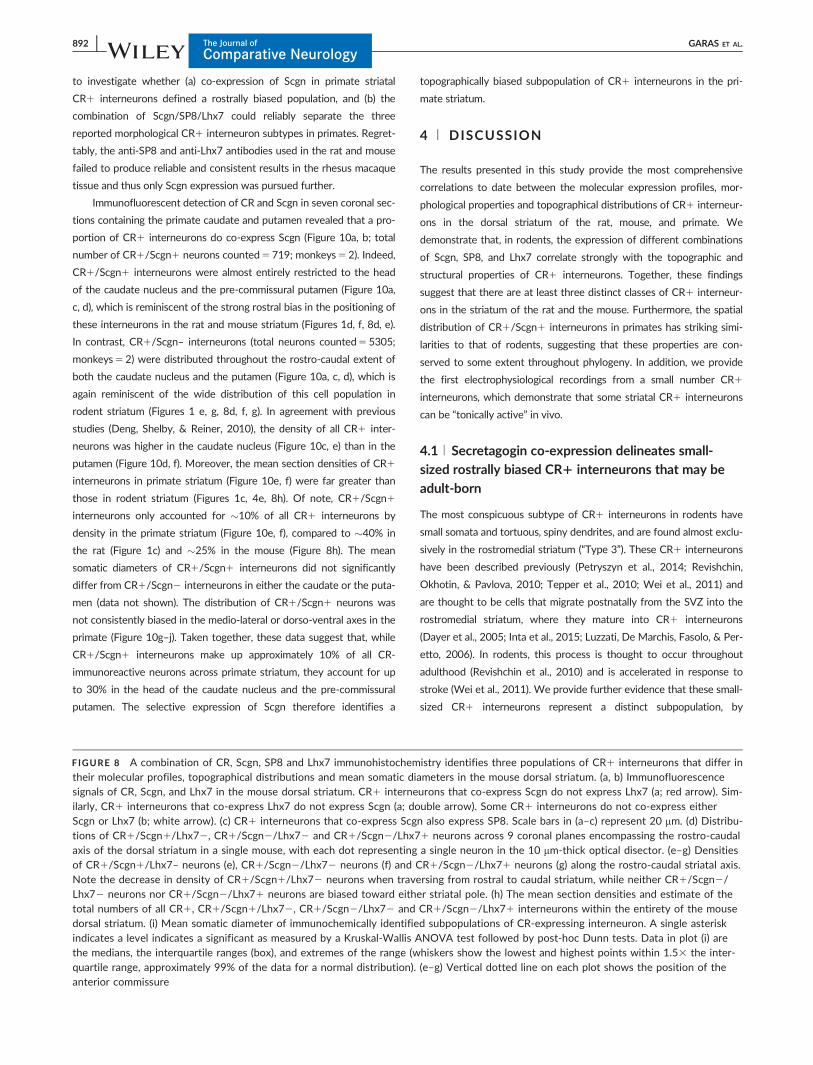
Stereological counts demonstrated that CR1/Scgn2/Lhx71 inter-
neurons (total neurons counted5695; rats53) represent nearly 40%
and CR1/Scgn2/Lhx72 interneurons (total neurons counted5336;
rats53) represent 20% of the total density of the CR1 interneuron
population in the rat dorsal striatum (Figure 4e). In agreement with pre-
vious results (Rymar et al., 2004), the total number of CR1 neurons in
the rat dorsal striatum was estimated to be 135356392 cells. Unlike
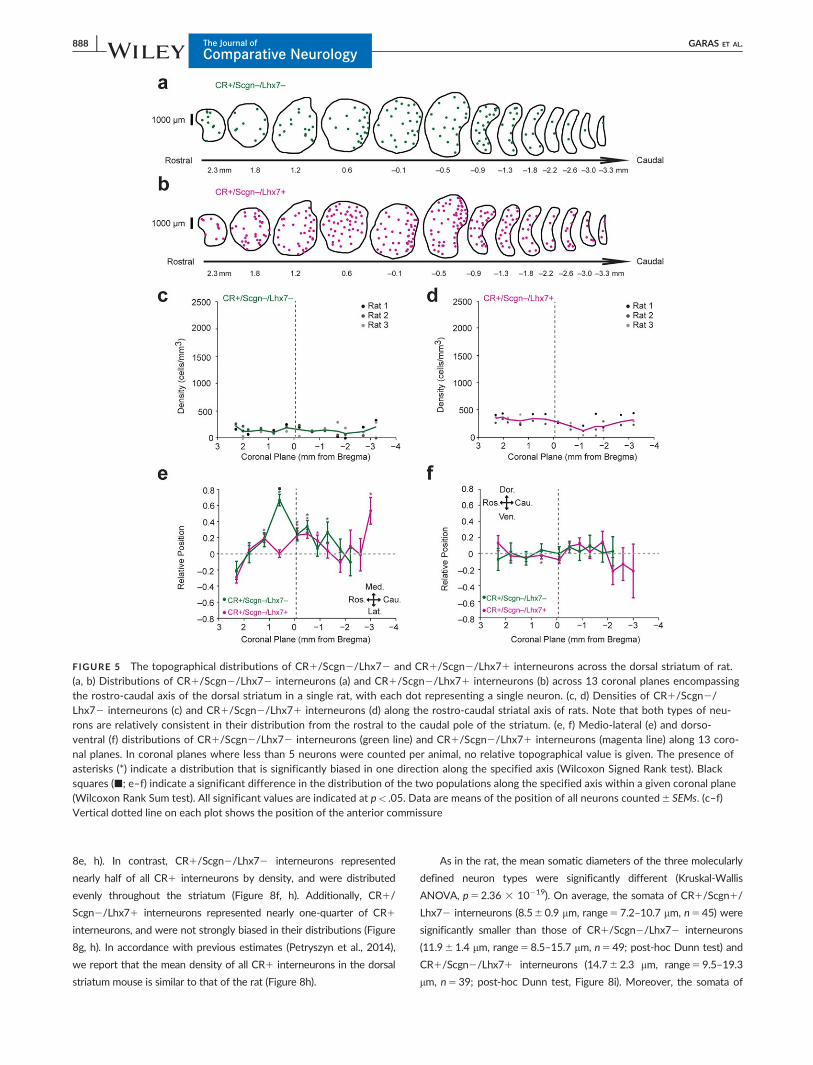
the rostrally biased distribution of CR1/Scgn1/Lhx72 interneurons
within the rat dorsal striatum (Figure 1f), the mean densities of both
CR1/Scgn2/Lhx71 interneurons and CR1/Scgn2/Lhx72 interneur-
ons were consistent across all striatal rostro-caudal planes (Figure 5a–
d). In those planes surrounding Bregma, CR1/Scgn2/Lhx72 interneur-
ons, and (to a lesser degree) CR1/Scgn2/Lhx71 interneurons, were
medially biased in their distribution, but neither population was consis-
tently biased along the dorso-ventral axis (Figure 5e, f).
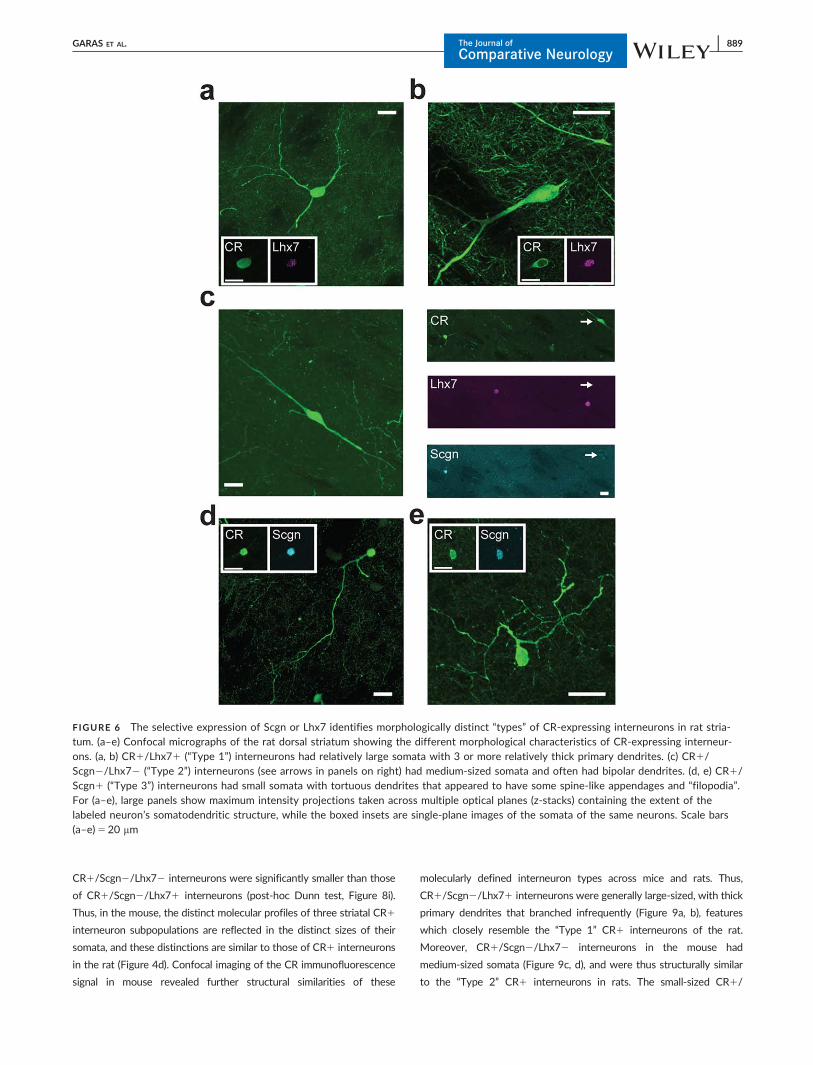
We hypothesized that these groupings of CR1 interneurons on
the basis of their molecular identity and somatic size would correspond
to previous qualitative observations of heterogeneity in somatoden-
dritic structure in the CR1 interneuron population (Petryszyn et al.,
2014; Tepper et al., 2010). Confocal imaging of CR1 interneurons in
the rat striatum suggested that the three groups we describe above
broadly correspond with the three morphologically defined cell “types”
suggested by Tepper and colleagues (Tepper et al., 2010). In addition
to having relatively large somata, CR1/Scgn2/Lhx71 interneurons
consistently had thick primary dendrites that branched infrequently
(“Type 1”, Figure 6a, b). In contrast, the medium-sized CR1/Scgn2/
Lhx72 interneurons has thinner, bipolar dendrites (“Type 2”, Figure 6c).
Finally, the small-sized CR1/Scgn1/Lhx72 interneurons (“Type 3”)
possessed highly tortuous dendrites that often bore spine-like appen-
dages and filopodia (“Type 3”, Figure 6d, e).
Overall, these findings suggest that CR1 interneurons in the rat
dorsal striatum are likely composed of at least three distinct cell types
that can be identified on the bases of their molecular expression pro-
files, somatodendritic structures, and topographical distributions.
FIGURE 2 CR1/Scgn1 interneurons can be distinguished from CR1/Scgn2 interneurons on the basis of their mean somatic diameters. (a)Frequency histogram showing the trimodal distribution of somatic diameters for CR1 interneurons in the dorsal striatum of three rats. (b)Frequency histogram of the same population as in (a), but now showing the distribution of somatic diameters of CR1/Scgn1 interneurons(cyan bars) and CR1/Scgn2 interneurons (green bars). (c) CR1/Scgn1 interneurons were found to possess significantly smaller-sizedsomata compared to CR1/Scgn2 interneurons (Mann-Whitney U test, p51.68 3 102189). Data in plot (c) are the medians, the interquartile
ranges (box), and extremes of the range (whiskers show the lowest and highest points within 1.53 the interquartile range, approximately99% of the data for a normal distribution)
GARAS ET AL. The Journal ofComparative Neurology
| 885
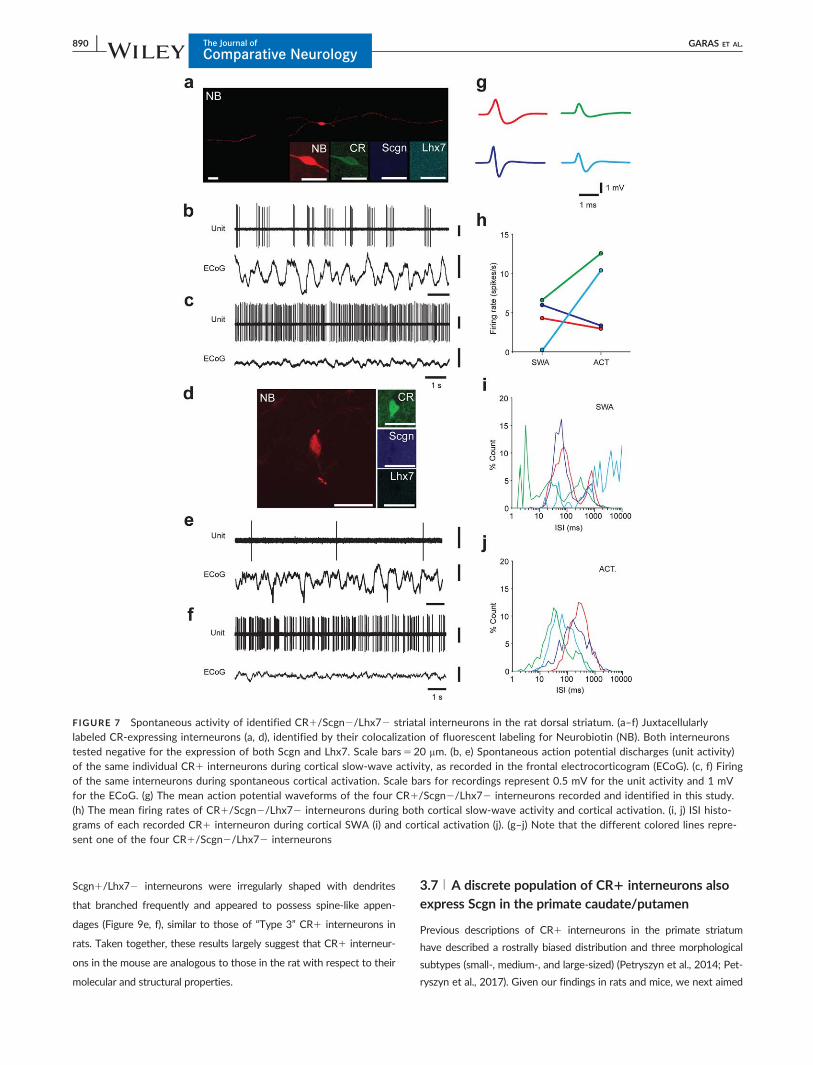
3.5 | Spontaneous activity of identified CR-expressing
interneurons in the rat dorsal striatum in vivo
To our knowledge, the electrophysiological activity of identified CR1
interneurons in the dorsal striatum has yet to be recorded in vitro or in
vivo. During more than 300 experiments over 6 years in which we per-
formed extracellular recording and juxtacellular labeling of individual
striatal neurons in anesthetized rats, we recorded four striatal inter-
neurons that were post hoc identified as expressing CR. This small sam-
ple, in contrast with the relatively larger number of other interneuron
types recorded across these experiments (Garas et al., 2016), is likely
due to the difficulty of detecting such sparse interneurons in a
“blinded” manner using glass electrodes in vivo. After confirming that
these recorded interneurons expressed CR, their somata were further
tested for expression of both Scgn and Lhx7; all four recorded inter-
neurons were CR1/Scgn2/Lhx72 (“Type 2”, Figure 7a, d). During
cortical SWA, the firing patterns of CR1 neurons were highly variable
(Figure 7b, e). For example, some neurons fired “bursts” of spikes
around the peaks of most cortical slow oscillations (Figure 7b) while
others fired single spikes in a sporadic fashion (Figure 7e). In contrast,
during spontaneous cortical activation, all of these CR1 interneurons
displayed tonic firing (Figure 7c, f). The action potential waveforms of
CR1/Scgn2/Lhx72 interneurons were also heterogeneous (Figure
7g), with some neurons displaying brief/fast (<1 ms) spikes while
others had longer spike waveforms (>1.5 ms). The firing rates of CR1
interneurons were also highly variable during both cortical SWA and
cortical activation (Figure 7h). Spontaneous changes in cortical activity
from SWA to an activated state were accompanied by large increases
in the firing rates of two interneurons, while the other two interneur-
ons exhibited relatively small decreases in firing rate during similar state
transitions (Figure 7h). During SWA, the ISI histograms of some inter-
neurons were bimodal (Figure 7i; red and purple lines), with a first peak
at 100 ms and a second peak at �1 s, which likely reflects their tend-
ency to fire in time with the cortical slow oscillation (Figure 7b). During
cortical activation, CR1 interneurons fired more regularly (Figure 7c, f),
reflected in ISI histograms by a single peak (Figure 7j), which roughly
correlated with the mean firing rate of that neuron (Figure 7h). Overall,
the most consistent property of these CR1 interneurons was their sus-
tained, relatively regular firing during the activated state.
3.6 | Molecular and morphological subtypes of CR1
interneurons described in the rat are also present in
the mouse dorsal striatum
We next investigated the molecular and morphological properties of
CR1 interneurons in the dorsal striatum of adult mice. In agreement
with previous work, we saw no evidence of CR1 interneurons in mice
co-expressing ChAT (Petryszyn et al., 2014). Immunofluorescence
labeling of CR, Scgn, and Lhx7 revealed the existence of CR1/Scgn1/
Lhx72 interneurons (total neurons counted594; mice53), CR1/
FIGURE 3 CR1/Scgn1 interneurons can also be identified by their expression of SP8. (a) Immunofluorescence signals of CR and SP8 inthe rat dorsal striatum, showing CR1 interneurons that do (double arrows) and do not (white arrow) co-express SP8. Some SP8-expressingcells do not co-express CR (blue arrows). (b) Neurons co-expressing CR and SP8 also express Scgn. (c) Expression of CR and SP8 in a para-sagittal section of the rat rostro-medial striatum and subventricular zone (SVZ, outlined in merge panel). (d) Mean section densities andnumbers of CR1/Scgn1/SP81 interneurons, CR1/Scgn1/SP82 interneurons and CR1/Scgn2/SP81 interneurons in the dorsal striatum.SP8 was rarely expressed in CR1 interneurons that did not co-express Scgn. Scale bars: (a–d) 20 mm, (c) 200 mm
886 | The Journal ofComparative Neurology
GARAS ET AL.

Scgn2/Lhx72 interneurons (total neurons counted5167; mice53)
and CR1/Scgn2/Lhx71 interneurons (total neurons counted591;
mice53) in the dorsal striatum of the mouse (Figure 8a, b). As in the
rat, Lhx7 and Scgn were not co-expressed together by CR1 interneur-
ons (Figure 8a,b), and CR1/Scgn1/Lhx72 interneurons represented
the only group of CR1 interneurons that also expressed SP8 (Figure
8c). Stereological cell counting across 9 coronal planes was performed
in order to estimate the total numbers and spatial distributions of CR1
interneurons (Figure 8d). When the volume of the mouse dorsal stria-
tum is taken into consideration, the total number of CR1 interneurons
was estimated to be 40956195 cells. The number of counted neurons
per striatal section in the mouse was often too low for meaningful sta-
tistical analysis of interneuron distribution, but topographical mapping
nevertheless revealed that CR1/Scgn1/Lhx72 interneurons repre-
sented approximately one-quarter of all CR1 interneurons by density,
and were biased toward the rostral pole of the dorsal striatum (Figure
FIGURE 4 The selective expression of Lhx7 distinguishes some CR1/Scgn2 interneurons and is correlated with differences in meansomatic diameter. (a, b) Immunofluorescence signals of CR, Scgn, Lhx7 and ChAT in the rat dorsal striatum. (a) Lhx7 is expressed in allChAT1 interneurons (arrow) and some CR1 interneurons (double arrow). (b) CR1/Lhx71 interneurons do not express Scgn (double arrow).Some CR1 neurons do not express Lhx7 or Scgn (white arrow) while others express Scgn, but not Lhx7 (red arrow). (c) Frequencyhistogram showing the distribution of somatic diameters of all CR1 interneurons (black bars), CR1/Scgn1/Lhx72 interneurons (cyan bars),CR1/Scgn2/Lhx72 interneurons (green bars) and CR1/Scgn2/Lhx71 interneurons (magenta bars). Note that the somatic diameters ofCR1/Scgn2/Lhx72 interneurons and CR1/Scgn2/Lhx71 interneurons partially overlap and, therefore, somatic size cannot always be usedto unambiguously distinguish between these cell populations. (d) Mean somatic diameters of immunochemically identified subpopulations ofCR-expressing interneurons. The presence of an asterisk indicates a level of significant difference as measured by a Kruskal–Wallis ANOVAfollowed by post hoc Dunn tests. (e) Mean section densities and estimated total numbers of interneurons with combinatorial expression of
CR, Scgn and/or Lhx7. Of all CR1 interneurons in rat striatum, 40% were CR1/Scgn1/Lhx72, 40% were CR1/Scgn2/Lhx71 and theremainder CR1/Scgn2/Lhx72. Scale bars: (a, b) 20mm. Data in plot (d) are the medians, the interquartile ranges (box), and extremes of therange (whiskers show the lowest and highest points within 1.53 the interquartile range, approximately 99% of the data for a normaldistribution)
GARAS ET AL. The Journal ofComparative Neurology
| 887
8e, h). In contrast, CR1/Scgn2/Lhx72 interneurons represented
nearly half of all CR1 interneurons by density, and were distributed
evenly throughout the striatum (Figure 8f, h). Additionally, CR1/
Scgn2/Lhx71 interneurons represented nearly one-quarter of CR1
interneurons, and were not strongly biased in their distributions (Figure
8g, h). In accordance with previous estimates (Petryszyn et al., 2014),
we report that the mean density of all CR1 interneurons in the dorsal
striatum mouse is similar to that of the rat (Figure 8h).
As in the rat, the mean somatic diameters of the three molecularly
defined neuron types were significantly different (Kruskal-Wallis
ANOVA, p52.36 3 10219). On average, the somata of CR1/Scgn1/
Lhx72 interneurons (8.560.9 mm, range57.2–10.7 mm, n545) were
significantly smaller than those of CR1/Scgn2/Lhx72 interneurons
(11.961.4 mm, range58.5–15.7 mm, n549; post-hoc Dunn test) and
CR1/Scgn2/Lhx71 interneurons (14.762.3 mm, range59.5–19.3
mm, n539; post-hoc Dunn test, Figure 8i). Moreover, the somata of
FIGURE 5 The topographical distributions of CR1/Scgn2/Lhx72 and CR1/Scgn2/Lhx71 interneurons across the dorsal striatum of rat.(a, b) Distributions of CR1/Scgn2/Lhx72 interneurons (a) and CR1/Scgn2/Lhx71 interneurons (b) across 13 coronal planes encompassingthe rostro-caudal axis of the dorsal striatum in a single rat, with each dot representing a single neuron. (c, d) Densities of CR1/Scgn2/Lhx72 interneurons (c) and CR1/Scgn2/Lhx71 interneurons (d) along the rostro-caudal striatal axis of rats. Note that both types of neu-rons are relatively consistent in their distribution from the rostral to the caudal pole of the striatum. (e, f) Medio-lateral (e) and dorso-ventral (f) distributions of CR1/Scgn2/Lhx72 interneurons (green line) and CR1/Scgn2/Lhx71 interneurons (magenta line) along 13 coro-nal planes. In coronal planes where less than 5 neurons were counted per animal, no relative topographical value is given. The presence ofasterisks (*) indicate a distribution that is significantly biased in one direction along the specified axis (Wilcoxon Signed Rank test). Blacksquares (�; e–f) indicate a significant difference in the distribution of the two populations along the specified axis within a given coronal plane(Wilcoxon Rank Sum test). All significant values are indicated at p< .05. Data are means of the position of all neurons counted6 SEMs. (c–f)Vertical dotted line on each plot shows the position of the anterior commissure
888 | The Journal ofComparative Neurology
GARAS ET AL.
CR1/Scgn2/Lhx72 interneurons were significantly smaller than those
of CR1/Scgn2/Lhx71 interneurons (post-hoc Dunn test, Figure 8i).
Thus, in the mouse, the distinct molecular profiles of three striatal CR1
interneuron subpopulations are reflected in the distinct sizes of their
somata, and these distinctions are similar to those of CR1 interneurons
in the rat (Figure 4d). Confocal imaging of the CR immunofluorescence
signal in mouse revealed further structural similarities of these
molecularly defined interneuron types across mice and rats. Thus,
CR1/Scgn2/Lhx71 interneurons were generally large-sized, with thick
primary dendrites that branched infrequently (Figure 9a, b), features
which closely resemble the “Type 1” CR1 interneurons of the rat.
Moreover, CR1/Scgn2/Lhx72 interneurons in the mouse had
medium-sized somata (Figure 9c, d), and were thus structurally similar
to the “Type 2” CR1 interneurons in rats. The small-sized CR1/
FIGURE 6 The selective expression of Scgn or Lhx7 identifies morphologically distinct “types” of CR-expressing interneurons in rat stria-tum. (a–e) Confocal micrographs of the rat dorsal striatum showing the different morphological characteristics of CR-expressing interneur-ons. (a, b) CR1/Lhx71 (“Type 1”) interneurons had relatively large somata with 3 or more relatively thick primary dendrites. (c) CR1/Scgn2/Lhx72 (“Type 2”) interneurons (see arrows in panels on right) had medium-sized somata and often had bipolar dendrites. (d, e) CR1/Scgn1 (“Type 3”) interneurons had small somata with tortuous dendrites that appeared to have some spine-like appendages and “filopodia”.For (a–e), large panels show maximum intensity projections taken across multiple optical planes (z-stacks) containing the extent of thelabeled neuron’s somatodendritic structure, while the boxed insets are single-plane images of the somata of the same neurons. Scale bars(a–e)520 mm
GARAS ET AL. The Journal ofComparative Neurology
| 889
Scgn1/Lhx72 interneurons were irregularly shaped with dendrites
that branched frequently and appeared to possess spine-like appen-
dages (Figure 9e, f), similar to those of “Type 3” CR1 interneurons in
rats. Taken together, these results largely suggest that CR1 interneur-
ons in the mouse are analogous to those in the rat with respect to their
molecular and structural properties.
3.7 | A discrete population of CR1 interneurons alsoexpress Scgn in the primate caudate/putamen
Previous descriptions of CR1 interneurons in the primate striatum
have described a rostrally biased distribution and three morphological
subtypes (small-, medium-, and large-sized) (Petryszyn et al., 2014; Pet-
ryszyn et al., 2017). Given our findings in rats and mice, we next aimed
FIGURE 7 Spontaneous activity of identified CR1/Scgn2/Lhx72 striatal interneurons in the rat dorsal striatum. (a–f) Juxtacellularlylabeled CR-expressing interneurons (a, d), identified by their colocalization of fluorescent labeling for Neurobiotin (NB). Both interneuronstested negative for the expression of both Scgn and Lhx7. Scale bars520 mm. (b, e) Spontaneous action potential discharges (unit activity)of the same individual CR1 interneurons during cortical slow-wave activity, as recorded in the frontal electrocorticogram (ECoG). (c, f) Firingof the same interneurons during spontaneous cortical activation. Scale bars for recordings represent 0.5 mV for the unit activity and 1 mVfor the ECoG. (g) The mean action potential waveforms of the four CR1/Scgn2/Lhx72 interneurons recorded and identified in this study.(h) The mean firing rates of CR1/Scgn2/Lhx72 interneurons during both cortical slow-wave activity and cortical activation. (i, j) ISI histo-grams of each recorded CR1 interneuron during cortical SWA (i) and cortical activation (j). (g–j) Note that the different colored lines repre-sent one of the four CR1/Scgn2/Lhx72 interneurons
890 | The Journal ofComparative Neurology
GARAS ET AL.

FIGURE 8.
GARAS ET AL. The Journal ofComparative Neurology
| 891
to investigate whether (a) co-expression of Scgn in primate striatal
CR1 interneurons defined a rostrally biased population, and (b) the
combination of Scgn/SP8/Lhx7 could reliably separate the three
reported morphological CR1 interneuron subtypes in primates. Regret-
tably, the anti-SP8 and anti-Lhx7 antibodies used in the rat and mouse
failed to produce reliable and consistent results in the rhesus macaque
tissue and thus only Scgn expression was pursued further.
Immunofluorescent detection of CR and Scgn in seven coronal sec-
tions containing the primate caudate and putamen revealed that a pro-
portion of CR1 interneurons do co-express Scgn (Figure 10a, b; total
number of CR1/Scgn1 neurons counted5719; monkeys52). Indeed,
CR1/Scgn1 interneurons were almost entirely restricted to the head
of the caudate nucleus and the pre-commissural putamen (Figure 10a,
c, d), which is reminiscent of the strong rostral bias in the positioning of
these interneurons in the rat and mouse striatum (Figures 1d, f, 8d, e).
In contrast, CR1/Scgn– interneurons (total neurons counted55305;
monkeys52) were distributed throughout the rostro-caudal extent of
both the caudate nucleus and the putamen (Figure 10a, c, d), which is
again reminiscent of the wide distribution of this cell population in
rodent striatum (Figures 1 e, g, 8d, f, g). In agreement with previous
studies (Deng, Shelby, & Reiner, 2010), the density of all CR1 inter-
neurons was higher in the caudate nucleus (Figure 10c, e) than in the
putamen (Figure 10d, f). Moreover, the mean section densities of CR1
interneurons in primate striatum (Figure 10e, f) were far greater than
those in rodent striatum (Figures 1c, 4e, 8h). Of note, CR1/Scgn1
interneurons only accounted for �10% of all CR1 interneurons by
density in the primate striatum (Figure 10e, f), compared to �40% in
the rat (Figure 1c) and �25% in the mouse (Figure 8h). The mean
somatic diameters of CR1/Scgn1 interneurons did not significantly
differ from CR1/Scgn2 interneurons in either the caudate or the puta-
men (data not shown). The distribution of CR1/Scgn1 neurons was
not consistently biased in the medio-lateral or dorso-ventral axes in the
primate (Figure 10g–j). Taken together, these data suggest that, while
CR1/Scgn1 interneurons make up approximately 10% of all CR-
immunoreactive neurons across primate striatum, they account for up
to 30% in the head of the caudate nucleus and the pre-commissural
putamen. The selective expression of Scgn therefore identifies a
topographically biased subpopulation of CR1 interneurons in the pri-
mate striatum.
4 | DISCUSSION
The results presented in this study provide the most comprehensive
correlations to date between the molecular expression profiles, mor-
phological properties and topographical distributions of CR1 interneur-
ons in the dorsal striatum of the rat, mouse, and primate. We
demonstrate that, in rodents, the expression of different combinations
of Scgn, SP8, and Lhx7 correlate strongly with the topographic and
structural properties of CR1 interneurons. Together, these findings
suggest that there are at least three distinct classes of CR1 interneur-
ons in the striatum of the rat and the mouse. Furthermore, the spatial
distribution of CR1/Scgn1 interneurons in primates has striking simi-
larities to that of rodents, suggesting that these properties are con-
served to some extent throughout phylogeny. In addition, we provide
the first electrophysiological recordings from a small number CR1
interneurons, which demonstrate that some striatal CR1 interneurons
can be “tonically active” in vivo.
4.1 | Secretagogin co-expression delineates small-
sized rostrally biased CR1 interneurons that may be
adult-born
The most conspicuous subtype of CR1 interneurons in rodents have
small somata and tortuous, spiny dendrites, and are found almost exclu-
sively in the rostromedial striatum (“Type 3”). These CR1 interneurons
have been described previously (Petryszyn et al., 2014; Revishchin,
Okhotin, & Pavlova, 2010; Tepper et al., 2010; Wei et al., 2011) and
are thought to be cells that migrate postnatally from the SVZ into the
rostromedial striatum, where they mature into CR1 interneurons
(Dayer et al., 2005; Inta et al., 2015; Luzzati, De Marchis, Fasolo, & Per-
etto, 2006). In rodents, this process is thought to occur throughout
adulthood (Revishchin et al., 2010) and is accelerated in response to
stroke (Wei et al., 2011). We provide further evidence that these small-
sized CR1 interneurons represent a distinct subpopulation, by
FIGURE 8 A combination of CR, Scgn, SP8 and Lhx7 immunohistochemistry identifies three populations of CR1 interneurons that differ intheir molecular profiles, topographical distributions and mean somatic diameters in the mouse dorsal striatum. (a, b) Immunofluorescencesignals of CR, Scgn, and Lhx7 in the mouse dorsal striatum. CR1 interneurons that co-express Scgn do not express Lhx7 (a; red arrow). Sim-ilarly, CR1 interneurons that co-express Lhx7 do not express Scgn (a; double arrow). Some CR1 interneurons do not co-express eitherScgn or Lhx7 (b; white arrow). (c) CR1 interneurons that co-express Scgn also express SP8. Scale bars in (a–c) represent 20 mm. (d) Distribu-tions of CR1/Scgn1/Lhx72, CR1/Scgn2/Lhx72 and CR1/Scgn2/Lhx71 neurons across 9 coronal planes encompassing the rostro-caudalaxis of the dorsal striatum in a single mouse, with each dot representing a single neuron in the 10 mm-thick optical disector. (e–g) Densitiesof CR1/Scgn1/Lhx7– neurons (e), CR1/Scgn2/Lhx72 neurons (f) and CR1/Scgn2/Lhx71 neurons (g) along the rostro-caudal striatal axis.Note the decrease in density of CR1/Scgn1/Lhx72 neurons when traversing from rostral to caudal striatum, while neither CR1/Scgn2/Lhx72 neurons nor CR1/Scgn2/Lhx71 neurons are biased toward either striatal pole. (h) The mean section densities and estimate of thetotal numbers of all CR1, CR1/Scgn1/Lhx72, CR1/Scgn2/Lhx72 and CR1/Scgn2/Lhx71 interneurons within the entirety of the mousedorsal striatum. (i) Mean somatic diameter of immunochemically identified subpopulations of CR-expressing interneuron. A single asteriskindicates a level indicates a significant as measured by a Kruskal-Wallis ANOVA test followed by post-hoc Dunn tests. Data in plot (i) arethe medians, the interquartile ranges (box), and extremes of the range (whiskers show the lowest and highest points within 1.53 the inter-quartile range, approximately 99% of the data for a normal distribution). (e–g) Vertical dotted line on each plot shows the position of theanterior commissure
892 | The Journal ofComparative Neurology
GARAS ET AL.
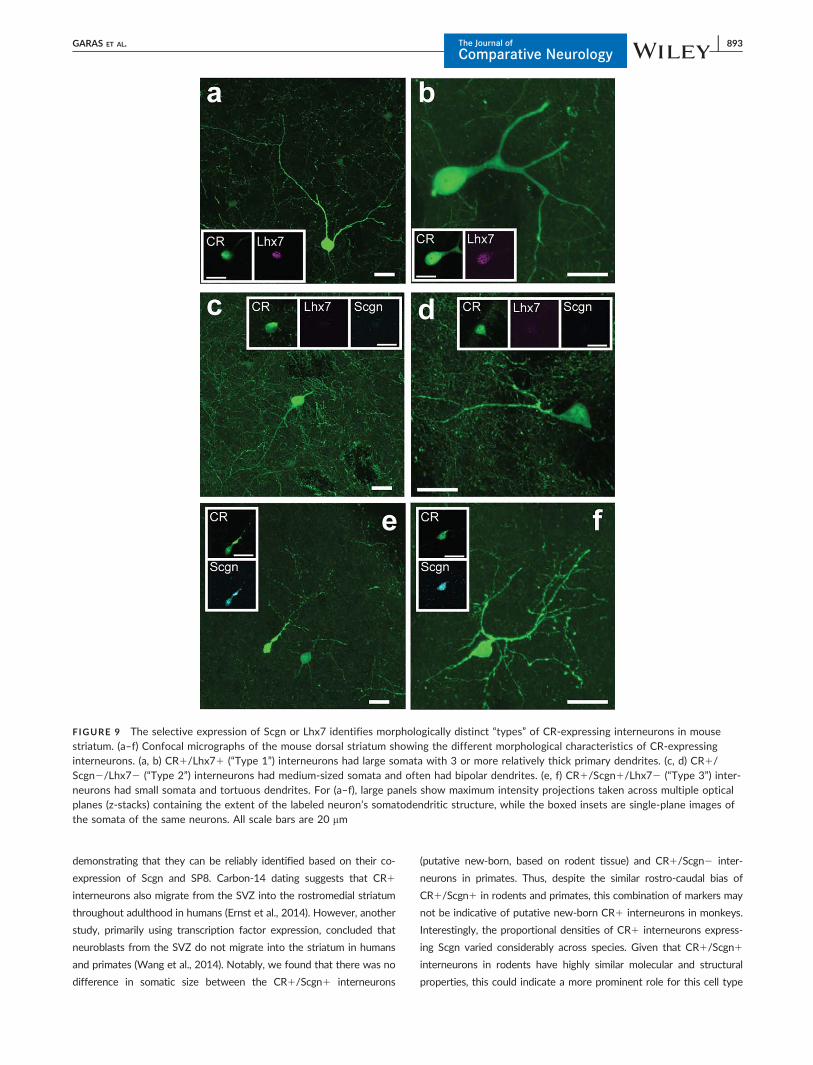
demonstrating that they can be reliably identified based on their co-
expression of Scgn and SP8. Carbon-14 dating suggests that CR1
interneurons also migrate from the SVZ into the rostromedial striatum
throughout adulthood in humans (Ernst et al., 2014). However, another
study, primarily using transcription factor expression, concluded that
neuroblasts from the SVZ do not migrate into the striatum in humans
and primates (Wang et al., 2014). Notably, we found that there was no
difference in somatic size between the CR1/Scgn1 interneurons
(putative new-born, based on rodent tissue) and CR1/Scgn2 inter-
neurons in primates. Thus, despite the similar rostro-caudal bias of
CR1/Scgn1 in rodents and primates, this combination of markers may
not be indicative of putative new-born CR1 interneurons in monkeys.
Interestingly, the proportional densities of CR1 interneurons express-
ing Scgn varied considerably across species. Given that CR1/Scgn1
interneurons in rodents have highly similar molecular and structural
properties, this could indicate a more prominent role for this cell type
FIGURE 9 The selective expression of Scgn or Lhx7 identifies morphologically distinct “types” of CR-expressing interneurons in mousestriatum. (a–f) Confocal micrographs of the mouse dorsal striatum showing the different morphological characteristics of CR-expressinginterneurons. (a, b) CR1/Lhx71 (“Type 1”) interneurons had large somata with 3 or more relatively thick primary dendrites. (c, d) CR1/Scgn2/Lhx72 (“Type 2”) interneurons had medium-sized somata and often had bipolar dendrites. (e, f) CR1/Scgn1/Lhx72 (“Type 3”) inter-neurons had small somata and tortuous dendrites. For (a–f), large panels show maximum intensity projections taken across multiple opticalplanes (z-stacks) containing the extent of the labeled neuron’s somatodendritic structure, while the boxed insets are single-plane images ofthe somata of the same neurons. All scale bars are 20 mm
GARAS ET AL. The Journal ofComparative Neurology
| 893
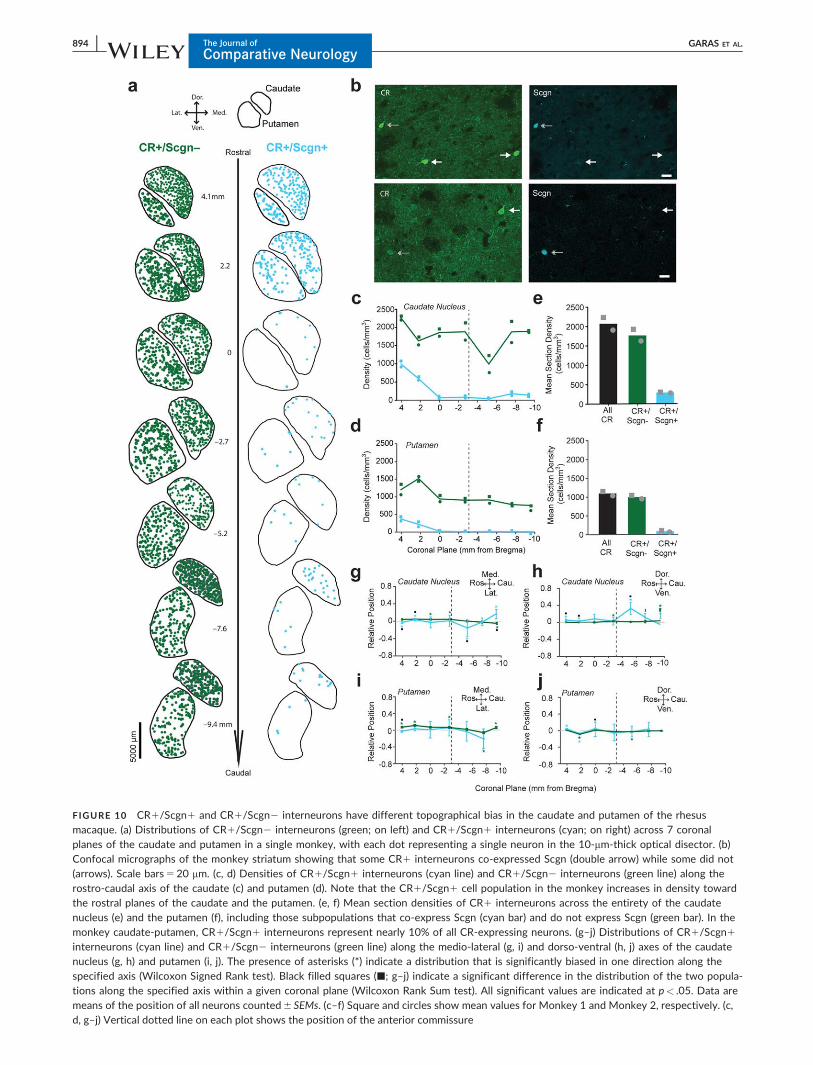
FIGURE 10 CR1/Scgn1 and CR1/Scgn2 interneurons have different topographical bias in the caudate and putamen of the rhesusmacaque. (a) Distributions of CR1/Scgn2 interneurons (green; on left) and CR1/Scgn1 interneurons (cyan; on right) across 7 coronalplanes of the caudate and putamen in a single monkey, with each dot representing a single neuron in the 10-mm-thick optical disector. (b)Confocal micrographs of the monkey striatum showing that some CR1 interneurons co-expressed Scgn (double arrow) while some did not(arrows). Scale bars520 mm. (c, d) Densities of CR1/Scgn1 interneurons (cyan line) and CR1/Scgn2 interneurons (green line) along therostro-caudal axis of the caudate (c) and putamen (d). Note that the CR1/Scgn1 cell population in the monkey increases in density towardthe rostral planes of the caudate and the putamen. (e, f) Mean section densities of CR1 interneurons across the entirety of the caudatenucleus (e) and the putamen (f), including those subpopulations that co-express Scgn (cyan bar) and do not express Scgn (green bar). In themonkey caudate-putamen, CR1/Scgn1 interneurons represent nearly 10% of all CR-expressing neurons. (g–j) Distributions of CR1/Scgn1interneurons (cyan line) and CR1/Scgn2 interneurons (green line) along the medio-lateral (g, i) and dorso-ventral (h, j) axes of the caudatenucleus (g, h) and putamen (i, j). The presence of asterisks (*) indicate a distribution that is significantly biased in one direction along thespecified axis (Wilcoxon Signed Rank test). Black filled squares (�; g–j) indicate a significant difference in the distribution of the two popula-tions along the specified axis within a given coronal plane (Wilcoxon Rank Sum test). All significant values are indicated at p< .05. Data aremeans of the position of all neurons counted6 SEMs. (c–f) Square and circles show mean values for Monkey 1 and Monkey 2, respectively. (c,d, g–j) Vertical dotted line on each plot shows the position of the anterior commissure
894 | The Journal ofComparative Neurology
GARAS ET AL.
in governing striatal function in the rat as compared to mouse. The rel-
atively small proportion of CR1/Scgn1 interneurons in primates sug-
gests that the greater abundance of CR1 interneurons as a whole
(Petryszyn et al., 2014; Petryszyn, Di Paolo, Parent, & Parent, 2016) is
driven to a large extent by a selective proliferation of CR1/Scgn2 neu-
rons. A greater understanding of other functional properties of the dif-
ferent classes of CR1 interneuron is needed to further interpret the
relevance of these species differences.
The biased rostromedial distribution of these CR1/Scgn1 inter-
neurons in rodent striatum is particularly striking. The broad function of
neurons in the striatum generally corresponds to the type of cortical
input to a given territory (Hintiryan et al., 2016; Hunnicutt et al., 2016).
The rodent rostromedial striatum receives cortical projections primarily
from associative cortices in the rat (Hoover & Vertes, 2011; Mailly,
Aliane, Groenewegen, Haber, & Deniau, 2013). However, to our knowl-
edge, there is no information about the extent to which these putative
newborn neurons are “functionally embedded” into the striatal microcir-
cuit. Thus, in this case, proximity to the SVZ could be an equally or
more important factor underlying the high density of this cell popula-
tion in rostromedial areas of striatum. Interestingly, we found that
CR1/Scgn1 interneurons in the primate striatum were also consider-
ably more abundant in rostral areas, particularly the head of the caudate
nucleus, that receive input from associative cortices (Yeterian & Pandya,
1993, 1998). As we could not test whether these monkey CR1/Scgn1
interneurons co-expressed SP8, further work will be needed to estab-
lish whether these interneurons are also putative adult-born cells or
represent a topographically specific population with a function related
to those associative cortical areas in primates. In either case, and as
recently described for parvalbumin (PV)-expressing striatal interneurons
(Garas et al., 2016), Scgn appears to delineate a specialized subpopula-
tion of CR1 interneurons in rodents and primates.
4.2 | Medium-sized CR1 interneurons do not express
Lhx7 or secretagogin
Early qualitative descriptions of CR1 interneurons in the rodent dorsal
striatum suggested they were “medium-sized” (Bennett & Bolam, 1993;
Jacobowitz & Winsky, 1991), an observation later extended to mon-
keys (Parent et al., 1996) and humans (Cicchetti et al., 1998). Our use
of Scgn and Lhx7 immunoreactivity, as well as an in-depth investigation
of somatic size, revealed that medium-sized CR1 interneurons (as
defined by their somatic diameter and their lack of Scgn or Lhx7
expression) make up 20% of all CR1 interneurons in the rat and nearly
50% of all CR1 interneurons in the mouse. These “Type 2” medium-
sized CR1/Scgn2/Lhx72 interneurons were preferentially distributed
in the medial striatum in rats. In the primate striatum, we found that
CR1/Scgn2 interneurons (irrespective of Lhx7, which was not tested)
did not demonstrate any strong or consistent distributional bias within
either the caudate or the putamen. This is in agreement with many
studies of interneuron distribution in the primate striatum, where any
preference for localizing to one particular region was not detected
(Deng et al., 2010; Petryszyn et al., 2014, 2016). The rostral distribution
of CR1/Scgn1 interneurons presented here does, however, provide
evidence that striatal interneuron populations in the primate can be
heterogeneously distributed, in line with the recent demonstration of
biased distributions for different types of PV1 interneurons in primates
(Garas et al 2016). Future molecular phenotyping of CR1/Scgn1 and
CR1/Scgn2 interneurons could reveal additional subtypes with topo-
graphical bias in the primate.
4.3 | Medium-sized CR1 interneurons are “tonicallyactive” during cortical activation in the rat
The functional roles performed by GABAergic CR1 interneurons within
the striatal microcircuit are unclear, which is partly due to the lack of
data regarding their local synaptic connectivity and electrophysiological
properties (Tepper et al., 2010). To our knowledge, we herein provide
the first definition of the in vivo electrophysiological properties of iden-
tified CR1 interneurons. By chance, all of our single-cell recordings
were made from medium-sized, Type 2 CR1 interneurons (CR1/
Scgn2/Lhx72). Our recordings suggest that CR1/Scgn2/Lhx72 inter-
neurons can be “fast spiking” (i.e., have a spike duration of around 1
ms) and have generally heterogeneous firing rates and patterns, partic-
ularly during cortical slow-wave activity. The most consistent feature
of these interneurons was there near continuous, regular firing at 3–12
spikes/s during cortical activation. These firing properties resemble
those of cholinergic interneurons and some PV-expressing interneurons
(Sharott et al. 2012; Doig et al. 2014; Garas et al, 2016), but not of
SPNs or nitric oxide synthase-expressing interneurons (Sharott et al.,
2012; Sharott et al., 2017), as also recorded in this brain state in anes-
thetized rats. If these firing properties of CR1/Scgn2/Lhx72 inter-
neurons are maintained in awake, behaving animals, this cell type might
be confused (erroneously grouped) with putative cholinergic interneur-
ons, which are often assigned this identity on the basis of “tonically
active” firing patterns (Goldberg & Reynolds, 2011). In rodents, the
sparsity of these CR1 interneurons makes it likely that they would
constitute only a small number of recorded neurons in behaving ani-
mals. In primates, however, where CR1 interneurons are far more
numerous, extracellular recordings of tonically active neurons could
encompass both cholinergic interneurons and a significant number of
CR1 interneurons. It should be noted that, if the waveform of CR1
interneurons were to differ from the long, triphasic action potential of
putative cholinergic interneurons, careful examination of the action
potential waveform could partly resolve this ambiguity (Adler, Katabi,
Finkes, Prut, & Bergman, 2013). Given the high density of CR1 neu-
rons in the primate striatum and the importance of primate data in elu-
cidating the role of different striatal interneuron types in relation to
behavior, our data suggests that this issue at least warrants further
exploration in these primate data sets.
4.4 | Lhx7 expression in the large-sized CR1
interneurons of the rodent may link them to the large
CR1/ChAT1 expressing interneurons of the primate
In the striatum of squirrel monkeys (Parent et al., 1996) and humans
(Cicchetti et al., 1998), many large-sized (>20 mm) CR1 interneurons
GARAS ET AL. The Journal ofComparative Neurology
| 895

co-express ChAT and are highly analogous in somatodendritic structure
to the large striatal cholinergic interneurons that do not co-express CR
(Cicchetti et al., 2000; Parent et al., 1996). Although ChAT and CR are
not co-localized in interneurons of the rodent striatum, relatively large
(>15 mm) CR1 interneurons have been described in the striatum of
both mice (Petryszyn et al., 2014) and rats (Rymar et al., 2004). Here,
we show that these larger CR1 interneurons selectively express the
transcription factor Lhx7, which is required for the development of
cholinergic interneurons from embryonic medial ganglionic eminence
(MGE)-derived cell progenitors (Fragkouli et al., 2009). This finding sug-
gests that CR1 interneurons co-expressing Lhx7 could constitute a
separate subtype that is related in lineage to ChAT1 interneurons. If
so, the relatively large-sized CR1/Scgn2/Lhx71 interneurons of the
rodent could be related to the large CR1/ChAT1 interneurons of the
primate. However, although the CR1/Scgn2/Lhx71 interneurons are
the largest of CR1 interneurons, they are smaller than ChAT1 inter-
neurons in rodents and primates (Petryszyn et al., 2016; Petryszyn
et al., 2017). This observation supports the alternative premise that
ChAT1/CR2 and ChAT1/CR1 interneurons in primates are more
strongly related to ChAT1 interneurons in rodents, with CR1/Scgn2/
Lhx71 interneurons comprising an entirely distinct cell type. Further
molecular characterization of striatal interneurons across the life
courses of rodents and primates will be needed to resolve this issue.
Whatever the case, the expression of Lhx7 by large “Type 1” CR1
interneurons in the adult rat is by itself significant, as it suggests that
these neurons are also derived from the MGE, whereas CR1/Scgn1/
Lhx72 interneurons expressing SP8 are likely to be derived from the
SVZ or embryonic caudal ganglionic eminence (Inta et al., 2015). This
implied difference in developmental linage, as revealed by the selective
expression of Scgn or Lhx7, provides further evidence that the molecu-
lar characterization described here identifies a minimum of three types
of striatal CR1 interneuron. In mice, the density of CR1/Scgn2/
Lhx71 interneurons was around half that of CR1/Scgn2/Lhx72 inter-
neurons, whereas these proportions were approximately reversed in
rats. This could reflect further differences between the striatal microcir-
cuits of mice and rats, in addition to those we have recently described
for parvalbumin-expressing interneurons (Garas et al., 2016).
The present study provides a novel correlative approach to identify
different populations of morphologically, topographically, and molecu-
larly distinct CR1 interneurons in the striatum of both mice and rats.
One of these populations, namely rostrally biased CR1/Scgn1 inter-
neurons, was partially conserved between the rodent and primate. Our
molecular characterization of striatal CR1 interneurons using Scgn and
Lhx7 may also provide a useful starting point for the design of cell-
type-selective manipulations that can be used to disentangle the speci-
alized contributions of different populations of CR1 interneurons to
activity dynamics within the striatal microcircuit.
ACKNOWLEDGMENTS
This work was supported by the Medical Research Council UK
(MRC; awards MC_UU_12020/5 and MC_UU_12024/2 to P.J.M.,
and award MC_UU_12024/1 to A.S.), and a Marie Curie European
Re-integration Grant (SNAP-PD) awarded by the European Union. F.
N.G. and E.K. were supported by University of Oxford Clarendon
Fund Scholarships and the MRC. R.S. was funded by a Wellcome
Trust Clinical Fellowship (WT_RS_109030/Z/15/Z). F.V. was sup-
ported by an MRC studentship. Y.S. was supported by NIH support
to Yerkes National Primate Centre (P51OD011132). We thank A.
Rajkovic and C. Cozzari for generous gifts of antibodies, T. Harkany
and R. Faram for early insights on secretagogin, and G. Hazell, B.
Micklem, E. Norman, K. Whitworth, J. Janson, L. Conyers, C. John-
son and S. Jenkins for technical support.
CONFLICT OF INTEREST
The authors declare no competing financial interests.
ORCID
Andrew Sharott http://orcid.org/0000-0002-1594-3349
Peter J. Magill http://orcid.org/0000-0001-7141-7071
REFERENCES
Abdi, A., Mallet, N., Mohamed, F. Y., Sharott, A., Dodson, P. D., Naka-
mura, K. C., . . . Magill, P. J. (2015). Prototypic and arkypallidal neu-
rons in the dopamine-intact external globus pallidus. Journal of
Neuroscience, 35, 6667–6688. https://doi.org/10.1523/JNEUROSCI.
4662-14.2015
Adler, A., Katabi, S., Finkes, I., Prut, Y., & Bergman, H. (2013). Different
correlation patterns of cholinergic and GABAergic interneurons with
striatal projection neurons. Frontiers in Systems Neuroscience, 7, 47.
https://doi.org/10.3389/fnsys.2013.00047
Ascoli, G. A., Alonso-Nanclares, L., Anderson, S. A., Barrionuevo, G.,
Benavides-Piccione, R., Burkhalter, A. . . . Yuste, R. (2008). Petilla ter-
minology: Nomenclature of features of GABAergic interneurons of
the cerebral cortex. Nature Reviews Neuroscience, 9, 557–568.https://doi.org/10.1038/nrn2402
Bennett, B. D., & Bolam, J. P. (1993). Characterization of calretinin-
immunoreactive structures in the striatum of the rat. Brain Research,
609, 137–148.
Cai, Y., Zhang, Q., Wang, C., Zhang, Y., Ma, T., Zhou, X., . . . Yang, Z.
(2013). Nuclear receptor COUP-TFII-expressing neocortical interneur-
ons are derived from the medial and lateral/caudal ganglionic emi-
nence and define specific subsets of mature interneurons. Journal of
Comparative Neurology, 521, 479–497. https://doi.org/10.1002/cne.
23186
Chung, H. A., Medina-Ruiz, S., & Harland, R. M. (2014). Sp8 regulates
inner ear development. Proceedings of the National Academy of Scien-
ces of the United States of America United States of America, 111,
6329–6334. https://doi.org/10.1073/pnas.1319301111
Cicchetti, F., Beach, T. G., & Parent, A. (1998). Chemical phenotype of
calretinin interneurons in the human striatum. Synapse (New York, N.
Y.), 30, 284–297. https://doi.org/10.1002/(sici)1098-2396(199811)
30:3<284::aid-syn6>3.0.co;2-7
Cicchetti, F., Prensa, L., Wu, Y., & Parent, A. (2000). Chemical anatomy
of striatal interneurons in normal individuals and in patients with
Huntington’s disease. Brain Research. Brain Research Reviews, 34, 80–101.
Doig, N. M., Magill, P. J., Apicella, P., Bolam, J. P., & Sharott, A. (2014).
Cortical and thalamic excitation mediate the multiphasic responses of
striatal cholinergic interneurons to motivationally salient stimuli. J
896 | The Journal ofComparative Neurology
GARAS ET AL.

Neurosci, 34, 3101–3117. https://doi.org/10.1523/JNEUROSCI.
4627-13.2014
Dayer, A. G., Cleaver, K. M., Abouantoun, T., & Cameron, H. A. (2005).
New GABAergic interneurons in the adult neocortex and striatum are
generated from different precursors. The Journal of Cell Biology, 168,
415–427. https://doi.org/10.1083/jcb.200407053
Deng, Y. P., Shelby, E., & Reiner, A. J. (2010). Immunohistochemical local-
ization of AMPA-type glutamate receptor subunits in the striatum of
rhesus monkey. Brain Research, 1344, 104–123. https://doi.org/10.1016/j.brainres.2010.05.003
Ernst, A., Alkass, K., Bernard, S., Salehpour, M., Perl, S., Tisdale, J., . . .
Frisen, J. (2014). Neurogenesis in the striatum of the adult human
brain. Cell, 156, 1072–1083. https://doi.org/10.1016/j.cell.2014.01.
044
Figueredo-Cardenas, G., Medina, L., & Reiner, A. (1996). Calretinin is
largely localized to a unique population of striatal interneurons in
rats. Brain Research, 709, 145–150.
Fragkouli, A., van Wijk, N. V., Lopes, R., Kessaris, N., & Pachnis, V.
(2009). LIM homeodomain transcription factor-dependent specifica-
tion of bipotential MGE progenitors into cholinergic and GABAergic
striatal interneurons. Development, 136, 3841–3851. https://doi.org/10.1242/dev.038083
Franklin, K. B. J., & Paxinos, G. (2008). The mouse brain in stereotaxic
coordinates. New York: Academic Press.
Garas, F. N., Shah, R. S., Kormann, E., Doig, N. M., Vinciati, F., Nakamura,
K. C., . . . Sharott, A. (2016). Secretagogin expression delineates
functionally-specialized populations of striatal parvalbumin-containing
interneurons. eLife, 5, https://doi.org/10.7554/eLife.16088
Glaser, J., Greene, G., & Hendricks, S. (2007). Stereology for biological
research with a focus on neuroscience. Williston, VT: MBF.
Goldberg, J. A., & Reynolds, J. N. (2011). Spontaneous firing and evoked
pauses in the tonically active cholinergic interneurons of the striatum.
Neuroscience, 198, 27–43. https://doi.org/10.1016/j.neuroscience.
2011.08.067
Gundersen, H. J., & Jensen, E. B. (1987). The efficiency of systematic
sampling in stereology and its prediction. Journal of Microscopy, 147,
229–263.
Gundersen, H. J., Jensen, E. B., Kieu, K., & Nielsen, J. (1999). The effi-
ciency of systematic sampling in stereology–reconsidered. Journal ofMicroscopy, 193, 199–211.
Hintiryan, H., Foster, N. N., Bowman, I., Bay, M., Song, M. Y., Gou, L., . . .
Dong, H. W. (2016). The mouse cortico-striatal projectome.
Nature Neuroscience, 19, 1100–1114. https://doi.org/10.1038/nn.
4332
Hoover, W. B., & Vertes, R. P. (2011). Projections of the medial orbital
and ventral orbital cortex in the rat. The Journal of Comparative Neu-
rology, 519, 3766–3801. https://doi.org/10.1002/cne.22733
Huang, Z., Yu, Y., Shimoda, Y., Watanabe, K., & Liu, Y. (2012). Loss of
neural recognition molecule NB-3 delays the normal projection and
terminal branching of developing corticospinal tract axons in the
mouse. The Journal of Comparative Neurology, 520, 1227–1245.https://doi.org/10.1002/cne.22772
Hunnicutt, B. J., Jongbloets, B. C., Birdsong, W. T., Gertz, K. J., Zhong,
H., & Mao, T. (2016). A comprehensive excitatory input map of the
striatum reveals novel functional organization. eLife, 5. https://doi.
org/10.7554/eLife.19103
Ingham, E. S., Gunhan, E., Fuller, P. M., & Fuller, C. A. (2009). Immuno-
toxin-induced ablation of melanopsin retinal ganglion cells in a non-
murine mammalian model. The Journal of Comparative Neurology, 516,
125–140. https://doi.org/10.1002/cne.22103
Inta, D., Cameron, H. A., & Gass, P. (2015). New neurons in the adult
striatum: From rodents to humans. Trends in Neurosciences, 38, 517–523. https://doi.org/10.1016/j.tins.2015.07.005
Jacobowitz, D. M., & Winsky, L. (1991). Immunocytochemical localization
of calretinin in the forebrain of the rat. The Journal of Comparative
Neurology, 304, 198–218. https://doi.org/10.1002/cne.903040205
Jiang, X., Zhang, M., You, Y., & Liu, F. (2013). The production of somato-
statin interneurons in the olfactory bulb is regulated by the transcrip-
tion factor sp8. PLoS One, 8, e70049. https://doi.org/10.1371/
journal.pone.0070049
Kataoka, Y., Kalanithi, P. S., Grantz, H., Schwartz, M. L., Saper, C., Leck-
man, J. F., & Vaccarino, F. M. (2010). Decreased number of parvalbu-
min and cholinergic interneurons in the striatum of individuals with
Tourette syndrome. The Journal of Comparative Neurology, 518, 277–291. https://doi.org/10.1002/cne.22206
Kawaguchi, Y. (1993). Physiological, morphological, and histochemical
characterization of three classes of interneurons in rat neostriatum.
Journal of Neuroscience, 13, 4908–4923.
Klausberger, T., & Somogyi, P. (2008). Neuronal diversity and temporal
dynamics: The unity of hippocampal circuit operations. Science, 321,
53–57. https://doi.org/10.1126/science.1149381
Kosaka, T., Yasuda, S., & Kosaka, K. (2017). Calcium-binding protein, sec-
retagogin, characterizes novel groups of interneurons in the rat stria-
tum. Neuroscience Research, 119, 53–60. https://doi.org/10.1016/j.
neures.2017.01.004
Luzzati, F., De Marchis, S., Fasolo, A., & Peretto, P. (2006). Neurogenesis in
the caudate nucleus of the adult rabbit. The Journal of Neuroscience, 26,
609–621. https://doi.org/10.1523/jneurosci.4371-05.2006
Magill, P. J., Bolam, J. P., & Bevan, M. D. (2000). Relationship of activity
in the subthalamic nucleus-globus pallidus network to cortical elec-
troencephalogram. Journal of Neuroscience, 20, 820–833.
Magill, P. J., Sharott, A., Bolam, J. P., & Brown, P. (2004). Brain state-
dependency of coherent oscillatory activity in the cerebral cortex and
basal ganglia of the rat. Journal of Neurophysiology, 92, 2122–2136.https://doi.org/10.1152/jn.00333.2004 00333.2004 [pii]
Mailly, P., Aliane, V., Groenewegen, H. J., Haber, S. N., & Deniau, J.
M. (2013). The rat prefrontostriatal system analyzed in 3D: Evi-
dence for multiple interacting functional units. Journal of Neuro-
science, 33, 5718–5727. https://doi.org/10.1523/JNEUROSCI.5248-
12.2013
Mallet, N., Pogosyan, A., Sharott, A., Csicsvari, J., Bolam, J. P., Brown, P.,
& Magill, P. J. (2008). Disrupted dopamine transmission and the
emergence of exaggerated beta oscillations in subthalamic nucleus
and cerebral cortex. Journal of Neuroscience, 28, 4795–4806. https://doi.org/28/18/4795 [pii] 10.1523/JNEUROSCI.0123-08 (2008).
Miettinen, R., Gulyas, A. I., Baimbridge, K. G., Jacobowitz, D. M., &
Freund, T. F. (1992). Calretinin is present in non-pyramidal cells of
the rat hippocampus–II. Co-existence with other calcium binding pro-
teins and GABA. Neuroscience, 48, 29–43.
Mulder, J., Zilberter, M., Spence, L., Tortoriello, G., Uhlen, M., Yanagawa,
Y., . . . Harkany, T. (2009). Secretagogin is a Ca21-binding protein
specifying subpopulations of telencephalic neurons. Proceedings of
the National Academy of Sciences of the United States of America, 106,
22492–22497. https://doi.org/10.1073/pnas.0912484106
Nakamura, K. C., Sharott, A., & Magill, P. J. (2014). Temporal coupling with
cortex distinguishes spontaneous neuronal activities in identified basal
ganglia-recipient and cerebellar-recipient zones of the motor thalamus.
Cerebral Cortex, 24, 81–97. https://doi.org/10.1093/cercor/bhs287
Noble, W. S. (2009). How does multiple testing correction work? Nature
Biotechnology, 27, 1135–1137. https://doi.org/nbt1209-1135 [pii]
10.1038/nbt1209-1135
GARAS ET AL. The Journal ofComparative Neurology
| 897

Oorschot, D. E. (1996). Total number of neurons in the neostriatal, pal-
lidal, subthalamic, and substantia nigral nuclei of the rat basal ganglia:
A stereological study using the cavalieri and optical disector methods.
The Journal of Comparative Neurology, 366, 580–599. https://doi.org/10.1002/(SICI)1096-9861(19960318)366:4<580::AID-CNE3>3.0.
CO;2-0
Pangas, S. A., Choi, Y., Ballow, D. J., Zhao, Y., Westphal, H., Matzuk, M.
M., & Rajkovic, A. (2006). Oogenesis requires germ cell-specific tran-
scriptional regulators Sohlh1 and Lhx8. Proceedings of the National
Academy of Sciences of the United States of America, 103, 8090–8095. https://doi.org/10.1073/pnas.0601083103
Parent, A., Fortin, M., Cote, P. Y., & Cicchetti, F. (1996). Calcium-binding
proteins in primate basal ganglia. Neuroscience Research, 25, 309–
334.
Paxinos, G., Huang, X., & Toga, A. (2000). The Rhesus monkey brain in ste-
reotaxic coordinates. San Diego: Academic Press.
Paxinos, G., & Watson, C. (2007). The rat brain in stereotaxic coordinates:
Hard Cover Edition. Amsterdam: Elsevier Science.
Petryszyn, S., Beaulieu, J. M., Parent, A., & Parent, M. (2014). Distribu-
tion and morphological characteristics of striatal interneurons
expressing calretinin in mice: A comparison with human and nonhu-
man primates. Journal of Chemical Neuroanatomy, 59–60, 51–61.https://doi.org/10.1016/j.jchemneu.2014.06.002
Petryszyn, S., Di Paolo, T., Parent, A., & Parent, M. (2016). The number
of striatal cholinergic interneurons expressing calretinin is increased
in parkinsonian monkeys. Neurobiology of Disease, 95, 46–53. https://doi.org/10.1016/j.nbd.2016.07.002
Petryszyn, S., Parent, A., & Parent, M. (2017). The calretinin interneurons
of the striatum: Comparisons between rodents and primates under
normal and pathological conditions. Journal of Neural Transmission
(Vienna). doi:10.1007/s00702-017-1687-x. Epub ahead of print.
Revishchin, A. V., Okhotin, V. E., & Pavlova, G. V. (2010). New calretinin-
positive cells with polymorphous spines in the mouse forebrain dur-
ing early postnatal ontogeny. Neuroscience and Behavioral Physiology,
40, 833–840. https://doi.org/10.1007/s11055-010-9349-6
Rymar, V. V., Sasseville, R., Luk, K. C., & Sadikot, A. F. (2004). Neurogen-
esis and stereological morphometry of calretinin-immunoreactive
GABAergic interneurons of the neostriatum. The Journal of Compara-
tive Neurology, 469, 325–339. https://doi.org/10.1002/Cne.11008
Schmitz, C., & Hof, P. R. (2005). Design-based stereology in neuro-
science. Neuroscience, 130, 813–831. https://doi.org/10.1016/j.neu-roscience.2004.08.050
Sharott, A., Doig, N. M., Mallet, N., & Magill, P. J. (2012). Relationships
between the firing of identified striatal interneurons and spontaneous
and driven cortical activities in vivo. Journal of Neuroscience, 32,
13221–13236. https://doi.org/10.1523/JNEUROSCI.2440-12.2012
Sharott, A., Vinciati, F., Nakamura, K. C., & Magill, P. J. (2017). A popula-
tion of indirect pathway striatal projection neurons is selectively
entrained to parkinsonian beta oscillations. The Journal of Neuro-
science, 37, 9977–9998. https://doi.org/10.1523/JNEUROSCI.0658-
17.2017
Silberberg, G., & Bolam, J. P. (2015). Local and afferent synaptic path-
ways in the striatal microcircuitry. Current Opinion in Neurobiology,
33, 182–187. https://doi.org/10.1016/j.conb.2015.05.002
Simmons, D. D., Tong, B., Schrader, A. D., & Hornak, A. J. (2010). Onco-
modulin identifies different hair cell types in the mammalian inner
ear. The Journal of Comparative Neurology, 518, 3785–3802. https://doi.org/10.1002/cne.22424
Slomianka, L., & West, M. J. (2005). Estimators of the precision of ster-
eological estimates: An example based on the CA1 pyramidal cell
layer of rats. Neuroscience, 136, 757–767. https://doi.org/10.1016/j.neuroscience.2005.06.086
Tepper, J. M., Tecuapetla, F., Koos, T., & Ibanez-Sandoval, O. (2010).
Heterogeneity and diversity of striatal GABAergic interneurons. Fron-
tiers in Neuroanatomy, 4, 150. https://doi.org/10.3389/fnana.2010.
00150
von Engelhardt, J., Eliava, M., Meyer, A. H., Rozov, A., & Monyer, H.
(2007). Functional characterization of intrinsic cholinergic interneur-
ons in the cortex. Journal of Neuroscience, 27, 5633–5642. https://doi.org/10.1523/JNEUROSCI.4647-06.2007
Wang, C., You, Y., Qi, D., Zhou, X., Wang, L., Wei, S., . . . Yang, Z. (2014).
Human and monkey striatal interneurons are derived from the medial
ganglionic eminence but not from the adult subventricular zone. Jour-
nal of Neuroscience, 34, 10906–10923. https://doi.org/10.1523/
JNEUROSCI.1758-14.2014
Wei, B., Nie, Y., Li, X., Wang, C., Ma, T., Huang, Z., . . . Yang, Z. (2011).
Emx1-expressing neural stem cells in the subventricular zone give
rise to new interneurons in the ischemic injured striatum. The Euro-
pean Journal of Neuroscience, 33, 819–830. https://doi.org/10.1111/j.1460-9568.2010.07570.x
West, M. J. (1999). Stereological methods for estimating the total num-
ber of neurons and synapses: Issues of precision and bias. Trends in
Neurosciences, 22, 51–61.
West, M. J. (2012). Basic stereology for biologists and neuroscientists. Cold
Spring Harbor, NY: Cold Spring Harbor Laboratory.
Wu, Y., & Parent, A. (2000). Striatal interneurons expressing calretinin,
parvalbumin or NADPH-diaphorase: A comparative study in the rat,
monkey and human. Brain Research, 863, 182–191. https://doi.org/S0006-8993(00)02135-1 [pii]
Yeterian, E. H., & Pandya, D. N. (1993). Striatal connections of the parie-
tal association cortices in rhesus monkeys. The Journal of Comparative
Neurology, 332, 175–197. https://doi.org/10.1002/cne.903320204
Yeterian, E. H., & Pandya, D. N. (1998). Corticostriatal connections of
the superior temporal region in rhesus monkeys. The Journal of Com-
parative Neurology, 399, 384–402.
Zhao, Y., Marin, O., Hermesz, E., Powell, A., Flames, N., Palkovits, M., . . .
Westphal, H. (2003). The LIM-homeobox gene Lhx8 is required for
the development of many cholinergic neurons in the mouse fore-
brain. Proceedings of the National Academy of Sciences of the United
States of America, 100, 9005–9010. https://doi.org/10.1073/pnas.
1537759100
How to cite this article: Garas FN, Kormann E, Shah RS, et al.
Structural and molecular heterogeneity of calretinin-expressing
interneurons in the rodent and primate striatum. J Comp Neurol.
2018;526:877–898. https://doi.org/10.1002/cne.24373
898 | The Journal ofComparative Neurology
GARAS ET AL.