Structural Analysis of thin isotropic and orthotropic ...
12
SSRG International Journal of Mechanical Engineering (SSRG - IJME) – Volume 4 Issue 6 June 2017 ISSN: 2348 – 8360 www.internationaljournalssrg.org Page 13 Structural Analysis of Thin Isotropic and Orthotropic Plates using Finite Element Analysis V. J. K. Silpa 1 , B. V. S. Raghu Vamsi 2* , K. Gowtham Kumar 3 1,3 -PG Student, Department of Mechanical Engineering, Gudlavalleru Engineering College, India 2 -Sr Gr Assistant Professor, Department of Mechanical Engineering, Gudlavalleru Engineering College, India Abstract The strength and stability of a structural member is affected by the discontinuity and its features, namely geometry, position, and dimensions determined during the design process. It results in localization of stresses resulting in excessive plastic deformation leading to distortion. The failure mode may get transformed to distortion; or tearing; or buckling, depending on the boundary as well as loading conditions. In this work the structural response of a thin plate with a circular hole subject to various boundary conditions is studied. The response of the plate is studied by performing stress, modal and buckling analysis. The effect of parameters like d/w (hole diameter to plate width) ratio, location of the hole & support conditions on the stress concentration factor, natural frequency, mode shape and buckling load is presented for isotropic and orthotropic materials. The d/w ratio is varied over a span of 0.1 - 0.5 with an incremental step of 0.1. The study concludes that increase in d/w ratio results in increase of frequency ratio & deflection ratio which is because of decrease in the stiffness of the material. In addition that it has been observed that the stress concentration factor and buckling load factor decreased with increase of d/w ratio. Keywords — Finite element analysis Structural response, stress concentration factor, buckling factor, frequency ratio I. INTRODUCTION During the design process, discontinuities generated for weight reduction or assembly of components, will greatly affect the stiffness as well as strength of the material. This results in increased rate of energy release thereby accelerating the permanent failure. Lot of research has been carried out to study the response of plates with cutouts subject to various boundary conditions. Nitin Kumar Jain [1] analyzed the effect of D/A ratio on the stress concentration and distribution of stress and deflections in a rectangular plate with a central circular cutout made of isotropic and orthotropic materials using finite element analysis. Sasi Kumar et. al [2] performed the modal analysis to study the response of a rectangular plate with central circular cutout and studied the effect of aspect ratio, ratio of diameter of the hole to plate width, thickness of the ply and orientation of the fibres on the natural frequencies and mode shapes. Nagpal et. al [3] presented a critical review and compared the various methods like analytical, numerical and experimental methods proposed to study the response of rectangular plates with central circular and elliptical cutouts available in the literature. Hwai-Chung Wu et. al [4] proposed computational model to estimate the stress concentration factors in isotropic as well as orthotropic rectangular plate as well as cylinder with circular cutout under uniaxial and biaxial tension. P. Srikanth et. al [5] performed the finite element analysis to study the deformations and stresses induced in beams and plates made of carbon fiber and Eglass/epoxy subject to different boundary conditions. Banerjee et. al [6] conducted a detailed analysis of rectangular plate with central circular cutout with all edges fixed using finite element analysis to study the effect of various parameters like thickness to plate width ratio, diameter to width ratio and material properties on the stress concentration calculated using stresses in different directions. Vanam et. al. [7] studied the static response of an isotropic rectangular plate subject to uniformly distributed transverse load using numerical solution (finite element analysis), classical solution and simulation in ANSYS for different loadings and boundary conditions. Devidas R. Patil el. al [8] performed the modal analysis of a rectangular plate to study the effect of boundary conditions, plate width to length ratio, and thickness ratio on the vibrational characteristics of the plate. Okafor et. al [9] proposed the analytical solution for
Transcript of Structural Analysis of thin isotropic and orthotropic ...

SSRG International Journal of Mechanical Engineering (SSRG - IJME) – Volume 4 Issue 6 June 2017
ISSN: 2348 – 8360 www.internationaljournalssrg.org Page 13
Structural Analysis of Thin Isotropic and
Orthotropic Plates using Finite Element
Analysis
V. J. K. Silpa1, B. V. S. Raghu Vamsi
2*, K. Gowtham Kumar
3
1,3-PG Student, Department of Mechanical Engineering, Gudlavalleru Engineering College, India 2-Sr Gr Assistant Professor, Department of Mechanical Engineering, Gudlavalleru Engineering College, India
Abstract
The strength and stability of a structural
member is affected by the discontinuity and its
features, namely geometry, position, and dimensions
determined during the design process. It results in
localization of stresses resulting in excessive plastic
deformation leading to distortion. The failure mode
may get transformed to distortion; or tearing; or
buckling, depending on the boundary as well as
loading conditions. In this work the structural
response of a thin plate with a circular hole subject to
various boundary conditions is studied. The response
of the plate is studied by performing stress, modal and
buckling analysis. The effect of parameters like d/w
(hole diameter to plate width) ratio, location of the
hole & support conditions on the stress concentration
factor, natural frequency, mode shape and buckling
load is presented for isotropic and orthotropic
materials. The d/w ratio is varied over a span of 0.1 -
0.5 with an incremental step of 0.1. The study
concludes that increase in d/w ratio results in increase
of frequency ratio & deflection ratio which is because
of decrease in the stiffness of the material. In addition
that it has been observed that the stress concentration
factor and buckling load factor decreased with
increase of d/w ratio.
Keywords — Finite element analysis Structural
response, stress concentration factor, buckling factor,
frequency ratio
I. INTRODUCTION
During the design process, discontinuities
generated for weight reduction or assembly of
components, will greatly affect the stiffness as well as
strength of the material. This results in increased rate
of energy release thereby accelerating the permanent
failure. Lot of research has been carried out to study
the response of plates with cutouts subject to various
boundary conditions. Nitin Kumar Jain [1] analyzed
the effect of D/A ratio on the stress concentration and
distribution of stress and deflections in a rectangular
plate with a central circular cutout made of isotropic
and orthotropic materials using finite element
analysis. Sasi Kumar et. al [2] performed the modal
analysis to study the response of a rectangular plate
with central circular cutout and studied the effect of
aspect ratio, ratio of diameter of the hole to plate
width, thickness of the ply and orientation of the fibres
on the natural frequencies and mode shapes. Nagpal et.
al [3] presented a critical review and compared the
various methods like analytical, numerical and
experimental methods proposed to study the response
of rectangular plates with central circular and elliptical
cutouts available in the literature. Hwai-Chung Wu et.
al [4] proposed computational model to estimate the
stress concentration factors in isotropic as well as
orthotropic rectangular plate as well as cylinder with
circular cutout under uniaxial and biaxial tension. P.
Srikanth et. al [5] performed the finite element
analysis to study the deformations and stresses
induced in beams and plates made of carbon fiber and
Eglass/epoxy subject to different boundary conditions.
Banerjee et. al [6] conducted a detailed analysis of
rectangular plate with central circular cutout with all
edges fixed using finite element analysis to study the
effect of various parameters like thickness to plate
width ratio, diameter to width ratio and material
properties on the stress concentration calculated using
stresses in different directions. Vanam et. al. [7]
studied the static response of an isotropic rectangular
plate subject to uniformly distributed transverse load
using numerical solution (finite element analysis),
classical solution and simulation in ANSYS for
different loadings and boundary conditions. Devidas
R. Patil el. al [8] performed the modal analysis of a
rectangular plate to study the effect of boundary
conditions, plate width to length ratio, and thickness
ratio on the vibrational characteristics of the plate.
Okafor et. al [9] proposed the analytical solution for
SSRG International Journal of Mechanical Engineering (SSRG - IJME) – Volume 4 Issue 6 June 2017
ISSN: 2348 – 8360 www.internationaljournalssrg.org Page 14
the static analysis of an isotropic rectangular plate
subject to various boundary conditions by employing
the Direct variational Ritz method. Ming-Hung Hsu
[10] presented a numerical solution for studying the
vibration response of isotropic and orthotropic plates
using differential quadrature method (DQM).
II. FINITE ELEMENT ANALYSIS
In this work the natural frequencies &
corresponding ratio's , principal stresses, stress
concentration factor's , maximum shear stress are
determined numerically using finite element analysis
software ANSYS.
A. Modeling
Two thin composite plates of size 1m x 1m
and 1m x 0.5m of each 1mm thickness are considered
in this analysis the plate is assumed to contain a hole
of diameter 'd' such that it is related to the plate width
'w'.
d/w ratio is varied as between 0.1 to 0.5 with an
interval of 0.1. The position of the hole is assumed to
be
a. Centre of the plate.
b. Nearer to the shortest end.
c. Nearer to the longest end.
d. Nearer to the corner.
Fig. a Plate without hole Fig. b Plate with central
circular hole
Fig. c Plate with hole at Fig. d plate with hole at
shortest edge longest edge
Fig .e Plate with hole at corner
B. Material properties
In this work two materials are considered.
1) Carbon/epoxy. TABLE: I
MATERIAL PROPERTIES OF CARBON/EPOXY
Young's
modulus (E)
Shear
Modulus (G)
Poisson's
ratio
Ex=130 Gpa GXY=4.8 Gpa XY=0.28
Ey=9 Gpa YZ=4.8 Gpa YZ=0.28
Ez=9 Gpa ZX=4.8 Gpa ZX=0.28
Density=1656 kg/m3
2) Aluminum 6061
Young's modulus(E) = 71.2 Gpa
Poisson's ratio = 0.3
Density = 2700 kg/m3
C. Meshing
The rectangular plate has been meshed with
shell 3D 4node 181. It is a 3-D element having 3 DOF
at each node (translation in 3 directions-ux, uy, uz).
Number of elements generated in stress analysis,
modal analysis and buckling analysis are 1006, 40254
and 2452 respectively.
D. Boundary conditions
Two edge conditions are considered in the analysis.
i. All edges are fixed.
ii. Alternate edges are fixed & hinged.
Considering the self weight of the plate, stress and
vibration analysis are performed to determine the
parameters like principal stresses, maximum stresses,
stress concentration factor, mode shapes, natural
frequencies and von mises stresses.
E. Analysis performed
In this work the following analysis are
performed to study the structural response of a thin
rectangular composite plate
1. Stress analysis - In this analysis, parameters
like stress concentration factor's, principal stresses
& von-mises stresses, deflection ratio's are
determined in a thin composite lamina subjected
to its self weight. The analysis is carried out on
the plate with & without hole and the results are
compared with those obtained for an isotropic
plate under the same conditions.
Deflection ratio: It is defined as the ratio of
deflection of the plate with hole to without hole
Stress concentration factor: It is defined as the
ratio of stress concentration of the plate with hole
to without hole
2. Modal analysis - The natural frequencies and the
corresponding mode shapes are determined for the
rectangular plate as well as Square plate made of
isotropic & orthotropic materials,
The frequency ratio's and the normalized mode
shapes are calculated for the various aspect ratio's
& d/w ratio's.
Frequency ratio: It is defined as the ratio of
natural frequency of the plate with hole to without
hole.
3. Buckling analysis - In general thin components
will fail in buckling because of excessive lateral
deflections. Hence there is a need to determine the
critical load at which the buckling will initiate.
Sheet metals fail by buckling because of lesser
strength and resistive area.
In this work buckling load is calculated in the thin
lamina made of isotropic & orthotropic materials
and the buckling load factor is calculated for
various conditions.

SSRG International Journal of Mechanical Engineering (SSRG - IJME) – Volume 4 Issue 6 June 2017
ISSN: 2348 – 8360 www.internationaljournalssrg.org Page 15
Buckling load factor: It is the ratio of buckling
loads to the applied loads.
III. RESULTS
Graphs are plotted to present the variation of
stress concentration factor's, frequency ratio's, mode
shapes, maximum stresses& von mises stresses.
A. Effect on frequency ratio For mode I
d/w ratio
0.1 0.2 0.3 0.4 0.5
Fre
que
ncy
ratio
0.8
1.0
1.2
1.4
1.6
1.8
2.0
2.2
2.4
2.6
2.8
Central hole-FFFF
Near to shortest edge-FFFF
Near to longest edge-FFFF
Near to corner-FFFF
Central hole-SFSF
Near to shotest edge-SFSF
Near to longest edge-SFSF
Near to corner-SFSF
Fig 1a: Square plate for mode I- Carbon/Epoxy
For mode-II
d/w ratio
0.1 0.2 0.3 0.4 0.5
Fre
que
ncy
ratio
1.2
1.4
1.6
1.8
2.0
2.2
2.4
2.6
Central hole-FFFF
Near to shortest edge-FFFF
Near to longest edge-FFFF
Near to corner-FFFF
Central hole-SFSF
Near to shortest edge-SFSF
Near to longest edge-SFSF
Near to corner-SFSF
Fig 1b: Square plate for mode II- Carbon/Epoxy
For mode III
d/w ratio
0.1 0.2 0.3 0.4 0.5
Fre
que
ncy
ratio
0.8
1.0
1.2
1.4
1.6
1.8
2.0
2.2
Central hole-FFFF
Near to shortest edge-FFFF
Near to longest edge-FFFF
Near to corner-FFFF
Central hole-SFSF
Near to shortest edge-SFSF
Near to longest edge-SFSF
Near to corner-SFSF
Fig 1c: Square plate for mode III- Carbon/Epoxy
For modeI
d/w ratio
0.1 0.2 0.3 0.4 0.5
Fre
que
ncy
ratio
0.9
1.0
1.1
1.2
1.3
1.4
1.5
1.6
1.7
Central hole-FFFF
Near to shortest edge-FFFF
Near to longest edge-FFFF
Near to corner-FFFF
Central hole-SFSF
Near to shortest edge-SFSF
Near to longest edge-SFSF
Near to corner-SFSF
Fig
2a: Square plate for mode I-Al-6061
For mode II
d/w ratio
0.1 0.2 0.3 0.4 0.5
Fre
que
ncy
ratio
0.90
0.95
1.00
1.05
1.10
1.15
1.20
Central hole-FFFF
Near to shortest edge-FFFF
Near to longest edge-FFFF
Near to corner-FFFF
Central hole-SFSF
Near to shortest edge-SFSF
Near to longest edge-SFSF
Near to corner-SFSF
Fig 2b: Square plate for mode II-Al-6061
For modeIII
d/w ratio
0.1 0.2 0.3 0.4 0.5
Fre
que
ncy
ratio
0.9
1.0
1.1
1.2
1.3
1.4
Central hole-FFFF
Near to shortest edge-FFFF
Near to longest edge-FFFF
Near to corner-FFFF
Central hole-SFSF
Near to shortest edge-SFSF
Near to longest edge-SFSF
Near to corner-SFSF
Fig 2c: Square plate for mode III-Al-6061

SSRG International Journal of Mechanical Engineering (SSRG - IJME) – Volume 4 Issue 6 June 2017
ISSN: 2348 – 8360 www.internationaljournalssrg.org Page 16
For mode I
d/w ratio
0.1 0.2 0.3 0.4 0.5
Fre
que
ncy
ratio
1.4
1.6
1.8
2.0
2.2
2.4
2.6
Central hole-FFFF
Near to shortest edge-FFFF
Near to longest edge-FFFF
Near to corner-FFFF
Central hole-SFSF
Near to shortest edge-SFSF
Near to longest edge-SFSF
Near to corner-SFSF
Fig 3a: Rectangle plate for mode I -Carbon/Epoxy
For mode II
d/w ratio
0.1 0.2 0.3 0.4 0.5
Fre
que
ncy
ratio
0.8
1.0
1.2
1.4
1.6
1.8
2.0
2.2
2.4
2.6
Central hole-FFFF
Near to shortest edge-FFFF
Near to longest edge-FFFF
Near to corner-FFFF
Central hole-SFSF
Near to shortest edge-SFSF
Near to longest edge-SFSF
Near to corner-SFSF
Fig 3b: Rectangle plate for mode II -Carbon/Epoxy
For mode III
d/w ratio
0.1 0.2 0.3 0.4 0.5
Fre
que
ncy
ratio
1.4
1.5
1.6
1.7
1.8
1.9
2.0
2.1
Central hole-FFFF
Near to shortest edge-FFFF
Near to longest edge-FFFF
Near to corner-FFFF
Central hole-SFSF
Near to shortest edge-SFSF
Near to longest edge-SFSF
Near to corner-SFSF
Fig 3c: Rectangle plate for mode III -Carbon/Epoxy
For mode I
d/w ratio
0.1 0.2 0.3 0.4 0.5
Fre
que
ncy
ratio
0.96
0.98
1.00
1.02
1.04
1.06
1.08
1.10
1.12
1.14
1.16
Central hole-FFFF
Near to shortest edge-FFFF
Near to longest edge-FFFF
Near to corner-FFFF
Central hole-SFSF
Near to shortest edge- SFSF
Near to longest edge- SFSF
Near to corner- SFSF
Fig 4a: Rectangle plate for mode I-Al-6061
For mode II
d/w ratio
0.1 0.2 0.3 0.4 0.5
Fre
que
ncy
ratio
0.94
0.96
0.98
1.00
1.02
1.04
1.06
1.08
1.10
1.12
Central hole-FFFF
Near to shortest edge-FFFF
Near to longest edge-FFFF
Near to corner-FFFF
Central hole-SFSF
Near to shortest edge- SFSF
Near to longest edge- SFSF
Near to corner- SFSF
Fig 4b: Rectangle plate for mode II-Al-6061
For mode III
d/w ratio
0.1 0.2 0.3 0.4 0.5
Fre
que
ncy
ratio
0.95
1.00
1.05
1.10
1.15
1.20
1.25
Central hole-FFFF
Near to shortest edge-FFFF
Near to longest edge-FFFF
Near to corner-FFFF
Central hole-SFSF
Near to shortest edge- SFSF
Near to longest edge- SFSF
Near to corner- SFSF
Fig 4c: Rectangle plate for mode III-Al-6061
The natural frequencies determined for plates
with holes are normalized taking the corresponding
frequencies of plate without hole for all the modes.
The obtained frequency ratio's are plotted against d/w
ratio's for various conditions as shown in fig 1a to 4c.
With increase in d/w ratio the frequency ratio is
observed to be increasing for both rectangle as well as
square plates.
In the case of fundamental frequency (mode-
I), the frequency ratio is observed to be increasing
with d/w ratio. In the case of Carbon/Epoxy, the
maximum is observed at d/w=0.5 with hole located at
centre of the plate subject to S-F-S-F in both
rectangular as well as square plates whereas for the

SSRG International Journal of Mechanical Engineering (SSRG - IJME) – Volume 4 Issue 6 June 2017
ISSN: 2348 – 8360 www.internationaljournalssrg.org Page 17
same location and with same dimension the maximum
is observed with F-F-F-F boundary condition in the
case of Al-6061 square plate. Also in the case of
rectangular plate the maximum is observed at d/w=0.5
with hole nearer to longest edge subject to S-F-S-F. In
addition, it has been observed that fundamental
frequency ratio is remaining same for all boundary
conditions and hole positions at d/w=0.1 in both
rectangular as well as square plates in Al-6061. Also,
the frequency ratio decreased in the case of rectangular
plate with hole nearer to corner subject to S-F-S-F in
Al-6061.
In the case of square plates, the mode-II
frequency ratio remained same for some conditions
and increased for the hole positions nearer to shorter
edge subject to S-F-S-F and central circular hole
subject to F-F-F-F in Carbon/Epoxy. In Al-6061plates,
the frequency ratio decreased gradually for all
conditions except in the plate with hole nearer to
shorter edge subject to S-F-S-F. The maximum is
observed at d/w=0.5 in the plate with hole nearer to
shorter edge subject to S-F-S-F in Carbon/Epoxy as
well as Al-6061exponentially and minimum at
d/w=0.4 in the plate with central circular hole subject
to F-F-F-F. In rectangular plates, frequency ratio
almost remained same for all boundary conditions
except for plate with hole nearer to shorter edge
subject to F-F-F-F where the frequency ratio increased
gradually in Carbon/Epoxy. In Al-6061 the frequency
ratio decreased gradually for all conditions except for
hole nearer to shorter edge subject to S-F-S-F where
the frequency ratio increased. The maximum is
observed at d/w=0.5 with hole location nearer to
shorter edge subject to S-F-S-F in both Carbon/Epoxy
and Al-6061. The minimum is observed at d/w=0.5
with hole located at the centre of the plate subject to F-
F-F-F. At lower d/w ratios (<0.1), all the conditions
are having same frequency ratio.
In the case of square plates, the mode-III
frequency ratio increased gradually in both
Carbon/Epoxy and Al-6061 except in plate with
central circular hole subject to F-F-F-F in Al-6061
where the ratio decreased gradually. The maximum
has been observed at d/w=0.5 with hole located at the
centre of the plate subject to S-F-S-F in both
Carbon/Epoxy and Al-6061. The minimum is
observed at d/w=0.4 in plate with central circular hole
subject to F-F-F-F condition. In case of rectangular
plates, the frequency ratio increased gradually in both
Carbon/Epoxy and Al-6061 except in plate with hole
nearer to the corner subject to S-F-S-F where it
decreased gradually. The maximum is observed at
d/w=0.5 in plate with central circular hole subject to
S-F-S-F in Carbon/Epoxy and F-F-F-F in Al-6061 and
the minimum is observed at d/w=0.5 in the plate with
hole nearer to longest edge subject to F-F-F-F in
Carbon/Epoxy whereas in plate with hole nearer to the
corner subject to S-F-S-F in Al-6061.
B. Effect on deflection ratio
For mode I
d/w ratio
0.1 0.2 0.3 0.4 0.5
Def
lect
ion
ratio
0.8
1.0
1.2
1.4
1.6
1.8
2.0
Central hole-FFFF
Near to shortest edge-FFFF
Near to longest edge-FFFF
Near to corner-FFFF
Central hole-SFSF
Near to shortest edge-SFSF
Near to longest edge-SFSF
Near to corner-SFSF
Fig 5a: Square plate for mode I-Carbon/Epoxy
For mode II
d/w ratio
0.1 0.2 0.3 0.4 0.5
Def
lect
ion
ratio
0.8
1.0
1.2
1.4
1.6
1.8
2.0
2.2
Central hole-FFFF
Near to shortest edge-FFFF
Near to longest edge-FFFF
Near to corner-FFFF
Central hole-SFSF
Near to shortest edge-SFSF
Near to longest edge-SFSF
Near to corner-SFSF
Fig 5b: Square plate for mode II- Carbon/Epoxy
For mode III
d/w ratio
0.1 0.2 0.3 0.4 0.5
Def
lect
ion
ratio
0.8
1.0
1.2
1.4
1.6
1.8
2.0
2.2
2.4
Centrl hole-FFFF
Near to shortest edge-FFFF
Near to longest edge-FFFF
Near to corner-FFFF
Central hole-SFSF
Near to shortest edge-SFSF
Near to longest edge-SFSF
Near to corner-SFSF
Fig 5c: Square plate for mode III- Carbon/Epoxy
SSRG International Journal of Mechanical Engineering (SSRG - IJME) – Volume 4 Issue 6 June 2017
ISSN: 2348 – 8360 www.internationaljournalssrg.org Page 18
For modeI
d/w ratio
0.1 0.2 0.3 0.4 0.5
Def
lect
ion
ratio
0.9
1.0
1.1
1.2
1.3
1.4
1.5
1.6
1.7
Central hole-FFFF
Near to shortest edge-FFFF
Near to longest edge-FFFF
Near to corner-FFFF
Central hole-SFSF
Near to shortest edge-SFSF
Near to longest edge-SFSF
Near to corner-SFSF
Fig 6a: Square plate for mode I-Al-6061
For modeII
d/w ratio
0.1 0.2 0.3 0.4 0.5
Def
lect
ion
ratio
0.8
1.0
1.2
1.4
1.6
1.8
2.0
2.2
Central hole-FFFF
Near to shortest edge-FFFF
Near to longest edge-FFFF
Near to corner-FFFF
Central hole-SFSF
Near to shortest edge-SFSF
Near to longest edge-SFSF
Near to corner-SFSF
Fig 6b: Square plate for mode II-Al-6061
For mode III
d/w ratio
0.1 0.2 0.3 0.4 0.5
Def
lect
ion
ratio
0.9
1.0
1.1
1.2
1.3
1.4
1.5
1.6
1.7
Central hole-FFFF
Near to shortest edge-FFFF
Near to longest edge-FFFF
Near to corner-FFFF
Central hole-SFSF
Near to shortest edge-SFSF
Near to longest edge-SFSF
Near to corner-SFSF
Fig 6c: Square plate for mode III-Al-6061 For mode I
d/w ratio
0.1 0.2 0.3 0.4 0.5
Def
lect
ion
ratio
0.8
1.0
1.2
1.4
1.6
1.8
2.0
Central hole-FFFF
Near to shortest edge-FFFF
Near to longest edge-FFFF
Near to corner-FFFF
Central hole-SFSF
Near to shortestedge-SFSF
Near to longest edge-SFSF
Near to corner-SFSF
Fig 7a: Rectangle plate for mode I- Carbon/Epoxy For mode II
d/w ratio
0.1 0.2 0.3 0.4 0.5
Def
lect
ion
ratio
0.7
0.8
0.9
1.0
1.1
1.2
1.3
1.4
Central hole-FFFF
Near to shortest edge-FFFF
Near to longest edge-FFFF
Near to corner-FFFF
Central hole-SFSF
Near to shortest edge-SFSF
Near to longest edge-SFSF
Near to corner-SFSF
Fig 7b: Rectangle plate for mode II- Carbon/Epoxy
For mode III
d/w ratio
0.1 0.2 0.3 0.4 0.5
Def
lect
ion
ratio
0.8
1.0
1.2
1.4
1.6
1.8
2.0
2.2
2.4
2.6
Central hole-FFFF
Near to shortest edge-FFFF
Near to longest edge-FFFF
Near to corner-FFFF
Central hole-SFSF
Near to shortest edge-SFSF
Near to longest edge-SFSF
Near to corner-SFSF
Fig 7c: Rectangle plate for mode III- Carbon/Epoxy
For mode I
d/w ratio
0.1 0.2 0.3 0.4 0.5
Def
lect
ion
ratio
0.9
1.0
1.1
1.2
1.3
1.4
1.5
1.6
Central hole-FFFF
Near to shortest edge-FFFF
Near to longest edge-FFFF
Near to corner-FFFF
Central hole-SFSF
Near to shortest edge- SFSF
Near to longest edge- SFSF
Near to corner- SFSF
Fig 8a: Rectangle plate for mode I-Al-6061
SSRG International Journal of Mechanical Engineering (SSRG - IJME) – Volume 4 Issue 6 June 2017
ISSN: 2348 – 8360 www.internationaljournalssrg.org Page 19
For mode II
d/w ratio
0.1 0.2 0.3 0.4 0.5
Def
lect
ion
ratio
0.9
1.0
1.1
1.2
1.3
1.4
Central hole-FFFF
Near to shortest edge-FFFF
Near to longest edge-FFFF
Near to corner-FFFF
Central hole-SFSF
Near to shortest edge- SFSF
Near to longest edge- SFSF
Near to corner- SFSF
Fig 8b: Rectangle plate for mode II-Al-6061
For mode III
d/w ratio
0.1 0.2 0.3 0.4 0.5
Def
lect
ion
ratio
0.8
1.0
1.2
1.4
1.6
1.8
2.0
2.2
2.4
2.6
2.8
Central hole-FFFF
Near to shortest edge-FFFF
Near to longest edge-FFFF
Near to corner-FFFF
Central hole-SFSF
Near to shortest edge- SFSF
Near to longest edge- SFSF
Near to corner- SFSF
Fig 8c: Rectangle plate for mode III-Al-6061
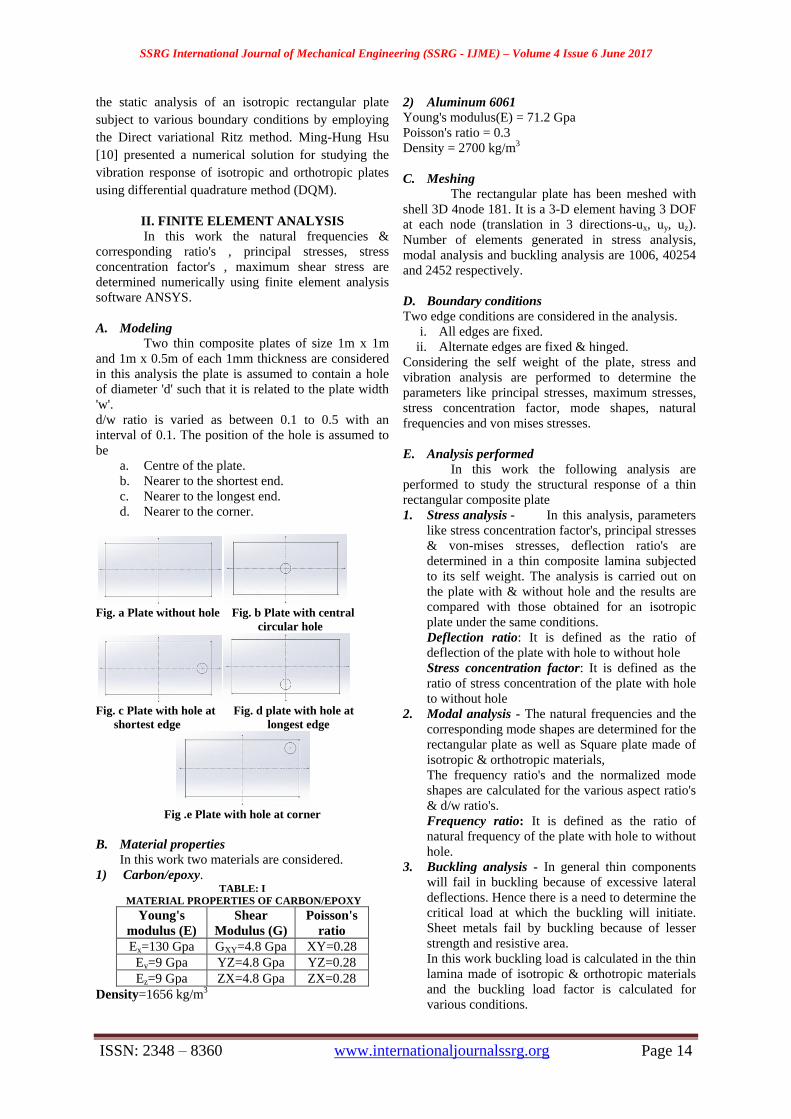
The normalized deflections are plotted with
respect to d/w ratio and are presented in fig 5a to8c.
With increase in d/w ratio the deflection ratio is
observed to be increasing for both rectangle as well as
square plates in Carbon/Epoxy and Al-6061.
In the case of mode-I deflection ratio is
observed to be maximum at d/w=0.5 in square plates
with hole near to shortest edge subject to S-F-S-F &
minimum at d/w ratio=0.1 with central circular hole
subject to F-F-F-F, hole near to longest edge subject to
S-F-S-F in both Carbon/Epoxy and Al-6061. In case of
rectangular plates deflection ratio is observed to be
maximum at d/w=0.5 with hole near to shortest edge
subject to S-F-S-F in Al-6061 and central circular
hole in Carbon/Epoxy & minimum at d/w ratio=0.1
with hole near to corner subject to F-F-F-F in both
Carbon/Epoxy and Al-6061.
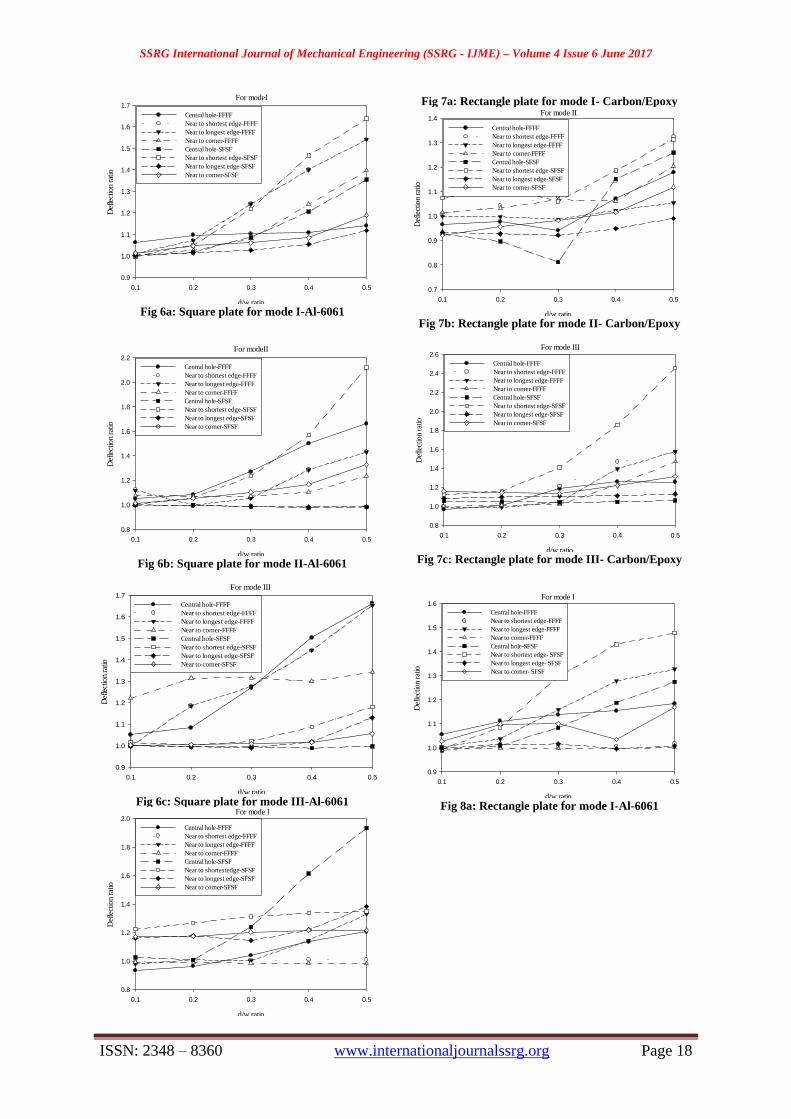
In the case of mode II deflection ratio is
observed to be maximum at d/w=0.5 in square plates
with hole near to shortest edge subject to S-F-S-F in
both Carbon/Epoxy and Al-6061 & minimum at d/w
ratio=0.1 with central circular hole subject to
boundary condition-SFSF. In case of rectangular
plates deflection ratio is observed to be maximum at
d/w=0.5 with hole near to shortest edge subject to F-
F-F-F in both Carbon/Epoxy and Al-6061 &
minimum at d/w ratio=0.1 with central circular hole
subject to boundary condition-SFSF in both the
materials.
In the case of mode III deflection ratio is
observed to be increasing with d/w ratio and the
maximum is observed at d/w=0.5 with hole near to
shortest edge subject to S-F-S-F in both square and
rectangular plates in Carbon/Epoxy and rectangular
plate in Al-6061 and in plate with central circular
hole subject to F-F-F-F in Al-6061. The minimum is
observed at d/w ratio=0.2 in square plate with hole
near to corner subject to S-F-S-F in Carbon/Epoxy
and at d/w=0.4 in rectangular plate with central
circular hole subject to S-F-S-F in both
Carbon/Epoxy and Al-6061. The minimum in
rectangular plate made of Carbon/Epoxy is observed
at d/w=0.1 with hole located at the centre of the plate
subject to F-F-F-F.
C. Effect on stress concentration factor Principal stress-1
d/w ratio
0.1 0.2 0.3 0.4 0.5
Str
ess
conc
entr
atio
n fa
cto
r
1.00
1.05
1.10
1.15
1.20
1.25
1.30
1.35
Central hole-FFFF
Near to shortest edge_FFFF
Near to longest edge-FFFF
Near to corner-FFFF
Central hole-SFSF
Near to shortest edge-SFSF
Near to longest edge-SFSF
Near to corner-SFSF
Fig 9a: Square plate for Carbon/Epoxy
Principal stress-2
d/w ratio
0.1 0.2 0.3 0.4 0.5
Str
ess
conc
entr
atio
n fa
ctor
1.7
1.8
1.9
2.0
2.1
2.2
2.3
2.4
Central hole-FFFF
Near to shortest edge-FFFF
Near to longest edge-FFFF
Near to corner-FFFF
Central hole-SFSF
Near to shortest edge-SFSF
Near to longest edge-SFSF
Near to corner-SFSF
Fig 9b: Square plate for Carbon/Epoxy
principal stress-3
d/w ratio
0.1 0.2 0.3 0.4 0.5
Str
ess
co
ncentr
atio
n f
acto
r
0.8
1.0
1.2
1.4
1.6
1.8
2.0
Central hole-FFFF
Near to shortest edge-FFFF
Near to longest edge-FFFF
Near to corner-FFFF
Central hole-SFSF
Near to shortest edge-SFSF
Near to longest edge-SFSF
Near to corner-SFSF
Fig 9c: Square plate for Carbon/Epoxy

SSRG International Journal of Mechanical Engineering (SSRG - IJME) – Volume 4 Issue 6 June 2017
ISSN: 2348 – 8360 www.internationaljournalssrg.org Page 20
Principal stress-1
d/w ratio
0.1 0.2 0.3 0.4 0.5
Str
ess
conc
entr
atio
n fa
ctor
0.65
0.70
0.75
0.80
0.85
0.90
0.95
1.00
1.05
Central hole-FFFF
Near to shortest edge-FFFF
Near to longest edge-FFFF
Near to corner-FFFF
Central hole-SFSF
Near to shortest edge- SFSF
Near to longest edge- SFSF
Near to corner- SFSF
Fig 10a: Square plate Al-6061
Principal stress-2
d/w ratio
0.1 0.2 0.3 0.4 0.5
Str
ess
conc
entr
atio
n fa
ctor
0.65
0.70
0.75
0.80
0.85
0.90
0.95
1.00
1.05
Central hole-FFFF
Near to shortest edge-FFFF
Near to longest edge-FFFF
Near to corner-FFFF
Central hole-SFSF
Near to shortest edge- SFSF
Near to longest edge- SFSF
Near to corner- SFSF
Fig 10b: Square plate for Al-6061
Principal stress-3
d/w ratio
0.1 0.2 0.3 0.4 0.5
Str
ess
conc
entr
atio
n fa
cto
r
0.5
0.6
0.7
0.8
0.9
1.0
1.1
Central hole-FFFF
Near to shortest edge-FFFF
Near to longest edge-FFFF
Near to corner-FFFF
Central hole-SFSF
Near to shortest edge- SFSF
Near to longest edge- SFSF
Near to corner-SFSF
Fig 10c: Square plate Al-6061
Principal stress-1
d/w ratio
0.1 0.2 0.3 0.4 0.5
Str
ess
conc
entr
atio
n fa
cto
r
1.00
1.05
1.10
1.15
1.20
1.25
1.30
1.35
Central hole-FFFF
Near to shortest edge-FFFF
Near to longest edge-FFFF
Near to corner-FFFF
Central hole-SFSF
Near to shortest edge-SFSF
Near to longest edge-SFSF
Near to corner-SFSF
Fig 11a: Rectangle plate for Carbon/Epoxy
Principal stress-2
d/w ratio
0.1 0.2 0.3 0.4 0.5
Str
ess
conc
entr
atio
n fa
cto
r
1.4
1.6
1.8
2.0
2.2
2.4
Central hole-FFFF
Near to shortest edge-FFFF
Near to longest edge-FFFF
Near to corner-FFFF
Central hole-SFSF
Near to shortest edge-SFSF
Near to longest edge-SFSF
Near to corner-SFSF
Fig 11b: Rectangle plate for Carbon/Epoxy
Principal stress-3
d/w ratio
0.1 0.2 0.3 0.4 0.5
Str
ess
conc
entr
atio
n fa
cto
r
1.1
1.2
1.3
1.4
1.5
1.6
Central hole-FFFF
Near to shortest edge-FFFF
Near to longest edge-FFFF
Near to corner-FFFF
Central hole-SFSF
Near to shortest edge-SFSF
Near to longest edge-SFSF
Near to corner-SFSF
Fig 11c: Rectangle plate for Carbon/Epoxy
Principal stress-1
d/w ratio
0.1 0.2 0.3 0.4 0.5
Str
ess
conc
entr
atio
n fa
ctor
0.90
0.92
0.94
0.96
0.98
1.00
1.02
1.04
Central hole-FFFF
Near to shortest edge-FFFF
Near to longest edge-FFFF
Near to corner-FFFF
Central hole-SFSF
Near to shortest edge- SFSF
Near to longest edge- SFSF
Near to corner- SFSF
Fig 12a: Rectangle plate for Al-6061
Principal stress-2
d/w ratio
0.1 0.2 0.3 0.4 0.5
Str
ess
conc
entr
atio
n fa
cto
r
0.88
0.90
0.92
0.94
0.96
0.98
1.00
1.02
1.04
Central hole-FFFF
Near to shortest edge-FFFF
Near to longest edge-FFFF
Near to corner-FFFF
Central hole-SFSF
Near to shortest edge- SFSF
Near to longest edge- SFSF
Near to corner- SFSF
Fig 12b: Rectangle plate for Al-6061

SSRG International Journal of Mechanical Engineering (SSRG - IJME) – Volume 4 Issue 6 June 2017
ISSN: 2348 – 8360 www.internationaljournalssrg.org Page 21
Principal stress-3
d/w ratio
0.1 0.2 0.3 0.4 0.5
Str
ess
conc
entr
atio
n fa
ctor
0.90
0.92
0.94
0.96
0.98
1.00
1.02
Central hole-FFFF
Near to shortest edge-FFFF
Near to longest edge-FFFF
Near to corner-FFFF
Central hole-SFSF
Near to shortest edge- SFSF
Near to longest edge- SFSF
Near to corner- SFSF
Fig 12c: Rectangle plate for Al-6061
The stress concentration factors (SCF) are
plotted with respect to d/w ratio and are presented in
fig 9a to 12c. With the increase in the d/w ratio, the
SCF is observed to be decreasing with maximum at
d/w=0.1 and minimum being at d/w=0.5. This trend is
observed for all the boundary conditions. This is
because of decrease in the effective area resisting the
forces resulting in decrease of stiffness as well
strength. Ultimately the plate will fail in tearing mode.
D. SCF based on Principal Stress-1
In case of square plate, maximum SCF is
observed at d/w=0.1 with hole near to corner subject
to boundary condition-SFSF in Carbon/Epoxy and at
d/w=0.3 with hole nearer to corner subject to S-F-S-F
boundary condition in Al-6061 and lowest SCF is
observed at d/w=0.5 for central circular hole with S-F-
S-F boundary condition for Al-6061than compared
with Carbon/Epoxy.
In case of rectangular plate, SCF is observed
to be maximum at d/w=0.1 with central circular hole
subject to S-F-S-F in Carbon//Epoxy and d/w=0.3 with
hole nearer to corner subject to S-F-S-F in AL-6061
whereas minimum is observed at d/w=0.5 for both Al-
6061 and Carbon/Epoxy with central circular hole
subject to S-F-S-F and with hole nearer to shortest
edge subject to F-F-F-F and S-F-S-F boundary
conditions respectively.
E. SCF based on Principal Stress-2
In case of square plate, the SCF is gradually
decreased with increase in d/w ratio in Al-6061
whereas the variation is non-uniform in
Carobn/Epoxy. The maximum SCF is observed at
d/w=0.2 in the plate with central circular hole and
nearer to longest edges subject to F-F-F-F in
Carbon/Epoxy, whereas at d/w=0.3 with hole nearer to
corner, shortest edge subject to F-F-F-F and longest
edge subject to S-F-S-F in Al-6061. The minimum
SCF is observed at d/w=0.5 in both Carbon/Epoxy and
Al-6061 with central circular hole subject to F-F-F-F
and S-F-S-F respectively.
In case of rectangular plate, the variation of
SCF is non-uniform with increase in d/w ratio made of
Carbon/Epoxy whereas uniform decrease is observed
in plate made of Al-6061. The maximum of SCF is
observed at d/w=0.5 with hole nearer to shortest edge
in Carbon/Epoxy and at d/w=0.3 with hole nearer to
longest edge and central circular hole subject to F-F-F-
F. The minimum of SCF is observed at d/w=0.2 and at
d/w=0.5 in plate with central circular hole subject to
S-F-S-F in both Carbon/Epoxy and Al-6061
respectively.
Also, it has been observed that the SCF is
increased slightly at all d/w ratios in Al-6061 with
hole nearer to corner and shortest edge subject to F-
F-F-F and S-F-S-F conditions respectively.
F. SCF based on Principal Stress-3
In case of square plate, the variation of SCF
is gradually decreasing with increase in d/w ratio in
both Carbon/Epoxy and Al-6061 materials. But in case
of hole positions nearer to corner and shortest edge
subject to S-F-S-F and F-F-F-F respectively, the SCF
increased gradually with increase in d/w ratio. The
maximum of SCF is observed at d/w=0.5 with hole
nearer to corner and shortest edge subject to S-F-S-F
and F-F-F-F respectively in Carbon/Epoxy and at
d/w=0.1 for all boundary conditions in Al-6061. The
minimum is observed at d/w=0.5 in both square and
rectangular plates with central circular hole subject to
F-F-F-F and S-F-S-F respectively and also hole nearer
to longest edge subject to S-F-S-F in Al-6061.
In case of rectangular plate, the SCF
decreased rapidly with d/w ratio in plate with central
circular hole subject to F-F-F-F in Carbon/Epoxy and
with central circular hole subject to S-F-S-F, nearer to
longest edge subject to F-F-F-F boundary conditions.
The maximum of SCF is observed at d/w=0.1 for all
hole positions and boundary conditions in both
Carbon/Epoxy and Al-6061. The minimum is
observed at d/w=0.5 for all boundary conditions and
hole positions in Carbon/Epoxy and Al-6061.
G. Effect on frequency ratio d/w ratio vs Maximum stress
d/w ratio
0.1 0.2 0.3 0.4 0.5
Max
imum
str
ess
1500
2000
2500
3000
3500
4000
Central hole-FFFF
Near to shortest edge-FFFF
Near to longest edge-FFFF
Near to corner-FFFF
Central hole-SFSF
Near to shortest edge-SFSF
Near to longest edge-SFSF
Near to corner-SFSF
Fig 13a: Square plate - σ max-Carbon/Epoxy
SSRG International Journal of Mechanical Engineering (SSRG - IJME) – Volume 4 Issue 6 June 2017
ISSN: 2348 – 8360 www.internationaljournalssrg.org Page 22
d/w ratio vs Maximum stress
d/w ratio
0.1 0.2 0.3 0.4 0.5
Max
imum
str
ess
2600
2800
3000
3200
3400
3600
3800
4000
4200
4400
Central hole-FFFF
Near to shortest edge-FFFF
Near to longest edge-FFFF
Near to corner-FFFF
Central hole-SFSF
Near to shortest edge- SFSF
Near to longest edge- SFSF
Near to corner- SFSF
Fig 13b: Square plate- σ max - Al-6061
d/w ratio vs Maximum stress
d/w ratio
0.1 0.2 0.3 0.4 0.5
Max
imum
str
ess
1400
1600
1800
2000
2200
2400
Central hole-FFFF
Near to shortest edge-FFFF
Near to longest edge-FFFF
Near to corner-FFFF
Central hole-SFSF
Near to shortest edge-SFSF
Near to longest edge-SFSF
Near to corner-SFSF
Fig 14a: Rectangle plate- σ max -Carbon/Epoxy
d/w ratio vs Maximum stress
d/w ratio
0.1 0.2 0.3 0.4 0.5
Max
imum
str
ess
2050
2100
2150
2200
2250
2300
2350
2400
Central hole-FFFF
Near to shortest edge-FFFF
Near to longest edge-FFFF
Near to corner-FFFF
Central hole-SFSF
Near to shortest edge- SFSF
Near to longest edge- SFSF
Near to corner- SFSF
Fig 14b: Rectangle plate- σ max - Al-6061
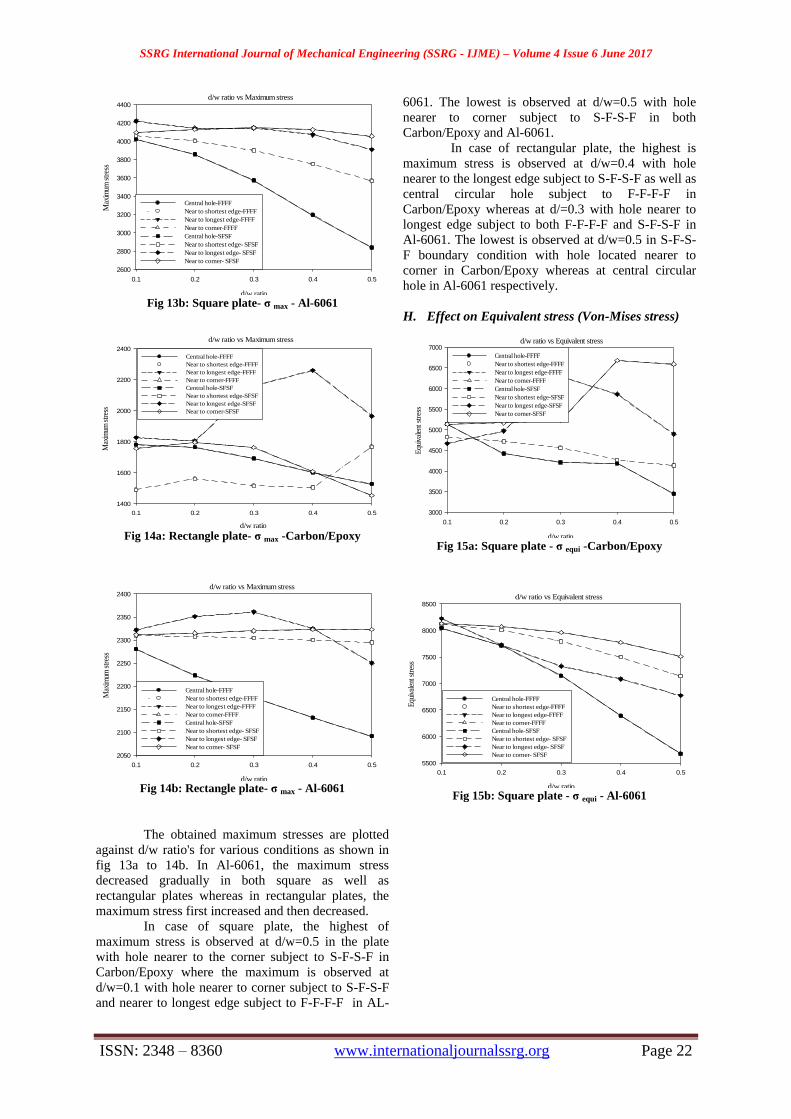
The obtained maximum stresses are plotted
against d/w ratio's for various conditions as shown in
fig 13a to 14b. In Al-6061, the maximum stress
decreased gradually in both square as well as
rectangular plates whereas in rectangular plates, the
maximum stress first increased and then decreased.
In case of square plate, the highest of
maximum stress is observed at d/w=0.5 in the plate
with hole nearer to the corner subject to S-F-S-F in
Carbon/Epoxy where the maximum is observed at
d/w=0.1 with hole nearer to corner subject to S-F-S-F
and nearer to longest edge subject to F-F-F-F in AL-
6061. The lowest is observed at d/w=0.5 with hole
nearer to corner subject to S-F-S-F in both
Carbon/Epoxy and Al-6061.
In case of rectangular plate, the highest is
maximum stress is observed at d/w=0.4 with hole
nearer to the longest edge subject to S-F-S-F as well as
central circular hole subject to F-F-F-F in
Carbon/Epoxy whereas at d/=0.3 with hole nearer to
longest edge subject to both F-F-F-F and S-F-S-F in
Al-6061. The lowest is observed at d/w=0.5 in S-F-S-
F boundary condition with hole located nearer to
corner in Carbon/Epoxy whereas at central circular
hole in Al-6061 respectively.
H. Effect on Equivalent stress (Von-Mises stress)
d/w ratio vs Equivalent stress
d/w ratio
0.1 0.2 0.3 0.4 0.5
Equi
vale
nt s
tres
s
3000
3500
4000
4500
5000
5500
6000
6500
7000
Central hole-FFFF
Near to shortest edge-FFFF
Near to longest edge-FFFF
Near to corner-FFFF
Central hole-SFSF
Near to shortest edge-SFSF
Near to longest edge-SFSF
Near to corner-SFSF
Fig 15a: Square plate - σ equi -Carbon/Epoxy
d/w ratio vs Equivalent stress
d/w ratio
0.1 0.2 0.3 0.4 0.5
Equ
ival
ent s
tres
s
5500
6000
6500
7000
7500
8000
8500
Central hole-FFFF
Near to shortest edge-FFFF
Near to longest edge-FFFF
Near to corner-FFFF
Central hole-SFSF
Near to shortest edge- SFSF
Near to longest edge- SFSF
Near to corner- SFSF
Fig 15b: Square plate - σ equi - Al-6061

SSRG International Journal of Mechanical Engineering (SSRG - IJME) – Volume 4 Issue 6 June 2017
ISSN: 2348 – 8360 www.internationaljournalssrg.org Page 23
d/w ratio vs Equivalent stress
d/w ratio
0.1 0.2 0.3 0.4 0.5
Equ
ival
ent s
tres
s
2400
2600
2800
3000
3200
3400
3600
3800
4000
4200
Central hole-FFFF
Near to shortest edge-FFFF
Near to longest edge-FFFF
Near to corner-FFFF
Central hole-SFSF
Near to shortest edge-SFSF
Near to longest edge-SFSF
Near to corner-SFSF
Fig 16a: Rectangle plate - σ equi - Carbon/Epoxy
d/w ratio vs Equivalent stress
d/w ratio
0.1 0.2 0.3 0.4 0.5
Equ
ival
ent st
ress
4100
4200
4300
4400
4500
4600
4700
Central hole-FFFF
Near to shortest edge-FFFF
Near to longest edge-FFFF
Near to corner-FFFF
Central hole-SFSF
Near to shortest edge- SFSF
Near to longest edge- SFSF
Near to corner- SFSF
Fig 16b: Rectangle plate - σ equi - Al-6061
The obtained maximum stresses are plotted
against d/w ratio's for various conditions as shown in
fig 15a to 16b.
With the increase in d/w ratio, the equivalent
stress decreased gradually in the case of square plate
for all conditions except for the central circular hole
subject to F-F-F-F condition where a sudden decrease
in the value is observed in Al-6061. The maximum is
observed in the plate with hole nearer to longest edge
subject to F-F-F-F at d/w=0.1. But in rectangular plate
the equivalent stress decreased rapidly for some
boundary conditions and slightly in some conditions
but the maximum is observed at d/w=0.3 in the plate
with hole nearer to the corner subject to S-F-S-F
condition. In the plate of Carbon/Epoxy, the
equivalent stress fluctuated with increase in the d/w
ratio. In the case of square plate, the maximum value
is observed at d/w=0.4 with hole position nearer to the
corner subject to S-F-S-S as well as hole nearer to
shortest edge subject to F-F-F-F. The minimum is
observed at central circular hole subject to S-F-S-F. In
the case of rectangular plate, the maximum is observed
at d/w=0.4 in the plates with hole nearer to longest
edge subject to S-F-S-F and F-F-F-F conditions. The
minimum is observed at d/w=0.5 in the plate with hole
located nearer to shorter edge and corner subject to S-
F-S-F conditions respectively.
I. Effect on buckling load factor
d/w ratio vs Buckling load factor
d/w ratio
0.1 0.2 0.3 0.4 0.5
Buc
klin
g lo
ad fac
tor
0.5
0.6
0.7
0.8
0.9
1.0
1.1
1.2
1.3
Central hole-Iso
Near to shortest edge-Iso
Near to longest edge-Iso
Near to corner-Iso
Central hole-Ortho
Near to shortest edge-Ortho
Near to longest edge-Ortho
Near to corner-Ortho
Fig 17a:squareplate -buckling load factor
d/w ratio vs Buckling load factor
d/w ratio
0.1 0.2 0.3 0.4 0.5
Buc
klin
g lo
ad fac
tor
0
1
2
3
4
5
6
7
Central hole-Iso
Near to shortest edge-Iso
Near to longest edge-Iso
Near to corner-Iso
Central hole-Ortho
Near to shortest edge-Ortho
Near to longest edge-Ortho
Near to corner-Ortho
Fig 17b:Rectangleplate -buckling load factor
After the analysis the following parameters
are presented graphically for both rectangular as well
as square plates, from fig 17a to fig 17b. The graphs
are plotted for both Al-6061 and Carbon/Epoxy and
the conclusions are drawn.
J. Square Plate:
It has been observed that with increase in d/w
ratio, the buckling load factor is decreasing from d/w
0.1 - 0.2 for all hole positions and decreased further to
lower value upto d/w=0.5 except for plate with central
circular hole and hole nearer to shortest edge in Al-
6061 and hole nearer to longest edge in the
Carbon/Eopxy. The maximum value of buckling factor
is observed in a square plate with the hole nearer to the
shortest edge in the Carbon/Epoxy plate with d/w=0.5
leading to the tearing of the plate resulting in
permanent failure.
K. Rectangular plate:
With the increase in the d/w ratio, the
buckling factor remained constant from d/w=0.1 to 0.3
and then slightly varied in the plate made of Al-6061
for all the positions of the holes. With the increase in
the d/w ratio, the buckling factor remained constant
from d/w=0.1 to 0.4 and then converged to a point at

SSRG International Journal of Mechanical Engineering (SSRG - IJME) – Volume 4 Issue 6 June 2017
ISSN: 2348 – 8360 www.internationaljournalssrg.org Page 24
d/w=0.5 in the plate made of Carbon/Epoxy for the
position of holes nearer to the shorter and longest
edges.
The effect of the d/w ratio in the buckling
phenomenon in a Carbon/Epoxy plate with a hole
nearer to the longest edge is negligible. The curve is
observed to be a straight line. The maximum buckling
factor occurs in a Carbon/Epoxy plate with d/w=0.2
and d/w=0.5 for the hole located at the centre of the
plate.
IV. CONCLUSION
Structural analysis has been performed on the
square and rectangular plates with circular cutouts a
different locations subject to various boundary
conditions. Plate materials are Al-6061 and
Carbon/Epoxy. The effect of d/w ratio, hole location
and support conditions on the response of the plate are
studied in detail. With the increase in d/w ratio,
the stress concentration factor and the buckling
load factor decreases
the frequency ratio and deflection ratio are
increasing
At lower d/w ratio (<0.1), all the frequency ratios
are independent of boundary condition and hole
location
all the parameters are observed to be approaching
higher values in the plate with hole nearer to the
shortest edge subject to boundary condition with
S-F-S-F. Even if a crack initiate, it has to travel
larger length behind the hole which needs larger
forces. Hence the designs with holes nearer to the
shorter edges are recommended.
If the hole is nearer to the longer edge and if a
crack initiates, the crack has to travel shorter
distance equal to the width of the plate. This
results in the tearing of the plate thereby
decreasing the actual service life.
REFERENCES
[1]. Nitin Kumar Jain, Analysis of Stress Concentration and
Deflection in Isotropic and Orthotropic Rectangular Plates
with Central Circular Hole under Transverse Static Loading,
World Academy of Science, Engineering and Technology 60
2009
[2]. Kolaventi Sasi Kumar, B. V. S. Raghu Vamsi, P. N. V.
Balasubrahmanyam, E. Vekateswara Rao, Frequency response
analysis of a Clamped Composite Plate with a Central Circular
Cutout using ANSYS, International Journal of Scientific &
Engineering Research, Volume 6, Issue 3, March-2015
[3]. Shubhrata Nagpal, Nitin Jain, Shubhashish Sanyal, Stress
Concentration and its Mitigation Techniques in Flat Plate with
Singularities—A Critical Review, Engineering Journal, Vol.
16 Issue 1, January 2012
[4]. Hwai-Chung Wu, Bin Mu, On stress concentrations for
isotropic/orthotropic plates and cylinders with a circular hole,
Composites: Part B 34 (2003) 127–134, Elsevier
[5]. P.Srikanth, P.Pramod Kumar, Structural Analysis of Isotropic
and Orthotropic Beams and Plates in First Order Shear
Deformation Theory, International Journal of Innovative
Research in Science, Engineering and Technology, Vol. 5,
Issue 2, February 2016
[6]. Moon Banerjee, N. K. Jain, S. Sanyal, Stress concentration in
isotropic & orthotropic composite plates with center circular
hole subjected to transverse static loading, International
Journal Of Mechanical And Industrial Engineering (IJMIE),
Vol-3, Iss-1, 2013
[7]. Vanam B. C. L, Rajyalakshmi M, Inala R, Static analysis of
an isotropic rectangular plate using finite element analysis
(FEA), Journal of Mechanical Engineering Research Vol.
4(4), pp. 148-162, April 2012
[8]. Devidas R. Patil, P.G.Damle, Dr. D.S.Deshmukh, Vibration
Analysis of Composite Plate at Different Boundary
Conditions, International Journal of Innovative Research in
Science, Engineering and Technology, Vol. 3, Issue 12,
December 2014
[9]. F. O. Okafor, O. T. Udeh, Direct method of analysis of an
isotropic rectangular plate using characteristic orthogonal
polynomials, Nigerian Journal of Technology, Vol. 34 No. 2,
April 2015, pp. 232 – 239
[10]. Ming-Hung Hsu, Vibration Analysis of Isotropic and
Orthotropic Plates with Mixed Boundary Conditions, Tamkang
Journal of Science and Engineering, Vol. 6, No. 4, pp. 217-226
(2003)
[11]. A text book on Theory of Plates and Shells by Stephen
Timoshenko.