Stronger Risk Controls, Lower Risk Evidence From US Bank Holding Companies
41
ISSN 0956-8549-646 Stronger Risk Controls, Lower Risk: Evidence from U.S. Bank Holding Companies Andrew Ellul Vijay Yerramilli AXA WORKING PAPER SERIES NO 1 DISCUSSION PAPER NO 646 DISCUSSION PAPER SERIES January 2010 Andrew Ellul is Associate Professor of Finance and the Fred T. Greene Distinguished Scholar at Indiana University's Kelley School of Business. He joined Kelley in 2001 after completing his PhD at the London School of Economics and Political Science. His research interests focus on empirical corporate finance, especially ownership structures, and market microstructure. His research has been accepted for publication by various journals, including the Journal of Finance, Journal of Financial Economics, Review of Financial Studies, American Economic Review and the Journal of Financial and Quantitative Analysis. He has taught courses in corporate finance and investment analysis at the undergraduate, graduate (MBA) and PhD levels. He has received awards for both teaching and research. Vijay Yerramilli is an Assistant Professor of Finance at the Bauer College of Business, University of Houston. He obtained his PhD in Finance from the University of Minnesota in 2005. Before joining the University of Houston, he was employed as an Assistant Professor at the Kelley School of Business, Indiana University. His research interests are in the areas of corporate finance, financial intermediation, contracting and entrepreneurial finance. Any opinions expressed here are those of the author and not necessarily those of the FMG. The research findings reported in this paper are the result of the independent research of the author and do not necessarily reflect the views of the LSE.
-
Upload
abcdef1985 -
Category
Documents
-
view
12 -
download
0
description
as
Transcript of Stronger Risk Controls, Lower Risk Evidence From US Bank Holding Companies

ISSN 0956-8549-646
Stronger Risk Controls, Lower Risk: Evidence from U.S. Bank Holding Companies
Andrew Ellul
Vijay Yerramilli
AXA WORKING PAPER SERIES NO 1 DISCUSSION PAPER NO 646
DISCUSSION PAPER SERIES
January 2010
Andrew Ellul is Associate Professor of Finance and the Fred T. Greene Distinguished Scholar at Indiana University's Kelley School of Business. He joined Kelley in 2001 after completing his PhD at the London School of Economics and Political Science. His research interests focus on empirical corporate finance, especially ownership structures, and market microstructure. His research has been accepted for publication by various journals, including the Journal of Finance, Journal of Financial Economics, Review of Financial Studies, American Economic Review and the Journal of Financial and Quantitative Analysis. He has taught courses in corporate finance and investment analysis at the undergraduate, graduate (MBA) and PhD levels. He has received awards for both teaching and research. Vijay Yerramilli is an Assistant Professor of Finance at the Bauer College of Business, University of Houston. He obtained his PhD in Finance from the University of Minnesota in 2005. Before joining the University of Houston, he was employed as an Assistant Professor at the Kelley School of Business, Indiana University. His research interests are in the areas of corporate finance, financial intermediation, contracting and entrepreneurial finance. Any opinions expressed here are those of the author and not necessarily those of the FMG. The research findings reported in this paper are the result of the independent research of the author and do not necessarily reflect the views of the LSE.
Stronger Risk Controls, Lower Risk: Evidence from U.S. Bank
Holding Companies∗
Andrew Ellul † Vijay Yerramilli ‡
Preliminary
Abstract
In this paper, we investigate whether U.S. bank holding companies (BHCs) withstrong and independent risk management functions had lower aggregate risk and down-side risk. We hand-collect information on the organization structure of the 75 largestpublicly-listed BHCs, and use this information to construct a Risk Management Index(RMI) that measures the strength of organizational risk controls at these institutions.We find that BHCs with a high RMI in the year 2006, i.e., before the onset of thefinancial crisis, had lower exposures to mortgage-backed securities and risky tradingassets, were less active in trading off-balance sheet derivatives, and generally fared bet-ter in terms of operating performance and lower downside risk during the crisis years(2007 and 2008). In a panel spanning 8 years, we find that BHCs with higher RMIshad lower aggregate risk and downside risk, and higher stock returns, after controllingfor size, profitability, a variety of risk characteristics, corporate governance, executivecompensation, and BHC fixed effects. This result holds even after controlling for anysimultaneity bias. Overall, these results suggest that strong internal risk controls areeffective in lowering risk at banking institutions.
∗We would like to thank Rajesh Aggarwal, Utpal Bhattacharya, Mark Carey, Laurent Fresard, Radhakr-ishnan Gopalan, Nandini Gupta, Jean Helwege, Christopher Hennessy, Jose Liberti, Marco Pagano, RichRosen, Amit Seru, Phil Strahan, Rene Stulz, Anjan Thakor, David Thesmar, Greg Udell, James Vickery,Vikrant Vig, and seminar participants at Indiana University, the CEPR Summer Symposium in Gerzensee,the proposal sessions of the NBER Project on Market Institutions and Financial Market Risk and its orga-nizers for their helpful comments and suggestions. We also thank our research assistants, Robert Gradelessand Shyam Venkatesan, for their diligent effort. All remaining errors are our responsibility.†Kelley School of Business, Indiana University. email: [email protected]; ph: (812) 855-2768.‡Kelley School of Business, Indiana University. email: [email protected]; ph: (812) 855-2694.

“The failure to appreciate risk exposures at a firmwide level can be costly. For example,
during the recent episode, the senior managers of some firms did not fully appreciate the extent
of their firm’s exposure to U.S. subprime mortgages. They did not realize that, in addition to
the subprime mortgages on their books, they had exposures through the mortgage holdings of
off-balance-sheet vehicles, through claims on counterparties exposed to subprime, and through
certain complex securities. . . ”
- Chairman of the Federal Reserve, Ben Bernanke1
Introduction
There is wide-spread agreement on the proximate causes of the current financial crisis: banks
had substantial exposure to subprime risk on their balance sheets, and these risky assets were
funded across the board by short-term market borrowing (Kashyap et al. (2008), Acharya
et al. (2009)). As a result, what began as a housing crisis in the United States soon turned
into a full-blown global financial crisis. Among the explanations for why banks exposed
themselves to such risks, a prominent explanation that has been advanced by policymakers,
bank supervisors and academics is that there was a failure of risk management at banks.2
The argument seems to be that traders and other bank executives with high-powered pay-
for-performance schemes were exploiting deficiencies in internal control systems, and risk
managers were unable or powerless to restrain them (Senior Supervisors Group (2008),
Kashyap et al. (2008)).
In this paper, we focus on the organizational structure of the risk management function
at bank holding companies (BHCs) in the United States. The key question we examine
is whether BHCs that had strong and independent risk management functions in place
had lower enterprise-wide risk, both in terms of aggregate risk and downside risk, after
controlling for the underlying risk of the BHCs’ business activities. To this end, we construct
an innovative risk management index that measures the importance attached to the risk
management function within the organization, and how well information on risk from the
different business segments is conveyed to the BHC’s board of directors. For example, to
gauge the importance attached to the risk management function, we examine if the BHC
has a designated Chief Risk Officer (CRO), whether the CRO is is among the top five
highly paid executives, and how the CRO’s pay compares with that of the Chief Executive1Comments from his special address delivered at the 44th annual Conference on Bank Structure and
Competition, held at the Federal Reserve of Chicago in May 2008.2Stulz (2008) characterizes a failure of risk management as one of the following: failure to identify or
correctly measure risks, failure to communicate risk exposures to the top management, and failure to monitoror manage risks adequately.
1
Officer (CEO). Similarly, to gauge how well quantitative and qualitative information on
risk is shared between the top management and business segments, we examine whether
the directors serving on the BHC’s designated board committee to oversee risk have prior
banking experience, the frequency of the meetings held by the BHC’s designated board risk
committee, and whether the key management-level risk committees report directly to the
board or to the CEO.
Our research question is motivated by the idea that a strong and independent risk
management function is necessary to effectively manage risk in modern-day banking insti-
tutions. This is because deposit insurance protection and implicit too-big-to-fail guarantees
weaken the incentives of debtholders to impose market discipline, while the ever increasing
complexity of modern-day banking institutions and the ease with which their risk profiles
can be altered by traders and security desks makes it difficult for supervisors to regulate
risks (Acharya et al. (2009)). The increasing complexity of modern-day banking institu-
tions also makes it difficult to measure risk and to communicate risk objectives to business
segments in easily quantifiable terms. As Stulz (2008) notes, once risk management moves
away from established quantitative models, it becomes easily embroiled in intra-firm poli-
tics; e.g., traders whose bonuses depend on the risks they take, may be at cross-purposes
with the risk officer. Therefore, the outcome for the institution depends on how strong and
independent the risk management function is.
Policymakers and supervisors seem to echo this view. Based on its discussions with the
largest financial institutions, the Senior Supervisors Group (2008) has concluded that what
distinguished well-managed institutions that fared well during the crisis was that they had
strong and independent risk management functions, and that there was a robust dialogue
between their senior management team and business segments regarding organization-wide
risk preferences.3 In particular, the SSG report highlights specific weaknesses in risk man-
agement practices that contributed to heavy losses at institutions that performed poorly
during the crisis: excessive reliance on external credit rating agencies and backward-looking
measures of risk, and failure to conduct forward-looking stress tests;4 failure to identify cor-
relation risk;5 and underestimation of liquidity risk.
Our specific focus on BHCs is motivated by three important considerations. First, a
typical BHC comprises of several independent subsidiaries, each with its own management3The Senior Supervisors Group (SSG) is a group of supervisory agencies from France, Germany, Switzer-
land, the United Kingdom, and the United States.4Some institutions tended to assume that they could apply the low historical return volatility of corporate
credits rated ‘Aaa’ to super-senior tranches of CDOs, a more novel instrument that rating agencies hadlikewise rated ‘Aaa’.
5For example, several institutions assigned zero net risk to negative basis trades, where they held longposition in a corporate bond combined with a protection in the form of a credit default swap (CDS), underthe assumption that correlation between bond prices and CDS prices would follow historical relationships.
2

and board of directors, involved in a wide variety of financial activities. This kind of an
organizational structure enhances the importance of an enterprise-wide risk management
mechanism that can identify and manage risks on a consolidated basis. Second, most
BHCs are publicly listed on stock exchanges and file periodic reports (10-k statements,
proxy statements) with the Securities and Exchange Commission (SEC), from which we
are able to collect information on their risk management structure. Third, because they
are regulated by the Federal Reserve and the FDIC, BHCs are required to report detailed
financial information on a quarterly basis. Apart from information on the balance sheet
and income statement items, we are also able to obtain detailed information on usage of
derivatives and off-balance sheet activities.
We obtain our data from several sources. We hand-collect data on the organization
structure of risk management of BHCs from their 10-k statements, proxy statements, and
annual reports. Given the effort involved in hand-collection and validation of information,
we restrict ourselves to the 75 largest publicly-listed BHCs, in terms of the book value of
their assets, at the end of 2007 (which accounted for 78% of the total assets of the banking
system). We hand-collect this information for the eight year period, 2000–2007. Financial
information on BHCs is obtained from the FR Y-9C reports that they file with the Federal
Reserve System. To measure enterprise-wide risk, we obtain data on stock returns from
CRSP which we use to compute the standard deviation of returns, and data on option
prices from the OptionMetrics database which we use to estimate the implied volatility of
the underlying stock. We use the standard deviation of a BHC’s excess weekly return (i.e.,
weekly return on the BHC’s stock less the weekly return on the S&P500) over the calendar
year as a proxy for its aggregate risk during the year (see Demsetz et al. (1997) and Laeven
and Levine (2009)).6 We proxy for downside risk using the mean implied volatility estimated
using put options written on the BHC’s stock (Bali and Hovakimian (2008), Cremers and
Weinbaum (2008) and Xing et al. (2008)).
As a preamble to our analysis, and in keeping with the motivation of our paper, we begin
by examining whether BHCs that had strong risk management functions in place before
the onset of the financial crisis fared better during the crisis years, 2007 and 2008. To
answer this question, we estimate cross-sectional regressions in which the main independent
variable is the BHC’s RMI in 2006, and the outcome variables are performance measures
in 2007 and 2008. The reason we choose RMI in 2006 as the independent variable is
because the SSG report specifically highlights that institutions with strong risk management
functions identified risks and started taking corrective actions as early as in 2006, when it
was easier to offload holdings of mortgage-backed securities and CDOs, and was relatively6Our results hold even if we use the standard deviation of weekly raw returns as a measure of aggregate
risk.
3

cheaper to hedge risks. Consistent with the idea that BHCs with stronger risk management
structures were more judicious in their risk taking, we find that BHCs with a high 2006
RMI had lower exposure to mortgage-backed securities and trading assets, were less active
in trading off-balance sheet derivative securities. Moreover, BHCs with a high 2006 RMI
were more profitable, fared (weakly) better in terms of stock return performance, and had
lower downside risk during the crisis years.
Next, we examine a panel spanning the 8 year period from 2001–2008 to investigate
whether BHCs with stronger risk management functions had lower enterprise-wide risk. In
these panel regressions, we are better able to control for unobserved BHC characteristics by
including BHC fixed effects. After controlling for various BHC characteristics like size, prof-
itability, asset and liability composition including capital ratios, other risk characteristics,
executive compensation and corporate governance, we find that BHCs with stronger risk
management functions (i.e., higher values of RMI) in the previous year had both lower ag-
gregate risk and lower downside risk in the current year. In terms of economic significance,
a one standard deviation increase in RMI is associated with a 25% decrease (a decrease of
0.8 standard deviations) in downside risk and a 34% decrease (a decrease of 0.5 standard
deviations) in aggregate risk. We must emphasize that our panel regression includes year
fixed effects as well as BHC fixed effects. Thus, we are controlling for a BHC’s “risk culture”
to the extent that it is time-invariant. Therefore, our results reflect a within-BHC decrease
in aggregate risk and downside risk from a strengthening of the risk management function.
We use the same panel regression specification to investigate whether BHCs with stronger
risk management functions also had better stock return performance. After controlling for
all the BHC characteristics mentioned above, and including BHC fixed effects and year fixed
effects, we find that BHCs with higher values of RMI in the previous year had higher annual
stock returns in the current year. This evidence suggests that the stock market rewards
BHCs with strong risk management functions.
So far, we have treated the RMI as an exogenous variable, and examined the association
between RMI and BHC risk. However, causation could run in both directions; i.e., BHC
risk characteristics might determine the choice of RMI, and the RMI in turn affects BHC
risk. This can bias our inferences depending on how causation affects the choice of RMI.
It is possible that BHCs exposed to greater risk choose stronger risk management systems,
which should bias against us finding a negative association between BHC Risk and RMI.7
Alternatively, it is possible that the underlying risk culture of the BHC determines both the
choice of the risk and the strength of the risk management system; i.e., conservative BHCs7The hypothesis follows from theories which suggest that firms that are more likely to experience financial
distress should also be more aggressive in managing their risks (Smith and Stulz (1985), Froot et al. (1993)).For empirical evidence on this in the banking sector, see Purnanandam (2007), who shows that banks withhigher probability of financial distress manage their interest rate risk more aggressively.
4
take lower risks and put in place stronger risk management systems, while aggressive BHCs
take higher risks and also have weaker internal risk controls. If the risk-culture hypothesis
is correct, it will tend to exaggerate the positive association between BHC risk and RMI.
Given that causation can run both ways, it is critical to account for how BHC risk
and the centrality of the risk management function are jointly determined. Accordingly,
we estimate a simultaneous equations model. Even with this approach, we find that BHCs
with stronger risk management functions had lower aggregate risk and lower downside risk.
However, consistent with the risk culture view, the economic significance of this relationship
drops when compared with our panel regression.
To summarize, our results support the idea that strong and independent risk manage-
ment functions are necessary to effectively manage risks in banking institutions. BHCs with
strong risk management functions in place before the onset of the financial crisis were more
judicious in their exposure to risky financial instruments, and generally fared better during
the crisis period. In a panel spanning 8 years, we find that BHCs with stronger risk manage-
ment functions had lower aggregate risk and lower downside risk, after controlling for size,
profitability, and a variety of risk characteristics. This result holds even after controlling
for any simultaneity bias.
Our paper makes three important contributions. First, it highlights that weakening
risk management at financial institutions may have contributed to the excessive risk-taking
behavior that brought about the financial crisis. To the best of our knowledge, we are the
first to show that banks with strong risk management functions in place before the financial
crisis hit were more judicious in exposing themselves to mortgage-backed securities and
off-balance sheet derivative trading activity, and generally fared better during the crisis
years. Another prominent argument that has been advanced to explain the risk-taking
behavior of banks leading up to the financial crisis is that executives at banks had poor
incentives. However, Fahlenbrach and Stulz (2009) find no evidence in support of this
argument. In fact, they find that banks with CEOs whose incentives were better aligned
with the interests of their shareholders actually performed worse during the credit crisis.
Further, option compensation did not have an adverse impact on bank performance during
the crisis.
Second, our paper contributes to the large literature that examines risk-taking by banks.
Past research has examined the impact of deposit insurance and competition (Keeley (1990),
Hellmann et al. (2000), Demirguc-Kunt and Detragiache (2002)), ownership structure and
banking regulations (Laeven and Levine (2009)), size (Demsetz and Strahan (1997)), and
franchise value (Demsetz et al. (1997)) on risk-taking by banks. Our paper contributes to
this literature by examining how the strength and independence of the risk management
5

function affects risk-taking by banks.
Finally, our paper also contributes to the small but growing literature on the corporate
governance of financial institutions. Macey and O’Hara (2003) argue that the fiduciary
duties of bank officers and directors should be expanded beyond shareholders to include
creditors. Adams and Mehran (2003) highlight key differences in internal governance struc-
tures and ownership structure between bank holding companies and non-financial firms.
Examining 306 global financial institutions that were at the center of the financial crisis,
Erkens et al. (2009) find that CEO turnover is more sensitive to shareholder losses among
firms with greater board independence, larger institutional ownership, and smaller insider
ownership. In contrast to papers on corporate governance that mainly focus on the bank’s
ability to take corrective action (e.g., firing the CEO) following poor performance, our focus
is on internal risk controls that can restrain risk-taking behavior ex ante.
The rest of the paper is organized as follows. We outline our key hypotheses in Section
1, and describe our data sources and construction of variables in Section 2. We describe our
empirical specifications and preliminary results in Section 3, and present our main results
in Section 4. Section 5 concludes the paper.
1 Hypotheses
The key hypothesis which we aim to test is that banking institutions with strong and inde-
pendent risk management functions have lower enterprise-wide risk, both in terms of aggre-
gate risk and downside risk. Our hypothesis recognizes that strong internal risk controls are
necessary to rein in the risk-taking tendencies of bank executives. The following paragraph
from Acharya et al. (2009) summarizes the risk-taking tendencies that arise within modern-
day financial institutions, and why these cannot be checked through traditional monitoring
by their debtholders, supervisory action of regulators, or external market discipline:
“Large, complex financial institutions are highly levered entities with over 90 percent
leverage, many with access to explicit deposit insurance protection and most with implicit
too big to fail guarantees. Together, these features have created several important problems.
First, they have induced excessive leverage- and risk-taking tendencies. Second, the presence
of implicit or explicit government guarantees – often underpriced and at best mispriced – has
blunted the instrument of debt monitoring that would otherwise impose market discipline on
risk taking by these firms. Third, the size of these institutions has shielded them from the
disciplinary forces of the otherwise vibrant market for takeovers and shareholder activism.
Finally, their ever-increasing complexity has diminished the power of governance from existing
shareholders and non-executive board members. Unlike in industrial firms, it has become
6

increasingly difficult for infrequently meeting boards to fully grasp the swiftness and forms by
which risk profiles of these institutions can be altered by traders and security desks. ”
One mechanism that can check the risk-taking tendencies of bank executives and traders
is the presence of a strong and independent risk management function (see Kashyap et al.
(2008), Landier et al. (2008)). Note that for risks to be successfully managed, they must
first be identified and measured. This is particularly challenging for banking institutions
given the multitude of risks that they are exposed to. Apart from credit risk, banks are also
exposed to interest rate risk and liquidity risk given that they finance illiquid assets with
liquid liabilities such as deposits (Diamond (1984), Diamond and Rajan (2001)). Trading
and underwriting activities of their subsidiaries not only increase the risk exposures of
individual banks, but also increase the risk of broad systemic failure, because the failure of
one segment of a large institution (e.g., the derivatives desk at AIG) can trigger a broader
systemic failure through depositor panics, counter-party failures, and systemic liquidity
shortages (Diamond and Rajan (2005)).
Past research has highlighted that organizational structure influences the effectiveness
of information sharing between business segments and the top management (Stein (2002),
Liberti (2005)). Therefore, the organizational structure of the risk management function is
likely to be important in determining how effectively qualitative and quantitative informa-
tion on risk is shared between the top management and the individual business segments.
Accordingly, we collect information on how the risk management function is organized at
each bank holding company in our sample. However, measuring risk by itself may not be
enough to restrain bank executives and traders, whose bonuses depend on the risks that
they take. As Kashyap et al. (2008) note (also see Stulz (2008)),
“. . . high powered pay-for-performance schemes create an incentive to exploit deficiencies
in internal measurement systems. . . this is not to say that risk managers in a bank are unaware
of such incentives. However, they may be unable to fully control them. ”
Therefore, it is important that the risk management function is strong and independent.
Accordingly, we collect information on not just whether a BHC has a designated officer
tasked with managing enterprise-wide risk, but also how important such an official is within
the organization.
In our empirical analysis, we test our hypothesis against the null hypothesis that internal
risk controls do not have any meaningful effect on enterprise-wide risk. This could be
because even the most sophisticated organizational structure may not be able to grasp
the swiftness with which traders and security desks can alter the risk profile of the BHC.
7

The compensation packages of traders may be so convex that they cannot be restrained by
internal risk controls (Landier et al. (2008)).
We also recognize that the causation between the strength of the risk management
function and enterprise-wide risk can run in both directions; i.e., BHC risk characteristics
might determine the choice of the risk management function, and the risk management
function in turn affects risk. There are two possible ways in which risk characteristics may
affect the organizational structure of the risk management function.
It is possible that BHCs exposed to greater risk choose stronger risk management sys-
tems. We refer to this as the endogenous choice hypothesis. This hypothesis follows from
theories of hedging, which suggest that firms that are more likely to experience financial
distress should also be more aggressive in managing their risks (Smith and Stulz (1985),
Froot et al. (1993)). Consistent with hedging theories, Purnanandam (2007) shows that
banks that face a higher probability of financial distress manage their interest rate risk
more aggressively, both by using derivatives and by adopting conservative asset-liability
management policies.
Alternatively, it is possible that the underlying risk culture of the BHC determines both
the choice of the risk and the strength of the risk management system; i.e., conservative
BHCs take lower risks and put in place stronger risk management systems, while aggressive
BHCs take higher risks and also have weaker internal risk controls. We refer to this as the
risk culture hypothesis.
In our empirical analysis, we account for how BHC risk and the strength of the risk
management function are jointly determined.
2 Sample collection and construction of variables
2.1 Data Sources
Our data comes from several sources. We hand-collect data on the organization structure
of the risk management function at BHCs from the 10-k statements and proxy statements
filed by the BHCs with the Securities and Exchange Commission (SEC), and from their
annual reports. We use this information to create a unique risk management index (RMI)
that measures the strength and independence of the risk management function at the given
BHC. Given the effort involved in hand-collecting and validating the information for each
BHC, we restrict ourselves to the time period 2000–2007, and to the 100 largest BHCs, in
terms of the book value of their total assets at the end of 2007. Although there were over
5,000 BHCs at the end of 2007, the top 100 BHCs account for close to 92% of the total
8

assets of the banking system. Because only publicly listed BHCs file 10-k statements with
the SEC, our sample reduces to 75 BHCs, that accounted for 78% of the total assets of the
banking system in 2007. Overall, we are able to construct the RMI for 75 BHCs over the
time period 2000–2007. We list the names of these BHCs in Appendix A.
We obtain consolidated financial information of BHCs from the FR Y-9C reports that
they file with the Federal Reserve System. Apart from information on the consolidated
balance sheet and income statement, the FR Y-9C reports also provide us a detailed break-
up of the BHC’s loan portfolio, security holdings, regulatory risk capital, and off-balance
sheet activities such as usage of derivatives. The financial information is presented on a
calendar year basis.
We obtain data on stock returns from CRSP, and use these to compute our measure of
a BHC’s Aggregate Risk, which is defined as the standard deviation of the BHC’s weekly
excess return (i.e., weekly return on the BHC’s stock less the weekly return on the S&P500)
over the calendar year. We obtain implied volatilities estimated from option prices from
the OptionMetrics database, and use these to compute our measure of a BHC’s Downside
Risk, which is defined as the mean implied volatility estimated using put options written
on the BHC’s stock.
We obtain data on CEO compensation from the Execucomp database, and use these to
compute the sensitivity of the CEO’s compensation to stock price (CEO’s Delta) and stock
return volatility (CEO’s Vega). We obtain data on institutional ownership from the 13-f
forms filed by BHCs, and the Gompers et al. (2003) G-Index from the IRRC database.
2.2 The risk management index (RMI)
We hand-collect information on various aspects of the organization structure of the risk
management function at each BHC, and use this information to create a risk management
index, denoted RMI, to measure the strength and independence of the risk management
function.
Our first set of variables capture whether the BHC has a designated officer charged
exclusively with managing enterprise-wide risk across all business segments, and how im-
portant this official is within the organization. Specifically, we create the following variables:
CRO Present, a dummy variable that identifies if the BHC has a designated Chief Risk Of-
ficer (CRO); CRO Executive, a dummy variable that identifies if the CRO is an executive
officer; CRO-Top5, a dummy variable that identifies if the CRO is among the five highest
paid executives; and CRO Centrality, defined as the ratio of the CRO’s total compensation
9

to the CEO’s total compensation.8
A technical difficulty in defining CRO Centrality is that publicly-listed firms usually
only disclose the compensation packages of their five highest paid executives. Thus, we
only have information on the CRO’s compensation when he/ she is among the five highest
paid executives. We overcome this difficulty as follows: When the BHC has a CRO who
does not figure among the five highest paid executives, we calculate CRO Centrality based
on the compensation of the fifth highest-paid executive, and subtract a percentage point.
Thus, we implicitly set the CRO just below the fifth-highest paid executive. To the extent
that the CRO’s true compensation is much lower, this method only biases against us. If
the BHC does not have a CRO, then we define CRO Centrality based on the compensation
of the Chief Financial Officer. Another alternative is to code CRO Centrality=0 when the
BHC does not have a designated CRO. Not surprisingly, our results become stronger when
we use this more stringent definition of CRO Centrality.
Our next set of variables are intended to capture how well quantitative and qualitative
information on risk is shared between the top management and business segments. In this
regard, we examine the characteristics of the board committee designated with oversee-
ing and managing risk. Board Committee Experience is a dummy variable that identifies
whether at least one of the directors serving on the board’s risk committee has some banking
experience. We measure the activity of the board risk committee in terms of the frequency
with which it meets during the year. The dummy variable Active Board Risk Committee
then identifies if the BHC’s board risk committee met more frequently during the year com-
pared to the average board risk committee across all BHCs. Reports to Board is a dummy
variable that identifies whether the key management-level risk committee (usually called the
“Asset and Liability Committee”) reports directly to the BHC’s board of directors, instead
of to the CEO.
We obtain the RMI by taking the first principal component of the following seven risk
management variables: CRO Present, CRO Executive, CRO-Top5, CRO Centrality, Board
Committee Experience, Active Board Risk Committee, and Reports to Board. Principal
component analysis effectively performs a singular value decomposition of the correlation
matrix of risk management categories measured over time. The single factor selected in
this study is the eigenvector in the decomposition with the highest eigenvalue. The main
advantage of using principal component analysis is that we do not have to subjectively
eliminate any categories, or make subjective judgements regarding the relative importance
of these categories.8Keys, Mukherjee, Seru, and Vig (2009) use a similar measure to capture the relative power of the CRO
within the bank.
10

3 Empirical specifications and preliminary results
3.1 Empirical specifications
As a preamble to our analysis, and in keeping with our motivation, we begin by examining
whether BHCs that had strong and independent risk management functions in place before
the current financial crisis hit, were more judicious in terms of their investment and financing
decisions, and performed relatively better during the crisis years. Accordingly, we estimate
cross-sectional regressions only for the crisis years, 2007 and 2008, that are of the following
form:
Yj,t = β0 + β1 ∗ RMIj,2006 + β2 ∗Xj,2006 + Year FE (1)
In the above equation, subscript ‘j’ denotes the BHC and ‘t’ denotes the year. The
dependent variables (Y ) we examine are the following: MBS and MBS/Assets, where MBS
denotes the book value of mortgage-backed securities held by the BHC; Trading Assets and
Trading Assets/Assets, where Trading Assets are defined as the BHC’s total trading assets
less investments in relatively safe securities such as U.S. treasury securities, U.S. government
agency obligations, and securities issued by states and political subdivisions in the U.S.;
Deriv. Trading and Deriv. Trading/Assets, where Deriv. Trading is defined as the total
gross notional amount of off-balance sheet derivative contracts held for trading purposes;
ROA, which is defined as the ratio of the BHC’s income before extraordinary items to its
assets, and is a measure of overall operating performance; Stock return, which is defined
as the excess return (over the S&P500) on the BHC’s stock over the calendar year; and
Downside Risk, which is defined as the mean implied volatility estimated using put options
written on the BHC’s stock. Our main independent variable is RMI j,2006, the BHC’s risk
management index in 2006.
Our main set of tests are aimed at understanding whether BHCs that had strong and
independent risk management functions in place (i.e., high RMI) had lower aggregate risk
and lower downside risk, after controlling for the underlying risk of the BHC’s business
activities. Accordingly, we estimate panel regressions that are variants of the following
form:
Riskj,t = β0 + β1 ∗ RMIj,t−1 + β2 ∗Xj,t−1 + BHC FE + Year FE (2)
We estimate this regression on a panel that has one observation for each BHC-year
combination, includes the BHCs listed in Appendix A, and spans the time period 2001–
2008. The dependent variable is one of the following: Aggregate Risk, which is defined as
the standard deviation of the BHC’s weekly excess return (i.e., weekly return on the BHC’s
11

stock less the weekly return on the S&P500) over the year; and Downside Risk, which is
defined as the mean implied volatility estimated from put options written on the BHC’s
stock. We include both BHC and year fixed effects in this regression.
We control the regression for important BHC financial characteristics from the previous
year. The definitions of all the variables we use in our analysis are listed in Appendix B.
We control for size using the natural logarithm of the book value of total assets (Size),
and for profitability using the ratio of the BHC’s income before extraordinary items to its
assets (ROA). We control for loan performance using the ratio Bad Loans/Assets, where
‘bad’ loans include non-accrual loans and loans past due 90 days or more. We proxy for the
BHC’s reliance on off-balance sheet activity using the ratio Risky Non-Int. Income/Income
(see Boyd and Gertler (1994)), where Risky Non-Int. Income is defined as the total non-
interest income less income from fiduciary activities, service charges on deposit accounts,
and other non-interest income. More specifically, Risky Non-Int. Income includes income
from security brokerage, investment banking and advisory fee, underwriting income, insur-
ance income, fee from annuity sales, venture capital revenue, securitization income, and
gains from sale of loans and assets.
We control for balance sheet composition using the ratios Deposits/Assets, Tier1 Cap/Assets
and Loans/Assets. The ratios Real Estate Loans/Assets, C&I Loans/Assets, Consumer
Loans/Assets, Agri. Loans/Assets and Other Loans/Assets control for the BHC’s exposure
to loans secured by real estate, commercial and industrial loans, consumer loans, agricul-
tural loans and other loans, respectively. The variable Loan Concentration measures the
concentration of the BHC’s loan portfolio among these loan segments. It is computed as
a Herfindahl Index using the share of each loan segment in the overall loan portfolio; i.e.,
the sum of squares of the loan segment shares. Thus, a high value of Loan Concentration
means that BHC’s loans are heavily concentrated in one or more segments.
Apart from BHC financial characteristics, we also control for the institutional ownership
in the BHC, and for its governance using the G-Index. We control for CEO compensation
using the sensitivity of the CEO’s compensation to share price, Delta, and sensitivity to
stock return volatility, Vega (see Core and Guay (1999)).
Given that the causation between risk and the strength of the risk management function
can run both ways, it is critical to account for how BHC risk and RMI are jointly determined.
Accordingly, we estimate the following simultaneous equation model. We estimate the
system using three-stage least squares (3SLS). To conform to the underlying reasoning for
12

simultaneous equations, we use contemporaneous values of risk and RMI in this model.
BHC Riskj,t = α0 + α1 ∗ RMIj,t + α2 ∗Xj,t−1 + Year FE
RMIj,t = β0 + β1 ∗ BHC Riskj,t + β2 ∗ Zj,t−1 + Year FE (3)
3.2 Summary Statistics
We present summary statistics of the key risk management variables and financial variables
for the BHCs in our panel in Table I. The overall panel includes 100 BHCs and spans the
time period 2000-07; each observation corresponds to a BHC-year combination. However,
information on risk management characteristics and standard deviation of stock returns is
only available for the 75 BHCs that are publicly listed.
As can be seen from Table I, the mean value of the risk management index is 1.213.
Examining the descriptive statistics regarding the components of the RMI, we find that
a designated Chief Risk Officer (CRO) was present and had an executive rank in 57.3%
and 48.9% of BHCs, respectively. Further, the CRO was among the top five highly-paid
executives in only 19% of BHCs. As can be seen from the descriptive statistics of the CRO
Centrality variable, on average, the CRO’s total compensation was 29% that of the CEO’s
total compensation. However, there is significant variability in this ratio across BHCs.
The mean of 0.33 on Board Risk Committee indicates that only 33% of BHCs had a
board committee exclusively focussed on overseeing enterprise-wide risk. We classify a BHC
as having an active board risk committee during a given year if the frequency with which
its board risk committee met during the year was higher than the average frequency across
all BHCs during the year. By this classification, 36.2% of BHCs in our sample had active
board risk committees. The mean of 0.518 on Report to Board indicates that the principal
management-level risk committee reported directly to the board of directors (instead of the
CEO) in 51.8% of BHCs.
The size distribution of BHCs, in terms of the book value of their assets, is highly
skewed. Total assets vary from $387 million at the lower end to over $2 trillion at the
higher end. The median BHC had assets with book value of $12.7 billion, while the average
BHC had assets with book value of $96.7 billion. Given the skewness of the size distribution
we use the logarithm of the book value of assets, denoted Size, as a proxy for BHC size in
all our empirical specifications.
On average, deposits constitute 67% of liabilities plus equity, and loans constitute 62% of
the assets. Although loan composition varies from BHC to BHC, loans secured by real estate
13

are by far the largest component, accounting for 39.3% of assets, on average.9 Commercial
and industrial loans constitute 12% of assets, and consumer loans constitute 5.9% of assets,
on average. In terms of loan performance, the average BHC has 0.7% of its assets in ‘bad’
loans, i.e., non-accrual loans and loans that are 90 days past due and still accruing.
As can be seen from the summary statistics on Deriv. Hedging/Assets and Deriv. Trad-
ing/Assets, there is a great deal of variation among BHCs in terms of their use of derivatives
for hedging purposes, and their trading of derivatives. The median BHC uses derivatives for
hedging that amount to only 3% of its assets, and does not hold any derivatives for trading
purposes. However, there are a few BHCs that have very large exposures to derivatives,
especially for purposes other than hedging.
In terms of governance characteristics, the average BHC had 47.21% of its shares held
by institutional investors, and had a G-index of 9.75.
3.3 Correlations among key variables
In Table II, we list the correlations among the key variables used in our analysis.
Panel A lists the correlations between our risk measures, RMI and BHC financial char-
acteristics. The correlation between Downside Risk and RMI is strongly negative at -0.457.
Similarly, Aggregate Risk is also negatively correlated with RMI, albeit less strongly com-
pared with downside risk. While these findings are consistent with the idea that BHCs with
strong and independent risk management controls have lower downside risk and lower aggre-
gate risk, they must be interpreted with caution because they do not control for important
BHC characteristics like size, profitability, capital ratios, etc.
Both risk measures are negatively correlated with size. Somewhat surprisingly, both
risk measures are positively correlated with Tier-1 capital ratio, which goes against the idea
that well-capitalized banks take lower risks. Similarly surprising are the positive correla-
tions between risk measures and the CEO’s Delta (because greater exposure to the bank’s
equity should make the CEO more risk averse), and the negative correlations between risk
measures and the CEO’s Vega (because higher option pay should induce the CEO to take on
greater risks). We must once again caution that these correlations do not take into account
other BHC characteristics. In particular, note that Size is negatively correlated with Tier1
Cap/Assets and CEO’s Delta, and is positively correlated with CEO’s Vega. Therefore, the
puzzling correlations we document can arise because large BHCs that experience lower risks
are also less well-capitalized, rely less on stock compensation, and rely more on option-based9Loans secured by real estate include the following sub-categories: (a) Construction, land development,
and other land loans; (b) Loans secured by farmland; (c) Loans secured by single family or multi-familyresidential properties; and (d) loans secured by non-farm non-residential properties.
14

compensation.
Panel B lists the correlations between our risk measures and the various components of
the RMI. As can be seen, both Downside Risk and Aggregate Risk are negatively correlated
with the individual components of the RMI, although, once again, the correlations are
stronger in case of Downside Risk.
We now proceed to our multivariate analysis where we examine the relationship between
BHC risk measures and RMI after controlling for important BHC characteristics.
4 Empirical Results
4.1 RMI and performance during crisis years
In motivating our paper, we cited the Senior Supervisors Group (2008) report which sug-
gested that institutions with stronger risk management functions were more judicious in
terms of exposing themselves to mortgage-backed securities and complex derivatives, and
generally fared better in the early months of the crisis. So it is natural to begin our analysis
by asking whether BHCs that had stronger risk management functions in place before the
crisis hit, say in 2006, fared better during the crisis years, 2007 and 2008.
To answer this question, we estimate the cross-sectional regression (1) on all the BHCs
in our sample for the crisis years 2007 and 2008. Our main independent variable of interest
is the BHC’s risk management index in 2006, RMI 2006. We also control for BHC charac-
teristics at the end of calendar year 2006.10 The results of our estimation are presented in
Table III. We include 2007 and 2008 year dummies in all specifications.
In Columns (1) and (2), we examine whether BHCs with a high RMI in 2006 had lower
exposure to mortgage-backed securities during the crisis years, 2007 and 2008. We are
interested in exposure to mortgage-backed securities because the crisis itself was caused by
a housing crisis in the U.S., and there was considerable uncertainty regarding the true values
of these securities during 2007 and 2008. The dependent variable in Column (1) is MBS, the
book value of mortgage-backed securities (in $ million) on the BHC’s balance sheet, while
the dependent variable in Column (2) is MBS/Assets, the book value of mortgage-backed
securities scaled by the book value of total assets. The coefficient on RMI 2006 in Column
(1) is negative, suggesting that BHCs with stronger RMI in 2006 had lower exposure to
mortgage-backed securities. While the coefficient is also negative in Column (2), it is not
statistically significant.10We obtain qualitatively similar results when we use lagged BHC characteristics, instead of 2006 charac-
teristics, as control variables.
15

In Columns (3) and (4), we examine whether BHCs with a high RMI in 2006 had
lower exposure to risky trading assets during the crisis years. Recall that our measure
of Trading Assets excludes relatively safe securities such as U.S. Treasury securities, U.S.
government obligations, and securities issued by states and political subdivisions in the U.S.
The negative and significant coefficients on RMI 2006 in columns (3) and (4) indicates that
BHCs with a high RMI in 2006 had lower exposure to risky trading assets, both in terms
of dollar amounts and as a proportion of total assets.
In Columns (5) and (6), we examine the off-balance sheet derivative trading activities
of BHCs during the crisis years. The dependent variable in Column (5) is Deriv. Trading,
which is the gross notional amount (in $ million) of derivative contracts held for trading,
while the dependent variable in Column (6) is Deriv. Trading/Assets. The negative and
significant coefficients on RMI 2006 in columns (5) and (6) indicates that BHCs with a high
RMI in 2006 had lower exposure to off-balance sheet derivative trading activity, both in
dollar terms as well as in relation to their total assets.
In Column (7), we examine whether BHCs that had high RMI in 2006 were more
profitable during the crisis years. Accordingly, the dependent variable in this regression
is ROA. The positive and significant coefficient on RMI 2006 confirms our hypothesis. In
unreported tests, we also find weak support for the idea that BHCs with a higher RMI in
2006 had fewer bad loans during the crisis years.
In Column (8), we examine whether BHCs that had high RMI in 2006 experienced
relatively better stock return performance during the crisis years. The dependent variable in
this regression is the annual excess return (over the S&P500) on the BHC’s stock. While the
coefficient on RMI 2006 is positive confirming our hypothesis, it is not statistically significant
at the conventional levels (the p-value on the coefficient is 12.3%).
Finally, in Column (9), we examine the downside risk of BHCs during the crisis years,
as measured by the implied volatility estimates from put options written on the BHCs’
stocks. This regression only includes 49 BHCs in the year 2007 for which we have the
implied volatility measures. The negative and significant coefficient on RMI 2006 indicates
that BHCs with a high RMI in 2006 had lower downside risk in 2007.
Overall, the results in Table III are supportive of the argument in the Senior Supervisors
Group (2008) report that BHCs with strong and independent risk management functions
in place before the crisis hit, were more judicious in their investment decisions, and fared
better during the crisis years.
16

4.2 Impact of RMI on BHC Risk
Next, we examine whether BHCs that had strong and independent risk management func-
tions in place (i.e., high RMI) had lower aggregate risk and lower downside risk, after
controlling for the underlying risk of the BHC’s business activities. We do this by esti-
mating the panel regression (2). The dependent variables for this regression are downside
risk, as measured by Downside Risk, and aggregate risk, as measured by Std. Dev. Excess
Return, and the main independent variable is the lagged value of RMI, i.e., RMI j,t−1. Each
observation in the panel corresponds to a BHC-year pair. The panel spans the time period
2001-2008, and includes the 75 BHCs whose names are listed in Appendix A. We include
year fixed effects, as well as BHC fixed effects to control for any unobserved BHC charac-
teristics that might affect risk; e.g., the BHC’s risk culture. The results of our estimation
are presented in Table IV.
Impact on downside risk
In Panel A, we present the results of regressions aimed at understanding how the BHC’s
downside risk varies with its RMI. The dependent variable in these regressions is Downside
Risk. We have fewer observations in this regression because we do not have the implied
volatility measures for all BHCs. The negative and significant coefficient on RMI j,t−1
in Column (1) indicates that BHCs that had strong and independent risk management
functions in place in the previous year have lower downside risk in the current year.
In terms of the coefficients on the control variables, we fail to detect any relationship
between BHC size and downside risk. Thus, at least in our sample (which only consists of
the 75 largest publicly listed BHCs), there is no evidence that large BHCs take larger risks
because of implicit too-big-to-fail guarantees. Moreover, we also do not find any strong
support for the argument that moral hazard induced by deposit insurance causes BHCs to
take higher risks. While the coefficient on Deposits/Assets is positive, it is not statistically
significant. Consistent with the idea that well-capitalized banks take lower risks, we find
a negative and significant coefficient on Tier1 Cap/Assets. Another variable that has a
strong relationship with downside risk is Bad Loans/Assets. Recall that bad loans include
non-accrual loans and loans that are 90 days past due and are still accruing. Therefore, the
positive and significant coefficient on Bad Loans/Assets indicates that BHCs with a poorly
performing loan portfolio have higher downside risk.
In Column (2), we repeat our analysis after replacing the Loans/Assets variable with
its five segment components (real estate loans, commercial and industrial loans, consumer
loans, agricultural loans, and all other loans), and the Loan Concentration measure that
17

captures how concentrated the BHC’s loan portfolio is among the five segments, to see
if exposure to any particular loan segment is associated with higher or lower downside
risk. However, the coefficients on all these measures are statistically insignificant, and the
coefficient on RMI j,t−1 continues to be negative and significant.
It has been argued that bank CEO compensation packages contribute to higher risk
taking. However, the findings in the empirical literature in this regard are somewhat mixed.
Examining bank behavior during the period 1992–2002, Mehran and Rosenberg (2007)
find that equity volatility and asset volatility of banks increase as their CEO stock option
holdings increase. However, examining the behavior of banks during the crisis period,
Fahlenbrach and Stulz (2009) find that option compensation did not have an adverse impact
on bank performance.
To take into account the impact of CEO compensation on risk taking, in Column (3),
we repeat our estimation after including the sensitivity of the CEO’s compensation to the
firm’s stock price (Delta) and stock return volatility (Vega) as additional controls. The
negative coefficient on Delta indicates that BHCs with CEOs whose compensation is highly
sensitive to the BHC’s stock price have lower downside risk. This could be because greater
exposure to the BHC’s equity causes the CEO to become more risk averse. However, we fail
to detect any positive relationship between the CEO’s Vega and downside risk. Moreover,
the negative coefficient on RMI j,t−1 becomes stronger when compared with Column (1)
after we control for CEO compensation, even though we have fewer observations in this
column.
Past research has highlighted that high insider ownership is generally associated with
higher risk, as insiders try to take advantage of deposit insurance (Saunders et al. (1990),
Demsetz et al. (1997), Laeven and Levine (2008)).11 Therefore, in Column (4), we repeat our
estimation after including Log(Inst. Ownership) as an additional control. We also control
for the BHC’s corporate governance, by including its G-Index as a control variable. While
the coefficient on Log(Inst. Ownership) is positive, it is not statistically significant. We also
fail to detect any relationship between the G-Index and downside risk. More importantly,
the negative coefficient on RMI j,t−1 only becomes stronger when compared with Column
(1).
Overall, the results in Panel A indicate that BHCs that had strong and independent risk
management functions in place had lower downside risk. In terms of economic significance,
the coefficient of -0.430 on RMI j,t−1 in Column (1) indicates that a one standard deviation
increase in RMI is associated with a decrease of 0.087 in downside risk, which is equivalent
to a 25% decrease or a 0.8 standard deviation decrease in downside risk.11Demsetz et al. (1997) argue that this problem exists only at low franchise value banks.
18

Impact on aggregate risk
In Panel B, we present the results of regressions aimed at understanding how the BHC’s
aggregate risk varies with its RMI. The dependent variable in these regressions is Std.
Dev. Excess Return. The negative and significant coefficient on RMI j,t−1 in Column (1)
indicates that BHCs that had strong and independent risk management functions in place
in the previous year have lower aggregate risk in the current year.
The coefficients on the control variables are somewhat different from those in Panel
A. In particular, the positive coefficient on Deposits/Assets indicates that BHCs that rely
more on deposits to fund themselves had higher aggregate risk. This could be because the
presence of deposit insurance encourages BHCs with higher deposits to take higher risks.
The negative coefficient on Loans/Assets indicates that BHCs that held more loans (and
hence, fewer securities and other trading assets) had less volatile stock returns. Profitable
BHCs have less volatile stock returns (negative coefficient on ROA). In Column (2), we
find that BHCs with higher exposure to loans secured by real estate loans and agricultural
loans have less volatile stock returns (negative coefficients on Real Estate Loans/Assets
and Agri. Loans/Assets), while BHCs with highly concentrated loan portfolios have more
volatile stock returns (positive coefficient on Loan Concentration). As in Panel A, we find
that BHCs with a poorly performing loan portfolio have higher aggregate risk (positive
coefficient on Bad Loans/Assets).
As in Panel A, the negative coefficient on RMI j, t−1 is robust to controlling for institu-
tional ownership, CEO’s compensation characteristics, and the BHC’s G-Index. However,
we have far fewer observations in Columns (3) and (4), because we do not have CEO com-
pensation and G-Index for all BHCs in our sample. Overall, the findings in Panel B indicate
that BHCs with strong and independent risk management functions in place have lower ag-
gregate risk. In terms of economic significance, the coefficient of -0.064 on RMI j, t − 1 in
Column (1) indicates that a one standard deviation increase in RMI is associated with a
decrease of 0.013 in aggregate risk, which is equivalent to a 34% decrease or a 0.5 standard
deviation decrease in aggregate risk.
4.3 How does the impact of RMI vary with BHC characteristics?
In our next set of tests, we interact the RMI variable with key BHC characteristics, such
as size and profitability, to understand how the impact of RMI varies with these BHC
characteristics. The empirical specification and control variables we employ are exactly
the same as in Column (1) of Table IV. However, to conserve space, we do not report the
coefficients on control variables all over again. The results of our estimation are presented
19

in Table V.
In Columns (1) and (2), we examine how the effect of RMI on downside risk and aggre-
gate risk varies with the size of the BHC. The idea is to see if a strong and independent risk
management function matters more in large BHCs that are more likely to have multiple sub-
sidiaries and multiple business segments. Given the highly skewed size distribution of BHCs
that we highlighted in Table I, we define the dummy variable Large BHC to identify, in each
year, the BHCs that are in the top decile in terms of their book value of assets. We then esti-
mate the panel regression (2) after including Large BHC t−1 and Large BHC t−1*RMI t−1 as
additional regressors. The negative and significant coefficients on Large BHC t−1*RMI t−1 in
Columns (1) and (2) indicate that the effect of RMI in lowering downside risk and aggregate
risk is stronger in large BHCs.
In Columns (3) and (4), we examine how the impact of RMI varies with the profitability
of the BHC. Because an effective risk management function can make a bigger impact in
BHCs with poorer operating performance, where the scope for improvement is larger, we
define the dummy variable Low ROA BHC to identify, in each year, BHCs that are in the
lowest quartile in terms of their ROA. The negative and significant coefficient on Low ROA
BHC t−1*RMI t−1 in Column (4) indicates that the effect of RMI in lowering aggregate risk
is stronger in BHCs with low profitability. We do not detect a similar effect with respect to
downside risk, as the coefficient on the interaction term in Column (3) is not statistically
significant.
In Columns (5) and (6), we examine how the impact of RMI varies with the BHC’s
reliance on deposits to fund itself. There are two possible ways in which the effect might
vary. On the one hand, BHCs that have a low deposits to assets ratio tend to be those
with a limited presence in banking, and a larger presence in other financial activities like
underwriting, insurance, etc. As per this interpretation, the effect of RMI in lowering risk
should be stronger for BHCs that rely less on deposits. On the other hand, if deposit
insurance induces BHCs to take on more risks, then the impact of RMI should be felt more
strongly at BHCs that rely heavily on deposits. To test these hypotheses, we define the
dummy variable Low Deposits BHC to identify, in each year, BHCs that are in the lowest
quartile in terms of their deposits to assets ratio. Consistent with the former interpretation,
the coefficient on Low Deposits BHC t−1*RMI t−1 in Column (6) is negative and significant,
which suggests that the impact of RMI in lowering aggregate risk is stronger at BHCs that
rely less on deposits. Again, the coefficient on the interaction term in the downside risk
regression in Column (5) is not significant.
In Columns (7) and (8), we examine whether the impact of RMI in lowering risk is
stronger at BHCs that are more active in trading derivatives off-balance sheet. Accordingly,
20

we define the dummy variable High Deriv. Trading BHC to identify, in each year, BHCs
that are in the top quartile in terms of the Deriv. Trading/Assets ratio. The negative and
significant coefficient on High Deriv. Trading BHC t−1*RMI t−1 in Column (8) suggests that
the impact of RMI in lowering aggregate risk is stronger at BHCs that are more active in
trading derivatives. We do not detect a similar effect with respect to downside risk, as the
coefficient on the interaction term in Column (7) is not statistically significant.
4.4 Impact of RMI on BHC stock returns
So far, we have shown that BHCs with strong and independent risk management functions
in place had lower enterprise-wide risk, both in terms of aggregate risk and downside risk.
A natural question that arises is whether the stock market rewards BHCs with high RMI.
To investigate this question, we estimate the panel regression (2), with the annual return
on the BHC’s stock as the dependent variable, and the lagged value of RMI as the main
independent variable. The empirical specification and control variables are the same as in
Table IV. Each observation in the panel corresponds to a BHC-year pair. The panel spans
the time period 2001-2008, and includes the 75 BHCs whose names are listed in Appendix
A. We include year fixed effects, as well as BHC fixed effects in all specifications. The
results of our estimation are presented in Table VI.
The positive and statistically significant coefficient on RMI t−1 in all the specifications
indicates that BHC’s with strong and independent risk management functions in place
in the previous year had higher stock returns in the current year. In terms of economic
significance, the coefficient estimate indicates that a one standard deviation increase in
RMI is associated with a 20% increase in annual stock return. While the magnitude of this
increase in annual returns seems very large, we must note that annual returns are highly
variable, so that the 20% increase corresponds to a 0.7 standard deviation increase in annual
stock returns. (The magnitude of the economic significance decreases only slightly when we
repeat our tests after winsorizing the annual stock returns.)
4.5 Simultaneous equations models
So far, we have treated the RMI as an exogenous variable, and examined the association
between RMI and BHC risk. However, causation could run in both directions; i.e., BHC
risk characteristics might determine the choice of RMI, and the RMI in turn affects BHC
risk. This can bias our inferences depending on how causation affects the choice of RMI.
As we explained in Section 1, there are two possible hypotheses in this regard. The
endogenous choice hypothesis suggests that BHCs exposed to greater risk choose stronger
21

internal risk controls. Observe that, if this hypothesis is true, it should bias against us
finding a negative association between BHC Risk and RMI. On the other hand, the risk
culture hypothesis suggests that the BHC’s underlying risk culture determines both the
choice of the risk and the strength of the risk management system; i.e., conservative BHCs
take lower risks and put in place stronger risk management systems, while aggressive BHCs
take higher risks and also have weaker internal risk controls. If the risk-culture hypothesis
is correct, it will tend to exaggerate the positive association between BHC risk and RMI.
Given that causation can run both ways, it is critical to account for how BHC risk
and the strength of the risk management system are jointly determined. Accordingly, we
estimate the simultaneous equations model (3) using three-stage least squares (3SLS). To
conform to the underlying reasoning for simultaneous equations, we use contemporaneous
values of risk and RMI in this model. The results of our estimation are presented in Table
VII.
In Panel A, we estimate how downside risk and RMI are simultaneously determined
by BHC characteristics. The underlying restrictions we impose should be clear from the
tables. As the negative and significant coefficient on RMI indicates, even after controlling
for simultaneity, we find that BHCs with stronger risk management functions have lower
downside risk.
The negative coefficient on Downside Risk in Column (2) indicates that BHCs with
greater downside risk have lower RMI, which is consistent with the risk culture view, but is
inconsistent with the idea that BHCs exposed to greater risk choose stronger internal risk
controls. In terms of other coefficients, we find that large and well-capitalized BHCs choose
stronger risk controls (positive coefficients on Size and Tier1 Cap), while profitable BHCs
and BHCs that use a lot of derivatives for hedging purposes choose weaker risk controls
(negative coefficients on ROA and Deriv. Hedging). The negative coefficient on Deriv.
Hedging further suggests that BHCs probably view hedging and internal risk controls as
substitutes.
Our findings in Panel B are similar. As the negative and significant coefficient on RMI
in Column (3) indicates, even after controlling for simultaneity, we find that BHCs with
stronger risk management functions have lower aggregate risk.
Overall, the findings in Table VII support the idea that BHCs with stronger internal
risk controls have lower downside risk and lower aggregate risk. However, consistent with
the risk culture view, the economic significance of this relationship drops when compared
with our panel regression in Table IV.
22

5 Conclusion
A prominent explanation for why many banks took excessive risks in the lead up to the
financial crisis is that there was a failure of risk management functions at these banks. It is
suggested that risk managers at banks either failed to identify or correctly measure risks,
or failed to communicate risk exposures to their top management, or failed to monitor or
manage risks adequately. As a result, they could not restrain traders and bank executives
who, given their high-powered pay-for-performance schemes, had incentives to take excessive
risks.
In this paper, we examine the organizational structure of the risk management function
at bank holding companies (BHCs) in the United States, and the effect it had on BHC risk.
The question we ask is whether BHCs with strong and independent risk controls in place
had lower enterprise-wide risk. To this end, we construct an innovative risk management
index that measures the strength and independence of the risk management function at
each BHC, among the 75 largest publicly-listed BHCs.
We first show that BHCs with stronger risk controls in place before the onset of the
financial crisis (i.e., higher levels of RMI in 2006) were more judicious in their risk tak-
ing, and fared relatively better during the crisis years. Specifically, such BHCs had lower
exposure to mortgage-backed securities and trading assets, were less active in trading off-
balance sheet derivative securities, had better operating and stock return performance, and
had lower downside risk during the crisis years, 2007 and 2008.
We then show that the relationship between the strength of internal risk controls and
enterprise-wide risk is not just confined to the crisis period, but also holds more generally
during normal times. Examining a panel spanning the 8 year period from 2001–2008, we
find that BHCs with stronger internal risk controls in the previous year have both lower
aggregate risk and lower downside risk in the current year. These results are obtained
after controlling for various BHC characteristics like size, profitability, asset and liability
composition including capital ratios, other risk characteristics, executive compensation,
corporate governance, and BHC fixed effects.
Our results support the idea that strong and independent risk management functions
are necessary to effectively manage risks in banking institutions. One important policy
recommendation that follows from our analysis is that bank supervisors should more closely
monitor the effectiveness of internal risk controls at banking institutions.
23

References
Acharya, V. V., J. N. Carpenter, X. Gabaix, K. John, M. Richardson, M. G. Subrahmanyam,
R. K. Sundaram, and E. Zemel (2009). Corporate governance in the modern financial
sector. In Acharya and Richardson Acharya and Richardson (2009).
Acharya, V. V., T. Philippon, M. Richardson, and N. Roubini (2009). The financial crisis of
2007–2009: Causes and remedies. In Acharya and Richardson Acharya and Richardson
(2009).
Acharya, V. V. and M. Richardson (Eds.) (2009). Restoring financial stability. Wiley
Finance.
Adams, R. and H. Mehran (2003). Is corporate governance different for bank holding
companies? Federal Reserve Bank of New York Policy Review , 123–142.
Bali, T. and A. Hovakimian (2008). Volatility spreads and expected stock returns. Forth-
coming, Management Science.
Boyd, J. H. and M. Gertler (1994). Are banks dead? Or are the reports greatly exaggerated?
Quarterly Review, Federal Reserve Bank of Minneapolis.
Core, J. E. and W. R. Guay (1999). The use of equity grants to manage optimal equity
incentive levels. Journal of Accounting and Economics 28, 151–184.
Cremers, M. and D. Weinbaum (2008). Deviations from put-call parity and stock return
predictability. Forthcoming, Journal of Financial and Quantitative Analysis.
Demirguc-Kunt, A. and E. Detragiache (2002). Does deposit insurance increase banking
system stability? An empirical investigation. 49, 1373–1406.
Demsetz, R. S., M. R. Saidenberg, and P. E. Strahan (1997). Agency problems and risk
taking at banks. Working paper, Banking Studies Department, Federal Reserve Bank of
New York.
Demsetz, R. S. and P. E. Strahan (1997). Diversification, size and risk at bank holding
companies. Journal of Money, Credit, and Banking 29 (3), 300–313.
Diamond, D. (1984). Financial intermediation and delegated monitoring. Review of Eco-
nomic Studies 51, 394–414.
Diamond, D. and R. Rajan (2001). Liquidity risk, liquidity creation, and financial fragility:
A theory of banking. Journal of Political Economy 109 (2), 287–327.
24

Diamond, D. and R. Rajan (2005). Liquidity shortages and banking crises. Journal of
Finance 60 (2), 615–647.
Erkens, D., M. Hung, and P. Matos (2009). Corporate governance in the recent financial
crisis: Evidence from financial institutions worldwide. Working paper, University of
Southern California, Los Angeles, CA.
Fahlenbrach, R. and R. M. Stulz (2009). Bank CEO incentives and the credit crisis. SSRN
Working paper.
Froot, K., D. Scharfstein, and J. Stein (1993). Risk management : Coordinating corporate
investment and financing policies. Journal of Finance 48, 1629–1658.
Gompers, P., J. Ishii, and A. Metrick (2003). Corporate governance and equity prices.
Quarterly Journal of Economics 118 (1), 107–155.
Hellmann, T. F., K. C. Murdock, and J. E. Stiglitz (2000). Liberalization, moral hazrd
in banking, and prudential regulation: Are capital requirements enough? American
Economic Review 90 (1), 147–165.
Kashyap, A. K., R. G. Rajan, and J. C. Stein (2008). Rethinking capital regulation. NBER
working paper.
Keeley, M. C. (1990). Deposit insurance, risk, and market power in banking. American
Economic Review 80 (5), 1183–1200.
Keys, B. J., T. Mukherjee, A. Seru, and V. Vig (2009). Financial regulation and securiti-
zation: Evidence from subprime loans. 56, 700–720.
Laeven, L. and R. Levine (2008). Bank governance, regulation and risk taking. Working
paper.
Laeven, L. and R. Levine (2009). Bank governance, regulation and risk taking. Journal of
Financial Economics 93, 259–275.
Landier, A., D. Sraer, and D. Thesmar (2008). Financial risk management: When does
independence fail? Working Paper.
Liberti, J. M. (2005). Initiative, incentives and soft information. How does delegation impact
the role of bank relationship managers? IFA Working Paper No. 404.
Macey, J. R. and M. O’Hara (2003, April). The corporate governance of banks. Federal
Reserve Bank of New York Economic Policy Review , 91–107.
Mehran, H. and J. Rosenberg (2007). The effect of employee stock options on bank invest-
ment choice, borrowing, and capital. Federal Reserve Bank of New York Staff Report 305.
25

Purnanandam, A. (2007). Interest rate derivatives at commercial banks: An empirical
investigation. Journal of Monetary Economics 54, 1769–1808.
Saunders, A., E. Strock, and N. G. Travlos (1990). Ownership structure, deregulation, and
bank risk taking. Journal of Finance 45 (2), 643–654.
Senior Supervisors Group (2008). Observation on risk management practices during the
recent market turbulence.
Smith, C. and R. Stulz (1985). The determinants of firms’ hedging policies. Journal of
Financial and Quantitative Analysis 28, 391–405.
Stein, J. (2002). Information production and capital allocation: Decentralized versus hier-
archial firms. Journal of Finance 57 (5), 1891–1921.
Stulz, R. M. (2008). Risk management failures: What are they and when do they happen?
Working paper, Ohio State University.
Xing, Y., X. Zhang, and R. Zhao (2008). What does individual option volatility smirk tell
us about future equity returns? Forthcoming, Journal of Financial and Quantitative
Analysis.
26

Appendix A: List of BHCs in our sample
Name of BHC 2007 Assets ($ bn) Time span in panel
CITIGROUP INC. 2190.00 2001-2008
BANK OF AMERICA CORPORATION 1720.00 2001-2008
JPMORGAN CHASE & CO. 1560.00 2001-2008
WACHOVIA CORPORATION 783.00 2001-2007
WELLS FARGO & COMPANY 575.00 2001-2008
BARCLAYS GROUP US INC. 344.00 2005-2008
U.S. BANCORP 238.00 2001-2008
BANK OF NEW YORK MELLON CORP. 198.00 2001-2008
SUNTRUST BANKS, INC. 180.00 2001-2008
CAPITAL ONE FINANCIAL CORP 151.00 2001-2008
NATIONAL CITY CORPORATION 150.00 2001-2007
STATE STREET CORPORATION 143.00 2001-2008
REGIONS FINANCIAL CORPORATION 141.00 2002-2008
PNC FINANCIAL SERVICES GROUP 139.00 2001-2008
BB&T CORPORATION 133.00 2001-2008
FIFTH THIRD BANCORP 111.00 2001-2008
KEYCORP 99.57 2001-2008
BANCWEST CORPORATION 74.21 2001-2008
NORTHERN TRUST CORPORATION 67.61 2001-2008
M&T BANK CORPORATION 64.88 2001-2008
COMERICA INCORPORATED 62.76 2001-2008
MARSHALL & ILSLEY CORPORATION 59.86 2001-2008
UNIONBANCAL CORPORATION 55.73 2001-2008
HUNTINGTON BANCSHARES INC. 54.63 2001-2008
ZIONS BANCORPORATION 52.95 2001-2008
POPULAR, INC. 44.41 2001-2008
FIRST HORIZON NATIONAL CORP. 37.02 2000-2008
SYNOVUS FINANCIAL CORP. 33.02 2001-2008
NEW YORK COMMUNITY BANCORP 30.60 2001-2008
COLONIAL BANCGROUP, INC., 25.97 2001-2008
ASSOCIATED BANC-CORP 21.59 2001-2008
BOK FINANCIAL CORPORATION 20.90 2001-2008
W HOLDING COMPANY, INC. 18.00 2001-2008
WEBSTER FINANCIAL CORPORATION 17.21 2001-2008
FIRST BANCORP 17.19 2001-2008
FIRST CITIZENS BANCSHARES, 16.23 2001-2008
COMMERCE BANCSHARES, INC. 16.21 2000-2008
TCF FINANCIAL CORPORATION 16.07 2001-2008
FULTON FINANCIAL CORPORATION 15.92 2001-2008
Continued on next page...
27

Name of BHC 2007 Assets ($ bn) Time span in panel
CITY NATIONAL CORPORATION 15.89 2001-2008
SOUTH FINANCIAL GROUP, THE 13.87 2001-2008
CULLEN/FROST BANKERS, INC. 13.65 2001-2008
CITIZENS REPUBLIC BANCORP, 13.52 2001-2008
BANCORPSOUTH, INC. 13.20 2001-2008
SUSQUEHANNA BANCSHARES, INC. 13.08 2001-2008
VALLEY NATIONAL BANCORP 12.75 2001-2008
STERLING FINANCIAL CORPORATION 12.15 2001-2008
EAST WEST BANCORP, INC. 11.85 2001-2008
UCBH HOLDINGS, INC. 11.80 2001-2008
WILMINGTON TRUST CORPORATION 11.62 2001-2008
INTERNATIONAL BANCSHARES C 11.17 2001-2008
WHITNEY HOLDING CORPORATION 11.03 2001-2008
BANK OF HAWAII CORPORATION 10.47 2001-2008
FIRSTMERIT CORPORATION 10.41 2001-2008
FRANKLIN RESOURCES, INC. 9.63 2001-2008
WINTRUST FINANCIAL CORPORATION 9.37 2001- 2008
UMB FINANCIAL CORPORATION 9.34 2001-2008
DORAL GP LTD. 9.26 2001-2008
SANTANDER BANCORP 9.15 2001-2008
TRUSTMARK CORPORATION 8.97 2001-2008
CORUS BANKSHARES, INC. 8.93 2001-2007
FIRSTBANK HOLDING COMPANY 8.69 2001-2008
UMPQUA HOLDINGS CORPORATION 8.35 2001-2008
UNITED COMMUNITY BANKS, INC. 8.21 2001-2008
FIRST MIDWEST BANCORP, INC. 8.10 2001-2008
ALABAMA NATIONAL BANCORPORATION 8.00 2001-2007
UNITED BANKSHARES, INC. 7.99 2001-2008
OLD NATIONAL BANCORP 7.85 2001-2008
MB FINANCIAL, INC 7.83 2001-2008
CHITTENDEN CORPORATION 7.44 2001-2007
PACIFIC CAPITAL BANCORP 7.39 2001-2008
BOSTON PRIVATE FINANCIAL HOLDINGS, INC. 6.83 2001-2007
28
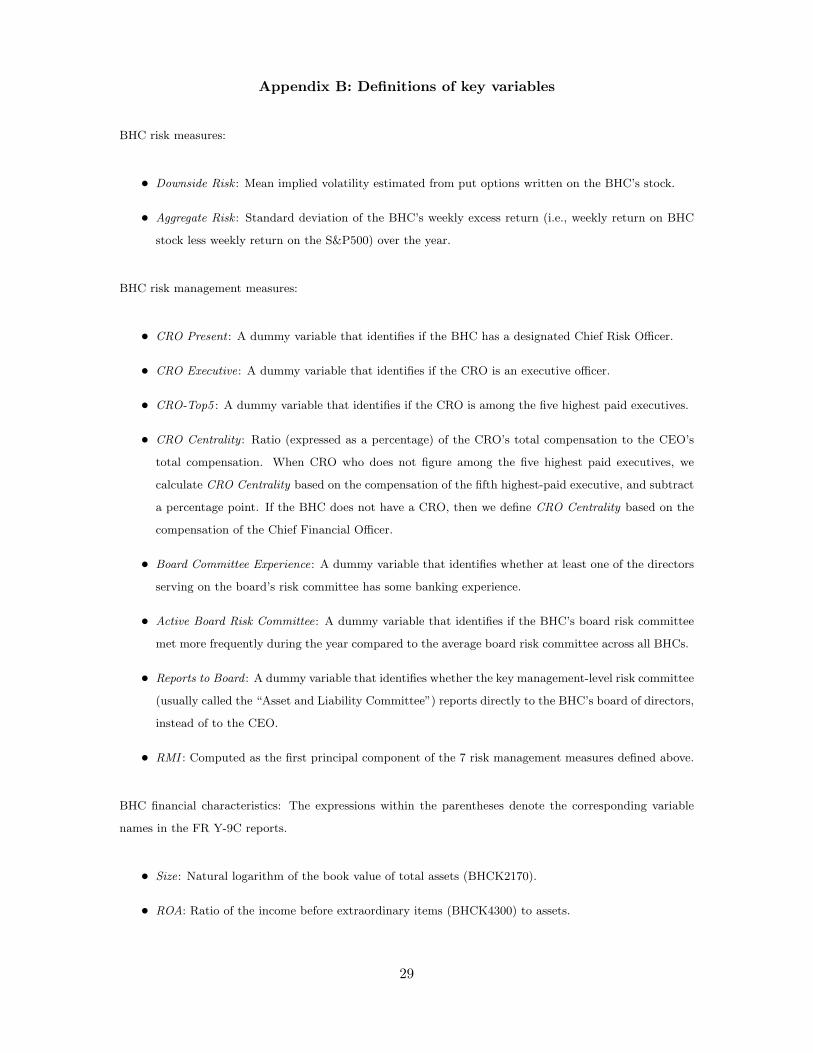
Appendix B: Definitions of key variables
BHC risk measures:
• Downside Risk : Mean implied volatility estimated from put options written on the BHC’s stock.
• Aggregate Risk : Standard deviation of the BHC’s weekly excess return (i.e., weekly return on BHC
stock less weekly return on the S&P500) over the year.
BHC risk management measures:
• CRO Present : A dummy variable that identifies if the BHC has a designated Chief Risk Officer.
• CRO Executive: A dummy variable that identifies if the CRO is an executive officer.
• CRO-Top5 : A dummy variable that identifies if the CRO is among the five highest paid executives.
• CRO Centrality : Ratio (expressed as a percentage) of the CRO’s total compensation to the CEO’s
total compensation. When CRO who does not figure among the five highest paid executives, we
calculate CRO Centrality based on the compensation of the fifth highest-paid executive, and subtract
a percentage point. If the BHC does not have a CRO, then we define CRO Centrality based on the
compensation of the Chief Financial Officer.
• Board Committee Experience: A dummy variable that identifies whether at least one of the directors
serving on the board’s risk committee has some banking experience.
• Active Board Risk Committee: A dummy variable that identifies if the BHC’s board risk committee
met more frequently during the year compared to the average board risk committee across all BHCs.
• Reports to Board : A dummy variable that identifies whether the key management-level risk committee
(usually called the “Asset and Liability Committee”) reports directly to the BHC’s board of directors,
instead of to the CEO.
• RMI : Computed as the first principal component of the 7 risk management measures defined above.
BHC financial characteristics: The expressions within the parentheses denote the corresponding variable
names in the FR Y-9C reports.
• Size: Natural logarithm of the book value of total assets (BHCK2170).
• ROA: Ratio of the income before extraordinary items (BHCK4300) to assets.
29

• Deposits/Assets: Ratio of total deposits (BHDM6631+BHDM6636+BHFN6631+BHFN6636) to as-
sets.
• Tier1 Cap/Assets: Ratio of Tier1 capital (BHCK8274) to assets.
• Loans/Assets: Ratio of total loans (BHCK2122) to assets.
• Real Estate Loans/Assets: Ratio of loans secured by real estate (BHCK1410) to assets.
• C&I Loans/Assets: Ratio of commercial and industrial loans (BHDM1766) to assets.
• Consumer Loans/Assets: Ratio of consumer loans (BHDM1975) to assets.
• Agri. Loans/Assets: Ratio of agricultural loans (BHCK1590) to assets.
• Other Loans/Assets: Ratio of all other loans to assets.
• Loan Concentration: Measures the concentration of the BHC’s loan portfolio among the five loan
segments defined above. It is computed as the sum of squares of each segment’s share in the total
loan portfolio.
• Bad Loans/Assets: Ratio of the sum of loans past due 90 days or more (BHCK5525) and non-accrual
loans (BHCK5526) to assets.
• Risky Non-Int. Income: Defined as non-interest income (BHCK4079) less income from fiduciary
activities (BHCK4070), service charges on deposit accounts (BHCK4483), and other non-interest in-
come (BHCKB497). It includes income from security brokerage, investment banking and advisory fee,
underwriting income, insurance income, fee from annuity sales, venture capital revenue, securitization
income, and gains from sale of loans and assets.
• Risky Non-Int. Income/Income: Ratio of Risky Non-Int. Income to the sum of interest income
(BHCK4107) and non-interest income (BHCK4079).
• MBS : Book value of mortgage-backed securities (BHCK3534+BHCK3535+BHCK3536) held by the
BHC.
• Trading Assets: Total trading assets (BHCK3545) less investments in U.S. treasury securities (BHCK3531),
U.S. government agency obligations (BHCK3532), and securities issued by states and political sub-
divisions in the U.S. (BHCK3533).
• Deriv. Trading : Total gross notional amount of derivative contracts held for trading, obtained by
adding amounts on interest rate contracts (BHCKA126), foreign exchange contracts (BHCKA127),
equity derivative contracts (BHCK8723), and commodity and other contracts (BHCK8724).
30

Other BHC variables:
• Inst. Ownership: Percentage of shares owned by institutional investors.
• G-Index : Gompers, Ishii and Metrick (2003) governance index.
• CEO Delta: Sensitivity of CEO compensation to share price.
• CEO Vega: Sensitivity of CEO compensation to stock return volatility.
31

Table I: Summary Statistics
This table presents the descriptive statistics for the key variables used in our analysis. Downside Risk
measures a BHC’s downside risk, and is defined as the mean implied volatility estimated from put options
written on the BHC’s stock. Std. Dev. Excess Return and Std. Dev. Return measure a BHC’s aggregate
risk, and are defined as the standard deviation of the BHC’s weekly excess return (over S&P500) and weekly
return, respectively, computed over the year. RMI measures the strength and independence of the risk
management function at a BHC. All other variables are defined in Appendix B.
Mean Median Std. Dev. Min p25 p75 Max N
Downside Risk 0.347 0.335 0.105 0.184 0.272 0.404 1.140 358
Aggregate Risk 0.038 0.031 0.024 0.013 0.022 0.044 0.180 667
RMI .400 .399 .202 .032 .265 .552 .903 567
CRO Present 0.573 1 0.495 0 0 1 1 569
CRO Executive 0.489 0 0.500 0 0 1 1 569
CRO Top5 0.191 0 0.393 0 0 0 1 561
CRO Centrality .290 .230 .171 .100 .190 .350 .910 568
Board Committee Experience .232 0 .422 0 0 0 1 569
Active Board Risk Committee 0.362 0 0.481 0 0 1 1 569
Report to Board 0.518 1 0.500 0 0 1 1 569
Assets (in $ billion) 96.7 12.7 270 .388 7.679 52.9 2190 707
Size 16.852 16.355 1.527 12.868 15.854 17.785 21.506 707
ROA 0.012 0.011 0.014 -0.053 0.009 0.014 0.194 707
Deposits/Assets 0.670 0.686 0.155 0.000 0.622 0.761 0.935 703
Tier1 Cap/Assets 0.080 0.075 0.043 0.005 0.066 0.085 0.568 707
Loans/Assets 0.618 0.672 0.164 0.028 0.572 0.721 0.859 707
Real Estate Loans/Assets 0.393 0.410 0.153 0 0.301 0.494 0.845 707
C&I Loans/Assets 0.120 0.116 0.075 0 0.072 0.157 0.477 707
Consumer Loans/Assets 0.059 0.045 0.055 0 0.018 0.091 0.577 707
Agri. Loans/Assets 0.003 0.001 0.004 0 0.000 0.005 0.024 706
Loan concentration 0.512 0.484 0.164 0.260 0.388 0.600 1.002 706
Bad Loans/Assets 0.007 0.004 0.010 0 0.003 0.007 0.183 707
Risky Income/Income 0.087 0.049 0.138 -0.088 0.023 0.094 0.936 575
Deriv. Hedging/Assets 0.102 0.030 0.198 0 0.002 0.110 2.010 704
Deriv. Trading/Assets 1.173 0 5.221 0 0 0.125 49.231 704
Inst. Ownership (in %) 47.210 48.768 21.758 .424 31.095 63.629 96.864 647
Delta (in $ ’000) 0.016 0.005 0.033 0.000 0.002 0.014 0.219 470
Vega (in $ ’000) 0.137 0.056 0.231 0 0.015 0.141 1.505 445
G-Index 9.747 10 2.829 2 8 12 15 534
32

Table II: Correlations among key variables
This table presents the correlations between the key variables used in our analysis. Panel A presents the
correlations between BHC risk measures, RMI, and BHC characteristics. Panel A presents the correlations
between BHC risk measures and components of the RMI. Downside Risk is defined as the mean implied
volatility estimated from put options written on the BHC’s stock. Aggregate Risk is defined as the standard
deviation of the BHC’s weekly excess return (over S&P500), computed over the calendar year. RMI measures
the strength and independence of the risk management function at a BHC. All other variables are defined
in Appendix B.
Panel A: Correlations between BHC Risk, RMI, and BHC Characteristics
Downside Risk Aggregate Risk RMIt−1 Sizet−1
Downside Risk 1.000
Aggregate Risk 0.550 1.000
RMIt−1 -0.457 -0.215 1.000
Sizet−1 -0.273 -0.093 0.459 1.000
ROAt−1 0.055 -0.012 -0.125 -0.166
(Tier1 Cap/Assets)t−1 0.115 0.058 -0.141 -0.252
(Deposits/Assets)t−1 -0.023 -0.080 -0.088 -0.418
(Bad Loans/Assets)t−1 -0.001 0.079 0.186 0.262
(Frac. risky income)t−1 -0.030 -0.035 0.058 0.200
Inst. Ownershipt−1 0.025 0.167 0.303
CEO’s Delta 0.262 0.162 -0.288 -0.287
CEO’s Vega -0.215 -0.121 0.185 0.476
G-Index 0.099 -0.017 -0.042 -0.384
(Deriv. Trading/Assets)t−1 -0.012 0.114 0.189 0.612
(Deriv. Hedging/Assets)t−1 -0.143 -0.094 0.046 0.492
Panel B: Correlations between BHC Risk and Components of RMI
Downside Risk Aggregate Risk RMIt−1
CRO Presentt−1 -0.263 -0.077 0.715
CRO Executivet−1 -0.250 -0.099 0.696
CRO Top5t−1 -0.017 0.027 0.349
CRO Centralityt−1 -0.007 -0.047 0.343
Board Committee Experiencet−1 -0.306 0.008 0.533
Report to Boardt−1 -0.146 -0.112 0.059
Active Board Risk Committeet−1 -0.193 -0.142 0.321
33

Table
III:
RM
Iand
perf
orm
ance
duri
ng
cri
sis
years
This
table
rep
ort
sth
ere
sult
sof
the
cross
-sec
tional
regre
ssio
n(1
)th
at
exam
ines
whet
her
BH
Cs
wit
hst
rong
and
indep
enden
tri
skm
anagem
ent
funct
ions
in2006
fare
db
ette
rduri
ng
the
cris
isyea
rs.
We
confine
the
regre
ssio
nto
the
cris
isyea
rs,
2007
and
2008.
Defi
nit
ions
of
vari
able
sare
list
edin
App
endix
B.
The
key
indep
enden
tva
riable
isth
eR
MI
in2006.
We
incl
ude
yea
rfixed
effec
tsin
the
regre
ssio
n.
Sta
ndard
erro
rsare
rep
ort
edin
pare
nth
eses
.A
ster
isks
den
ote
stati
stic
al
signifi
cance
at
the
1%
(***),
5%
(**)
and
the
10%
(*)
level
s.
Dep
.V
ari
able
=M
BS
hold
ings
Tra
din
gA
sset
sD
eriv
.T
radin
gR
OA
Sto
ckR
eturn
Imp.
Vol.
Raw
($m
n)
Sca
led
Raw
($m
n)
Sca
led
Raw
($m
n)
Sca
led
(1)
(2)
(3)
(4)
(5)
(6)
(7)
(8)
(9)
RM
Iin
2006
-13.2
05
-.003
-110.5
78
-.039
-9350.8
33
-4.1
00
.013
.261
-.207
(6.2
66)∗∗
(.003)
(46.5
57)∗∗
(.017)∗∗
(4237.4
01)∗∗
(2.1
37)∗
(.007)∗
(.187)
(.072)∗∗∗
Siz
e2006
5.7
42
.0007
43.9
87
.021
5729.0
65
3.1
67
-.003
-.087
-.008
(1.6
31)∗∗∗
(.0008)
(12.4
65)∗∗∗
(.005)∗∗∗
(1881.6
27)∗∗∗
(1.0
06)∗∗∗
(.0008)∗∗∗
(.040)∗∗
(.010)
RO
Ain
2006
-284.6
56
-.082
-2193.1
23
-.974
-377111.1
00
-204.9
85
1.2
62
12.7
83
-4.6
08
(161.2
25)∗
(.146)
(1190.5
37)∗
(.597)
(215229.1
00)∗
(116.7
66)∗
(.230)∗∗∗
(7.7
52)∗
(1.9
87)∗∗
Tie
r1C
ap/A
sset
sin
2006
51.9
75
-.075
586.6
46
.221
107356.2
00
56.9
29
-.055
-3.6
38
.962
(47.7
52)
(.049)
(369.4
82)
(.176)
(64777.2
10)∗
(35.1
38)
(.068)
(2.2
25)
(.604)
Bad
loans/
Ass
ets
in2006
-312.9
84
-.488
-1179.5
32
-1.1
39
-213323.0
00
-133.5
72
-.274
.468
14.2
77
(148.7
45)∗∗
(.170)∗∗∗
(1006.3
56)
(.476)∗∗
(146321.7
00)
(77.9
19)∗
(.429)
(13.7
48)
(7.0
57)∗∗
Dep
osi
ts/A
sset
sin
2006
-11.5
67
-.049
5.3
90
-.048
5629.1
84
4.3
11
-.007
.244
-.017
(6.0
13)∗
(.012)∗∗∗
(57.4
10)
(.022)∗∗
(8333.5
20)
(4.5
74)
(.012)
(.408)
(.206)
RO
Ain
2006
-11.2
01
-.015
-56.5
57
-.063
-9536.0
08
-7.3
18
-.018
-.182
-.291
(7.3
47)
(.008)∗
(45.7
30)
(.020)∗∗∗
(7098.1
22)
(3.3
68)∗∗
(.010)∗
(.312)
(.190)
Const
.-7
3.8
71
.045
-669.5
06
-.253
-92340.2
10
-50.7
29
.047
1.6
59
.709
(27.6
02)∗∗∗
(.024)∗
(219.9
49)∗∗∗
(.088)∗∗∗
(34110.1
80)∗∗∗
(18.4
45)∗∗∗
(.018)∗∗∗
(.878)∗
(.239)∗∗∗
Obs.
134
134
134
134
134
134
134
128
49
R2
.523
.654
.476
.66
.384
.422
.783
.309
.541
Yea
rF
EY
esY
esY
esY
esY
esY
esY
esY
esN
o
34
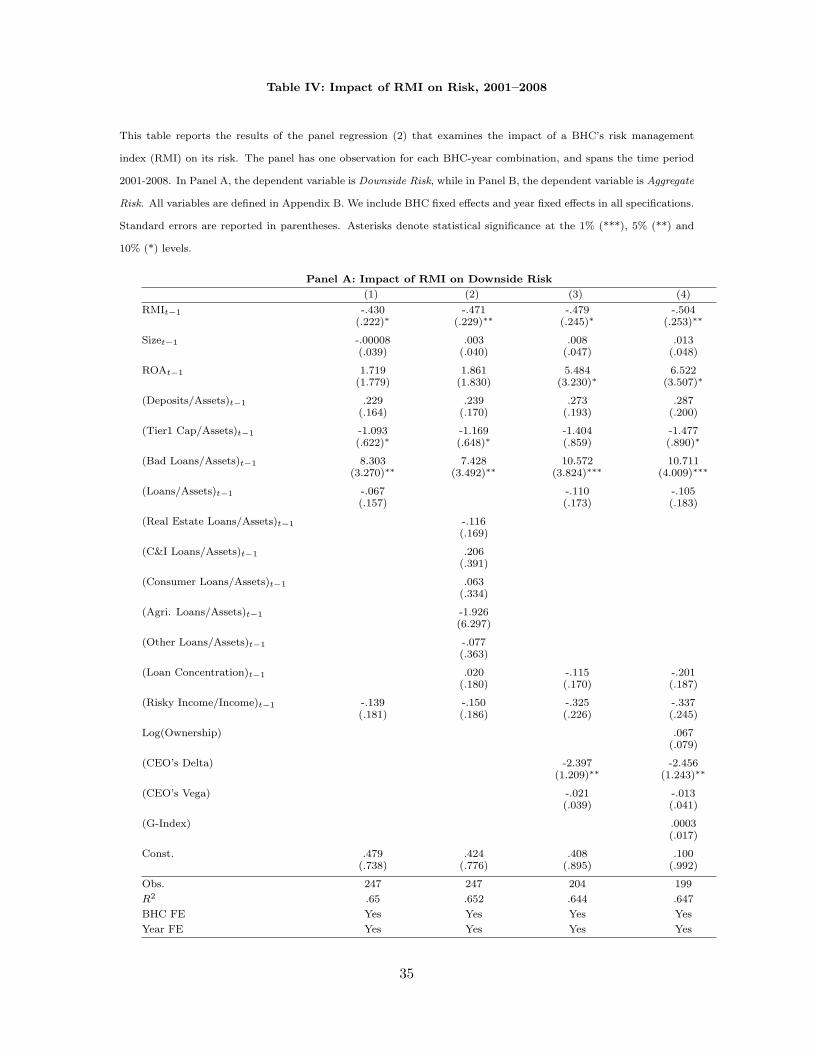
Table IV: Impact of RMI on Risk, 2001–2008
This table reports the results of the panel regression (2) that examines the impact of a BHC’s risk management
index (RMI) on its risk. The panel has one observation for each BHC-year combination, and spans the time period
2001-2008. In Panel A, the dependent variable is Downside Risk, while in Panel B, the dependent variable is Aggregate
Risk. All variables are defined in Appendix B. We include BHC fixed effects and year fixed effects in all specifications.
Standard errors are reported in parentheses. Asterisks denote statistical significance at the 1% (***), 5% (**) and
10% (*) levels.
Panel A: Impact of RMI on Downside Risk
(1) (2) (3) (4)
RMIt−1 -.430 -.471 -.479 -.504(.222)∗ (.229)∗∗ (.245)∗ (.253)∗∗
Sizet−1 -.00008 .003 .008 .013(.039) (.040) (.047) (.048)
ROAt−1 1.719 1.861 5.484 6.522(1.779) (1.830) (3.230)∗ (3.507)∗
(Deposits/Assets)t−1 .229 .239 .273 .287(.164) (.170) (.193) (.200)
(Tier1 Cap/Assets)t−1 -1.093 -1.169 -1.404 -1.477(.622)∗ (.648)∗ (.859) (.890)∗
(Bad Loans/Assets)t−1 8.303 7.428 10.572 10.711(3.270)∗∗ (3.492)∗∗ (3.824)∗∗∗ (4.009)∗∗∗
(Loans/Assets)t−1 -.067 -.110 -.105(.157) (.173) (.183)
(Real Estate Loans/Assets)t−1 -.116(.169)
(C&I Loans/Assets)t−1 .206(.391)
(Consumer Loans/Assets)t−1 .063(.334)
(Agri. Loans/Assets)t−1 -1.926(6.297)
(Other Loans/Assets)t−1 -.077(.363)
(Loan Concentration)t−1 .020 -.115 -.201(.180) (.170) (.187)
(Risky Income/Income)t−1 -.139 -.150 -.325 -.337(.181) (.186) (.226) (.245)
Log(Ownership) .067(.079)
(CEO’s Delta) -2.397 -2.456(1.209)∗∗ (1.243)∗∗
(CEO’s Vega) -.021 -.013(.039) (.041)
(G-Index) .0003(.017)
Const. .479 .424 .408 .100(.738) (.776) (.895) (.992)
Obs. 247 247 204 199
R2 .65 .652 .644 .647
BHC FE Yes Yes Yes Yes
Year FE Yes Yes Yes Yes
35

Panel B: Impact of RMI on Aggregate Risk
(1) (2) (3) (4)
RMIt−1 -.064 -.061 -.048 -.056(.029)∗∗ (.029)∗∗ (.029)∗ (.030)∗
Sizet−1 .0002 .0005 -.007 -.006(.005) (.005) (.004) (.005)
ROAt−1 -.314 -.375 -.363 -.142(.166)∗ (.172)∗∗ (.342) (.387)
(Deposits/Assets)t−1 .030 .033 .042 .040(.019) (.019)∗ (.020)∗∗ (.021)∗
(Tier1 Cap/Assets)t−1 .040 .031 .006 -.006(.078) (.079) (.090) (.097)
(Bad Loans/Assets)t−1 .993 .886 1.298 1.333(.308)∗∗∗ (.314)∗∗∗ (.372)∗∗∗ (.418)∗∗∗
(Loans/Assets)t−1 -.043 -.033 -.025(.020)∗∗ (.019)∗ (.021)
(Real Estate Loans/Assets)t−1 -.052(.022)∗∗
(C&I Loans/Assets)t−1 .017(.049)
(Consumer Loans/Assets)t−1 -.043(.042)
(Agri. Loans/Assets)t−1 -.950(.465)∗∗
(Other Loans/Assets)t−1 -.042(.041)
(Loan Concentration)t−1 .040 .032 .023(.020)∗∗ (.019) (.021)
(Risky Income/Income)t−1 -.052 -.056 -.006 .008(.024)∗∗ (.024)∗∗ (.024) (.028)
Log(Ownership) .007(.007)
CEO’s Delta -.118 -.109(.150) (.154)
CEO’s Vega -.007 -.005(.004) (.005)
G-Index .002(.002)
Const. .060 .033 .144 .072(.087) (.089) (.082)∗ (.103)
Obs. 436 436 284 268
R2 .798 .803 .851 .855
BHC FE Yes Yes Yes Yes
Year FE Yes Yes Yes Yes
36
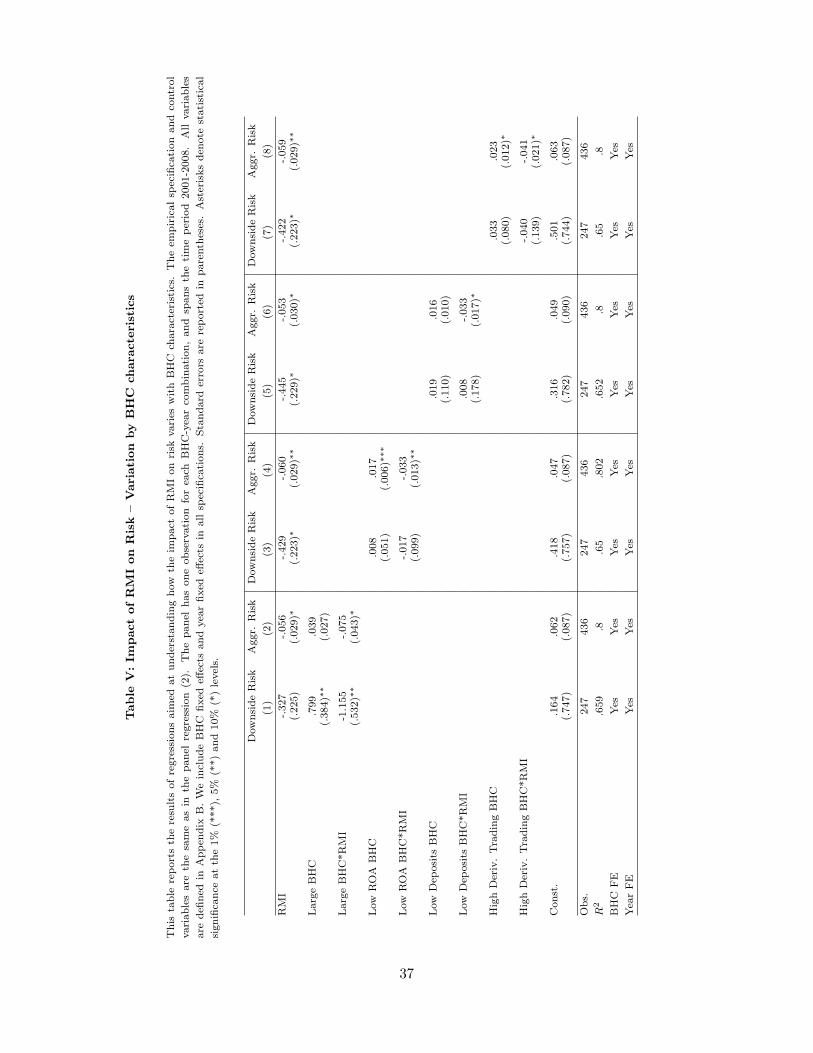
Table
V:Im
pact
ofR
MI
on
Ris
k–
Vari
ati
on
by
BH
Cch
ara
cte
rist
ics
Th
ista
ble
rep
ort
sth
ere
sult
sof
regre
ssio
ns
aim
edat
un
der
stan
din
gh
ow
the
imp
act
of
RM
Ion
risk
vari
esw
ith
BH
Cch
ara
cter
isti
cs.
Th
eem
pir
ical
spec
ifica
tion
an
dco
ntr
ol
vari
ab
les
are
the
sam
eas
inth
ep
an
elre
gre
ssio
n(2
).T
he
pan
elh
as
on
eob
serv
ati
on
for
each
BH
C-y
ear
com
bin
ati
on
,an
dsp
an
sth
eti
me
per
iod
2001-2
008.
All
vari
ab
les
are
defi
ned
inA
pp
end
ixB
.W
ein
clu
de
BH
Cfi
xed
effec
tsan
dyea
rfi
xed
effec
tsin
all
spec
ifica
tion
s.S
tan
dard
erro
rsare
rep
ort
edin
pare
nth
eses
.A
ster
isks
den
ote
stati
stic
al
sign
ifica
nce
at
the
1%
(***),
5%
(**)
an
d10%
(*)
level
s.
Dow
nsi
de
Ris
kA
ggr.
Ris
kD
ow
nsi
de
Ris
kA
ggr.
Ris
kD
ow
nsi
de
Ris
kA
ggr.
Ris
kD
ow
nsi
de
Ris
kA
ggr.
Ris
k
(1)
(2)
(3)
(4)
(5)
(6)
(7)
(8)
RM
I-.
327
-.056
-.429
-.060
-.445
-.053
-.422
-.059
(.225)
(.029)∗
(.223)∗
(.029)∗∗
(.229)∗
(.030)∗
(.223)∗
(.029)∗∗
Larg
eB
HC
.799
.039
(.384)∗∗
(.027)
Larg
eB
HC
*R
MI
-1.1
55
-.075
(.532)∗∗
(.043)∗
Low
RO
AB
HC
.008
.017
(.051)
(.006)∗∗∗
Low
RO
AB
HC
*R
MI
-.017
-.033
(.099)
(.013)∗∗
Low
Dep
osi
tsB
HC
.019
.016
(.110)
(.010)
Low
Dep
osi
tsB
HC
*R
MI
.008
-.033
(.178)
(.017)∗
Hig
hD
eriv
.T
rad
ing
BH
C.0
33
.023
(.080)
(.012)∗
Hig
hD
eriv
.T
rad
ing
BH
C*R
MI
-.040
-.041
(.139)
(.021)∗
Con
st.
.164
.062
.418
.047
.316
.049
.501
.063
(.747)
(.087)
(.757)
(.087)
(.782)
(.090)
(.744)
(.087)
Ob
s.247
436
247
436
247
436
247
436
R2
.659
.8.6
5.8
02
.652
.8.6
5.8
BH
CF
EY
esY
esY
esY
esY
esY
esY
esY
es
Yea
rF
EY
esY
esY
esY
esY
esY
esY
esY
es
37

Table VI: Impact of RMI on Stock Returns, 2001–2008
This table reports the results of the panel regression (2) that examines the impact of a BHC’s risk management index
(RMI) on its stock return. The panel has one observation for each BHC-year combination, and spans the time period
2001-2008. The dependent variable in the regression is the annual return (computed over the calendar year) on the
BHC’s stock. All variables are defined in Appendix B. We include BHC fixed effects and year fixed effects in all
specifications. Standard errors are reported in parentheses. Asterisks denote statistical significance at the 1% (***),
5% (**) and 10% (*) levels.
Dep. Variable = Annual Return on BHC’s Stock
(1) (2) (3) (4)
RMIt−1 1.007 1.003 .947 1.008(.399)∗∗ (.401)∗∗ (.437)∗∗ (.445)∗∗
Sizet−1 -.407 -.412 -.392 -.449(.064)∗∗∗ (.064)∗∗∗ (.075)∗∗∗ (.079)∗∗∗
ROAt−1 -4.438 -4.222 -12.719 -15.352(2.271)∗ (2.362)∗ (5.546)∗∗ (6.004)∗∗
(Deposits/TA)t−1 -.117 -.151 -.503 -.619(.258) (.265) (.321) (.327)∗
(Tier1 Cap/TA)t−1 .647 .780 -.314 -.566(1.066) (1.084) (1.510) (1.580)
(Bad Loans/TA)t−1 -2.937 -1.356 -8.922 -8.065(4.209) (4.316) (5.961) (6.403)
(Loans/TA)t−1 -.056 -.065 -.094(.275) (.320) (.333)
(Real Estate Loans/TA)t−1 .061(.300)
(C&I Loans/TA)t−1 -.727(.677)
(Consumer Loans/TA)t−1 -.354(.583)
(Agri. Loans/TA)t−1 12.195(6.402)∗
(Other Loans/TA)t−1 -.052(.558)
(Loan Concentration)t−1 -.195 .024 .099(.276) (.306) (.324)
(Risky Income/Income)t−1 .307 .380 .620 .915(.334) (.337) (.400) (.445)∗∗
Log(Ownership)t−1 .002(.119)
CEO’s Deltat−1 .050 .058(1.614) (1.615)
CEO’s Vegat−1 .102 .096(.077) (.085)
G-Indext−1 -.008(.034)
Const. 6.528 6.728 6.632 7.833(1.192)∗∗∗ (1.224)∗∗∗ (1.474)∗∗∗ (1.675)∗∗∗
Obs. 436 436 294 277
R2 .657 .663 .697 .721
BHC FE Yes Yes Yes Yes
Year FE Yes Yes Yes Yes
38

Table VII: Simultaneous Equations Model
This table reports the results of the simultaneous equations regressions model (3) designed to account for how
risk and RMI are jointly determined. The risk measure in Panel A is Downside Risk, while the risk measure
in Panel B is Aggregate Risk. Variable definitions are listed in Appendix B. We estimate the model using
three-stage least squares (3SLS). Standard errors are reported in parentheses. Asterisks denote statistical
significance at the 1% (***), 5% (**) and 10% (*) levels.
Panel A Panel B
Downside Risk RMI Aggregate Risk RMI
(1) (2) (3) (4)
RMI -.266 -.022(.087)∗∗∗ (.010)∗∗
Downside Risk -1.342(.693)∗
Aggregate Risk -9.145(3.818)∗∗
Sizet−1 .0006 .066 -.0009 .070(.007) (.023)∗∗∗ (.0008) (.015)∗∗∗
ROAt−1 -3.578 -7.293 -.408 -5.579(1.258)∗∗∗ (3.077)∗∗ (.116)∗∗∗ (2.348)∗∗
(Deposits/Assets)t−1 -.077 -.012(.044)∗ (.004)∗∗∗
(Tier1 Cap/Assets)t−1 .854 1.771 .057 .894(.342)∗∗ (.817)∗∗ (.031)∗ (.590)
(Loans/Assets)t−1 .134 .193(.104) (.071)∗∗∗
(Loan Concentration)t−1 .055 .010(.033)∗ (.004)∗∗∗
(Bad Loans/Assets)t−1 1.870 3.640 .683 10.293(1.833) (4.148) (.183)∗∗∗ (3.545)∗∗∗
(Risky Income/Income)t−1 .024 .170 .008 .283(.064) (.145) (.007) (.122)∗∗
(Deriv. Hedging)t−1 -3.54e-10 -3.60e-10(1.52e-10)∗∗ (1.01e-10)∗∗∗
Obs. 242 242 368 368
R2 .307 .35 .336 .278
Year FE Yes Yes Yes Yes
39