Stress Measurement from Tongue Color Imaging · This paper studies tongue color changes in the...
6
2017 Seventh International Conference on Affective Computing and Intelligent Interaction (ACII) 978-1-5386-0563-9/17/$31.00 ©2017 IEEE Stress Measurement from Tongue Color Imaging Javier Hernandez 1 , Craig Ferguson 1 , Akane Sano 1 , Weixuan Chen 1 , Weihui Li 2 , Albert S. Yeung 3 , Rosalind W. Picard 1 Media Lab, Massachusetts Institute of Technology, Cambridge, United States 1 Wentworth Institute of Technology, Boston, United States 2 Harvard Medical School, Boston, United States 3 {javierhr, fergusoc, akanes, cvx, picard}@media.mit.edu 1 , [email protected] 2 , [email protected] 3 Abstract— A growing number of studies show links between changes in tongue appearance and human health conditions. This paper studies tongue color changes in the context of stress to explore the feasibility of providing a novel and non-invasive stress measurement method. In a laboratory study, 24 participants were asked to perform a calm and a stressful math task and to take a photo of their tongue right after each of the tasks. We observed subtle but consistent color differences between calm and stress tasks for up to 75% of the participants, which was consistent with both self-report and physiological metrics of stress. Moreover, we observed significant correlations of up to 0.72 between certain tongue colors and long-term stress assessed with the 10-item Perceived Stress Scale questionnaire. We discuss the potential implications of this work and highlight some lines of future research. 1. Introduction For over 2,000 years, Asian countries such as China have used tongue analysis to examine physiological and pathological changes of the human body. This technique is one of the main diagnostic tools of what is now commonly known as a traditional or alternative medicine. While alternative methods are increasingly incorporated into the mainstream healthcare system, traditional eastern medicine is based on complex theories and holistic concepts that are not easily mapped to western scientific equivalents [1]. In the context of tongue analysis, one of the main criticisms is that it requires the subjective assessment of an expert which is often difficult to replicate and validate. Moreover, tongue analysis information is usually combined with other subjective approaches (e.g., inspection, palpation) to refine the final assessment. To help standardize tongue diagnosis and minimize challenges, researchers have started to explore the use of cameras and automated methods in different health conditions [2][3][4]. Inspired by these studies, this paper examines tongue color changes in the context of stress measurement (see Fig. 1). Among the different conditions, we decided to focus on stress due to three main reasons. First, there is over a century of physiological research studying the stress response and demonstrating not only repeatable body changes but also their underlying impact on many health conditions. We hypothesized that some of the well-known physiological changes such as saliva composition, muscle tension, or blood circulation could potentially influence the tongue appearance [5][6]. Second, some of the theories behind traditional medicine (e.g., Yin-Yang) resemble some of the ideas in the psychophysiology of stress. In particular, both approaches place a special emphasis on the role of homeostatic balance and how any deviation may yield to body changes and negative health conditions. Finally, there is a growing interest in the development of automated and non- invasive stress monitors which can help prevent some of the negative health effects of chronic stress [7][8]. If stress changes could be readily sensed by low-cost and pervasive sensors such as cameras, it could greatly reduce the cost and burden associated with current sensing methods (e.g., hormone testing, sticky irritable electrodes on the chest). We believe the work presented here is the first to study the influence of stress on tongue appearance in a controlled laboratory setting. The paper is organized as follows. First, we describe some of the previous work in the context of automated tongue analysis. Second, we provide the details about the methodology used in this work. Third, we review and discuss the results. Finally, we provide some concluding remarks. Figure 1. This work uses a camera to capture tongue images in a private and controlled-lighting booth setting (left) and studies tongue color changes to measure self-reported stress.
Transcript of Stress Measurement from Tongue Color Imaging · This paper studies tongue color changes in the...

2017 Seventh International Conference on Affective Computing and Intelligent Interaction (ACII)
978-1-5386-0563-9/17/$31.00 ©2017 IEEE
Stress Measurement from Tongue Color Imaging
Javier Hernandez1, Craig Ferguson1, Akane Sano1, Weixuan Chen1, Weihui Li2, Albert S. Yeung3, Rosalind W. Picard1 Media Lab, Massachusetts Institute of Technology, Cambridge, United States1
Wentworth Institute of Technology, Boston, United States2 Harvard Medical School, Boston, United States3
{javierhr, fergusoc, akanes, cvx, picard}@media.mit.edu1, [email protected], [email protected]
Abstract— A growing number of studies show links between changes in tongue appearance and human health conditions. This paper studies tongue color changes in the context of stress to explore the feasibility of providing a novel and non-invasive stress measurement method. In a laboratory study, 24 participants were asked to perform a calm and a stressful math task and to take a photo of their tongue right after each of the tasks. We observed subtle but consistent color differences between calm and stress tasks for up to 75% of the participants, which was consistent with both self-report and physiological metrics of stress. Moreover, we observed significant correlations of up to 0.72 between certain tongue colors and long-term stress assessed with the 10-item Perceived Stress Scale questionnaire. We discuss the potential implications of this work and highlight some lines of future research.
1. Introduction
For over 2,000 years, Asian countries such as China have used tongue analysis to examine physiological and pathological changes of the human body. This technique is one of the main diagnostic tools of what is now commonly known as a traditional or alternative medicine. While alternative methods are increasingly incorporated into the mainstream healthcare system, traditional eastern medicine is based on complex theories and holistic concepts that are not easily mapped to western scientific equivalents [1].
In the context of tongue analysis, one of the main criticisms is that it requires the subjective assessment of an expert which is often difficult to replicate and validate. Moreover, tongue analysis information is usually combined with other subjective approaches (e.g., inspection, palpation) to refine the final assessment. To help standardize tongue diagnosis and minimize challenges, researchers have started to explore the use of cameras and automated methods in different health conditions [2][3][4]. Inspired by these studies, this paper examines tongue color changes in the context of stress measurement (see Fig. 1).
Among the different conditions, we decided to focus on stress due to three main reasons. First, there is over a century of physiological research studying the stress response and demonstrating not only repeatable body changes but also their underlying impact on many health conditions.
We hypothesized that some of the well-known physiological changes such as saliva composition, muscle tension, or blood circulation could potentially influence the tongue appearance [5][6]. Second, some of the theories behind traditional medicine (e.g., Yin-Yang) resemble some of the ideas in the psychophysiology of stress. In particular, both approaches place a special emphasis on the role of homeostatic balance and how any deviation may yield to body changes and negative health conditions. Finally, there is a growing interest in the development of automated and non-invasive stress monitors which can help prevent some of the negative health effects of chronic stress [7][8]. If stress changes could be readily sensed by low-cost and pervasive sensors such as cameras, it could greatly reduce the cost and burden associated with current sensing methods (e.g., hormone testing, sticky irritable electrodes on the chest). We believe the work presented here is the first to study the influence of stress on tongue appearance in a controlled laboratory setting.
The paper is organized as follows. First, we describe some of the previous work in the context of automated tongue analysis. Second, we provide the details about the methodology used in this work. Third, we review and discuss the results. Finally, we provide some concluding remarks.
Figure 1. This work uses a camera to capture tongue images in a private and controlled-lighting booth setting (left) and studies
tongue color changes to measure self-reported stress.

2. Previous Work
Traditional tongue diagnosis involves analyzing several tongue features such as color, shape, coating, marks, movements, and sublingual veins [9]. While there is variance across individuals, a healthy tongue is usually considered whenever it has a pale-red color, it is neither too thin nor too swollen, it is neither too stiff nor too flabby, and it is slightly moist [10]. The occurrence of adverse health effects has shown to elicit interesting tongue appearance changes. For instance, Pang et al. [11] demonstrated that patients with appendicitis often display red prickles on the tip of the tongue. In a separate example, Kim et al. [12] and Jung et al. [13] showed that increased tongue fat and white coating are associated with certain sleep disorders, respectively. There also seems to be a higher occurrence of geographic and fissured tongues among people with psoriasis [14][15][16]. Some other studied conditions include gastritis [17][18], diabetes [18][19], cancer [4][20], and HIV [21].
Despite the strong links between stress and negative health conditions, there are very few studies that have focused on the role of stress in tongue appearance. Some of the few exceptions considered people with geographic tongues. This type of tongue is affected by a benign inflammatory condition of the mucous membrane that is characterized by a map-like appearance. In particular, an early study by Redman et al. [22] showed that the size of the geographic marks is associated with the severity of the experienced stress. In a separate study, Ebrahimi et al. [23] found that people with geographic tongues reported higher stress levels than those who did not. While these findings show promise towards the non-invasive stress measurement, geographic tongues are very infrequent (below 3% of the population based on most surveys [24]). In contrast, our work focuses on non-geographic tongues which are more prevalent in the entire population.
3. Methods
This section describes the methodology used to capture the data as well as the experimental protocol of the study.
3.1. Tongue Capture
When taking a photo of the tongue, there are many factors that can influence the appearance of the tongue. For
instance, the illumination of the room or previous food intake can dramatically change tongue color [25]. Moreover, tongue shapes can significantly vary depending on how participants stick them out, which may be even more pronounced in front of an unknown experimenter. To help minimize some of these factors, we repurposed a decorative phone booth (shown in Fig. 1) to offer a private and controlled space to show and capture the tongue. Inside the booth, we installed a base with a chin support and a digital camera (DSC-RX100M3 Sony) which captured photos at a resolution of 5472x3648 pixels. We also installed four arrays of 10 white LEDs which were symmetrically distributed around the camera to create uniform illumination of the tongue. In addition, the windows of the booth were covered with black fabric to help prevent environmental and external light from coming in.
3.2. Tongue Analysis
To start analyzing the tongue, it first needs to be segmented to remove unnecessary information. In this work, we use the GRABCUT segmentation algorithm [26] which offers an interactive method to segment the tongue. While this process is more time-consuming than other fully automated segmentation algorithms, we found this approach to be the most reliable and time-efficient approach for the considered sample size.
After segmentation, different types of features can be extracted from the tongue. This work focuses on color features, which are some of the main parameters used during visual examination by traditional experts [10]. There exists a wide variety of models that arrange colors along multiple components in different ways depending on the intended application [27]. In this paper, we consider the following frequently used color representations: RGB, CIE Lab, CIE Luv, YIQ, and YUV. While the RGB separates the colors into Red, Green and Blue components, the CIE* and Y* spaces separate the lightness and luma components of the images from the color components, respectively. As can be seen in Fig. 2, each of the components has opponent colors and the color redistribution from space to space allows to capture changes in different ways. For instance, the “Q” component of the YIQ space has purple and green on the highest and lowest points, respectively. This is the same for the “a” component of the CIE Lab space but the arrangement and the
Figure 2. Color spaces used to study the tongue color changes during stress. Orange rectangles indicate color components that showed consistent and significant changes during the short-term stress task; red circles indicate color components that showed significant
correlations with the Perceived Stress Scale scores.
distance between colors is different. Note that the “L” and “Y” components are part of two color spaces so this work considers a total of 13 different color channels. To perform the analysis, we transformed each of the tongues images into the previous spaces and extracted the average value from each of the color components. Note that using the average metric allows the comparison of different tongue sizes while being robust to potential outliers such as those that may appear on tongue edges due to different positions.
3.3. Experimental Protocol
In order to collect the data, we designed a within-subjects laboratory experiment which was pre-approved by the Institutional Review Board of the Massachusetts Institute of Technology.
Participants started the experiment by completing a training session to help minimize novelty effects associated with the computer interface, the physiological sensors, and the process of capturing the tongue. Upon the training completion, participants continued with a calm and a stress two-minute arithmetic task in counterbalanced order. At the beginning of each task, the participants were elicited to a neutral state, either with a two-minute clip of relaxing scenes of paradise beaches or closing their eyes and think about something relaxing. While the calm task instructed participants to perform single-digit additions at their own pace, the stress task instructed participants to successively subtract seven from 4000 as fast as possible. To elicit additional stress during the latter, a loud traffic noise was played in the background and a cumulative score reflecting the number of mistakes was displayed. After completing each of the tasks, participants were asked to first provide self-report emotional valence, arousal, and stress on a 7-point Likert scale (as shown in Fig. 1) and then take a photo of their tongue at the booth. We chose this ordering to help
minimize potential self-report biases associated with the novel experience of taking a photo inside the booth. Fig. 3 shows the flow chart of the experimental protocol. After completion of the two tasks, participants completed the 10-item Perceived Stress Scale [28] (PSS) that provides an indication of their stress levels during the previous month. All the tasks were implemented with the Processing software environment [29].
Throughout the experiment, participants wore a wrist-worn QTM biosensor (Affectiva, Inc.) that captured electrodermal activity and skin temperature on each of their wrists, as well as a chest-worn BioPatch biosensor (Zephyr, Inc.) that captured heart rate and breathing rate. Both biosensors used pre-gelled sticky electrodes that helped reduce motion artifacts. To help minimize the potential influence of speech on physiological signals and potential tongue appearance, participants were requested to avoid speaking during the experiment and to type their answers. To minimize potential food debris and stimulation of salivation, participants of the study were required to not smoke, eat, or drink anything besides water for at least one hour before the experiment. The whole study lasted around 25 minutes and participants received a $5 Amazon gift card compensation.
A total of 24 people (balanced gender) participated in our study. The average age is 26 (minimum of 18 and maximum of 36). Nine of the participants were Asian, two were Hispanic or Latino, and the rest were White. None of the participants reported having any major cardiovascular, respiratory or musculoskeletal condition.
4. Results
This section reviews the self-reported and physiological metrics of stress as well as tongue color changes associated with stress. When considering short-term stress, we use the non-parametric Wilcoxon sign-rank test to analyze the self-reports and the paired-samples sign test to compare the physiological and tongue color changes between the stress and calm tasks. When considering long-term stress, we use the Spearman’s rank-order correlation coefficient to study the relationship between PSS scores and tongue colors. Statistical significance was considered if p < 0.05. Note, however, that the p-value is not adjusted with the number of comparisons, potentially increasing type I errors (i.e., false positives) at the expense of reducing type II errors (i.e., false negatives). Due to the exploratory stage of this research, we considered unadjusted p to be more appropriate.
Valence Arousal Stress
Ver
y pl
easa
ntV
ery
unpl
easa
nt
Ver
y en
erge
ticL
ow e
nerg
y
Ver
yN
ot a
t all
* * *
Figure 4. Average (bars) and standard error (lines) of self-reports
after the calm (blue) and stress tasks (red). *p<0.05
Training
Single Digit Additions
Successive Subtractions Single Digit Additions
Successive Subtractions EmotionalSelf-reports
+TongueCapture
Emotional Self-reports
+TongueCapture
Baseline
Relaxation
Baseline
Relaxation
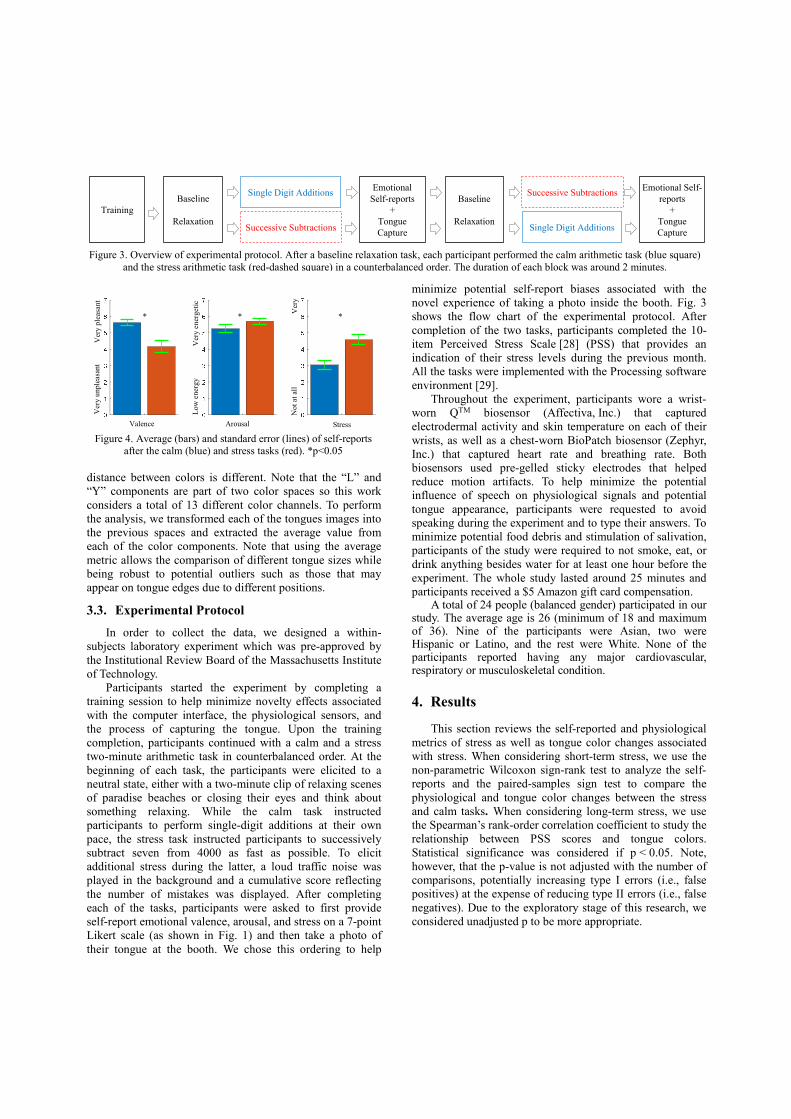
Figure 3. Overview of experimental protocol. After a baseline relaxation task, each participant performed the calm arithmetic task (blue square)
and the stress arithmetic task (red-dashed square) in a counterbalanced order. The duration of each block was around 2 minutes.

4.1. Self-reported and Physiological Stress
As shown in Fig. 4, the stress task yielded a decrease of valence, an increase of arousal, and an increase of stress levels (Z=3.390 and p=0.001, Z=-2.023 and p=0.043, and Z=-3.118 and p=0.002, respectively). While the arousal increased in the expected direction, the average arousal levels for calm and stress tasks were relatively high (5.25 and 5.7 in the 7 Likert scale, respectively), which indicates that both tasks were arousing but with different valence and stress. Of the physiological signals, the stress task yielded an increase in average electrodermal activity amplitude and heart rate (Z=-2.094, p=0.047, and Z=-3.491, p<0.001, respectively). We also attempted to estimate heart-rate variability (HRV) but many of the Zephyr HRV signals were too noisy to be trusted, so examining reliable HRV associations remains future work. No consistent differences were found in terms of breathing rate or wrist skin temperature (Z=0, p=1 for both). The breathing could have been partially controlled by participants as we asked them to remain silent during the experiment. Skin temperature average values showed an increased pattern during the whole experiment irrespective of the task ordering. This trend indicates that a longer period of time is needed to get a skin temperature baseline. Overall, these findings support that the different tasks successfully elicited the intended self-reported and physiological states.
4.2. Short-term Stress
Fig. 5 shows the segmented RGB tongue images right after the calm (top) and the stress (bottom) tasks for each of
the participants (columns). To examine the potential relationship of short-term stress and tongue appearance, we statistically compare the different tongue colors after the calm and stress tasks. While most color components did not show significant changes, the “Q” component from the YIQ space and the “a” component from the Lab space showed consistent differences (Z=2.100, p=0.034 and Z=2.245, p=0.025, respectively). Fig. 6 shows the amount of “a” for each one of the tongues. As purple changes associated with high “a” values are difficult to perceive, higher/lower “a” values have been mapped into a red/blue color space, respectively. Fig. 7 shows the difference of average “a” value between the stress and calm tasks for all the participants. Thus, positive values indicate a higher amount of “a” (i.e., more purple) during the stress task, and negative values indicate a lower amount of “a” during the stress task. As can be seen, 18 out of the 24 participants (75%) show a higher amount of “a” component (i.e., red in Fig. 6) after the stress task (e.g., P9, P12, P15, P22). However, the opposite happens for a smaller set of the participants (e.g., P4, P18, P20). Note that these changes are very subtle and cannot be readily seen in the RGB images of Fig. 5.
4.3. Long-term Stress
To examine the potential relationship between long-term stress and tongue appearance, we computed the correlation between PSS scores and the average colors of the tongue images. To help minimize the potential influence of short-term stress, we use the tongue images captured after the calm task. Fig. 5 shows the participants sorted by decreasing PSS score, with the left-most participants having the higher PSS scores (i.e., reporting higher long-term stress). In this case, 5 out of the 13 different color components yielded a significant
Figure 1. Tongue images after the calm (top) and the stress (bottom) tasks for each of the participants (columns). The participants have been sorted in decreasing order based on their Perceived Stress Scale score.
Figure 2. Heat maps showing the amount of “a” value in the Lab color space after the calm (top) and stress (bottom) tasks for each of the participants (columns). For visualization purposes, higher/lower “a” values have been mapped into a red/blue color space, respectively.

correlation. In particular, the “R”, “G” and “B” from the RGB representation (r=0.596, p=0.002, r=0.722, p<0.001, and r=0.667, p<0.001, respectively), the “L” from the L* space (r=0.729, p<0.001), and the “Y” from the Y* space (r=0.725, p<0.001) yielded positive correlations. As an example, Fig. 8 illustrates the relationship between the PSS scores and the average “G” (i.e., green) channel of the tongue images, showing a significant positive correlation (i.e., increased green component with higher PSS scores). Note that the combined changes of the previous components yield an increase of white component that can be readily seen in the RGB images of Fig. 5.
5. Discussion
This paper describes a controlled laboratory study in which tongue color is studied in the context of stress. In particular, we designed a within-subjects study in which 24 participants performed a calm and a stress arithmetic task in counterbalanced order. Self-reported and physiological metrics of stress support that the tasks effectively elicited the intended emotional states. Furthermore, we observed subtle but consistent changes associated with short-term and long-term stress in certain color spaces. As shown in Fig. 2, color components that better capture the purple component without the effect of illumination showed a consistent increase during the stress arithmetic task. In contrast, color components that better capture the white component showed a strong correlation with PSS scores (long-term stress).
While the sample size is too small to draw firm conclusions, we believe the changes in tongue appearance are partly due to the effects of short-term and long-term stress. On the one hand, short-term stress has been shown to increase heart rate and to move the blood flow away from the skin towards muscles and core organs in preparation for the fight-or-flight response. Furthermore, muscles such as the masseter (mastication muscle) are activated during stress and several aspects of saliva are changed (e.g., cortisol levels, flow rates) [6]. As a result, any of these changes could potentially contribute to the increase of purple color in the
tongue. In traditional medicine, purple/blue-ish tongue color indicates blood stasis [30] which is usually associated with stress and is consistent with our findings. On the other hand, long-term stress has been shown to influence gastrointestinal motor activity as well as exacerbate gastrointestinal disorders [31][32] which could affect tongue appearance due to its relatively direct connection. Indeed, some disorders such as gastritis [33] or dyspepsia [34] have been shown to have the white tongue pattern. In the case of gastritis, Sun et al. [33] concluded that these changes are partly formed due to the glucose metabolism which is consistent with the increase in blood glucose during stress. Similarly, white tongue coatings have been observed in diabetic people which have abnormally high blood glucose levels [35]. In traditional medicine, long-term blood stasis leads to blood deficiency which is often manifested as pale tongue color and is consistent with the increase of white color.
In addition to the small number of participants, our work has several limitations. In a typical assessment by a human practitioner, the patients would be allowed to talk but we asked participants to not speak during the assessments to minimize respiration effects. Moreover, showing the tongue may not be socially accepted in some cultures and may indirectly influence the emotional state of the person. In addition, it is possible that some of the tongue changes may also be due to stress behaviors such as an increase of caffeine or sugar intake, or smoking [5], which were partially controlled during the study and the hour preceding it. Further investigation is required to fully understand the potential sources of our findings.
6. Conclusions
Inspired by traditional medicine and supported by rigorous evidence-based methods, this work has found subtle but consistent tongue color changes associated with short-term and long-term stress in the laboratory. These findings could contribute to the creation of future low-cost and noninvasive image-based stress monitoring systems.
To help explore whether these results would replicate across populations and in real-life settings, we have
Figure 7. Difference of “a” component between the stress and calm
tasks. 18 out of 24 participants showed higher “a” after stress. Figure 8. Relationship between average green color and
Perceived Stress Scale (PSS) scores for each participant (numbers). Spearman’s correlation: r=0.722, p<0.001.

developed a mobile phone application that facilitates easy capture of tongue images. Mobile imaging brings new challenges such as color and camera calibration, which were not tackled in this paper. Our findings on the potential importance of color suggest that sources of illumination, which were carefully controlled in this paper, may also need to be controlled in future studies. Besides color, we also plan to analyze other features (e.g., shape, texture) as well as behavioral metrics (e.g., sleep quality, caffeine intake). By collecting data from hundreds of users over longer periods of time, we hope to better understand the potential links between stress and tongue appearance.
Acknowledgments
This work is based upon work supported by The SDSC Global Foundation, Inc.
References
[1] F. Y. Fung and Y. C. Linn, “Developing Traditional Chinese Medicine in the era of evidence-based medicine: Current evidences and challenges,” Evidence-based Complement. Altern. Med., p. 9, 2015.
[2] S. K. Pal and A. Pal, Pattern recognition: from classical to modern approaches. World Scientific, 2001.
[3] Z. Yan, K. Wang, and N. Li, “Computerized feature quantification of sublingual veins from color sublingual images,” Comput. Methods Programs Biomed., vol. 93, no. 2, pp. 192–205, Feb. 2009.
[4] Yang Cai, “A novel imaging system for tongue inspection,” in Instrumentation and Meas. Tech. 2002, vol. 1, pp. 159–63.
[5] S. C. Stanford and P. Salmon, Stress: from synapse to syndrome. San Diego, CA: Academic Press, 1993.
[6] M. Bakke et al., “Salivary cortisol level, salivary flow rate, and masticatory muscle activity in response to acute mental stress: A comparison between aged and young women,” Gerontology, vol. 50, no. 6, pp. 383–392, 2004.
[7] J. Hernandez, R. R. Morris, and R. W. Picard, “Call center stress recognition with person-specific models,” in Affective Computing and Intelligent Interaction, 2011, pp. 125–134.
[8] A. Sano et al., “Recognizing academic performance, sleep quality, stress level, and mental health using personality traits, wearable sensors and mobile phones,” in Wearable and Implantable Body Sensor Networks, 2015, pp. 1–6.
[9] C. J. Jung, Y. J. Jeon, J. Y. Kim, and K. H. Kim, “Review on the current trends in tongue diagnosis systems,” Integr. Med. Res., vol. 1, no. 1, pp. 13–20, 2012.
[10] B. Kirschbaum, Atlas of Chinese tongue diagnosis. Eastland Press, 2010.
[11] B. Pang, D. Zhang, and K. Wang, “Tongue image analysis for appendicitis diagnosis,” Inf. Sci. (Ny)., vol. 175, no. 3, pp. 160–176, 2005.
[12] A. Kim et al., “Tongue fat and its relationship to obstructive sleep apnea,” Sleep, vol. 37, no. 10, pp. 1639–48, 2014.
[13] C. J. Jung and K. H. Kim, “Color Distribution Features from Tongue Image for Diagnosing Health Condition Change,” Evidence-Based Compl.. Altern. Med., no. 38, pp. 37–38, 2014.
[14] M. Daneshpazhooh, H. Moslehi, M. Akhyani, and M. Etesami, “Tongue lesions in psoriasis: a controlled study,” BMC Dermatol., vol. 4, no. 1, p. 16, Dec. 2004.
[15] B. Picciani et al., “Geographic Tongue and Fissured Tongue in 348 Patients with Psoriasis: Correlation with Disease Severity,”
Sci. World J., pp. 1–7, 2015. [16] O. Zargari, “The prevalence and significance of fissured
tongue and geographical tongue in psoriatic patients,” Clin. Exp. Dermatol., vol. 31, no. 2, pp. 192–195, Mar. 2006.
[17] R. Kanawong et al., “Automated Tongue Feature Extraction for ZHENG Classification in Traditional Chinese Medicine.,” Evidence-based Complement. Altern. Med., p. 14, Jan. 2012.
[18] B. Zhang and H. Zhang, “Significant Geometry Features in Tongue Image Analysis,” Evidence-Based Complement. Altern. Med., vol. 4, p. 8, 2015.
[19] Z. Gao, L. Po, W. Jiang, X. Zhao, and H. Dong, “A Novel Computerized Method Based on Support Vector Machine for Tongue Diagnosis,” Signal-Image Technol. Internet-Based Syst., pp. 849–854, 2007.
[20] L. Lo, T.. Cheng, Y. Chen, S. Natsagdorj, J. Y. Chiang, “TCM tongue diagnosis index of early-stage breast cancer,” Complement. Ther. Med., vol. 23, no. 5, pp. 705–13, Oct. 2015.
[21] J. K. Anastasi, M. Chang, J. Quinn, and B. Capili, “Tongue Inspection in TCM: Observations in a Study Sample of Patients Living with HIV.,” Med. Acupunct., vol. 26, no. 1, pp. 15–22, Feb. 2014.
[22] R. S. Redman, R. J. Gorlin, F. D. Peagler, F. Vance, L. Meskin, “Psychological component in the etiology of geographic tongue,” Dent. Res., vol. 45, no. 5, pp. 1403–1408, 1966.
[23] H. Ebrahimi, S. Pourshahidi, A. A. Tadbir, and S. B. Shyan, “The Relationship between Geographic Tongue and Stress,” Iran. Red Crescent Med., vol. 12, no. 3, pp. 313–315, 2010.
[24] D. Assimakopoulos, G. Patrikakos, C. Fotika, and M. Elisaf, “Benign migratory glossitis or geographic tongue: an enigmatic oral lesion,” Am. J. Med., vol. 113, no. 9, pp. 751–755, 2002.
[25] X. Wang and D. Zhang, “An Optimized Tongue Image Color Correction Scheme,” Inf. Technol. Biomed., vol. 14, no. 6, pp. 1355–1364, Nov. 2010.
[26] C. Rother et al., “‘GrabCut’: Interactive Foreground Extraction using Iterated Graph Cuts,” in ACM SIGGRAPH 2004, 2004, vol. 23, no. 3, p. 309.
[27] N. A. Ibraheem, M. M. Hasan, R. Z. Khan, and P. K. Mishra, “Understanding Color Models: A Review,” ARPN J. Sci. Technol., vol. 2, no. 3, pp. 265–275, 2012.
[28] S. Cohen, T. Kamarck, and R. Mermelstein, “A global measure of perceived stress.,” Heal. Soc. Behav., vol. 24, no. 4, pp. 385–396, 1983.
[29] C. Reas and B. Fry, Processing: a programming handbook for visual designers and artists, 2nd Ed. MIT Press, 2007.
[30] P. C. Hsu et al., “The association between arterial stiffness and tongue manifestations of blood stasis in patients with type 2 diabetes,” BMC Complement. Altern. Med., vol. 16, no. 1, p. 324, Dec. 2016.
[31] R. G. Maunder and S. Levenstein, “The role of stress in the development and clinical course of inflammatory bowel disease: epidemiological evidence.,” Curr. Mol. Med., vol. 8, no. 4, pp. 247–52, Jun. 2008.
[32] E. A. Mayer, “The neurobiology of stress and gastrointestinal disease.,” Gut, vol. 47, no. 6, pp. 861–869, Dec. 2000.
[33] Z. Sun et al., “Metabolic markers and microecological characteristics of tongue coating in patients with chronic gastritis,” BMC Compl. Altern. Med., vol. 13, p. 227, Sep. 2013.
[34] J. Kim et al., “Availability of tongue diagnosis system for assessing tongue coating thickness in patients with functional dyspepsia,” Evidence-based Comple. Altern. Med., p. 6, 2013.
[35] M. F. Al Haris, I. K. E. Purnama, M. Purnomo, “Tongue Image Analysis for Diabetes Mellitus Diagnosis based on SOM Kohonen,” Industrial Electronics Seminar, 2011, pp. 374–80.