strategic roadmap driven by best people, strong …/media/Files/R/Randstad-IR/documents... · •...
30
1
Transcript of strategic roadmap driven by best people, strong …/media/Files/R/Randstad-IR/documents... · •...

1
November 20, 2014 Capital Markets Day 2014 2
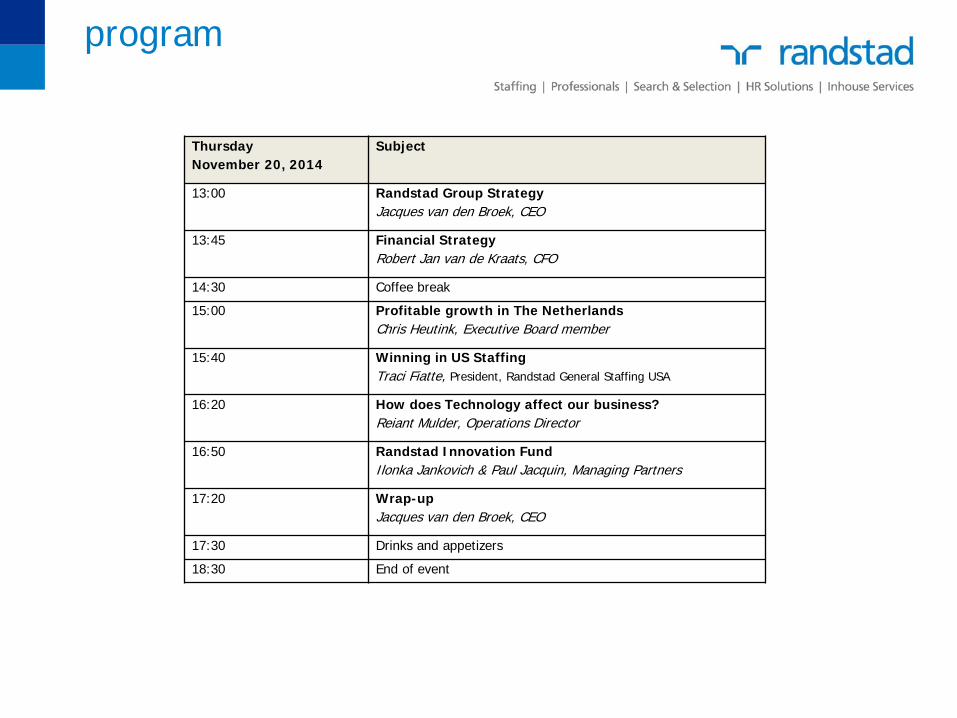
program
Thursday November 20, 2014
Subject
13:00 Randstad Group Strategy Jacques van den Broek, CEO
13:45 Financial Strategy Robert Jan van de Kraats, CFO
14:30 Coffee break
15:00 Profitable growth in The Netherlands Chris Heutink, Executive Board member
15:40 Winning in US Staffing Traci Fiatte, President, Randstad General Staffing USA
16:20 How does Technology affect our business? Reiant Mulder, Operations Director
16:50 Randstad Innovation Fund Ilonka Jankovich & Paul Jacquin, Managing Partners
17:20 Wrap-up Jacques van den Broek, CEO
17:30 Drinks and appetizers
18:30 End of event
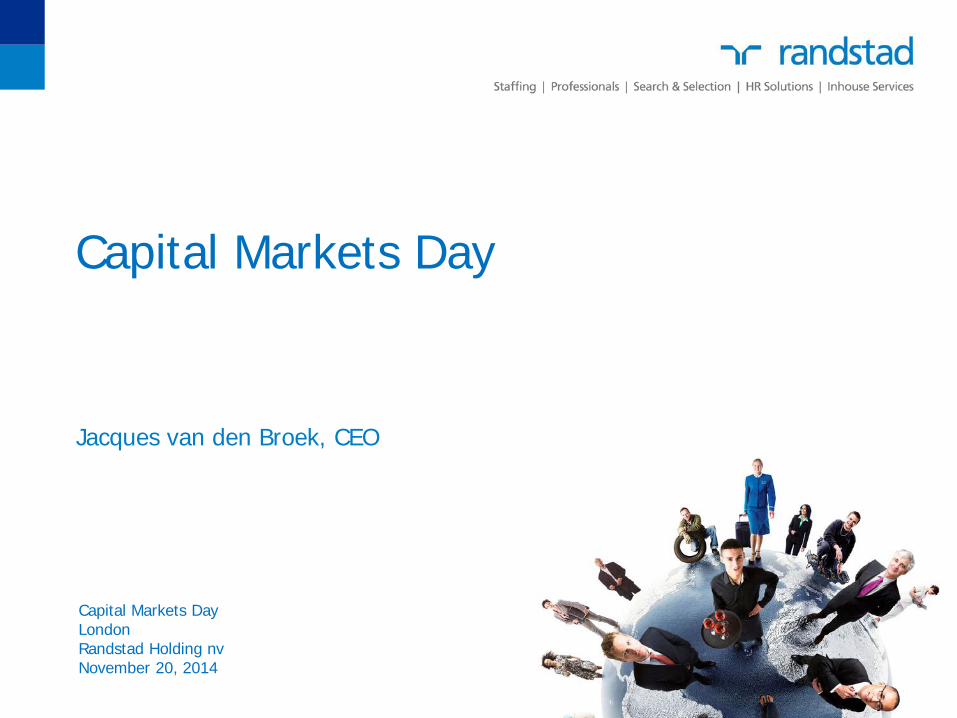
Capital Markets Day
Capital Markets Day London Randstad Holding nv November 20, 2014
Jacques van den Broek, CEO

Capital Markets Day 2014 November 20, 2014
disclaimer & definitions
4
Certain statements in this document concern prognoses about the future financial condition, risks, investment plans, productivity and the results of operations of Randstad Holding and its operating companies as well as certain trends, plans and objectives. Obviously, such prognoses involve risks and a degree of uncertainty since they concern future events and depend on circumstances that will apply then. Many factors may contribute to the actual results and developments differing from the prognoses made in this document. These factors include, but are not limited to, general economic conditions, a shortage on the job market, changes in the demand for (flexible) personnel, achievement of cost savings, changes in the business mix, changes in legislation (particularly in relation to employment, staffing and tax laws), the role of industry regulators, future currency and interest fluctuations, our ability to identify relevant risks and mitigate their impact, the availability of credit on financially acceptable terms, the successful completion of company acquisitions and their subsequent integration, successful disposals of companies and the rate of technological developments. These prognoses therefore apply only on the date on which this document was compiled.
--------------------------------------------------------------------------------------------------------------
EBITA: operating profit before amortization and impairment acquisition-related intangible assets and goodwill, badwill, integration costs and one-offs.
organic growth is measured excluding the impact of currency effects, acquisitions, disposals and reclassifications.
diluted EPS is measured before amortization and impairment acquisition-related intangible assets and goodwill, badwill, integration costs and one-offs.
November 20, 2014

Capital Markets Day 2014 5
agenda
evolution our strategy Total Talent Architecture (TTA) business segments Activity-Based Field Steering (ABFS) conclusion

Capital Markets Day 2014 November 20, 2014
Randstad: 10 year evolution diversified portfolio and track record of improving profitability
Staffing & HRS, exc. Perm
Inhouse
Professionals
Perm Staffing
Staf + HRS IH Profs Staf + HRS IH Profs
2003 2013
GP of € 1.1 Bln
GP of € 3.0 Bln
EBITA of 2.3% EBITA of 3.5%, higher by 50%
6

Capital Markets Day 2014 November 20, 2014
we review trends constantly and manage on actuals, driving sustainable business improvements
freelancer solutions
our services offering has evolved accordingly
7

Capital Markets Day 2014 November 20, 2014
structural changes the world is undergoing fundamental structural shifts
8
(de)regulation • combat union/government strategy to limit flexibility
by introduction limitations and conditions
globalization/demographics • increasing skills mismatches and migration flows • clients looking for fewer suppliers within and across
countries • industry shortages & surpluses differ per sector and
profile type
flexibility • more labor market flexibility is needed to enhance
competitiveness and adapt to change: invest in work security

Capital Markets Day 2014 November 20, 2014
our strategy Randstad core values: to know, serve and trust, striving for perfection and the simultaneous promotion of all interests
9

Capital Markets Day 2014 November 20, 2014
strategic roadmap driven by best people, strong concepts, excellent execution and superior brands
10
shape the world of work • optimal workforces for
clients • the best jobs for
candidates
grow to 5-6% EBITA • profitable growth • improve margin • increase productivity
HR technology • being the most agile integrator of
technology & services in our industry
Randstad innovation fund • capturing trends & future
business in HR technology
M&A, seamless fit integrations • strategic fit • value creation • manageability
Total Talent Architecture, World Class Customer Experience • creating quantifiable business impact addressing the entire
workforce of our clients
Activity-based Field Steering • driving commercial excellence;
brand strength, leads and conversion
World League People, at the right place, at the right time • optimized organization structure • high performance culture & people engagement • continuous process improvement
Org
TTA
Tech
ABFS
M&A
today
goals

Capital Markets Day 2014 11
Total Talent Architecture (TTA)
Capital Markets Day

Capital Markets Day 2014 November 20, 2014
TTA: creating quantifiable business impact across the entire workforce
12
“We know you, we know your company, we know your sector and we can help you become a better company with a better output of your people with more efficient HR processes. We’ve compared you against the benchmarks. We can show you where we did it, would it be interesting to talk further with us on this?”

TTA is the way to execute our ambition
define issues
identify stakeholders
assemble facts & figures
translate into
compelling messages
turn into bold
statements
create action plan
problem solution proof
13 November 20, 2014 Capital Markets Day 2014

Capital Markets Day 2014 November 20, 2014
roadmap to business impact
14
ad-hoc
preferred suppliers
total cost of ownership
engagement models
total talent architecture • strategic planning • includes all workforces • holistic approach • global & local optimization • applied innovations • aims for industry leadership
• MSP • RPO • SSC • process
improvement • aims to add value
• transparency • longer term view • process efficiencies • aims to lower total costs • consolidated
• compliance • aims to control and save costs • diversified
• single categories • aims to meet local needs
degree of business impact
degree of agility and sustainability
bottom line impact top line and bottom line impact

Capital Markets Day 2014 November 20, 2014
TTA: connecting our business
15
Staffing In house
MSP & RPO
Profs non- tech
Profs tech
Total Talent Architecture
Opco MD
EB
Marketing, HR, BCD - concept specific
Support SSC (Finance, IT, Legal, Facilities etc.)

Capital Markets Day 2014 November 20, 2014 Capital Markets Day 2014 16
business segments
Capital Markets Day
Capital Markets Day 2014 November 20, 2014
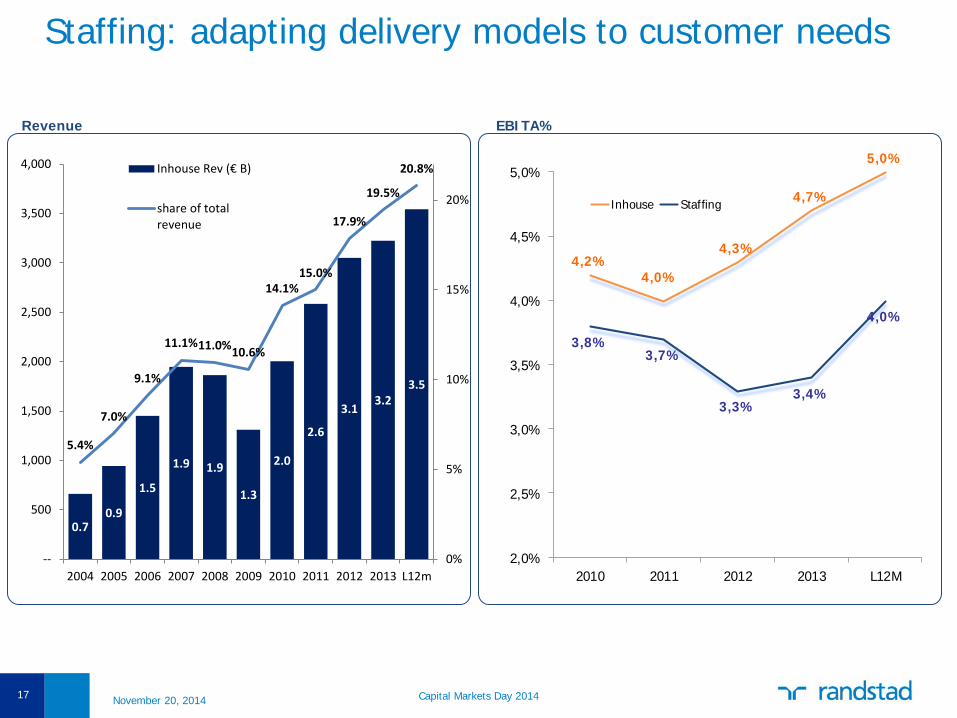
Staffing: adapting delivery models to customer needs
17
Revenue
4,2%4,0%
4,3%
4,7%
5,0%
3,8%3,7%
3,3%3,4%
4,0%
2,0%
2,5%
3,0%
3,5%
4,0%
4,5%
5,0%
2010 2011 2012 2013 L12M
Inhouse Staffing
EBITA%
0.7 0.9
1.5
1.9 1.9
1.3
2.0
2.6
3.1 3.2
3.5
5.4%
7.0%
9.1%
11.1% 11.0% 10.6%
14.1% 15.0%
17.9%
19.5%
20.8%
--
500
1,000
1,500
2,000
2,500
3,000
3,500
4,000
2004 2005 2006 2007 2008 2009 2010 2011 2012 2013 L12m0%
5%
10%
15%
20%
Inhouse Rev (€ B)
share of totalrevenue
Capital Markets Day 2014 November 20, 2014
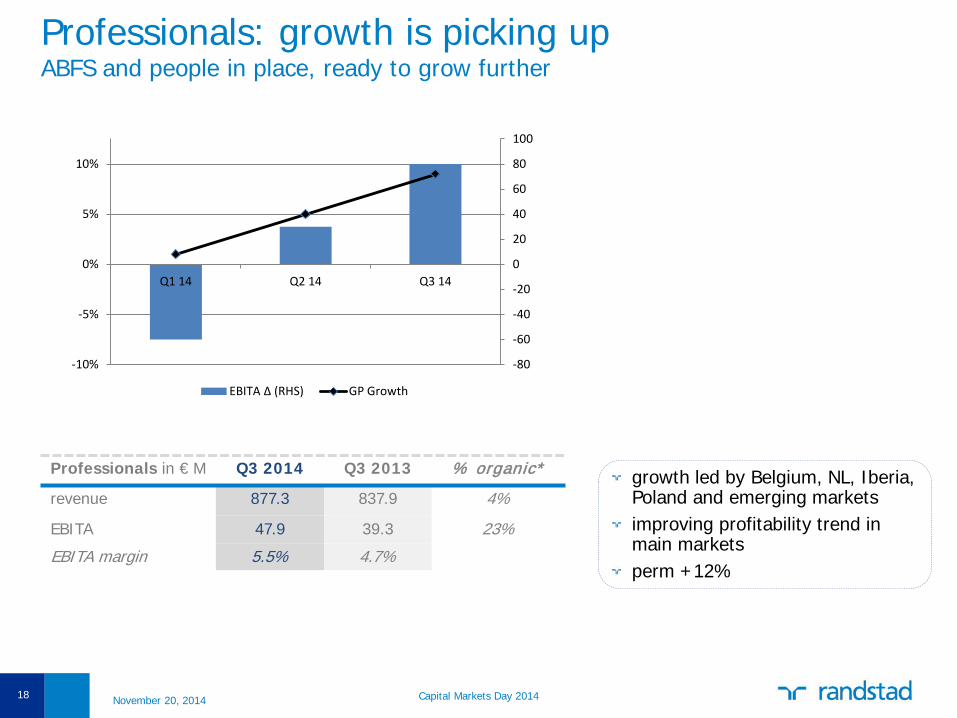
Professionals: growth is picking up ABFS and people in place, ready to grow further
18
-80
-60
-40
-20
0
20
40
60
80
100
-10%
-5%
0%
5%
10%
Q1 14 Q2 14 Q3 14
EBITA Δ (RHS) GP Growth
Professionals in € M Q3 2014 Q3 2013 % organic*
revenue 877.3 837.9 4%
EBITA 47.9 39.3 23%
EBITA margin 5.5% 4.7%
growth led by Belgium, NL, Iberia, Poland and emerging markets improving profitability trend in main markets perm +12%

Capital Markets Day 2014 November 20, 2014
Professionals remains a big opportunity market will continue to grow structurally faster than staffing
19
2013 (€ bln) Total Staffing professionals
Market 310 215 95
Randstad 16.8 13.5 3.3
Market share 5.4% 6.3% 3.5%
Total global market
Global Clients ~25% of group sales
Staffing Professionals
Capital Markets Day 2014 November 20, 2014
Professionals: what is the way forward? getting our act together, structurally driving forward from here
Anglo Saxon markets: further expanding vertical strategy (IT, Finance, Engineering etc.)
management changes in US profs, UK and Australia happened
North Europe: vertical approach is being implemented
e.g., the Dutch professionals operation
Emerging/Embryonic markets: focus on growth/market share
China is the example where high growth (>50% in Q3) goes hand in hand with a good productivity. India should follow
20

Capital Markets Day 2014 November 20, 2014
Perm: fast growing, but a long way to go
Chin
a
UK
AUS
Gro
up
US
Staf
fing
0%10%20%30%40%50%60%70%80%90%
100%Perm as a % of GP
primarily established temp markets
embryonic/developing markets
21
Perm now makes up 10% of group GP (was ~12% in 2007)
Perm grew 15% in Q3 and continues to accelerate in Q4 in established markets we have the potential to double (predominantly across North Europe)

Capital Markets Day 2014 November 20, 2014
Sourceright strengthening in Europe with expertise in recruitment process outsourcing RPO, managed services programs MSP, blended workforce solutions, and payrolling & independent contractor solutions
22
more than a third of RPO deals signed in Europe are multi-country solutions (frequency increasing) – physical presence in 22 European countries (delivery capabilites in every country)
the RPO & MSP market will grow around 20% year on year (aim for above market growth by incorporating TTA)
Staffing
Sourceright
Professionals

Capital Markets Day 2014 November 20, 2014
MSP: spend under management up 35% EMEA is next after rapid adaptation in Anglo Saxon markets
23
201
2
201
3
201
4
L4Q
201
2
201
3
201
4
L4Q
201
2
201
3
201
4
L4Q
North America UK EMEA

Capital Markets Day 2014 November 20, 2014 Capital Markets Day 2014 24
Activity-Based Field Steering (ABFS)
Capital Markets Day

Capital Markets Day 2014 November 20, 2014
ABFS for all services
25
Organizational Readiness ABFS alignment for all actual and future services
services

Capital Markets Day 2014 November 20, 2014
Headcount Productivity (distribution vs average)
Operational effectiveness (ratios)
Consultant Capacity (# of activities)
Activity-based field steering in place
Onboarding program
Role of Management Order Pipeline
(Customers, Orders, Candidates)
Revenue/GP Growth
Profitability (conversion ratio)
existing producer population
(individual producers per branch)
business performance
(vertical and branch level)
organizational readiness
(per vertical per country)
1 Is the organization ready to grow? 2 Is the business performance positive? 3 Do consultants follow the growth path?
ABFS is part of our growth readiness framework invest, manage, divest
26
Capital Markets Day 2014 November 20, 2014
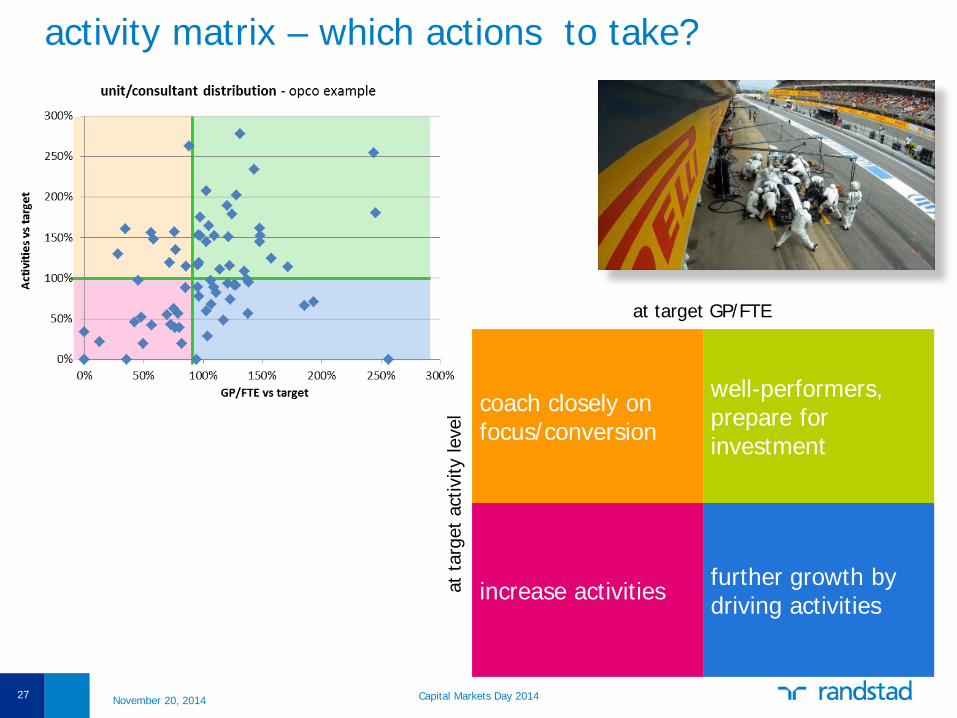
activity matrix – which actions to take?
coach closely on focus/conversion
well-performers, prepare for investment
further growth by driving activities increase activities at
tar
get
activ
ity le
vel
at target GP/FTE
27
Capital Markets Day 2014 November 20, 2014
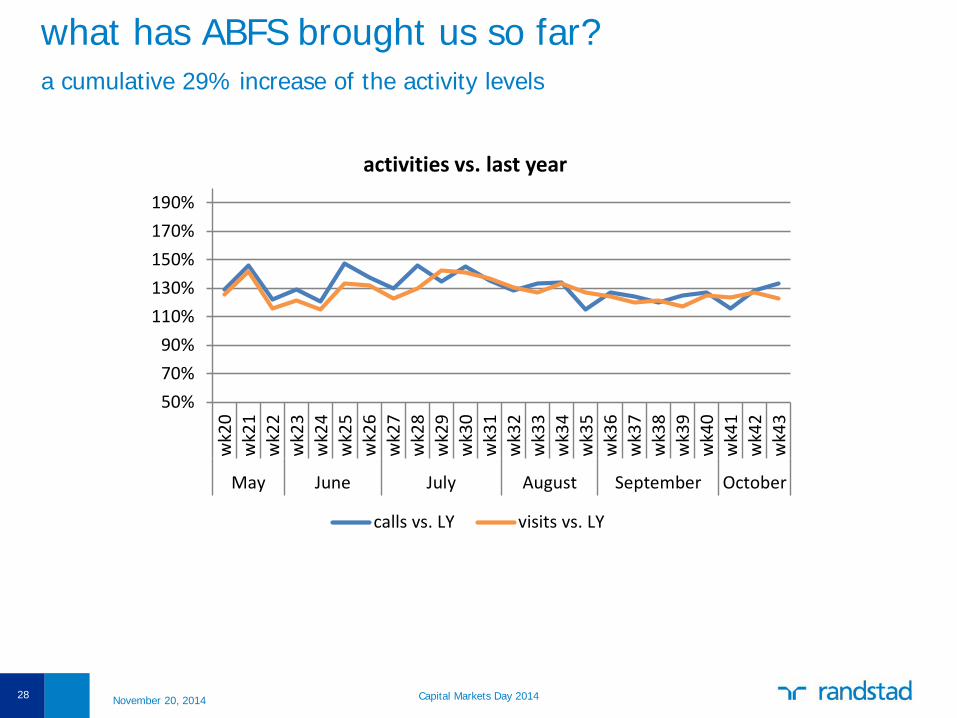
what has ABFS brought us so far?
28
a cumulative 29% increase of the activity levels
50%70%90%
110%130%150%170%190%
wk2
0w
k21
wk2
2w
k23
wk2
4w
k25
wk2
6w
k27
wk2
8w
k29
wk3
0w
k31
wk3
2w
k33
wk3
4w
k35
wk3
6w
k37
wk3
8w
k39
wk4
0w
k41
wk4
2w
k43
May June July August September October
activities vs. last year
calls vs. LY visits vs. LY

Capital Markets Day 2014 November 20, 2014
what has ABFS brought us so far (II)?
29
an improved productivity of our field staff
-8%-6%-4%-2%0%2%4%6%8%
Q1 Q2 Q3 Q4 Q1 Q2 Q3 Q4 Q1 Q2 Q3
2012 2013 2014
yoy
grow
th %
productivity trends(yoy growth for GP and PE field)
growth GP (normalized for wd) growth PE field

Capital Markets Day 2014 November 20, 2014
conclusion: where do we see structural growth opportunities and room for improvement?
30