STRATEGIC PLANNING TOOLKIT - British Columbia · WHAT DOES THE TOOLKIT PROVIDE? 12 . Empowerment of...
44
STRATEGIC PLANNING TOOLKIT FOR LOCAL ECONOMIC DEVELOPMENT
Transcript of STRATEGIC PLANNING TOOLKIT - British Columbia · WHAT DOES THE TOOLKIT PROVIDE? 12 . Empowerment of...
STRATEGIC PLANNING TOOLKIT
FOR LOCAL ECONOMIC DEVELOPMENT

AGENDA
2
6
Experience with strategic economic development planning (Rose)
Introduction
Why Strategic Planning?
Strategic Planning Toolkit
Why Performance Measurement?
1
2
3
4
5 Performance Measurement Toolkit
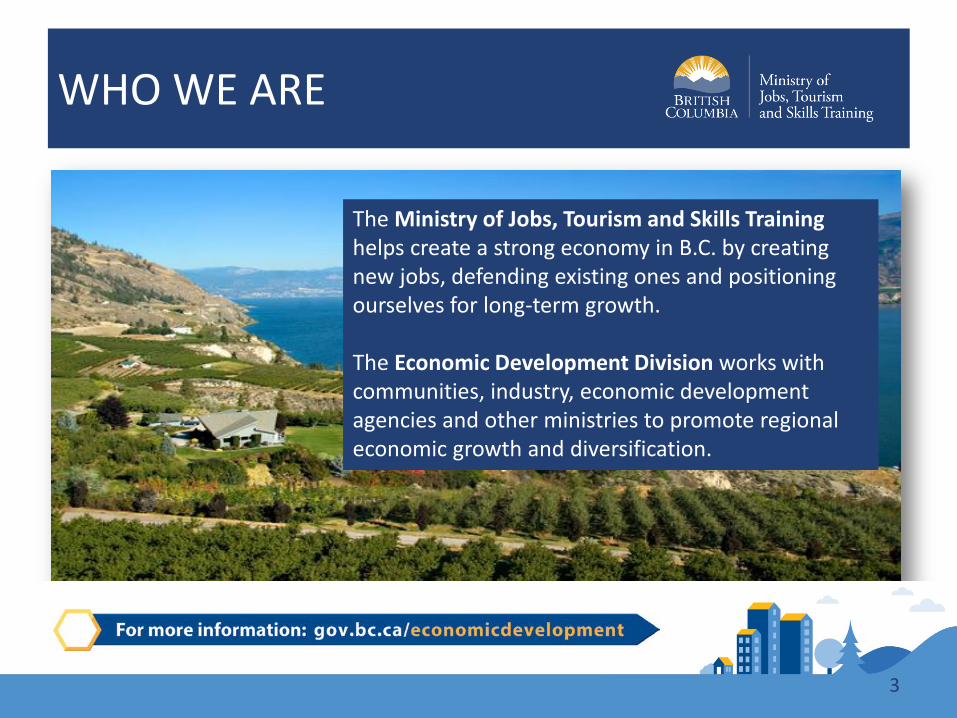
WHO WE ARE
3
The Ministry of Jobs, Tourism and Skills Training helps create a strong economy in B.C. by creating new jobs, defending existing ones and positioning ourselves for long-term growth. The Economic Development Division works with communities, industry, economic development agencies and other ministries to promote regional economic growth and diversification.

Fort St. John
Vanderhoof Terrace
Quesnel
Prince Rupert
Penticton
Kamloops Invermere
Vernon Campbell River
Nanaimo Surrey
Victoria
Legend Headquarters Regional Office

WHAT IS STRATEGIC PLANNING?
5
A process in which a community looks at its current situation and compares that situation to where it would like to be within a certain period of time. - International Economic Development Council

WHY UNDERTAKE STRATEGIC PLANNING?
6
• Allows communities to be responsive to funding opportunities
• Coordinates efforts and creates connections and partnerships
• Markets your community and attracts investment
• Gets past the talking • Helps keep track of what
you are doing and if it is making a difference
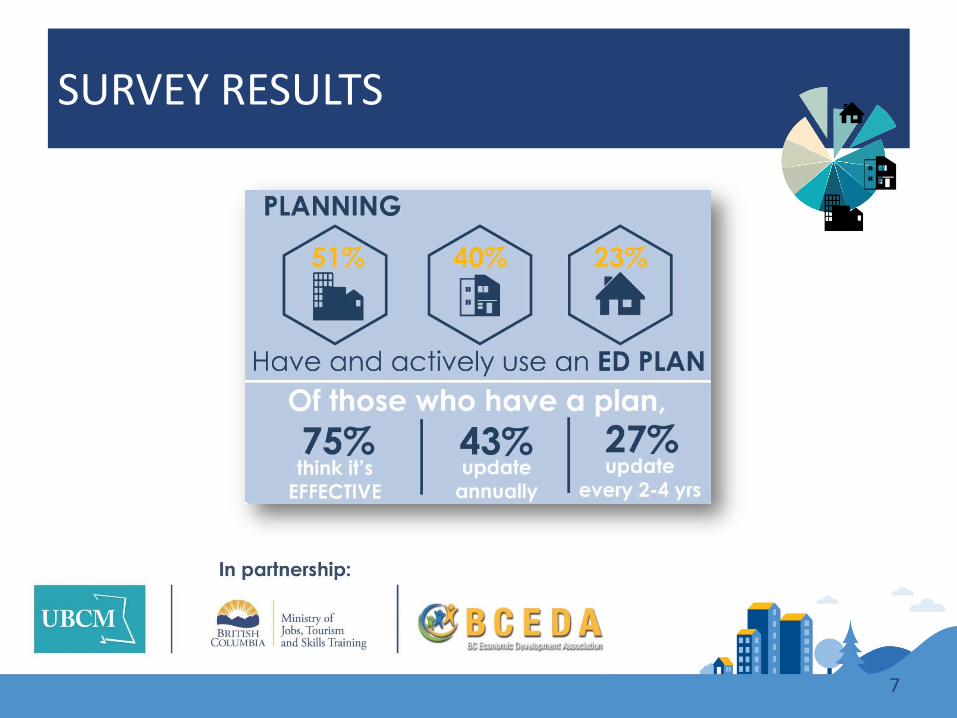
SURVEY RESULTS
7

COMMON BARRIERS
8
Common barriers
to success
• Perception that plans just sit on the self and gather dust
• Might raise unrealistic expectations • Costs too much to implement • Been there done that • Not role of local government to work on
economic development • No interest in growth or change

DOES THIS DESCRIBE YOUR COMMUNITY?
9
Plan with no action Action with no plan

INTRODUCING!
10
Development of toolkit with regular consultation with an advisory group of EDOs around the province
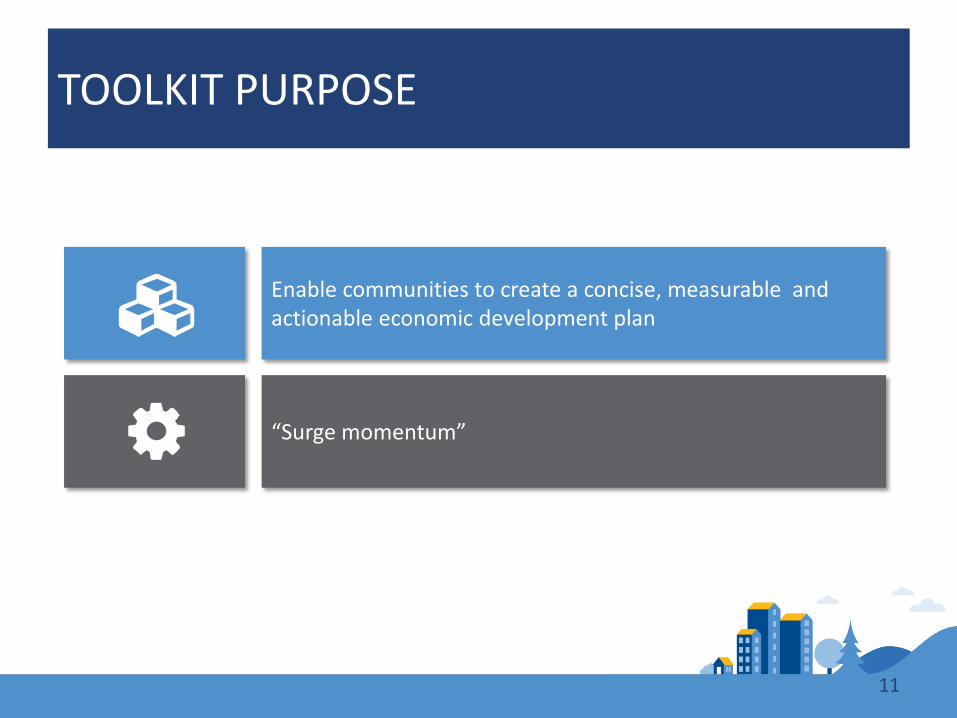
TOOLKIT PURPOSE
11
Enable communities to create a concise, measurable and actionable economic development plan
“Surge momentum”

WHAT DOES THE TOOLKIT PROVIDE?
12
Empowerment of local leaders
Achievable process regardless of your stage in economic development
Break-down of strategic planning process into manageable pieces
Self-guided and customizable step-by-step approach
Initial self-assessment tailors process to your community’s needs
Delivers a manageable 8 to 12 page plan
Web-based and downloadable

THREE APPROACHES TO THE TOOLKIT
13
Community leads own process with existing staff (e.g. EDO or CAO)
REO Regional Managers assists in facilitating the planning process
Community hires a consultant to facilitate the process (potentially by accessing Rural Dividend Funds - $10K)

TOOLKIT STRUCTURE
14

LIVE DEMO
15
>>> Launch the Strategic Planning Toolkit

QUESTIONS? THANK YOU!
16

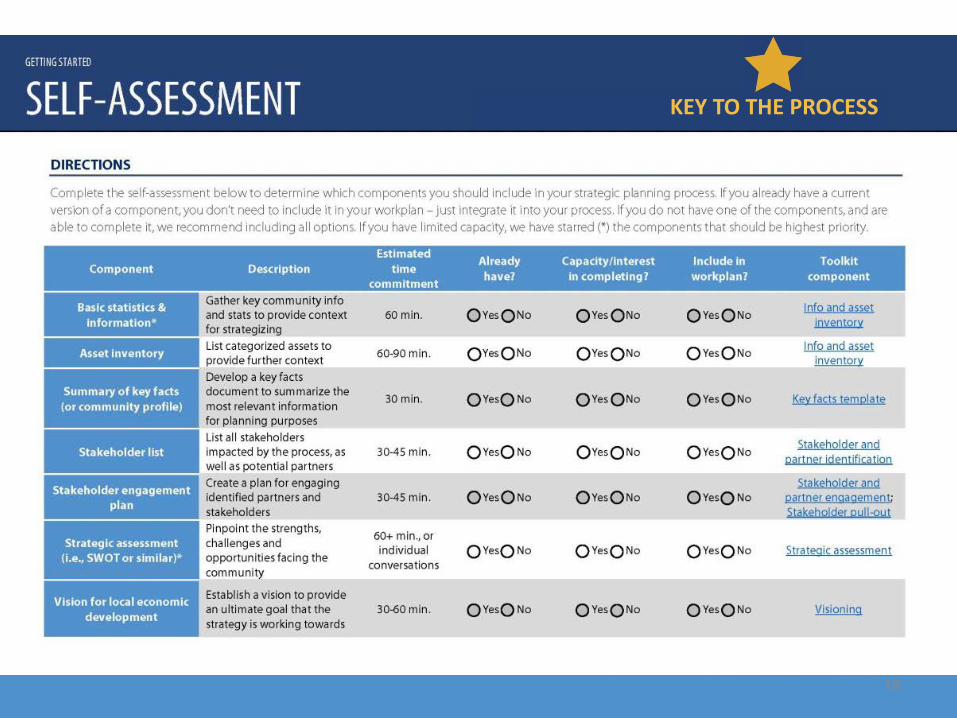
GETTING STARTED
SELF-ASSESSMENT
17
Provides an overview of the various tools and templates available
Allows you to determine which components of the toolkit are right for your situation
KEY TO THE PROCESS
>>> Launch the Self-Assessment Tool
18
KEY TO THE PROCESS

19
KEY TO THE PROCESS

1 2 3 4 5
PERFORMANCE MEASUREMENT TOOLKIT
FOR LOCAL ECONOMIC DEVELOPMENT

1 2 3 4 5
WHAT IS PERFORMANCE MEASUREMENT?
2
A systematic approach used to assess the efficiency and effectiveness of projects, programs and initiatives, and to monitor how ‘on track’ you are in achieving your desired goals and objectives.

1 2 3 4 5
WHY UNDERTAKE PERFORMANCE MEASUREMENT?
3
• Ensures time being spent on high-value activities • Builds momentum and buy-in from your
stakeholders • Assesses effectiveness of your program or project • Supports informed and evidence-based decision-
making • Demonstrates your success and progress • Keeps you on target and accountable to your
stakeholders

1 2 3 4 5
• No Time or resources • Can’t measure • Reluctant to measure • No Incentive
BARRIERS TO SUCCESS
4
Common barriers to
success

1 2 3 4 5
HOW TO BREAK THROUGH BARRIERS?
5
Make performance measurement part of your organizational culture
Recruit and engage senior leaders
Communicate the purpose of performance measurement
Performance measurement is continuous process requiring flexibility & adaptability
Encourage stakeholder participation to ensure that everyone is on the same page

1 2 3 4 5
TOOLKIT BENEFITS
6
Familiarize you with key concepts
Allows you to choose tailored approach specific to your needs
Walks you step-by-step through process including collecting and reporting on the most relevant indicators
Facilitates process as “learning by doing” approach with templates, mini-guides, and B.C. examples
Scalable to size of initiative, resources and capacity
Links desired outcomes with activities and outputs

1 2 3 4 5
TOOLKIT COMPONENTS
7
Toolkit User Guide
Excel Workbook consisting of a series of exercises
Library of 200+ indicators across several economic development topics
Templates for implementation plan, annual reports and dashboards
Image library containing infographic style images available for download

1 2 3 4 5
TOOLKIT STRUCTURE
8
ABOUT YOU - INVENTORY
VISUALIZING YOUR PATH
CHOOSING INDICATORS
COMMUNICATING RESULTS
>>> Launch the Performance Measurement Toolkit
LINEAR PROCESS CONSISTING OF FIVE STEPS
STEP 2: VISUALIZING YOUR PATH
STEP 1: ABOUT YOU INVENTORY
STEP 3: CHOOSING
INDICATORS
STEP 4: IMPLEMENTATION
PLAN
STEP 5: COMMUNICATING
RESULTS
1 2 3 4 5 9 1
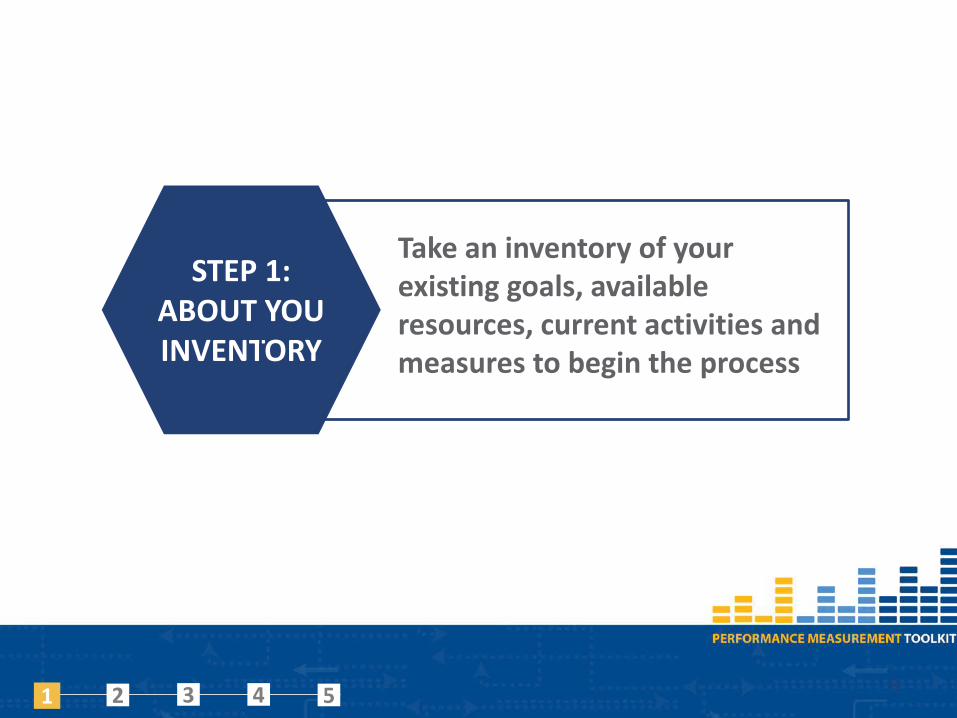
STEP 1: ABOUT YOU INVENTORY
Take an inventory of your existing goals, available resources, current activities and measures to begin the process

1 2 3 4 5
ABOUT YOU - INVENTORY
INVENTORY WORKBOOK
10 1
>>> Launch the Inventory Workbook

1 2 3 4 5 11
Visualize the entirety of your program or project from where you are now to where you want to go
2
STEP 2: VISUALIZING YOUR PATH

1 2 3 4 5
VISUALIZING YOUR PATH
LOGIC MODEL
12
A graphic illustration that shows the connections between what you invest, what you do and what you achieve.
2

1 2 3 4 5
VISUALIZING YOUR PATH
OUTPUTS VS. OUTSOMES
13
Outcomes: • Represent the WHY • SMART (Specific, Measurable,
Achievable, Relevant & Timely) • Act as the finish line (the ultimate
outcome)
Outputs: • Represent the WHAT activities will
yield • Set the stage for your outcomes
2

1 2 3 4 5
VISUALIZING YOUR PATH
LOGIC MODEL WORKBOOK
14 2
>>> Launch the Logic Model Workbook
1 2 3 4 5 15 3
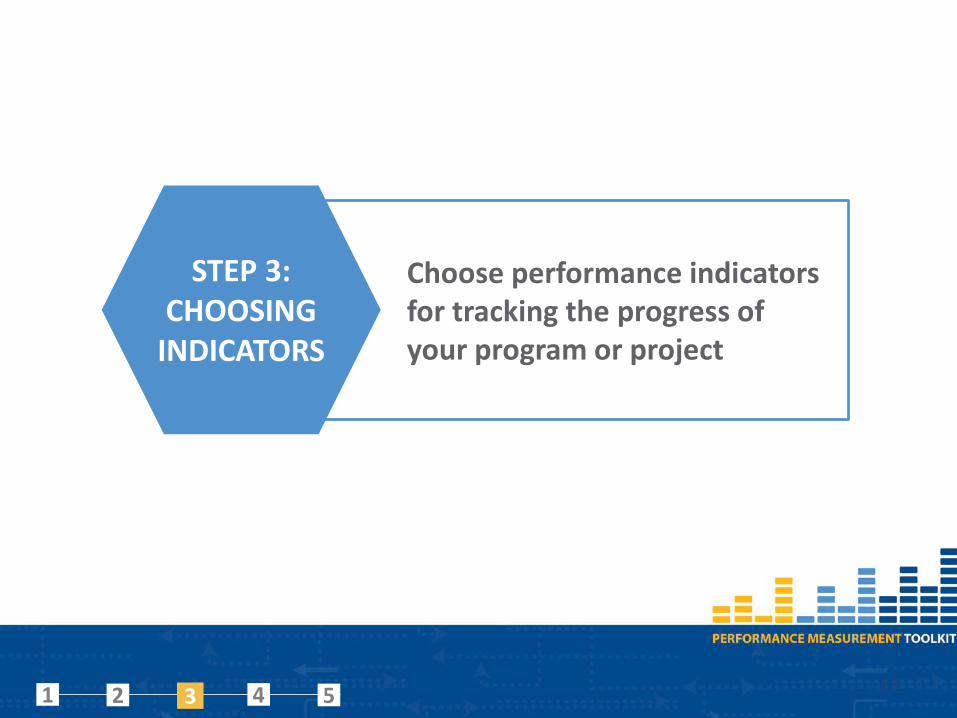
STEP 3: CHOOSING
INDICATORS
Choose performance indicators for tracking the progress of your program or project

1 2 3 4 5
CHOOSING INDICATORS
PERFORMANCE INDICATORS
16
Are used to track outputs and outcomes of your activities, and assess what kinds of changes have occurred
Can take the form of numbers, facts, opinions, or perceptions that help measure progress towards change
Output indicators measure the direct result of an activity and indicate the frequency or intensity
3
Outcome indicators measure the effectiveness or impact of your performance measurement strategy
1 2 3 4 5
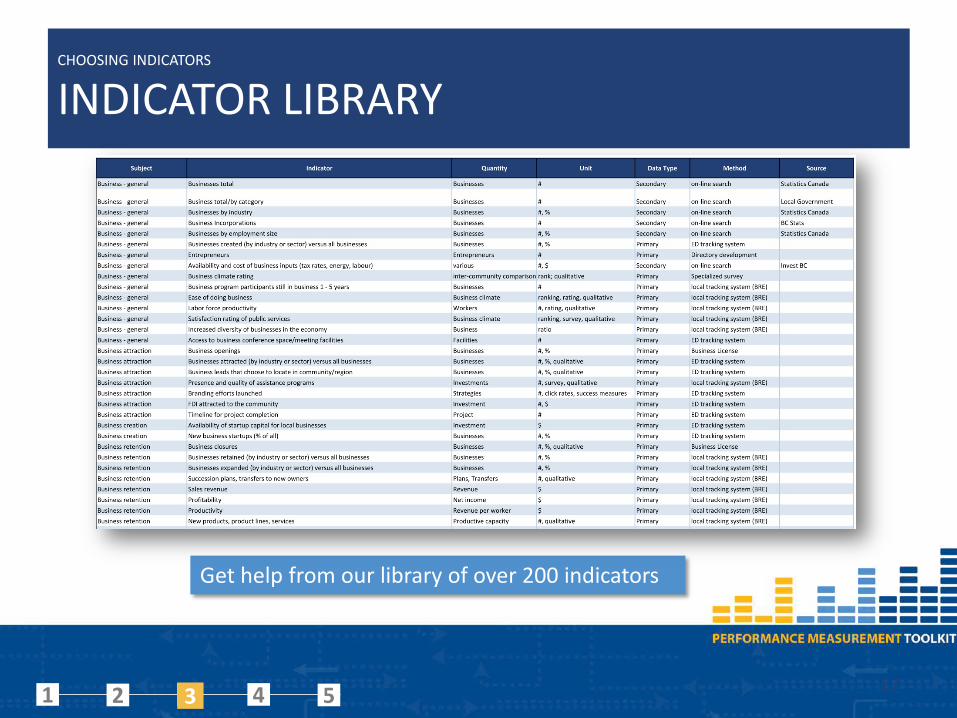
CHOOSING INDICATORS
INDICATOR LIBRARY
17 3
Get help from our library of over 200 indicators

1 2 3 4 5 18
Establish a plan to track your performance that is practical, achievable and directly relates to your activities
4
STEP 4: IMPLEMENTATION
PLAN

1 2 3 4 5
IMPLEMENTATION PLAN
COMPONENTS
19 4

1 2 3 4 5
IMPLEMENTATION PLAN
TEMPLATE
20 4
>>> Launch the Implementation Plan Workbook

1 2 3 4 5 21
Communicate the progress and success of your program or project to your stakeholders
STEP 5: COMMUNICATING
RESULTS
5

1 2 3 4 5
COMMUNICATING RESULTS
WHAT IS A DASHBOARD?
22 5
Simple visual presentation of your performance measurement indicators
Clearly state the purpose relevant to
the intended audience
Use a well designed, easy-to-read layout
Choose a few main indicators to focus on
and make them central to your choice
of report

1 2 3 4 5
TEMPLATES AND EXAMPLES
23 5

1 2 3 4 5
QUESTIONS? THANK YOU!
24

1 2 3 4 5
TEMPLATES AND EXAMPLES
25
Source: Edmonton's Citizen Dashboard https://dashboard.edmonton.ca/
5