Strategic Planning for Airlines Emre Serpen 15May13
35
Strategic Planning for Airlines Dr Emre Serpen, Intervistas Consulting Group EVP
Transcript of Strategic Planning for Airlines Emre Serpen 15May13

Strategic Planning for Airlines
Dr Emre Serpen,
Intervistas Consulting Group
EVP
Realizing the vision together
Intervistas team members have extensive airline strategy
and network design assignments worldwide

Realizing the vision together
Examples of Strategy and Network Design Projects
Company-wide strategy
and turnaround
Development of
network, Cairo hub, and
schedules
Improvements in sales,
marketing, organization,
IT
Fleet & Business Plan
EgyptAir
Lead Consultant:
Dr. Emre Serpen
Lead Consultant:
Dr. Emre Serpen
Lead Consultant:
Dr. Emre Serpen
Lead Consultant:
Dr. Emre Serpen
Lead Consultant:
Dr. Emre Serpen
Turkish Airlines Temasek (SQ) South African Airways
Market evaluation,
capacity assessment,
SWOT analysis
2016 and 2012 network
design, hub design, and
schedule
Business plan
associated with the
strategy
SWOT analysis of
Singapore Airlines
Market forecasting
Identify growth
opportunities
Develop strategy for
medium and long haul
network and fleet
Marker assessment
Strategy for maximizing
share in Africa
Selection of hub
locations in west and
central Africa
Network design and fleet
plan
Business plan
Malaysian Airlines
Evaluated the feasibility
of a premium service in
conjunction with another
airline
Market Forecasting
Route Design
Commercial Workshops
Joint Venture/Codeshare
Benefits
Lead Consultant:
Dr. Emre Serpen
LOT Polish Airlines
Multiple network
optimisation projects
Alliance strategy
analysis and decision for
LOT to joined Star
Alliance
Develop Asian strategy
and network for LOT
Evaluate joint venture
with Indian partner
Dr. Emre
Serpen
Executive Vice
President, Head of
Airline Practice
• 20+ years, 70+
airlines in 50+
countries

Realizing the vision together
Lead Consultant:
Zach Mensen
Lead Consultant:
Dr. Emre Serpen
Czech Airlines ČSA
Examples of Strategy and Network Design Case Studies
Delta Air Lines
Hub optimisation of
Atlanta ATL and
Memphis MEM hubs
Improved network
contribution of Delta’s
domestic flying
Fleet optimisation
between mainline and
regional aircraft
Network design and
route optimisation for
ČSA
Short term
improvements for the
summer schedule by
connecting and
improving and flights
Continental Airlines
Air Canada
Lead Consultant:
Marcus Lam
Hub optimisation of
Toronto YYZ regional
USA network
Fleet optimisation using
Fleet Assigner modelling
software, to maximize
medium and short term
profitability
New route forecasts
Istanbul Airport
Lead Consultant:
Dr. Emre Serpen
Medium to Long Term
Passenger Forecast to
2040 for Istanbul’s new
Third Airport
Fleet Plan forecasts for
fast-growing Turkish
Airlines (TK)
Future IST hub route
design for TK and other
airlines
Lead Consultant:
Dr. Emre Serpen
Diagnostic assessment
Market evaluation and
forecasting
Network design,
Colombo hub design
Fleet plan
Commercial
improvements
Business plan
SriLankan Airlines
Lead Consultant:
Jim Miller
Optimisation of Frankfurt
and Munich hubs
Advised Lufthansa on
the ramifications of
deregulation of the
European market
Examined in detail the
history and competitive
implications of U.S.
deregulation
Lufthansa Airlines

Realizing the vision together
Intervistas uses Industry Trusted Sources And
Professional Network Optimisation Tools
. The modelling tool uses discrete choice methodology, an advanced form of the
QSI passenger market share forecasting method.

Realizing the vision together
Strategic Planning for Airlines - Overview
6 6
Strategic
Assessment
Network
Design and
Fleet
Planning
Business
Model
Alignment
Business
and
Implementa
tion
Planning
Strategic
Intent
1 2 3 4 5
Global
Continent/Region
Country
Specific
Segment
Long Term
Short Term
Hub Design
Fleet Planning
Demand
Supply
SWOT
Market
Forecasting
Commercial
Operational
Subsidiaries
Organisational
Business Plan
Implementation
Plan

Realizing the vision together
Step 1: Obtain Macro Economic, Air Traffic, Competition, Governance and Operational Cost data for each country.
Step 2: Assign Score; Best in Category country is assigned a 10.0 score; scores of other countries are assigned a score relative to the Best in Category country.
Step 3: Add up all scores per the weighting of each category to calculate a final score for each country.
Analytical Framework for Multi Country Strategy
7
Weight South Africa Egypt Nigeria Ghana Botswana Ethiopia Cote d'Ivoire Mauritius Seychelles Algeria
Macro Economic 25% 5.0 4.8 6.5 4.4 4.9 4.6 4.1 4.9 5.1 3.8
GDP per Capita 35% 6.7 2.8 1.5 1.7 8.4 0.5 1.0 8.8 10.0 4.6
GDP Growth Forecast Average 35% 4.9 7.0 8.5 9.6 5.4 8.2 9.5 5.2 4.7 4.7
Population 30% 2.9 4.8 10.0 1.5 0.1 5.3 1.4 0.1 0.0 2.0
Air Traffic 25% 6.0 5.9 3.3 1.7 1.0 2.9 1.4 1.0 1.8 4.3
Intra Africa Oubound Pax (2012) 50% 10.0 1.8 3.6 0.7 0.1 0.5 0.4 0.2 0.1 0.5
# of City Pairs (<140% Circuity) 50% 2.0 10.0 3.0 2.7 2.0 5.3 2.4 1.8 3.4 8.0
Competition 17% 1.7 3.2 5.1 7.1 4.5 6.0 9.0 3.3 4.3 4.6
Seat Share of Dominate Airline 33% 3.2 2.1 4.4 10.0 2.7 2.0 7.1 3.0 2.8 2.1
Population/Outbound Seat 33% 0.6 5.0 5.4 5.4 0.9 9.2 10.0 0.3 0.1 5.2
Quality of Competition (SkyTrax Rating) 17% 2.0 4.0 10.0 10.0 10.0 4.0 10.0 10.0 10.0 10.0
Presence of Competition 17% 0.7 1.0 0.9 2.0 10.0 10.0 10.0 3.3 10.0 3.3
Governence 17% 7.1 5.1 4.1 5.5 7.1 4.9 4.5 9.4 6.4 4.1
Stability 25% 7.1 5.4 4.2 5.6 9.1 4.8 5.5 10.0 6.7 4.7
Ease of Business 25% 4.9 1.7 1.5 3.0 3.2 1.5 1.1 10.0 2.6 1.3
Corruption 25% 6.6 4.9 4.2 6.9 10.0 5.1 4.5 8.8 8.0 5.2
Infrastructure 25% 10.0 8.2 6.6 6.7 6.2 8.4 7.0 8.7 8.2 5.4
Operational Cost 17% 5.2 5.2 5.5 6.2 7.0 5.2 5.2 5.2 5.2 5.2
Fuel 25% 8.4 8.4 6.0 9.0 9.0 8.4 8.4 8.4 8.4 8.4
Maintenance 15% 7.3 7.3 10.0 6.4 8.2 7.3 7.3 7.3 7.3 7.3
Landing costs 15% 3.3 3.3 2.2 5.6 6.7 3.3 3.3 3.3 3.3 3.3
Departure costs 15% 1.7 1.7 2.0 1.7 1.7 1.7 1.7 1.7 1.7 1.7
Navigation 15% 5.8 5.8 6.7 10.0 5.0 5.8 5.8 5.8 5.8 5.8
Catering and Handing 15% 2.8 2.8 6.0 3.0 10.0 2.8 2.8 2.8 2.8 2.8
C1 C2 C3 C4 C5 C6 C7 C8 C9 C10
Source Intervistas Analysis

Realizing the vision together
Multi country strategy – additional criteria
8
Strategic Intent
1. Participate in markets
2. Ensure choice of profitable airlines
3. Strategic view of the Continent and development of an airline system for future dominance of Continent Egg 1) Gov. 2) Air Asia, 3) LAN
4. Readiness to challenge established incumbent airlines thru superior product and execution
5. Leverage previous investments existing assets
6. Pre-selection of Countries
Source Intervistas/Burlington Analysis

Realizing the vision together
Continental or Multi Country Strategy -Qualification
9
0 250 500 750 1,000 1,250 4,000K
BeninMozambique
LesothoMauritius
MaliGabon
South SudanBotswana
SenegalBurkina Faso
NamibiaUganda
TanzaniaCote d'Ivoire
ZambiaDRC
Congo, RepublicGhana
CameroonEthiopia
LibyaZimbabwe
KenyaAlgeriaTunisiaSudan
MoroccoNigeriaAngola
EgyptSouth Africa
Example :Consumer Markets
Example: O/D Pax and Growth Rate Example: Flying Population
Source Intervistas Analysis

Realizing the vision together
Single country strategy, selection of hub structure
10

Realizing the vision together
Strategic Planning in Airlines - Overview
11 11
Strategic
Assessment
Network
Design and
Fleet
Planning
Business
Model
Alignment
Business
and
Implementa
tion
Planning
Strategic
Intent
1 2 3 4 5
Global
Continent/Region
Country
Specific
Segment
Long Term
Short Term
Hub Design
Fleet Planning
Demand &
Supply
SWOT
Market
Forecasting
Commercial
Operational
Subsidiaries
Organisational
Business Plan
Implementation
Plan

Realizing the vision together
Market Analysis
EXAMPLES MARKET ANALYSIS
• Year-on-year growth of Airline ’s key markets
• Identification of markets with fast and high yield
growth opportunities
• Analysis of Airline ’s capacity growth competitors in
key markets
• Evaluation of share gap and identification of
opportunities where market growth exceeds
marketshare growth
• Evaluation of region to region growth (Airline
market share growth, total market growth,
considering circuity and yield)
• Identification of Airline market share:
market share growth in growing markets
market share loss in growing markets
market share growth in shrinking markets
market share loss in shrinking markets
• Relationships between market, market share and
pricing changes
• 100 o/d thru the hub, relative changes of share of
different airlines – given the hub advantage of the
home airline
Source Intervistas Analysis
Source Intervistas Analysis

Realizing the vision together
Example Analysis of Market Sizes and Fares in Russia
Note: Average fares excludes taxes, surcharges and fees.
Source: Diio FMG, 2012
Source Intervistas Analysis
Realizing the vision together
SWOT, Connectivity Analysis
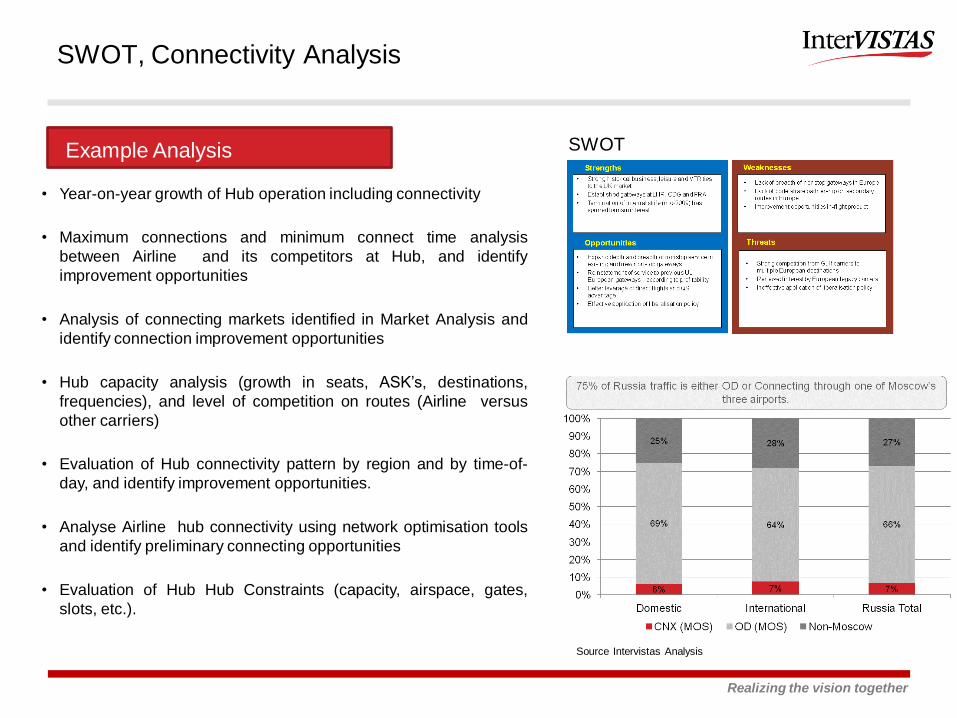
• Year-on-year growth of Hub operation including connectivity
• Maximum connections and minimum connect time analysis
between Airline and its competitors at Hub, and identify
improvement opportunities
• Analysis of connecting markets identified in Market Analysis and
identify connection improvement opportunities
• Hub capacity analysis (growth in seats, ASK’s, destinations,
frequencies), and level of competition on routes (Airline versus
other carriers)
• Evaluation of Hub connectivity pattern by region and by time-of-
day, and identify improvement opportunities.
• Analyse Airline hub connectivity using network optimisation tools
and identify preliminary connecting opportunities
• Evaluation of Hub Hub Constraints (capacity, airspace, gates,
slots, etc.).
Example Analysis SWOT
Source Intervistas Analysis

Realizing the vision together
Passenger, Capacity, Revenue Trends and Share
15 Source: Diio FMG
Source Intervistas Analysis

Realizing the vision together
Benchmark competing hubs
2 3 4 5 6 7 8 9
10 11 12
To
tal S
eat
Cap
acit
y (
Mil
lio
ns)
Quarter
Total Capacity at Major Hubs over time
CDG FRA MUC DXB
58.4%
43.4% 43.4% 44.0% 32.0%
36.4%
46.2% 46.1%
20.9%
22.0%
5.2% 10.3% 10.5%
34.1%
36.0%
1.1%
10.0%
TK - IST AF - CDG LH- FRA EK - DXB SQ - SIN
Nonstop Competition from Comparative Hubs
No Competition 1 Competitor 2-4 Competitors 3+ Competitors
0
20
40
60
80
100
120
140
160
0
5
10
15
20
25
30
35
40
45
2000 2001 2002 2003 2004 2005 2006 2007 2008 2009 2010
To
tal S
eat C
ap
acity
AF
*/LH
*
(Millio
ns)
To
tal S
eat
Cap
acit
y E
K/S
Q/T
K
(Millio
ns)
EK SQ AF* LH*
Total Seats Capacity
EK - DXB SQ - SIN
Region Countries Destinatio
ns Frequencie
s Countries Destinatio
ns Frequencie
s
Africa 16 18 159 2 3 14
Domestic 0 0 0 0 0 0
Europe 13 24 288 11 14 100
Far East 9 12 168 11 18 344
Latin America 1 1 7 0 0 0
Middle East 10 13 200 3 5 32
North America 2 5 38 1 5 45
Oceania 2 6 98 2 7 113
South Asia 5 17 275 4 9 69
TOTAL 58 96 1,233 34 61 717
Source TroyAvi Analysis
Realizing the vision together
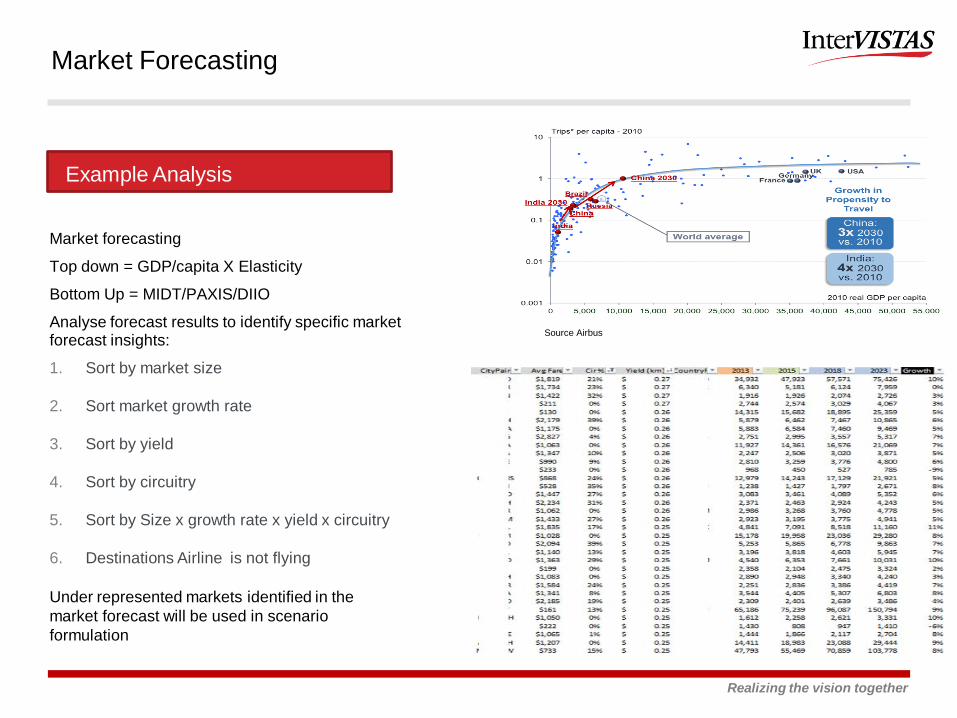
Market forecasting
Top down = GDP/capita X Elasticity
Bottom Up = MIDT/PAXIS/DIIO
Analyse forecast results to identify specific market forecast insights:
1. Sort by market size
2. Sort market growth rate
3. Sort by yield
4. Sort by circuitry
5. Sort by Size x growth rate x yield x circuitry
6. Destinations Airline is not flying
Under represented markets identified in the
market forecast will be used in scenario
formulation
Market Forecasting
Example Analysis
Source Airbus

Realizing the vision together
Strategic Planning in Airlines - Overview
18 18
Strategic
Assessment
Network
Design and
Fleet
Planning
Business
Model
Alignment
Business
and
Implementa
tion
Planning
Strategic
Intent
1 2 3 4 5
Global
Continent/Region
Country
Specific
Segment
Long Term
Short Term
Hub Design
Fleet Planning
Demand
Supply
SWOT
Market
Forecasting
Commercial
Operational
Subsidiaries
Organisational
Business Plan
Implementation
Plan

Realizing the vision together
Long Term Network Design
19
Calibration
Scenario Development
Unconstrained long term view
Maximise commercial opportunity
Market Forecast, Average Fares, Costs, Schedules
Overbuilt Analysis
Test different scenarios
Network Optimisation
Network that maximises Route Level Variable contribution
Evaluate frequency changes
New service opportunities.
Schedule options
Connecting traffic opportunities at Hub.
Example Analysis
Overview of Network Design
DME SVO

Realizing the vision together Source: OAG, July 10-16, 2000
Connectivity evolution Hub connectivity and optimisation
• Execute Airline hub optimisation, adjusting number,
timing, and directionality of flights
• Add frequency and capacity according to demand and
profitability without slot constraints. This unconstrained
scenario will define maximum benefit opportunity.
• Determine changes in connectivity, passenger numbers
and yield for long haul pillar flights, medium haul flights,
regional flights, short haul domestic flights.
• Improve Airline ’s market share in fast growing, high
yield markets with good Hub circuitry.
• Improve meaningful connections offered at Hub.
• Improve competitiveness compared with other regional
airlines and gateways.
• Improvements in overall connect time and passenger
share on key markets.
• Improvements of revenue and variable contribution
through improved hub design.
Once the runs of each qualified scenario are finished, a
quantitative comparative evaluation is be undertaken
where the relative strengths and weaknesses of scenarios
will be discussed
Example Analysis
Intervistas Analysis

Realizing the vision together
Hub design and optimisation (continued)
Overbuild – maximise margins
Lang haul flights optimisation
Medium to short haul flights optimisation
Within bank flight optimisation
Maximising connection of high yield markets
Optimise hub connectivity
Stagelength (Hrs)
14
12
10
8
6
4
2
Time at Base (IST) 0600 0630 0700 0730 0800 0830 0900 0930 1000 1030 1100 1130 1200 1230 1300 1330 1400 1430 1500 1530 1600 1630 1700 1730 1800 1830 1900 1930 2000 2030 2100
BUD
LHR
BUD
DEL
LHR
BUD
Example Analysis
Source Intervistas Analysis

Realizing the vision together
Evaluation of optimised schedule effectiveness Improvements in Hub Performance
Source TroyAvi Analysis

Realizing the vision together
Comparison of improvements across interim
schedules Long Term Network Optimisation
From passenger revenues, route profitability is also calculated . This includes route revenues
and costs – the basis of network and hub optimisation
Source TroyAvi Analysis

Realizing the vision together
Objective is an optimised short term hub design,
including improvements in connecting markets and
incremental financial performance compared with the
current schedule.
A list of potential new destinations and frequencies
identified for immediate implementation
Evaluate current near-term operational constraints at
Hub (airspace, aircraft movements during peak hours,
bilaterals, slots, curfews, gate space restrictions) which
may prevent increase of frequency/capacity of flights or
the introduction of new flights.
Analyse Airline ’s capability in consistently delivering aircraft turn times (critical for optimal hub performance).
Focus on time of day changes to maximise number of meaningful connections between markets as these could be implemented without much operational impact
Sort flights according to contribution and take action for improvements in system wide variable contribution
Short term Network Optimisation
Example: Constraints with Impact on Profitable Network
Growth
Example: Evaluation of Flights According to Route
Profitability and Revenue Performance
Example Analysis

Realizing the vision together 25
Standard Hub Carrier #1 Hub Carrier #2
Airport HC1 HC2 D-D D-I I-D I-I D-D D-I I-D I-I D-D D-I I-D I-I
AMS KL 25 50 50 50 50 50 50 50
AUH EY 60 60 60 60 60 60 40 60
BKK TG 30 120 120 75 30 90 90 45
CAI MS 30 90 90 90 60 60 60 60
DOH QR 20 60 60 60 20 60 60 30
DTW DL 45 60 90 60 30 40 75 75
DXB EK 20 60 60 75 20 60 60 45
FRA LH 45 45 45 45 45 45 45 45
HKG CX n/a n/a n/a 60 n/a n/a n/a 50
IAH CO 45 60 60 75 30 30 50 50
ICN KE OZ 40 100 100 70 40 70 100 45 40 70 90 45
IST TK 30 90 75 60 45 75 75 60
KUL 60 60 60 60
MSP DL 40 40 60 60 30 40 75 75
MUC LH 45 45 45 45 30 30 30 30
NRT JL NH 30 100 100 60 20 100 90 60 20 100 100 60
PHL US 40 90 90 90 30 50 90 90
SAW TK 20 60 60 60 30 45 45 45
SEA AS 70 70 90 90 40 40 80 80
SIN SQ n/a n/a n/a 60 n/a n/a n/a 50
Constraints limiting network growth Example Evaluation Of Airport Constraints Is Important In
Development Of Practical And Implementable Network Design
Example: ATM’s
Example: Connect Times

Realizing the vision together
.
• Develop optimal fleet plan supporting the long term network plan
• Provide recommendations for redeployment of fleet plan
• Review current Airline fleet including age, maintenance requirements/costs, onboard product, range, fuel burn and fleet commonality.
• Review current fleet orders and compare it against the optimised long term network requirements maximizing route profitability and fleet utilization.
• Apply fleet plan to proposed passenger forecast and schedule to assess the optimal types/mix of aircraft that will most efficiently operate the route network.
• Assess how the fleet plan will evolve over the forecast period taking retirements and new deliveries into consideration.
• Ensure that fleet utilization is optimised
• Develop optimal narrow body and wide body fleet ratios in the near term, considering optimal requirements for the Hub
• Buy versus lease calculations
Fleet Planning
Example: Fleet Operating Costs Analysis
Example: Fleet Optimisation Analysis
Example Analysis
Intervistas Analysis

Realizing the vision together
Example Aircraft Financing Evaluations
Source DVB bank, AISI

Realizing the vision together
Example Aircraft Buy Versus Lease Calculations
Source Intervistas Analysis

Realizing the vision together
Strategic Planning in Airlines - Overview
29 29
Strategic
Assessment
Network
Design and
Fleet
Planning
Business
Model
Alignment
Business
and
Implementa
tion
Planning
Strategic
Intent
1 2 3 4 5
Global
Continent/Region
Country
Specific
Segment
Long Term
Short Term
Hub Design
Fleet Planning
Demand
Supply
SWOT
Market
Forecasting
Commercial
Operational
Subsidiaries
Organisational
Business Plan
Implementation
Plan

Realizing the vision together
Business Model Alignment - Commercial Processes
Alignment of commercial processes with the
new business model and route strategy. These
will include changes in pricing, distribution and
product strategy supporting the business
model changes and route strategy
30
Distribution benchmarking, segments, unit
revenue, unit cost per channel
Changes in Distribution mix with focus on direct
channels without losing high yield GDS channels
Development of the distribution strategy Meetings
with Airline key customers, (travel Agency,
Corporate) and establish improvement priorities
Alignment of commercial organisation
Alignment of performance measures. And key
performance measures for the leadership of Airline
Airlines
These will drive further improvement projects
Example Analysis
Source Intervistas Analysis

Realizing the vision together
2.2 Business Model Alignment- Operations and Support Processes
• Alignment of the operational activities support business
model changes – Review cost structure, assess changes
to the operational costs, productivity improvements
• Determine improvements in performance targets to
support the business model changes
• Determine target CASK to support business model
• Review current cost structure, direct and indirect
• Direct costs include
- Fuel, MRO, Ground Handling, Catering,
• Determine initiatives for productivity improvement and unit
cost reduction to meet target CASK
• Alignment of the operational activities support business
model changes- Crew and integrated operations control
improvements
• Alignment of MRO activities
• Alignment of organisation and performance measures
• Projects and initiatives for reduction of operational costs
and improvements in productivity This will include major
cost items such as Fleet (Utilisation), maintenance, crew,
ground handling costs, overheads and other areas
31
Example Analysis

Realizing the vision together
Strategic Planning in Airlines - Overview
32 32
Strategic
Assessment
Network
Design and
Fleet
Planning
Business
Model
Alignment
Business
and
Implementa
tion
Planning
Strategic
Intent
1 2 3 4 5
Global
Continent/Region
Country
Specific
Segment
Long Term
Short Term
Hub Design
Fleet Planning
Demand
Supply
SWOT
Market
Forecasting
Commercial
Operational
Subsidiaries
Organisational
Business Plan
Implementation
Plan

Realizing the vision together
Business Plan Development
Business plan is driven by the new network, fleet, and
alignment of commercial and operational functions
including revenue and cost forecast ..
Based on the revenue and cost forecast conducted
above, create a five-year operating profitability and
profit margin forecast of the airline is developed.
This will include estimate of capital expenditure and
working capital for the start up period
Sensitivity analysis is executed for the most important
drivers in the model, such as fleet size, load factor,
yields, price of fuel, etc
Identify key revenue and cost drivers and develop risk
scenarios that test the assumptions upon which they
are based to understand the extent to which the
business is sensitive to these assumptions.
To deliver the business model changes, an overall
migration plan will be developed. This will be
complemented with specific improvement initiatives and
projects.
2007 2008 2009 2010 2011 2012 2013
Revenues
Passenger Revenues 91,659 96,538 94,629 90,486 90,486 90,486 90,486
Other Revenues 11,190 20,224 16,599 18,274 18,274 18,274 18,274
Total Revenues 102,849 116,762 111,227 108,759 108,759 108,759 108,759
Operating Expenditure
Total Variable Costs 68,610 85,694 71,147 65,191 65,015 65,015 65,015
Total Fixed Direct Operating Costs 28,324 30,018 30,102 30,187 30,187 30,187 30,187
Indirect Operating Costs
Other Staff Salary Costs 3,041 2,953 3,349 3,481 3,481 3,481 3,481
Other Indirect Costs 5,511 3,961 3,961 3,961 3,961 3,961 3,961
Total Indirect Operating Costs 8,552 6,914 7,309 7,442 7,442 7,442 7,442
Total Operating Expenditure 105,485 122,626 108,559 102,820 102,643 102,643 102,643
EBITDA -2,636 -5,865 2,668 5,940 6,116 6,116 6,116
EBITDA Margin -3% -5% 2% 5% 6% 6% 6%
Change versus Baseline
EBITDA 0 0 762 4,002 3,975 3,975 3,975
EBITDA Margin 0% 0% 1% 4% 4% 4% 4%
Example Development of Business Plan
New Forecast Operating
Results
Expense Forecast
Projected Financial
Results
Cash Flow from
Operations
Current Debt & Capital Structure
Modify for Fleet
Changes &
Restructuring
Debt Service
Requirements
Cash
Requirements
Cash Plan
Debt Restructuring
Opportunities
Debt
Equity
Potential Sources of
Capital
Capital
Spending
Technique
Options
Evaluation
Through
Modeling
New Forecast Operating
Results
New Forecast Operating
Results
Expense ForecastExpense Forecast
Projected Financial
Results
Projected Financial
Results
Cash Flow from
Operations
Cash Flow from
Operations
Current Debt & Capital StructureCurrent Debt & Capital Structure
Modify for Fleet
Changes &
Restructuring
Debt Service
Requirements
Debt Service
Requirements
Cash
Requirements
Cash
Requirements
Cash PlanCash Plan
Debt Restructuring
Opportunities
Debt Restructuring
Opportunities
DebtDebt
EquityEquity
Potential Sources of
Capital
Potential Sources of
Capital
Capital
Spending
Technique
Options
Evaluation
Through
Modeling
Technique
Options
Evaluation
Through
Modeling
Example Development of Business Plan
Example Activities
Source ICF

Realizing the vision together
Exhibit 31Business Plan Development
Cash Flow Jan-11 Feb-11 Mar-11 Apr-11 May-11 Jun-11 Jul-11 Aug-11 Sep-11
Working Capital (Start) 40,000,000 31,637,500 27,686,010 25,538,207 23,444,248 19,991,710 15,912,597 14,047,140 11,962,270
Operating Revenue 2,744,094 2,396,536 2,725,847 2,819,215 3,779,495 4,136,597 4,719,013 6,091,082 5,433,022
Operating Expenses 4,315,595 4,128,026 4,314,317 4,268,174 5,672,700 5,629,043 5,746,804 7,175,952 7,032,587
Initial CapEx Outlay 3,791,000 2,220,000 559,333 645,000 559,333 2,586,667 837,667 - 192,667
Additional CapEx
Aircraft Security Deposits 3,000,000 - - - 1,000,000 - - 1,000,000 -
Working Capital Changes (8,362,500) (3,951,490) (2,147,803) (2,093,959) (3,452,538) (4,079,112) (1,865,457) (2,084,871) (1,792,232)
Working Capital (End) 31,637,500 27,686,010 25,538,207 23,444,248 19,991,710 15,912,597 14,047,140 11,962,270 10,170,038
Cash Flow Oct-11 Nov-11 Dec-11 2011 2012 2013 2014 2015
Working Capital (Start) 10,170,038 8,737,794 7,451,873 40,000,000 6,331,634 (5,087,537) 14,687,757 88,001,184
Operating Revenue 5,773,966 5,982,714 6,451,036 53,052,618 127,466,820 243,703,168 430,005,855 652,142,240
Operating Expenses 7,151,210 7,075,968 7,204,609 69,714,983 132,885,992 217,927,873 345,692,428 509,015,566
Initial CapEx Outlay 55,000 192,667 366,667 12,006,000 - - - -
Additional CapEx - 1,000,000 1,000,000 1,000,000 1,000,000
Aircraft Security Deposits - - - 5,000,000 5,000,000 5,000,000 10,000,000 10,000,000
Working Capital Changes (1,432,244) (1,285,921) (1,120,239) (33,668,366) (11,419,172) 19,775,294 73,313,427 132,126,674
Working Capital (End) 8,737,794 7,451,873 6,331,634 6,331,634 (5,087,537) 14,687,757 88,001,184 220,127,858

Thank You
Please contact Emre Serpen for queries
+447944163891