The University of North Carolina North Carolina Chapel Hill.

Paul J. CozzaChief Executive OfficerNorth Carolina State Ports Authority
February 26, 2015
2015 Strategic Plan of the
North Carolina State Ports Authority

TABLE OF CONTENTS TABLE OF CONTENTS ....................................................................................................................................1 EXECUTIVE SUMMARY ..................................................................................................................................2 ABOUT THE NORTH CAROLINA STATE PORTS AUTHORITY ...............................................................................3 STRATEGIC PRIORITIES ..................................................................................................................................7
CONTAINERS ..............................................................................................................................................10 GENERAL TERMINAL ...................................................................................................................................13 INFRASTRUCTURE INVESTMENT NEEDS .......................................................................................................18 ECONOMIC IMPACTS ..................................................................................................................................21 APPENDIX 1. STRENGTHS, WEAKNESSES, OPPORTUNITIES AND THREATS......................................................23
APPENDIX 2. PEER PORT ANALYSIS .............................................................................................................25 APPENDIX 3. MEGAREGIONS ......................................................................................................................31 APPENDIX 4. PANAMA CANAL EXPANSION ..................................................................................................32 APPENDIX 5. GLOBAL VESSEL FLEET ............................................................................................................33
APPENDIX 6. DISTRIBUTION CENTERS AND INLAND PORTS...........................................................................36 APPENDIX 7. COMMODITY ANALYSIS ..........................................................................................................37 APPENDIX 8. PORT OF WILMINGTON ..........................................................................................................46 APPENDIX 9. PORT OF MOREHEAD CITY ......................................................................................................48
Page 1 of 49
EXECUTIVE SUMMARY While the North Carolina Ports are physically located in Wilmington and Morehead City, the economic benefits of vibrant, growing ports reach from the coastal plains to the Blue Ridge Parkway.
North Carolina Ports support more than 76,000 jobs across the State and generate more than $700 million in annual state and local taxes. Goods moving through the Port of Wilmington contribute almost $13 billion to North Carolina’s economy, while goods through the Port of Morehead City contribute $ 1 billion.
North Carolina’s ports are a conduit of economic development. Business and industry need access to the global markets where their products are sold and their resources are found. The North Carolina State Ports Authority is dedicated to serving global and local business while attracting new companies to the economic development centers of the State.
North Carolina Ports is committed to enhancing the State’s economy. To do that, the Ports must constantly evaluate its market position and refine its business strategy to meet the demands of customers and the industry. This strategic plan outlines the four highest priority, near-term goals for the Authority:
• Double the container business to more than 530,000 TEUs
• Expand business on the general terminals by four million tons
• Execute an investment plan for needed terminal, road, rail and channel infrastructure to support the terminal growth goals, including the establishment of a channel project and reliable intermodal service
• Achieve financial sustainability to independently fund capital growth requirements
This strategic plan is based on sound industry expertise, competitive ports analysis and thorough market research. Combined with the Authority’s on-going long-term capital plan, this strategic plan will form the basis of the Ports business activities for the next five years. It is an ambitious plan, but one that well-positions the Authority to take advantage of the expanding marketplace. More importantly, this plan ensures North Carolina Ports will continue to help North Carolina’s economy grow.
From our beginnings as a World War II shipbuilding facility in Wilmington to today’s dynamic and fast-growing international seaports in both Wilmington and Morehead City, we are proud of our 70 years of service to the State. We invite you to read the plan and learn more about how North Carolina Ports is planning for the future.
After all, these aren’t just any ports. These are your ports.
Page 2 of 49
ABOUT THE NORTH CAROLINA STATE PORTS AUTHORITY International maritime terminals are a conduit of business activity connecting commerce with State industry. Volume growth through U.S. ports will continue to increase as the nation’s economy expands. U.S. East Coast ports are expected to benefit the most. U.S. East Coast ports have invested heavily in port infrastructure over the last 15 years. Simultaneously, import cargo from Asia that typically moved over the U.S. West Coast began shifting supply lanes to all water U.S. East Coast services. The Panama Canal expansion, port congestion, and west coast port labor disputes that result in work slowdowns also make the U.S. East Coast attractive to shippers. The resulting effect has been a large increase in container activity throughout the U.S. East Coast port range that is projected to continue.
The Panama Canal expansion will be completed by 2016 and the new canal will be capable of handling vessels almost three times larger than current ships. This in turn will offer large cost and operating efficiencies to the shipping community and is expected to stimulate additional volume. Congestion at U.S. terminals is becoming more prevalent. The congestion stems from terminal size and capacity constraints due to rail and road limitations near many seaports. The U.S. southeast ports are positioned well since capacity issues are not as prevalent in this region. The U.S. West Coast ports are plagued with labor disputes and resulting work slowdowns, causing tremendous disruption to the supply chain and compounding congestion issues. The confluence of these factors all signal a positive outlook for the U.S. southeast port region.
The North Carolina State Ports Authority (the Authority) is well-positioned geographically to leverage these competitive advantages. However, the Authority has not historically kept pace with neighboring ports in terms of market growth. Economists agree that international trade directly contributes to a successful and progressive business climate. An efficient supply chain will attract and retain producers, importers and other logistics related industries to a region. An improved international gateway for North Carolina will also enhance the State’s ability to attract new business. As manufacturing and logistics firms continue to migrate to the U.S. East Coast, especially the U.S. southeast region, a significant portion of their site selection analysis is determined by an efficient supply chain that includes a global gateway.
Many of North Carolina’s importers and exporters are forced to utilize neighboring ports in Virginia, South Carolina, Georgia and Florida as international gateways since they cannot access the same number of vessel service trade options at North Carolina’s ports. These routing choices result in increased inland truck and rail costs, which in turn can make these companies less competitive. Expansion of the Authority’s business volumes and corresponding vessel service trade options will benefit North Carolina’s importers and exporters.
Trade through North Carolina’s ports provides an enormous benefit to the North Carolina economy, as identified in the recent economic contribution study that was independently completed by N.C. State’s Institute for Transportation Research and Education. The findings show that there is approximately $14 billion in annual economic contribution to the state’s economy constituted by goods moving through North Carolina ports and 76,700 jobs are associated with businesses that use North Carolina’s ports.
These economic contributions are heavily reliant on the existence of North Carolina’s container business. Continued market share loss could lead to a diminutive market position and potentially result in the complete loss of maritime containerization in North Carolina. If the container shipping companies do not feel that the Authority is a sustainable container option, there is a strong probability they will shift their container services to neighboring ports. In order to compete, the Authority must grow container volumes and provide needed vessel service expansions and service offerings.
This plan undertook extensive market research of industry and market data, coupled with an understanding of freight flows, to identify and understand the total and addressable markets for the Authority’s port commodity segments. The market opportunities were then coupled with the competitive factors of service and cost to determine possible scenarios for capturing additional volume and expansion. The Authority feels that North Carolina Ports has distinct potential for expansion in the coming years; however, several steps will need to be taken both organizationally and through investments to facilitate this growth.
Page 3 of 49

The Authority believes that a sizable market opportunity exists and the combination of competitive factors of service and cost, targeted outreach and infrastructure investments will enable the Authority to grow new carrier services and build on existing cargo supply chains in North Carolina to provide customers an economically advantaged gateway to their global markets. Implementation of this plan would more than double the number of containers and general terminal cargo volumes over the next five years. This level of activity will provide more than $31 billion in annual economic contribution to the state’s economy by fiscal year 2020 and more than $39 billion in annual economic contribution to the state’s economy by fiscal year 2025.
The Authority’s plan is to be strategically positioned as the highest level service provider with the lowest cost on the U.S. East Coast. The management team strives to have the most operationally efficient port terminals where berth productivity, berth congestion, yard productivity, gate productivity and turn times need to be best in class. The Authority is also investing in additional sales and business development resources to vastly improve the commercial profile in identified markets. Sales training, specific sales targets and improved customer service are the cornerstone of the marketing plan.
Achieving the Authority’s strategic goals will necessitate additional planning and external assistance. A moderate capital infusion to support the capital investment plan will require $114 million over the next five years, with $75 million focused on the container business at Wilmington. An additional $135 million in infrastructure investment will be required over the next ten years. A feasibility study with the U.S. Army Corps of Engineers for enhancing the Cape Fear River channel must commence in 2015. After successful completion of that study, with specific harbor depths identified and an approval from the Wilmington District Corps of Engineers, a joint state and federal funded project will be required. For the Port of Morehead City, annual funding from North Carolina to maintain the current approved channel depth may be required. In addition, it is imperative that cost competitive intermodal service be provided by CSX at the Port of Wilmington to make the container services viable. Finally, an independent long range study needs to be initiated to examine a new strategic North Carolina seaport. The study will need to examine the benefits and advantages of Authority owned properties at Radio Island/Morehead City, in coastal Brunswick County, as well as other possible locations.
Facilities and Organization
Created in 1945, the Authority is charged with operating and promoting North Carolina’s deepwater ports and associated facilities. The Authority owns and maintains the Port of Wilmington, the Port of Morehead City as well as two inland facilities, the Charlotte Inland Terminal and the Piedmont Triad Inland Terminal.
The Port of Wilmington is North Carolina’s largest port with an operating terminal of 284 acres. The Port of Wilmington handles containers and a variety of bulk and breakbulk cargo.
The Port of Morehead City is a slightly smaller port than the Port of Wilmington in terms of size and volume, and does not handle any container cargo. The Port of Morehead City serves breakbulk and bulk customers, including a tenant-operated liquid bulk facility on the Radio Island terminal.
The Charlotte Inland Terminal and the Piedmont Triad Inland Terminal were created to meet several port and transport challenges, including the need for professional neutral container yard operations for container carriers and to provide staging for empty and loaded containers that are bonded by U.S. Customs and Border Protection.
North Carolina Ports are a self-sustaining organization, generating revenues used to fund operations. There are considerable advantages to this organizational design. The Authority is able to develop strategic relationships throughout all levels of state government while maintaining autonomy to make decisions and manage its resources. The Authority is governed by a Board of Directors that is appointed by the Governor, the Speaker of the North Carolina House of Representatives and the North Carolina Senate President Pro Tem.
Page 4 of 49

The Strategic Plan
Strategic planning closes the gap between the organizational strategy that occurs once every five to ten years and the annual tactical planning and budgeting. This plan examines a horizon of three to five years and was developed much like a commercial business plan; thoroughly analyzing the current industry, market, competing ports and an assessment of the organization itself, to fully understand the total and addressable market and its dynamics. Once the market was fully identified and understood, growth goals were established with identifiable targets and infrastructure investment requirements were identified. In some cases, longer term planning will be necessary. Input was provided from a wide range of sources and partners, including the expertise and support of the Authority’s Board of Directors.
Mission
The mission of the Authority is to be the gateway to global markets and enhance the economy of North Carolina by supporting and improving the state's logistics network.
Core Competencies
The core organizational competencies of the Authority are competitive pricing and a superior portfolio of differentiated services. Lack of congestion on North Carolina terminals provides the basis for unparalleled customer service, boasting quick truck turn times and best in class crane productivity. Also, the terminals in Wilmington and Morehead City have plenty of terminal space to grow.
The Authority’s Strategic Goals 2015 - 2020
The highest priority goals for the Authority are:
• Double the container business to more than 530,000 TEUs
• Expand business on the general terminals by four million tons
• Execute an investment plan for needed terminal, road, rail and channel infrastructure to support the terminal growth goals, including the establishment of a channel project and reliable intermodal service
• Achieve financial sustainability to independently fund capital growth requirements
Strategic Success Measures
The Authority’s quantifiable key performance indicators are identified as Strategic Success Measures (SSMs). SSMs serve as the foundation to analyze and track performance and base key strategic decisions regarding priorities, staffing and resources. The strategic success measures are used to measure performance against the stated strategic goals and will be reported to the Authority’s Board of Directors quarterly.
Page 5 of 49

Table 1. Executive Strategic Success Measures
Financial Performance EBIDA
Net Income
Market Performance
Cargo Tonnage
Annual Container Moves
New Container Services Acquired
New Lines of General Cargo
Internal Efficiency and Effectiveness
Containers
Crane Moves per Hour
Truck Turn Times
Crane Downtime
General Terminal
Steel Truck Turn Times
Pulp Truck Turn Times
Rubber Truck Turn Times
Safety Lost Time Accidents
Page 6 of 49

STRATEGIC PRIORITIES Identifying and addressing the Authority’s strategic priorities is vital to accomplishing the port’s strategic goals. There are a number of strategic priorities that must be addressed in order for the Authority to be successful.
Increased Market Share
A sizable market opportunity exists and targeted marketing and infrastructure investments will enable the Authority to grow new carrier services. In the container segment, underserved customers and market opportunities in the North Carolina’s addressable market have been identified as nearly 2 million TEUs. A successful Ports strategy must include serving businesses that are utilizing other ports but would be more competitive with better cost and service if the right global services were available at North Carolina Ports.
The addressable market for bulk and breakbulk segments at North Carolina Ports includes more than 37 million tons of cargo that could be cost and service favorable to North Carolina. The region has stable and mature bulk industries with good hinterland connections.
Infrastructure Investment
U.S. seaports and their partners plan to invest a combined $46 billion over the next five years in wide-ranging capital improvements to their marine operations and other port properties in order to provide adequate navigation depth, in-port handling capacity, and fast, reliable rail and highway connections from production centers (for exports) and consumer markets (for imports)1. Adequate infrastructure and connections to the terminals, landside networks and water-side navigation channels will minimize bottlenecks that result in congestion, productivity losses and a global economic disadvantage for North Carolina and the nation.
Financial Sustainability
The Authority is run like a business and the more business and cargo volume the Authority generates at the terminals, the greater the revenue and profit. The Authority must be able to leverage its own funding for large capital outlays. Operating like a business, the Authority must plan for the funding requirements of expansion projects and future development opportunities with a comprehensive integrated funding strategy.
Collaboration
It is imperative that the Authority communicate with local, state and federal officials about the Authority’s goals and initiatives, as well as advocate for conditions favorable to advancing the Authority’s goals. Effective outreach and communication around the state and with host communities, coupled with an understanding of the expectations of those groups is required for consensus and successful outcomes. The Authority strives for strategic and on-point communications with its statewide public outreach, advocacy at the state General Assembly and federal Congressional level, as well as effective communication with its Board of Directors.
Partnerships and Outreach
Ports are just one component of a global supply chain that connects customers to the international marketplace. As a part of the larger network, state and local agencies and organizations play a critical role in promoting and sustaining industrial development projects that are port-dependant. The Authority partners with other agencies and organizations to deliver a complete supply chain solution across North Carolina. The Authority has a close collaborative relationship with the N.C. Department of Transportation, N.C. Department of Commerce, N.C. Department of Agriculture, Economic Development Partnership of N.C., local economic development groups and many others state and local organizations.
1 American Association of Port Authori ties report, 2012
Page 7 of 49

Public-Private Partnerships
The Authority leverages public-private partnerships as a means to attract new business while minimizing risk. Public private partnerships allow the Authority to construct and maintain projects previously unattainable due to resource constraints, thereby gaining the economic contributions to the local and statewide economy while minimizing the costs to the Authority.
Agriculture
North Carolina's agricultural industry, including food, fiber and forestry, contributes $78 billion to the state's economy and accounts for more than 17 percent of the state's income2. North Carolina is one of the most diversified agriculture states in the nation and growth at the port is dependent on serving this segment of North Carolina’s economy.
At the Port of Wilmington, more than 29,000 containers of agricultural goods, including animal feed, cotton, food, lumber and tobacco moved through the facility in fiscal year 2014; 96 percent was North Carolina exports. At the general terminals of Wilmington and Morehead City, more than one million tons of agricultural commodities were moved through the ports in fiscal year 2014 including forest products, logs, woodpulp, feeds, and fiber. Nearly one and half million more tons of fertilizer, most in support of agricultural business, was moved via vessel or barge at North Carolina’s ports in 2014. Combined, agricultural goods and goods that support agricultural industries make up more than 66 percent of the total tonnage that moved over North Carolina’s general terminal berths in 2014. The Authority is looking for more ways to best leverage port facilities to benefit North Carolina’s growers.
While neighboring ports handle much of North Carolina’s agriculture exports, infrastructure improvements to rail lines and roads, along with infrastructure upgrades at the terminals make North Carolina’s ports more attractive for agricultural exports. Two planned new wood pellet projects, one in Wilmington and the other in Morehead City will significantly impact the economy of eastern North Carolina. Within five years, the two wood pellet facilities are expected to nearly double the total export tonnage moving through North Carolina’s port facilities.
Cold Storage
North Carolina is a major hub for global exportation of refrigerated pork and poultry products and a major player in the protein production export business. A new ‘at port’ cold storage distribution center will provide global market benefits to North Carolina’s agricultural industry sectors (exports) and food distribution sector (imports). In addition, a cold storage facility will potentially help generate increased container space each week on the container carriers calling at the Port of Wilmington. This will enhance the ability to market and recruit additional container and break-bulk carrier services that serve existing and new global trade lanes.
Military
North Carolina is home to the third largest military population in the United States3. A 2013 report conducted by the NC Department of Commerce found that the military accounts for 10 percent of the North Carolina’s economic activity, making it North Carolina’s second largest economic sector. Providing support to this community is critical to maintaining the nation’s security as well as supporting North Carolina’s economy. The North Carolina Ports are well positioned to meet the evolving Department of Defense requirements. Identified as two of the nation’s Strategic Seaports, the North Carolina Ports are capable of simultaneously handling commercial and military requirements. Each Strategic Seaport is unique in its capabilities and provides the Department of Defense with operational flexibility/redundancy and port facilities and services that are critical in meeting a wide range of national security missions. North Carolina Ports are well positioned to provide significant support to commercial cargo and military deployment requirements during instances of rapid
2 http://www.ncagr.gov/stats/general/overview.htm 3 http://www.ncmili tary.org/content/north-carolina-mili tary-foundation
Page 8 of 49

deployment or mission related cargo surges. The U.S. military has centralized the global transportation and logistics control to U.S. Transportation Command. The Authority’s designation as Strategic Seaports provides a formal process for communicating with military leadership on the Authority’s capabilities to meet military requirements.
Automobiles
North Carolina continues to focus on a large automotive win and major manufacturing and assembly plant site-selection criteria require proximity to deepwater port facilities with global service coverage. Automotive plants generate thousands of jobs and lay a foundation for further economic growth, as third party auto processors operate near the auto processing plant to provide services to the vehicles prior to shipment. North Carolina’s ports are poised to support a new automotive assembly plant and the associated auto processors.
Offshore Energy
With the largest offshore wind resource on the U.S. East Coast, North Carolina has a unique and energetic microclimate for offshore-wind energy off the North Carolina coast4. These types of facilities require waterside maintenance facilities in support of the industry, offshore petroleum exploration and production also require use of waterside facilities.
4 http://www.energync.net/about-us/governors-panel-on-offshore-energy
Page 9 of 49

CONTAINERS Asia dominates the container trade; six of the world's ten busiest container ports are in China. The busiest port, Shanghai, handles 29 million TEUs. In comparison, the combined Port of Los Angeles and Port of Long Beach handles 14 million TEUs. Along the U.S. East Coast, the Port of New York and New Jersey handles 5.4 million TEUs, the Port of Savannah 3.1 million TEUs, the Port of Norfolk 2.2 million TEUs, the Port of Charleston 1.6 million TEUs and the Port of Wilmington is expected to exceed 300,000 TEUs this year.
There are eight container services at the Port of Wilmington, four of which are part of the CKYH Alliance, as well as Maersk (Sealand), Independent Container Line (ICL), Bahri (National Shipping Corporation of Saudi Arabia), and Boke Trading. In fiscal year 2014, the Authority’s container business represented approximately 26 percent of the total operating revenue and more than 65 percent of the Authority’s economic output contribution to North Carolina. The CKYH Alliance provides two weekly sailings to Asian markets and represents 80 percent of the Ports’ container revenue.
The Authority’s greatest risk moving forward, as a result of the Panama Canal expansion in 2016, is the loss of Asian container services in large part or entirely, resulting from a lack of channel depth to accommodate larger class vessels. In order to remain profitable and competitive, all carriers will need to deploy large ships via the Panama Canal. The ships that will call the U.S. East Coast will be in the 6,500 to 12,500 TEU range; the Port of Wilmington currently has the capability to serve vessels up to the 6,500 TEU range. Larger ships provide an economy of scale that translates to significant slot costs savings to the carrier.
A harbor enhancement effort that provides efficiencies to the Cape Fear River including a deeper navigation channel and a wider turning basin is required to serve these larger vessels. Improvements to the inland infrastructure would also be required, including reliable and cost competitive intermodal service, to expand service beyond the truck market.
Containers Market & Forecast
Defining the total market and addressable market is important for an organization to make decisions on how to best utilize resources. Total market identifies the entire regional area in which the Authority operates and may include cargo that could never be competitive or captured by North Carolina’s ports. The addressable market identifies the portions of the total market where the Authority could potentially compete; addressable market is used to reference the available revenue opportunity. Identification of the addressable market helps to prioritize and target business marketing efforts.
The Journal of Commerce forecasts that U.S. containerized imports will grow at a compound annual growth rate of 6.7 percent through 2018. U.S. containerized exports are forecast to grow at a compound annual growth rate of 2.4 percent through 2018. Forecasts for container imports and exports year-over-year are displayed in Table 2. These container forecasts were used as growth assumptions for examining the Authority’s container market; extensive market data was gathered and evaluated in order to develop the total and addressable market and forecasted growth.
Table 2: Overview of the U.S. Containerized Trade Projections (Year-Over-Year Percent Change)
Year 1
(FY 2016)
Year 2
(FY 2017)
Year 3
(FY 2018)
Year 4
(FY 2019)
Year 5
(FY 2020)
Imports 6.8% 6.7% 6.9% 6.9% 6.9%
Exports 3.2% 3.3% 3.4% 3.4% 3.4%
Source: JOC Five-Year Horizon, September 2014 (with assumptions by NCSPA for FY 2019 and FY 2020)
Page 10 of 49

In fiscal year 2014, the Port of Wilmington handled 252,369 TEUs. Assuming organic growth commensurate with the Journal of Commerce’s forecast in Table 1, the addressable market for containers via truck and the total U.S. South Atlantic container market are indicated in Table 3. The addressable market for containers via truck in North Carolina is defined as the TEUs within a favorable geographical area to the Port of Wilmington. Data related to U.S. container ports and TEU volumes was provided by the Port Rankings report released by the American Association of Port Authorities in June 2014.
Table 3. Truck-served TEUs at the Authority, Addressable Market for truck-served containers and total U.S. South Atlantic Market Now and in Year 5 (FY 2020)
NC Ports TEUs
Addressable Market for
Containers (via truck) TEUs
NC Ports Share of Addressable
Market Total US South Atlantic TEUs
NC Ports Share of Total
U.S. South Atlantic Market
Current 260,363 1,971,817 13.2% 8,952,684 2.9%
NC Ports TEU Goal in Year 5 (FY 2020) 538,357 2,534,481 21.2% 11,507,086 4.7%
Source: AAPA Container data, 2014 and NCSPA, 2014
Figure 1. Port of Wilmington Addressable and Total Truck Market
Source: NCSPA, 2014.
*Green dots in Figure 1 indicate market clusters of large accounts.
Page 11 of 49

The ports of North Carolina, Virginia, South Carolina, Georgia, Port Everglades and Miami, Florida have some number of identified TEUs that are within this favorable geographical area. The addressable market was determined by identifying the percentage of the identified TEUs at a competing port within the favorable geographic range to the Port of Wilmington and applying that percentage to the total number of TEUs moving through that port (i.e., if 37 percent of the identified TEUs within the geographically favorable range are moving through the Port of Charleston, 37 percent is applied to all the TEUs moving through the Port of Charleston). In the case of south Florida ports, only the portion of the cargo that is identified with an origin or destination of the Caribbean and/or Central America is applied to the addressable market in order to account for the North Carolina textile market that is known to be moving through those ports.
The total U.S. South Atlantic market is defined as all TEUs moving through Virginia, South Carolina, Georgia, North Carolina and the TEUs that are identified with an origin or destination of Caribbean and Central America moving through Port Everglades and Miami, Florida.
In order to expand the addressable market and provide better service to existing and future container customers, the Authority must secure reliable and cost competitive intermodal service at the Port of Wilmington. Approximately 20 percent of U.S. South Atlantic port traffic is intermodal movements. Assuming that an additional 10 percent of U.S. South Atlantic port traffic could be addressable for the Authority (due to competing rail contracts and service by carriers), intermodal container service would increase the container addressable market by more than one million TEUs.
Table 4. All TEUs at NC Ports, Addressable Market including Potential Intermodal Containers and Total U.S. South Atlantic Market Now and in Year 5 (FY 2020)
NC Port TEUs
Addressable Market for Containers (including
intermodal) TEUs
NC Ports Share of Addressable
Market
Total U.S. South Atlantic
TEUs
NC Ports Share of Total
U.S. South Atlantic Market
Current 260,363 2,867,085 9.1% 8,952,684 2.9%
NC Ports TEU Goal in Year 5 (FY 2020) 538,048 3,685,190 14.6% 11,507,086 4.7%
Source: NCSPA, 2015 *Broad assumptions were made to assess the intermodal market, full penetration of the intermodal
addressable market may be more significant than shown.
To meet the stated goal of doubling the container throughput at the Port of Wilmington, the Authority will need to increase its share of the addressable market from 13.2 percent to 21.2 percent. Should intermodal service become available at the Port of Wilmington, the size of the addressable market will expand, necessitating a market share increase from 9.1 percent to 14.6 percent over the five year period, based on the forecasted container industry growth.
Container Market Summary
Extensive market analysis reveals an underserved market within the Authority’s addressable container market; reaching that market is achievable through intensified marketing and outreach. The Authority currently serves 13 percent of the 1.9 million TEUs that are within a couple hundred miles radius of Wilmington; 8 percent market share growth over five years would double the container business.
Page 12 of 49

GENERAL TERMINAL As the demand for container services continues to grow, so does the demand for port capacity and vessel space to accommodate breakbulk commodities and project cargo. Terminal operators face a growing dilemma of committing space for additional container throughput volumes versus accommodating breakbulk commodities that require greater acreage per ton handled and are not as profitable. With strong economies worldwide, sufficient volumes exist for both the container operators and the breakbulk project cargo vessel operators to co-exist. Ports with sufficient property available to provide continued support for both lines of business would be successful in leveraging breakbulk clients that are losing their facility options at other ports.
Breakbulk cargo operators are facing growing competition from container carriers as more commodities are transitioned to containers. Most commodities that could use containers to realize improved scheduling and lower transport costs have already made the shift of modes. Commodities such as semi-finished or finished aluminum and steel products, semi-bulk in large bags, and a great variety of project cargos continue to embrace the use of breakbulk transport, as vessel designs and improved cargo handling technologies evolve to provide more efficient stowage, better in-transit cargo protection, and improved stevedore productivity. However, wood pulp, finished paper and dimensional lumber are quickly shifting to containers driven by lower ocean freight rates offered by the container operators.
Most of North Carolina’s breakbulk segments are delivered or carried by liner carriers that have specific contracts or agreements with the shipper. The Authority exerts influence over the carriers via dockage rates based on volumes. The Authority normally enters into specific service agreements with the shipper based on reduced handling and wharfage charges dependent on volume.
Bulk cargoes have seen some upside especially in the segments of grain, dry reduced iron (DRI) and wood pellets, unlike breakbulk that has not seen as robust growth the last decade. Bulk cargoes are priced and operated differently at the two ports. In Morehead City, the Authority receives bulk cargoes for several shippers, handling from the ground to truck or railcar. Other bulk cargoes are handled by Authority employees and direct labor costs are billed to the shippers. A number of growth opportunities have been identified in the bulk segment. Two new wood pellet export facilities, one at each the Port of Wilmington and the Port of Morehead City, are expected to export more than 2 million tons of wood pellets annually within the next five years.
The Port of Morehead City cargo handling capabilities, especially in the breakbulk segment are very competitive as compared to neighboring ports. Availability of terminal space, warehouse availability and oversize cargo handling (out of gauge) experience makes the Port of Morehead City a great option for project related work. The Authority will focus on these segments to increase value through the Port of Morehead City.
Bulk and Breakbulk Market and Forecast
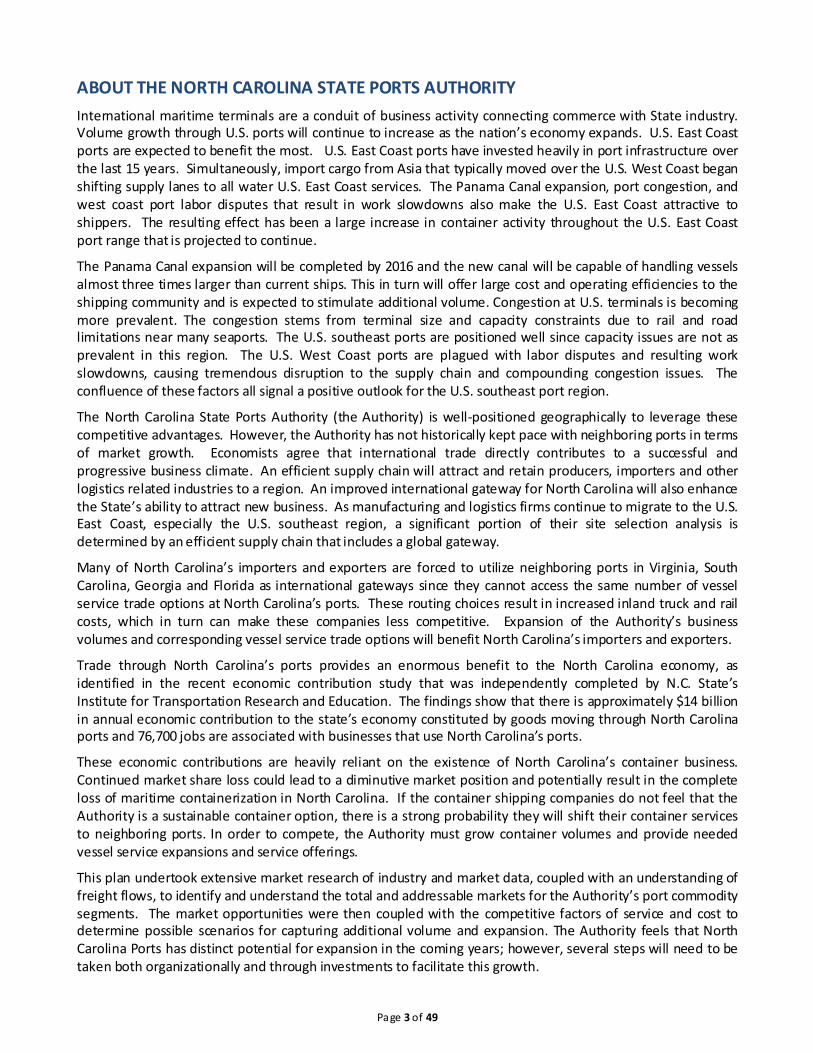
The commodities that have been identified as addressable bulk and breakbulk markets for the ports of Wilmington and Morehead City are listed with the projected growth rate (forecasted year-over-year growth change for next five years) in Table 5.
Page 13 of 49
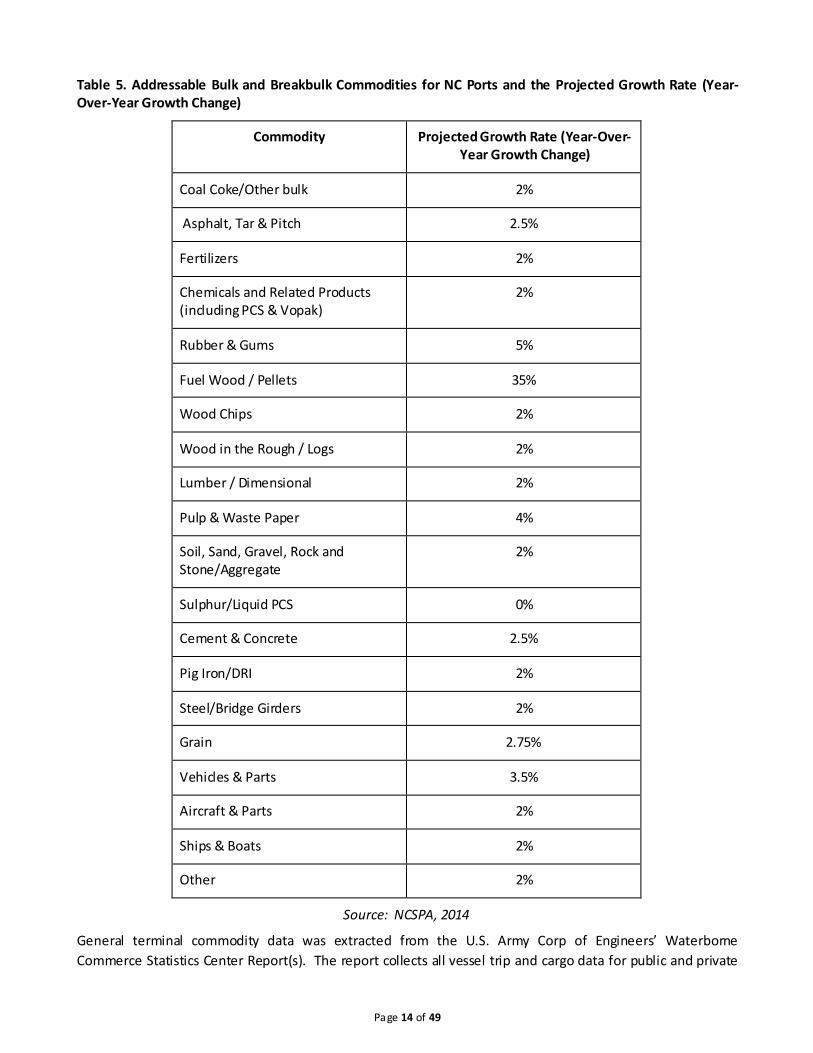
Table 5. Addressable Bulk and Breakbulk Commodities for NC Ports and the Projected Growth Rate (Year-Over-Year Growth Change)
Commodity Projected Growth Rate (Year-Over-Year Growth Change)
Coal Coke/Other bulk 2%
Asphalt, Tar & Pitch 2.5%
Fertilizers 2%
Chemicals and Related Products (including PCS & Vopak)
2%
Rubber & Gums 5%
Fuel Wood / Pellets 35%
Wood Chips 2%
Wood in the Rough / Logs 2%
Lumber / Dimensional 2%
Pulp & Waste Paper 4%
Soil, Sand, Gravel, Rock and Stone/Aggregate
2%
Sulphur/Liquid PCS 0%
Cement & Concrete 2.5%
Pig Iron/DRI 2%
Steel/Bridge Girders 2%
Grain 2.75%
Vehicles & Parts 3.5%
Aircraft & Parts 2%
Ships & Boats 2%
Other 2%
Source: NCSPA, 2014
General terminal commodity data was extracted from the U.S. Army Corp of Engineers’ Waterborne Commerce Statistics Center Report(s). The report collects all vessel trip and cargo data for public and private
Page 14 of 49

terminals in all harbors in the U.S. It includes a compilation of U.S. Army Corp of Engineers data on domestic trade and U.S. Census foreign trade data. The total bulk and breakbulk market for the Authority was identified as cargo moving domestically and internationally through all ports on the Atlantic coast between Philadelphia and Key West, Florida. The bulk and breakbulk addressable portion of the total market was further refined using PIERS data, staff knowledge and other industry input to account for containerization, market factors like geographic location of particular industrial sites, contract agreements or other factors that would limit the Authority’s competitiveness.
Figure 2. General Terminal Addressable and Total Market
Source: NCSPA, 2014
Table 6 shows the forecasted growth of bulk and breakbulk at the Port of Wilmington over a period of five years, with and without the development of a new wood pellet facility. Overall forecasted growth for the Port of Wilmington in bulk and breakbulk is expected to exceed 131 percent with the forecasted commodity segments and the new wood pellet facility.
Page 15 of 49

Table 6. Bulk and Breakbulk Tonnage at the Port of Wilmington and Addressable and Total Market for Identified Commodity Segments at the Port of Wilmington Now and in Year 5 (FY 2020)
Port of Wilmington
tonnage
Bulk/Breakbulk Addressable
Market tonnage (for identified
commodity segments)
Port of Wilmington
Share of Bulk/Breakbulk
Addressable Market
Total Bulk/Breakbulk Market tonnage
(for identified commodity segments)
Port of Wilmington
Share of Total Bulk/Breakbulk
Market
Current 2,084,293 36,158,641 5.76% 523,521,500 0.40%
Forecast through Year 5 (FY 2020) 4,818,000 45,945,806 10.49% 595,413,620 0.81%
Forecast through Year 5 (FY 2020) w/o the Wood Pellet Facility* 2,818,000 45,945,806 6.13% 595,413,620 0.47%
Source: NCSPA,2015 *The market was examined without the wood pellet facility because the high volumes mask other growth
opportunities.
Table 7 shows the forecasted growth of bulk and breakbulk at the Port of Morehead City over a period of five years, with and without the development of a new wood pellet facility. Overall forecasted growth for the Port of Morehead City in bulk and breakbulk is expected to exceed 81 percent with the forecasted commodity segments and the new wood pellet facility.
Table 7. Bulk and Breakbulk Tonnage at the Port of Morehead City and Addressable and Total Market for Identified Commodity Segments at the Port of Morehead City Now and in Year 5 (FY 2020)
Port of Morehead
City tonnage
Bulk/Breakbulk Addressable
Market tonnage (for identified
commodity segments)
Port of Morehead City
Share of Bulk/Breakbulk
Addressable Market
Total Bulk/Breakbulk Market tonnage
(for identified commodity segments)
Port of Morehead City Share of Total
Bulk/Breakbulk Market
Current 1,770,857 29,977,729 5.91% 327,375,000 0.54%
Forecast through Year 5 (FY 2020) 3,215,360 38,817,501 8.28% 369,473,045 0.87%
Forecast through Year 5 (FY 2020) w/o the Wood Pellet Facility*
2,815,360 38,817,501 7.25% 369,473,045 0.76%
Source: NCSPA, 2015 *The market was examined without the wood pellet facility because the high volumes mask other growth
opportunities.
Page 16 of 49

Table 8. Bulk and Breakbulk Tonnage at NC Ports and Addressable and Total Market for Identified Commodity Segments at both NC Ports Now and in Year 5 (FY 2020)
NC Ports tonnage
Bulk/Breakbulk Addressable
Market tonnage (for identified
commodity segments)
NC Ports Share of
Bulk/Breakbulk Addressable
Market
Total Bulk/Breakbulk Market tonnage
(for identified commodity segments)
NC Ports Share of Total
Bulk/Breakbulk Market
Current 3,855,150 37,358,582 10.32% 546,653,500 0.71%
Forecast through Year 5 (FY 2020) 8,033,360 47,329,576 16.97% 621,201,483 1.29%
Forecast through Year 5 (FY 2020) w/o the Wood Pellet Facility* 5,633,360 47,329,576 11.90% 621,201,483 0.91%
Source: NCSPA, 2015 *The market was examined without the wood pellet facility because the high volumes mask other growth
opportunities.
Breakbulk and Bulk Market Summary
Secured agreements with wood pellets facilities at both facilities will generate 2.4 million tons of pellets over the five year period. An additional 1.7 million tons of other general cargo is forecast for the two facilities, growing the combined general terminal volumes by 108 percent over the next five years. With increased growth comes better access to the global marketplace providing North Carolina’s businesses economic advantages but also providing the state with more economic development prospects.
Page 17 of 49

INFRASTRUCTURE INVESTMENT NEEDS In order to ensure that the Authority can adequately accommodate the planned container, bulk and breakbulk growth, capital planning and investment is required. Maintaining and improving efficiency at the terminals through more modern facilities and equipment is essential to meeting the Authority’s mandate to enhance the economy of North Carolina. Failure to adequately plan for capital needs virtually assures that scarce resources will be consumed in reacting to emergencies and that critical facilities, infrastructure, and equipment will continue to deteriorate. The framework for assessing facilities capital investment needs includes the harbor maintenance and landside interfaces for truck and rail.
North Carolina’s transportation infrastructure plays a critical role in attracting and retaining business. In 2014, Governor McCrory published a 25-year transportation vision to map the future and determine how to best leverage the North Carolina’s infrastructure to catalyze economic growth. Infrastructure improvements to transform North Carolina ports and benefit freight, military and logistic hubs are highlighted. Specific recommendations include studies to deepen and widen navigation channels to support movements of the newest generation of shipping vessels as well as improving highways, developing intermodal service, and enhancing freight movements at inland ports and other freight generators across North Carolina to improve the overall supply chain and grow international commerce.
Terminal Infrastructure
Capital needs for the terminal are categorized by infrastructure asset groups (i.e., cranes, dock/berth complexes, open storage areas, warehouses, gates, other/infrastructure) on the terminal. Infrastructure investment will be required to provide the needed equipment and facilities to support the projected growth; $113 million in the first five years, with $75 million for the continuation of a container berth expansion and modernization project that includes additional cranes. In the subsequent five years, an additional $135 million will be required to maintain existing facilities and support planned growth.
Channel Enhancement
The navigation channels that lead to the ports in Morehead City and Wilmington are federally funded and maintained by the U.S. Army Corps of Engineers. The U.S. Army Corp of Engineers prioritizes future channel projects in part on usage and growing volumes will support the need for a channel upgrade. A feasibility study with the U.S. Army Corps of Engineers for enhancing the Cape Fear River channel must commence in 2015. After successful completion of that study, with specific harbor depths identified and an approval from the Wilmington District Corps of Engineers, a joint state and federal funded project will be required.
Federal funds for routine operations and maintenance projects continue to decline. At the same time, the Morehead City Harbor continues to shoal rapidly and the need for extensive maintenance dredging continues to increase. Recognizing the need for stable funding for maintenance dredging, the Authority, in cooperation with the State of North Carolina, is seeking to enter into a Memorandum of Agreement with the U.S. Army Corps of Engineers to provide contributed funds for Operations and Maintenance dredging of the Morehead City Harbor to supplement existing and appropriated Operations and Maintenance funds. On behalf of the State, in fiscal year 2015 the Authority intends to provide up to $4.8 million in supplemental dredging funds. In providing these funds, it is the intention of the Authority that the additional funds would be used to supplement an additional dredging cycle in the Morehead City Harbor, should additional U.S. Army Corps of Engineers Work Plan money be made available in any amount. In return for providing these funds, the Authority anticipates the U.S. Army Corps of Engineers will consult with the Authority as to the particulars of the contract prior to solicitation.
Truck Mobility
Goods originating from or destined for use in North Carolina are transported primarily by truck. The state’s producers report that landside costs – getting to and from the port gate – comprise 50 percent or more of total
Page 18 of 49

overseas delivery cost. As a result, proposed freight transportation system investments put a heavy emphasis on highway projects5.
Measured in terms of distance to the nearest interstate, both of North Carolina’s ports are at a disadvantage relative to their peers, although in the case of the Port of Wilmington, the margin of difference is small. The Port of Morehead City, however, is at a significant disadvantage to its peers in terms of landside highway access.
Through 2040, freight mobility through North Carolina’s highway network will rely on additional improvements that provide direct and timely truck access between inland freight nodes and facilities, including intermodal rail yards, manufacturing centers, agricultural areas, warehousing and distribution centers. While there is need for near term investment in specific “last mile” freight connections, highway improvements are driven by increased congestion resulting from the state’s anticipated population growth. Improvements to the state’s primary truck corridors, therefore, would be needed over time to provide for continued truck mobility through the next 30 years.
Interstate grade highway access is a critical infrastructure component for ports. Targeted investments along US 70, I-40, I-73/74 and US 74/76 would have the greatest effect in reducing trucking travel times within the state.
Figure 3. Truck Distance from NC Ports
Source: NCSPA, 2014
5 NC Mari time Strategy Study, AECom, June 26, 2012.
Page 19 of 49

Rail Competition
While North Carolina is served by an extensive rail network, freight rail service to and from North Carolina Ports is limited and each port site is served by a single rail carrier. CSX provides rail service to the Port of Wilmington while Norfolk Southern (NS) operates at the Port of Morehead City. Low historical rail freight volumes to both Wilmington and Morehead City have resulted in high per-unit rail costs, making rail transport less competitive as compared to truck transport within the state.
Intermodal Rail
The current addressable market for containers is limited by the lack of a reliable and cost competitive intermodal container service; the addressable container market is essentially limited to the state with the northernmost and southernmost borders and some of the larger urban areas oftentimes being better served by competitive ports. If there are no improvements to intermodal rail access from the Port of Wilmington, the Port will continue to see cargo that it could compete to attract move through other facilities in the Mid and South Atlantic region.
The surrounding business base, measured by employment in close proximity to the ports (within 300 miles), is the smallest for the North Carolina ports; each of the regional peer ports has a greater density of economic activity to generate trade. The ranking changes, however, at a broader 500-mile radius. Both the Port of Morehead City and the Port of Wilmington have larger markets compared to the Port of Savannah and the Port of Charleston. Only the Port of Norfolk’s market density exceeds that of North Carolina Ports at a 500-mile radius. This is important because container movement is optimized by rail movement when the distance traveled is greater than the distance a truck can travel in one day; North Carolina Ports would have a large market density if reliable and cost competitive intermodal service was available.
Without rail competition, there has never been an incentive for CSX to re-position equipment from other ports and re-deploy resources for container boxes to move via intermodal service to and from the Port of Wilmington. This lack of intermodal rail is not due to physical deficiencies, the CSX rail line in North Carolina is fully capable of moving double-stacked high cubed container boxes from the port in Wilmington to destinations on the CSX rail line. Customers have repositioned their intermodal cargo through other ports because reliable and cost competitive intermodal service is not available in North Carolina.
Page 20 of 49

ECONOMIC IMPACTS The Authority commissioned the Institute for Transportation Research and Education (ITRE) at N.C. State University to assess the Authority’s economic contribution of the state’s ocean ports. The project examined the current economic contribution of port services for the Port of Wilmington and the Port of Morehead City, both on a statewide and economic development region level.
The study findings reveal there is approximately $14 billion in annual economic contribution to the state’s economy constituted by goods moving through North Carolina Ports ($12.9 billion attributed to the Port of Wilmington and $1.1 billion attributed to the Port of Morehead City). The Ports directly and indirectly support more than 76,700 jobs across North Carolina; thus, deepwater port shipping is clearly a substantial economic factor for the state. The availability of the Port of Wilmington and the Port of Morehead City plays an important role in the supply chain decisions of companies with operations in North Carolina and companies considering locating manufacturing and distribution operations in North Carolina. The study documents the economic contribution of the existing deep water ports in North Carolina which foster economic development across the state. Further, the study examines a variety of the key components of economic contribution, including direct, indirect, and induced contributions to output or gross revenue, employee compensation, jobs, and tax collections. The direct contributions featured in the report were derived from commodity data, while IMPLAN® multipliers were used to generate estimates of the indirect and induced contributions of activity at the ports, as well as the analysis of tax contributions. IMPLAN® is a widely used software model for economic contribution studies of ports and other transportation assets.
Table 9. Overall Economic Contributions to the North Carolina Economy
2014
Output $14B
Jobs 76,700
Income $4.3B
Tax Collections $707M
Source: ITRE Economic Contribution Study, 2014
In the study period, June 1, 2013 to May 31, 2014, (the latest full-year dataset available), the Authority supported $4.3 billion in employee compensation for North Carolina workers. Taxes generated by economic activity through the Authority provide additional contributions to local communities and the state of North Carolina. An estimate of approximately $707 million in sales, property, corporate, and personal taxes was received by state and local governments due to activity supported by the Authority. The Port of Wilmington supported the collection of $226 million in county property taxes, while the Port of Morehead City supported $13 million. Together, the Authority resulted in the accumulation $355 million in sales tax collections across the state. Additionally, state corporate and personal taxes of over $113 million were collected due to activity supported by the Port of Wilmington and the Port of Morehead City.
Page 21 of 49
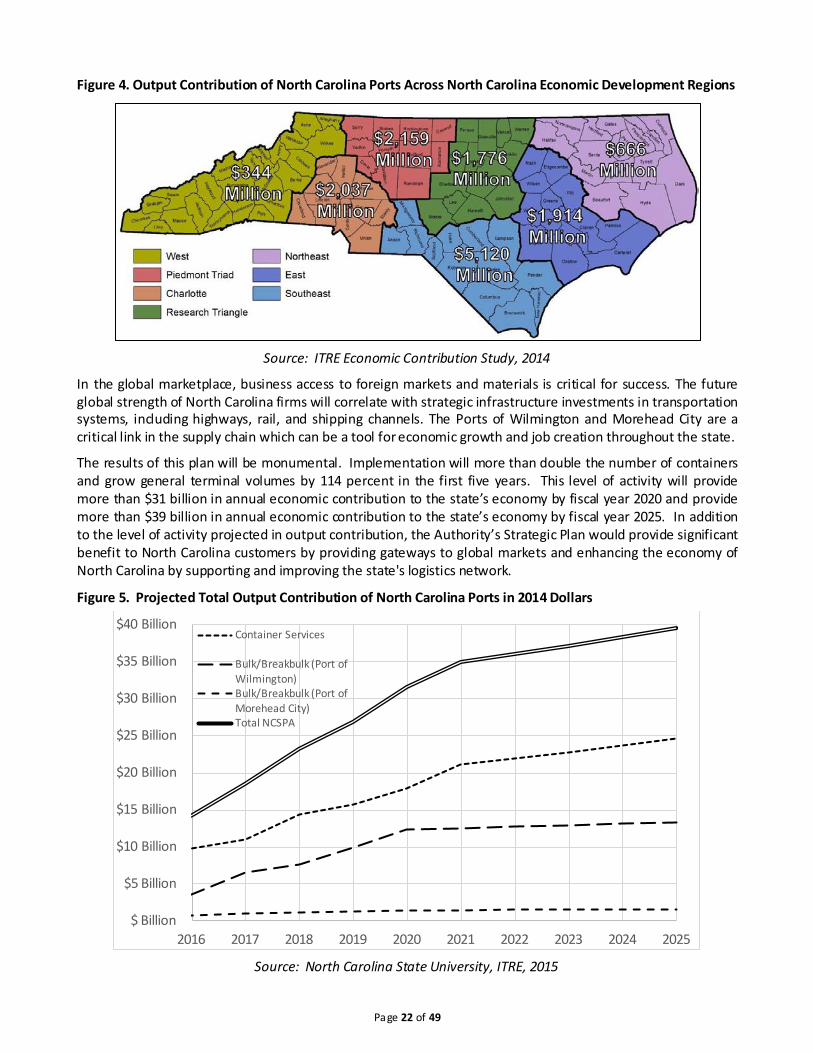
Figure 4. Output Contribution of North Carolina Ports Across North Carolina Economic Development Regions
Source: ITRE Economic Contribution Study, 2014
In the global marketplace, business access to foreign markets and materials is critical for success. The future global strength of North Carolina firms will correlate with strategic infrastructure investments in transportation systems, including highways, rail, and shipping channels. The Ports of Wilmington and Morehead City are a critical link in the supply chain which can be a tool for economic growth and job creation throughout the state.
The results of this plan will be monumental. Implementation will more than double the number of containers and grow general terminal volumes by 114 percent in the first five years. This level of activity will provide more than $31 billion in annual economic contribution to the state’s economy by fiscal year 2020 and provide more than $39 billion in annual economic contribution to the state’s economy by fiscal year 2025. In addition to the level of activity projected in output contribution, the Authority’s Strategic Plan would provide significant benefit to North Carolina customers by providing gateways to global markets and enhancing the economy of North Carolina by supporting and improving the state's logistics network.
Figure 5. Projected Total Output Contribution of North Carolina Ports in 2014 Dollars
Source: North Carolina State University, ITRE, 2015
$ Billion
$5 Billion
$10 Billion
$15 Billion
$20 Billion
$25 Billion
$30 Billion
$35 Billion
$40 Billion
2016 2017 2018 2019 2020 2021 2022 2023 2024 2025
Container Services
Bulk/Breakbulk (Port of Wilmington) Bulk/Breakbulk (Port of Morehead City) Total NCSPA
Page 22 of 49

APPENDIX 1. STRENGTHS, WEAKNESSES, OPPORTUNITIES AND THREATS Customer-focused employees coupled with streamlined operations and ongoing improvements like the deployment of a Terminal Operating System and Warehouse Management that provides valuable tools to the Authority’s customers delivers customer satisfaction. The Authority is known among its customers as having one of the high performing, lower-cost operations in the South Atlantic, a position that enables competitive pricing contributing to economic benefit and financial sustainability. A diversified portfolio of business at both port facilities further minimizes risk and provides financial strength and opportunity.
Terminal underutilization, undeveloped properties, opportunities for operational improvements and future technology upgrades provide ample capacity for expansion and growth at the Authority’s facilities while neighboring ports are struggling with congestion and long wait times, although they are finding ways to adapt and address these issues. North Carolina’s ports have space to expand and a lack of congestion at the terminals.
Internal Organizational Weaknesses
Operations generate revenue streams that are marginally sufficient to cover operating expenses and service debt, however, retained earnings after these obligations have been met are insufficient to fund the considerable major maintenance and asset preservation requirements of the facilities.
A lack of adequate infrastructure is an impediment to growth and development. Improvements to the supply chain outside of the port boundaries are critical, including economic development associated with manufacturing. Additional market intelligence and appropriate resourcing of the sales team would better inform and influence successful marketing efforts. Deficiencies in sailing frequencies and global trade lanes for containers, bulk and breakbulk will continue to restrain growth. Reliable and consistent intermodal service is a critical requirement to grow the container services.
Opportunities in the External Environment
Transhipment provides an opportunity to capture smaller ships suitable to the current channel at the Port of Wilmington (up to 6,600 TEU vessels) and would also address and lack of sailing frequency and trade lane availability. Hand in hand with vessel suitability, the identification of commodities/markets (grain, lumber, pork/poultry, tobacco, cotton) that are indigenous and can support trade volumes to and from the customer base in North Carolina coupled with growth in regions like South America provide market opportunities. Largely driven by private industry, emerging energies could become a large industrial presence in North Carolina that, with investment in infrastructure could benefit ports. While not currently an opportunity, re-shoring, or the concept of the return of manufacturing to the U.S. could boost these energy, transshipment and agriculture efforts.
A modern, scalable rail to ship (with storage) transload complex that could provide inbound and outbound access to a variety of bulk and breakbulk customers would be an ideal approach to providing a number of different commodities/customers customized solutions for complex supply chains. Additionally, a non-dedicated complex allows for multiple users, increasing the investment value.
Increased identification of customer needs that could be provided with expanded products and capabilities as well as logistics services for part, or all or part of a customer’s supply chain management is a service that could be leveraged to keep and grow business. Cross-functional skills of staff, coupled with additional sales resources with a focus on beneficial cargo owners and targeted market areas would likely improve and better direct marketing efforts. The current business environment focused on improved infrastructure to support port efforts and a statewide team of dedicated commerce and agriculture partners help to communicate the need for a thriving global gateway.
Page 23 of 49
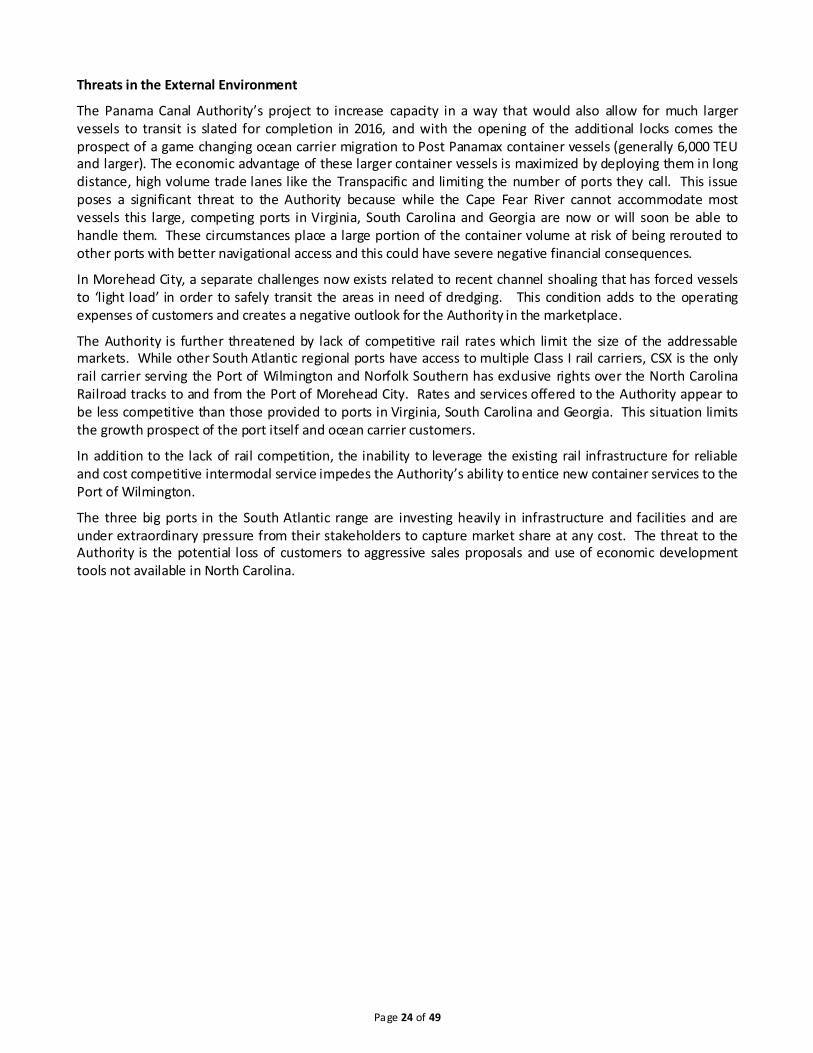
Threats in the External Environment
The Panama Canal Authority’s project to increase capacity in a way that would also allow for much larger vessels to transit is slated for completion in 2016, and with the opening of the additional locks comes the prospect of a game changing ocean carrier migration to Post Panamax container vessels (generally 6,000 TEU and larger). The economic advantage of these larger container vessels is maximized by deploying them in long distance, high volume trade lanes like the Transpacific and limiting the number of ports they call. This issue poses a significant threat to the Authority because while the Cape Fear River cannot accommodate most vessels this large, competing ports in Virginia, South Carolina and Georgia are now or will soon be able to handle them. These circumstances place a large portion of the container volume at risk of being rerouted to other ports with better navigational access and this could have severe negative financial consequences.
In Morehead City, a separate challenges now exists related to recent channel shoaling that has forced vessels to ‘light load’ in order to safely transit the areas in need of dredging. This condition adds to the operating expenses of customers and creates a negative outlook for the Authority in the marketplace.
The Authority is further threatened by lack of competitive rail rates which limit the size of the addressable markets. While other South Atlantic regional ports have access to multiple Class I rail carriers, CSX is the only rail carrier serving the Port of Wilmington and Norfolk Southern has exclusive rights over the North Carolina Railroad tracks to and from the Port of Morehead City. Rates and services offered to the Authority appear to be less competitive than those provided to ports in Virginia, South Carolina and Georgia. This situation limits the growth prospect of the port itself and ocean carrier customers.
In addition to the lack of rail competition, the inability to leverage the existing rail infrastructure for reliable and cost competitive intermodal service impedes the Authority’s ability to entice new container services to the Port of Wilmington.
The three big ports in the South Atlantic range are investing heavily in infrastructure and facilities and are under extraordinary pressure from their stakeholders to capture market share at any cost. The threat to the Authority is the potential loss of customers to aggressive sales proposals and use of economic development tools not available in North Carolina.
Page 24 of 49

APPENDIX 2. PEER PORT ANALYSIS Regional ports identified as peers to the Authority include Norfolk, Charleston, and Savannah. These peers were selected for evaluation and comparison based on the following factors:
Similar location in the southeastern U.S.: all of the ports selected are likely to directly serve North Carolina shippers and the emerging Piedmont Atlantic Megaregion (PAM). PAM is composed of core metropolitan areas, including Birmingham, Atlanta, and two in North Carolina – Charlotte and Raleigh-Durham.
All have interstate access to major North Carolina market areas without passing one of the other peer ports.
All are designated as Strategic Seaports. They are leading ports for North Carolina waterborne exports. They handle the same freight types as the North Carolina facilities, facilitating comparison.
The Port of Morehead City has a highly advantageous location that is closest to the ocean. Wilmington, by contrast, is comparable to the Port of Savannah in distant from the ocean and water depth. None of the regional peers with the possible exception of the Port of Norfolk can fully accommodate the largest new Post Panamax ships.
The peer ports identified for this study include Virginia, South Carolina, Georgia, and container cargo identified with an origin or destination of Caribbean and Central America moving through Port Everglades and Miami, Florida. Jacksonville, Florida has a similar profile and characteristics to the container facility at the Port of Wilmington, however, it was not included in the container addressable market review because currently North Carolina is a truck market. Table 10. Regional Peer Port Terminal/Port Characteristics
Characteristic Wilmington Morehead City Norfolk Charleston Savannah
Distance to sea buoy (miles)
26 4 18 16 20
Depth (maximum feet)
42
45
50 (with authorization to 55)
45 (harbor channel and
dockside)
Garden City: 42
Source: AECOM/URS team analysis, FAF 3.1 data, individual port web sites
Page 25 of 49

Table 11. Regional Peer Port Landside Characteristics
Characteristic Wilmington Morehead City Norfolk Charleston Savannah
Employment (300 miles)
9,835,746 11,299,091 25,709,948 13,763,843 15,884,074
Employment (500 miles)
41,704,522 41,900,520 50,527,138 33,299,436 29,043,452
Distance to interstate from gate
7.8 miles to I-40
111 miles to I-795
5.8 miles to I-264
2.5 miles to I-26
5.6 miles to I-95 from
Garden City; 10 miles to I-95; 1.5 miles
to I-516 from Ocean
Terminal
Rail access CSX service; In-port switching by Wilmington
Terminal Railroad;
Substantial rail car storage
NS service; In-port switching
by Carolina Coastal Railway;
Railroad scale; Substantial car
storage
CSX and NS service to
Hampton Roads; NS and CSX service to Norfolk via
Suffolk and the Commonwealth
Railway
CSX and NS service to Union Pier, Columbus Street, North
Charleston and Veterans; On-terminal rail
yards at Columbus St. and North Charleston
CSX and NS service to
Garden City and Ocean
Terminal; On-terminal ICTF at Garden City
Source: AECOM/URS team analysis, FAF 3.1 data, NCDOT rail maps, individual port web sites
Table 12. Regional Peer Port Operational Characteristics
Characteristic Wilmington Morehead City Norfolk Charleston Savannah
Military use Strategic Seaport
Strategic Seaport
Strategic Seaport
Strategic Seaport
Strategic Seaport
Hours of Operation
Container Terminal: M-F 7am -5:00 pm ; General cargo: M-F 7:30am to
3:30pm
General Terminal: M-F
8am - 4pm
Newport News: M-F 8am -
12pm; 1pm – 5pm
APMT: M-F 6am - 6pm
7am - 6pm; Saturday 8am – 5 pm (six month
trial)
GCT Gate 3: M-Th 7am - 6pm; F 7am– 5pm GCT
Gate 4: M-F 7am - 6pm
Saturday 8am – 12pm; 1pm –
5pm
Source: AECOM/URS team analysis, FAF 3.1 data, individual port web sites
Page 26 of 49

Table 13. Regional Peer Port Capital Project Funding
Capital Project Funding Status
North Carolina Virginia South Carolina Georgia
State Appropriations
(Project Specific)
Yes in the past, General
Appropriations and R&R fund, last
contribution was 2010
Yes in the past, last primary government
contribution was 2008 for rail
relocation/Craney Island
Yes in the past, most recently for land acquisition
in 2007.
Yes, through GO Bond issuance, also
through other capital contributions (no detail provided)
State Appropriations
(Regular)
No
Yes, from the Commonwealth
Transportation Trust Fund (4.2%) to fund
debt service and capital expenditures
No
No
Federal Yes, Port Security Grants
Yes, PSGP, emissions and ARRA
Yes, Port Security Grants, Heavy diesel engine replacement
program
Yes (no detail provided)
Other Some state grants for special
programs, such as FRISCI (Rail grants),
Environmental
Yes, from Component Unit
(VIT)
Received land from the
Charleston Naval Base
Redevelopment Authority in 2008
Yes, from local governments (no detail provided)
GO Bond(s) No
No
No
Yes (through the state of GA) - repaid
to the state as voluntary payments
(does not sit on balance sheet as long term debt)
Revenue Bond(s)
Yes Yes Yes Yes, but currently has $0 outstanding
Special Purpose (Conduit) Bonds
Yes (Bulk Grain Facility)
$0 outstanding $0 outstanding $0 outstanding
Capital Leases/Other
Debt
Yes Yes Yes Yes
Source: Interviews with peer ports, NCSPA
Page 27 of 49

Table 14. Regional Ports Capacity and Utilization
Wilmington Containers (TEU) Breakbulk (Tons) Bulk (Tons) Ro/Ro (units)
Terminal Capacity 600,000± 1,470,000 3,220,000 Unknown
2013 Throughput 268,049 324,173 2,947,121 0
% Utilization 44% 22% 91%^ N/A
Morehead City Containers (TEU) Breakbulk (Tons) Bulk (Tons) Ro/Ro (units)
Terminal Capacity 0 1,080,000 2,730,000 Unknown
2013 Throughput 0 221,436 1,588,739 0
% Utilization N/A 21% 58% N/A
Virginia Containers (TEU) Breakbulk (Tons) Bulk (Tons) Ro/Ro (units)
Terminal Capacity 3,630,000 6,820,000 Not available 320,000
2013 Throughput 2,223,532
3,360,600
N/A *Coal Loadings Not
Available
Not Available
% Utilization 61% 49% N/A N/A
South Carolina Containers (TEU) Breakbulk (Tons) Bulk (Tons) Ro/Ro (units)
Terminal Capacity 3,230,000 4,030,000 100,000 200,000
2013 Throughput 1,601,000 723,420 494,645 213,407*
% Utilization 50% 18% 495% 107%
Georgia Containers (TEU) Breakbulk (Tons) Bulk (Tons) Ro/Ro (units)
Terminal Capacity 4,500,000 7,440,000 2,110,000 1,070,000
2013 Throughput 3,033,727 2,452,230 2,666,954 636,942
% Utilization 67% 33% 126% 60%
Source: AECom Capacity Analysis, individual port web sites, NCSPA ±Could be expanded with capital investment, ^Achieves greater capacity through operational methods, *2012
data only available
Page 28 of 49

Table 15. Regional Peer Port Financial Data
Financial Data North Carolina Virginia South Carolina Georgia
Operating Revenues (in
millions, FY13)
44.30
352.30
140.40
292.60
Operating Expenses (in
millions, FY13)
39.50
367.80
124.10
214.30
Interest Expense (in millions,
FY13)
-3.90
-21.70
-1.70
0.30
Other Nonoperating
Income (Expense) (in
millions, FY13)
-0.10
41.40
-6.77
-44.90
Change in Net Position (in
millions, FY13)*
0.80
4.20
7.83
-44.60
Source: Individual port web sites, NCSPA *Non operating income/expense may include income from various sources, including receipt of grants or
dedicated state funds, as well as unusual or extraordinary expense items.
Table 16. Regional Ports Output Contribution Comparison
Source: North Carolina State University, ITRE, 2014
Page 29 of 49

Table 17: Regional Ports Employment Contribution Comparison
Source: North Carolina State University, ITRE, 2014
Page 30 of 49

APPENDIX 3. MEGAREGIONS With a low cost of living and high quality of life, the southeastern US is projected to realize significant growth in the coming years. In particular, the Piedmont Atlantic Megaregion, anchored by the metropolitan areas of Atlanta, Birmingham, Raleigh-Durham, and Charlotte, is projected to see its 2010 population of 17 million realize 78 percent growth by 2050.
Figure 6. Emerging US Mega-Regions
Source: Regional Plan Association, www.america2050.org/maps/
During the next 40 years, demographers and economists anticipate that the majority of the nation's population growth and economic expansion is expected to occur in ten or more emerging megaregions. Megaregions are characterized by a group of metropolitan economies that share 1) environmental systems and topography, 2) infrastructure systems, 3) economic linkages, 4) settlement patterns and land use, and 5) shared culture and history.
Two of North Carolina’s largest metropolitan areas anchor the northern end of this sprawling megaregion, expected to become one of the nation’s largest consumer and labor markets. The evolution of an urban network dominated by 360 or more metropolitan areas into a more consolidated one dominated by ten large megaregions is an important change in considering how to move freight in the future. Much of the Piedmont Atlantic megaregion is inside North Carolina’s addressable market.6
6 NC Mari time Strategy Study, AECom, June 26, 2012.
Page 31 of 49

APPENDIX 4. PANAMA CANAL EXPANSION
The ongoing expansion of the Panama Canal will allow more and larger (deeper draft, wider, and of greater capacity) ships to pass through this key trade link between Asia and the U.S. east coast. Scheduled for completion in early 2016, the Panama Canal expansion comprises the addition of a larger set of locks that will allow for transit Neo Panamax ships that have nearly three times the carrying capacity of current Panamax ships. Perhaps more importantly, the new parallel locks will significantly increase the capacity of the Canal.
With larger locks and greater capacity, the expanded Panama Canal has the potential to enhance the competitiveness of the all-water route between Asia and the U.S. Gulf Coast and East Coast; however, there has been much debate regarding the amount of Asia-Pacific cargo that will be diverted from U.S. and Canadian west coast ports through the Canal. Gulf coast and east coast marine ports stand to improve their share of the Asia-Pacific trade volumes if they can provide adequate navigation depth, in-port handling capacity, and fast, reliable rail and highway connections from North American production centers (for exports) to consumer markets (for imports).7
Figure 7. Container Vessels Capable of Transit through the Panama Canal
Source: adapted from www.globalsecurity.org
7 NC Mari time Strategy Study, AECom, June 26, 2012.
Page 32 of 49

APPENDIX 5. GLOBAL VESSEL FLEET
Containerships
The trend in the container shipping industry in recent decades has been toward the use of increasingly larger vessels. This trend is driven both by economies of scale and the availability of infrastructure to these larger ships, such as Post Panamax and super Post Panamax vessels.
Figure 8: Cross Section of Existing (left) and New (right) Locks of the Panama Canal
Source: Lloyds Register
The focus today on the Panama Canal results from the dominance of Asia in the U.S. container trade. With a potential trade shift to India and other parts of Asia, the Suez Canal may become a more significant consideration in the size of vessels that serve the U.S. east coast. The Suez Canal has no locks, and therefore no vessel length restrictions. Ships with a maximum draft of 68.9 feet and beam of nearly 200 feet can navigate the Suez Canal.
Looking beyond size restrictions imposed by the Canal, operational costs will drive the size of vessel serving the southeastern U.S. An evaluation of vessel operational costs, including fuel and crew costs as well as canal tolls, indicates that a 12,000 TEU vessel carrying about 55 percent of its total container capacity would have the same per-TEU operating costs as a Panamax 4,000 TEU Panamax vessel that is 80 percent full. Before putting these larger vessels into service, shipping lines will need to be confident that they can achieve at least this level of utilization.
Figure 9: Cumulative Probability of Actual Containership Draft
Source: Moffatt & Nichol from Port of Long Beach data on actual vessel draft
Page 33 of 49

With much focus on design draft of these larger containerships, it is important to remember that vessels typically operate at 80 percent to 90 percent of their design draft, so a vessel with 45-foot design draft may draw significantly less water as loaded. For example, the actual draft of 90 percent of the 8,000 TEU vessels calling on the Port of Long Beach (which has no depth restriction) had an actual draft of 42 feet or less. Those same vessels would require four feet of gross underkeel clearance, or an operating channel depth of 46 feet.
Figure 10: U.S. Army Corps of Engineers Channel Depth Allowances
Source: USACE, Hydraulic Design of Deep-Draft Navigation Channels, Engineer Manual Figure 6-17
Channel depths are typically described by Mean Low Low Water Depth (MLLW), which establishes the minimum navigational depth at low tide. Operational depths may be greater due to tide variation, advance maintenance dredging and dredging tolerances below the authorized depth.
Stakeholder discussions with shipping lines serving North Carolina and surrounding states indicate that 8,000 TEU vessels will become the “workhorse” of U.S. container trade. While these vessels have a design draft of 45 feet to 49 feet and would theoretically require an authorized channel depth of up to 53 feet, ocean carriers concur that an operational depth of 45 feet to 47 feet would meet demand for container vessels likely to call on the U.S. East Coast8.
Bulk and Breakbulk Vessels
Lloyd’s Register projects a global use of three primary vessel sizes for bulk transport: Panamax (60,000 to 80,000 dead weight tonnage [dwt] capacity), Handymax (50,000 to 60,000 dwt), and Capesize (greater than 80,000 dwt) vessels. The larger (170,000 to 180,000 dwt) Capesize vessels are generally liquid bulk or dry bulk vessels used for Asia, Australia and Europe routes. Use of Handymax bulk vessels offers flexibility to serve a variety of bulk markets. Most berths at North Carolina’s ports can accommodate the popular Panamax and smaller Handymax bulk vessels.9
8 NC Mari time Strategy industry workshop with shipping lines – held August 30, 2011. 9 NC Mari time Strategy Study, AECom, June 26, 2012.
Page 34 of 49
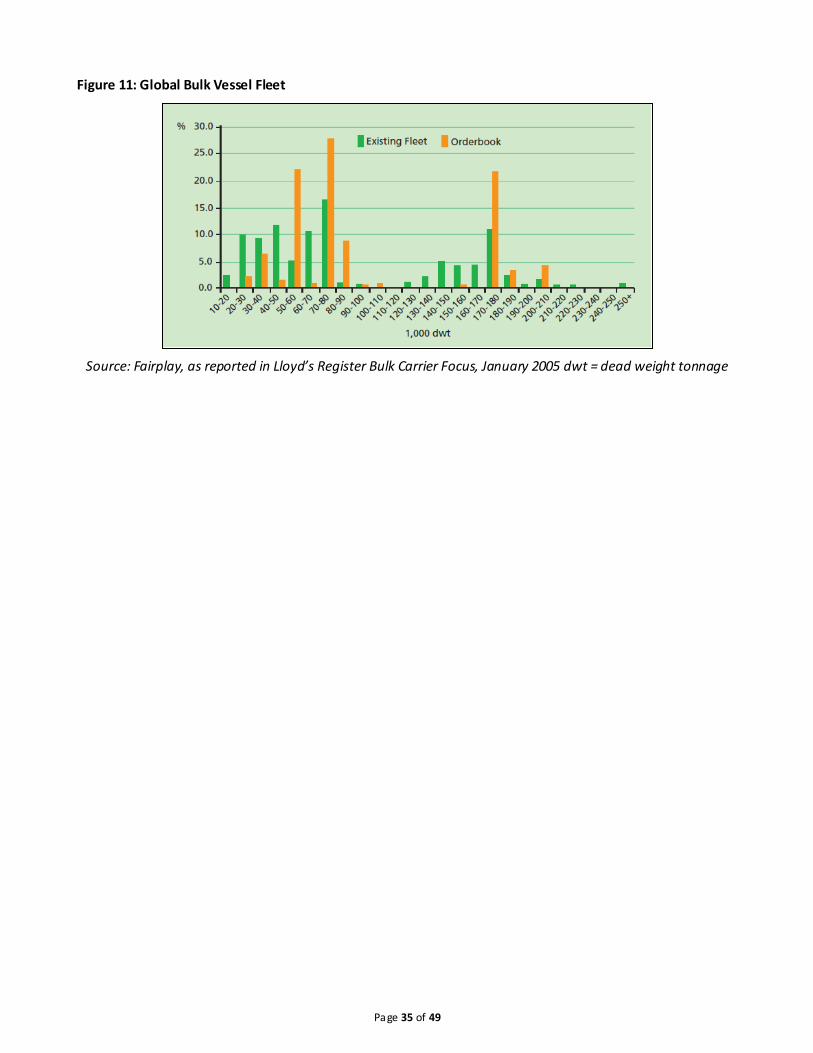
Figure 11: Global Bulk Vessel Fleet
Source: Fairplay, as reported in Lloyd’s Register Bulk Carrier Focus, January 2005 dwt = dead weight tonnage
Page 35 of 49

APPENDIX 6. DISTRIBUTION CENTERS AND INLAND PORTS Distribution Centers
Regional distribution nodes, including logistic centers and inland ports, provide facilities for intermodal transfers, transloading, and warehousing for waterborne goods. At present, the vast majority of maritime-transported goods going through North Carolina logistics facilities moves in or out of seaports of other states, most notably the ports of Norfolk, Savannah, and Charleston. Reasons cited for why North Carolina ports are not used to a greater extent include insufficient channel depth for serving larger oceangoing vessels, as well as inland congestion choke points, including in the areas of Charlotte and Greensboro. Thus, in the near term, public and private inland port facilities in North Carolina are likely to largely handle significant cargo volumes that move through seaports of other states; however, growing volumes at North Carolina inland ports could bring about a critical mass that spurs justification of channel enhancement and other infrastructure efficiencies at North Carolina seaports.
Inland Ports
One of the driving purposes of an inland port is to accommodate numerous functions of shipping that do not have to take place at or in close proximity to the water’s edge. In addition to consolidation of cargos, inland ports may include warehousing, cross-docking (unloading goods from incoming truck or rail units and loading them directly into outbound units with little or no storage in between), light manufacturing, truck and rail servicing, and storage of chassis and containers. With the U.S. chassis provisioning model changing, as ocean carriers get out of this aspect, involvement in furnishing chassis may also be considered.
The aggregation of transportation assets and logistics services at a single location has the potential to reduce cost-to-market for manufacturers and shippers with similar transport needs. Availability of value-added services (warehousing, distribution, handling, repackaging and consolidation) may be seen as essential. Some of the most successful inland ports in other states, such as the Virginia Inland Port in Front Royal, Virginia serve as U.S. Customs-designated ports of entry and offer a full range of customs functions to customers.
Page 36 of 49

APPENDIX 7. COMMODITY ANALYSIS Automobiles
Major manufacturing and assembly plant site-selection criteria require proximity to deepwater port facilities with global service coverage. Automotive plants generate thousands of jobs and lay a foundation for further economic growth. Typically, third party auto processors will operate near an auto processing plant because auto manufacturers depend on auto processing facilities which provide services to the vehicles prior to shipment which results in indirect economic benefits.
Considerations when siting a major auto assembly plant include site development, transportation infrastructure, susceptibility to natural disasters, proximity to competitors and vendors, labor market conditions, and economic impact studies, sites must be examined for their current value and future impact to the company’s operations. Finally, incentives can be an aggressive tool used by a state to attract a project to an area, but there is also an increasing demand for the right kind of labor for the right price. Automotive plants are looking to Southern states for a number of reasons: low wage rates, lower cost utilities, non-unionized labor, less expensive land, freight costs, lower taxes, and market share redistribution from traditional domestic manufacturers to Asian and European companies who manufacture in the south10.
Agriculture
North Carolina's agricultural industry, including food, fiber and forestry, contributes $78 billion to the state's economy, accounts for more than 17 percent of the state's income, and employs 16 percent of the work force. North Carolina is one of the most diversified agriculture states in the nation. The state's 52,200 farmers grow more than 80 different commodities, utilizing 8.4 million of the state's 31 million acres to furnish consumers a dependable and affordable supply of food and fiber. North Carolina produces more tobacco and sweet potatoes than any other state and ranks second in Christmas tree cash receipts and the production of hogs and turkeys. The state ranks seventh nationally in farm profits with a net farm income of over $3.3 billion11.
While neighboring ports handle the much of North Carolina’s agriculture exports, recent infrastructure improvements to rail lines and roads, along with infrastructure upgrades at the Port of Wilmington and the Port of Morehead make North Carolina’s ports more attractive for agricultural exports. Recent activity and improvements related to agriculture includes a new development for a cold storage facility at the Port of Wilmington and two new wood pellet projects (one in Wilmington and the other in Morehead City).
According to forest-industry experts at N.C. State University, U.S. production of wood pellets is expected to increase from 3 million tons just four short years ago, to nearly 10 million tons by 2015. With its vast amount of renewable and sustainable wood fiber sources, North Carolina is an attractive location for wood biomass plants. Together, the new wood pellet projects are expected to generate more than 2.4 million tons of volume at the port facilities over the next five years.
Agriculture - Lumber (Dimensional, Chips and Logs)
There are several distinct markets in the import breakbulk lumber segment. These segments are derived from the various geographic origins (Europe, Central and South America, Asia) as well as the specific products (dimensional lumber, fencing lumber, plywood and veneers, etc.). The European import lane is dominated by high grade dimensional lumber from the large sawmills in northern Europe. The South American import market is primarily low grade lumber for fencing or similar applications. The Asian import market is comprised of various veneers and low grade material, such as plywood.
Most of the breakbulk segments are delivered or carried by liner carriers that have specific contracts with the shipper. The liner carriers calling at North Carolina Ports are influenced by the shipper and less by the carrier.
10 http://www.ginovus .com/the-automotive-industry-and-site-selection-issues-in-north-america/ 11 http://www.ncagr.gov/stats/general/overview.htm
Page 37 of 49

The influence on the carriers by the Authority is primarily the inducement of lower dockage rates based on volume. The Authority normally enters into specific service agreements with the shipper based on handling and wharfage charges dependent on volume. These discounts are either tiered, more volume moves to lower rates, or rates lower than tariff based on total tonnage shipped or guaranteed.
Building slump continues to result in closed mills and consolidation of producers. Imports may continue based on species supply of superior quality and quantity. Pricing pressures limit growth, however. Vida and Klausner USA continue to import small volumes of lumber. SGlobal Prime Wood and other shippers remain keen to induce Gearbulk and other carriers to call the east coast with their fence lumber. However, during the recession shippers shifted imports to smaller quantities with container carriers due to low demand and attractive container rates. Key objectives are to maintain customer contact and develop programs to move products to outside storage and identify warehouse utilization opportunities and if necessary, create an exit strategy for these cargoes. Specific plans include maintaining client relations to understand changing service requirements for shippers and vessel operators and developing client solutions with specific value added service opportunities.
The Port of Wilmington has an ongoing log export program. IVP Forest Products, Inc. has established an operation on a leased area of the port to receive logs, sort and classify, debark, and stuff/load into ocean containers. Anticipated volume this year was approximately 100 FEUs/week. Annual volume targets in following years are 200 FEUs/week, subject to market conditions. In addition to the stuffing of ocean containers, IVP Forest Products exports logs as breakbulk cargo. This option is dependent on U.S. Department of Agriculture fumigation requirements, permits to fumigate large volumes of breakbulk cargo and the economics of the operations.
North Carolina lumber is both an import and an export commodity with a variety of types of lumber commodities. For lumber imports, slow growth is expected over the next three years tied mainly to the housing and construction market. Growth potential will also be affected by strength of U.S. dollar to the Euro and other foreign currencies. The life cycle state of lumber is mature, and the current general import trend is slightly upward with improved construction market in U.S. The confidence in market from lumber importers remains weak despite improved conditions over the past 1.5 years. Trend-line will follow U.S. construction market and domestic production choices from U.S. sawmills. Some uncertainty to traditional North Europe import lumber exists due to sawmill capacity being added in North Carolina and Florida by Klausner (Enfield, N.C.). The capacity may also produce opportunities for export volumes.
Historically, the major lumber importers have segmented the U.S. East Coast into three general geographic areas; Northeast (Baltimore/Philadelphia), Mid-Atlantic (Wilmington), Southeast (Savannah). The Port of Wilmington has dominated the Mid-Atlantic. Increased competition is likely to come from both Norfolk and Charleston in the future.
Agriculture - Grain
As much as one third of all grain produced in the U.S. moves into export. In 2011 approximately $42.3 billion worth of grains and oilseeds were exported from the United States via this system. It is expected that over 100 million metric tons, of primarily U.S. corn, soybeans and wheat, were handled by the U.S. grain export system in the calendar year 2012. Annual volumes and value vary widely based on pricing, currency values, U.S. market access, and global supply and demand for the commodities produced in the United States. Approximately 61 percent of the U.S. export grain shipments departed through the U.S. Gulf region in 2013. Only 3 percent of the grain inspected for export moved via an Atlantic coast port12. See Figure 12 for the distribution of grain inspections for export by U.S. port region in 2013.
12 http://www.ams.usda.gov/AMSv1.0/getfile?dDocName=STELPRDC5107646
Page 38 of 49

Figure 12. Distribution of Grain Inspections for Export by U.S. Port Region (1,000 metric tons) in 2013
Source: Grain Inspection, Packers and Stockyards Administration/USDA
The U.S. grain export system is a large, diverse, and evolving industry including public, private and cooperatively owned and managed facilities and trading entities. The industry must constantly seek added efficiencies, mitigate the enormous risks associated with international trade in a mature and politically charged environment, compete and trade with subsidized and state controlled organizations, upgrade export facilities and streamline logistical capabilities in order to sustain the export of U.S. agricultural products. Exporting grain is both a competitive and a capital-intensive industry. Since the margin of profit to be earned from moving a ton of grain can be quite small, exporters depend upon moving large volumes very quickly. They seek to achieve an economy of scale that lowers their average fixed costs per unit of volume handled, provides operating flexibility, increases bargaining power in chartering for shipping, and improves the services they can provide worldwide.
U.S. export grain marketing is essentially a private sector system; with the exception of humanitarian food aid, the U.S. Government does not directly engage in the day-to-day marketing of grains and oilseeds. Grains and oilseeds are sold by competing private-sector merchants using predominantly private facilities. When the U.S. Government acts to export for international food assistance it contracts for commodity and logistics with the private-sector system.
The following drivers frame global supply and demand for agricultural products and the competition to meet demand among supplier countries early in the 21st century:
• Trade liberalization and opening of markets, in particular the reduction of trade barriers through global progress in World Trade Organization agreement and implementation.
• Political Conflicts, Economic and Social Stability.
• The rise of questionable sanitary and phytosanitary issues and anti-dumping actions, replacing tariffs and quotas as the trade barriers of choice
• Population growth and heavy urbanization in developing countries,
• Growth in consumer income and of the middle class in emerging markets,
• Rising demand for high-value products, especially new, specialty products,
• Stagnant aggregate demand in high-income, developed countries,
• Global debate over the value, safety, and morality of biotechnology and other technologies,
• Relative cost of production among international competitors, and
Page 39 of 49

• The competitiveness of marketing infrastructure13.
The vast majority of grain exports are carried to the Gulf by way of the Mississippi River. The U.S. river system permits a very efficient and economical barge transportation system for the export of grain from the heart of the U.S. grain belt. This is supplemented by seven class one railroads that have and continue to make massive capital investments in their rail systems and feeder shortline railroads that serve all major U.S. ports. United States commercial grain companies have made major expenditures in high speed through-put elevators to load trains and shuttle trains and to unload the timely at export grain elevators14. Low cost barge transportation, favorable rail rates, local grain production, and advantageous geographic location—all of which have contributed to the Gulf ports' current preeminence in grain exporting — add up to a very favorable outlook and dominance of the market15.
Of the U.S. grain exported via the Atlantic coast, the major U.S. South Atlantic port regions are identified as Virginia and Georgia. Currently, there are no planned export elevators in the U.S. South Atlantic, despite a growing number of them in the Pacific Northwest and Gulf regions. However, transloading facilities have emerged along the West, Gulf and Atlantic Coasts, and in the Midwest near the Chicago rail terminals; in the case of grain exports, it involves grain moving among and between trucks or railcars and vessels, including both inland or coastal barges and deep-water ships. The grain can be loaded into shipping containers and placed on the vessel16. While transloading may seem like an ideal Atlantic coast solution, the main reason it has been slow to take hold is the extra cost per container (and a lack of containers) makes the operation uncompetitive for months at a time. In order to profitably ship grain in containers, the shipper must have a reliable supply of containers, a consistent grain source and an inexpensive backhaul opportunity.
Agriculture - Woodpulp
The export woodpulp market is comprised of two distinct segments, merchant pulp and fluff pulp. Merchant pulp is used in making paper and other paper related products such as KLB and is derived from both hardwood and softwood fiber. Fluff pulp is used in diapers and hygiene products and derived exclusively from softwood fiber.
Wood pulp is exported through the Port of Wilmington. This commodity has moved through the port for more than 30 years. The primary exporter of pulp is International Paper with substantial volumes also moving with Domtar and Weyerhaeuser. Over the years port operations have provided excellent service to International Paper and the pulp exporters of North Carolina in handling their baled pulp. International Paper remains the largest breakbulk customer to the Authority as well as one of the largest container exporters.
Traditionally, fluff pulp has moved via ocean containers rather than breakbulk. The product is highly sensitive to damage because of its applications in diapers and sanitary products. In early 2011 International Paper and Grieg Star Shipping initiated a breakbulk service for ‘fluff rolls’ of pulp for delivery to Rotterdam. This service added roughly 50000 tons of fluff pulp volumes to the breakbulk portfolio in the Port of Wilmington that continued to export to Europe, the Mediterranean and Asia. The Authority’s Business and Economic Development and Operations departments worked closely in changing operating patterns, cleanliness of the warehouses, communications and data transmission. In addition, the Authority has purchased a warehouse management system that was justified on the increased revenue from the ‘fluff pulp’ and the cross functional platform with other commodities.
Occasionally, other shippers of wood pulp will utilize the services of the vessel operators and move their product through the Port of Wilmington. There also exists an import pulp market into the U.S. East Coast. This
13 http://naega.org
14 http://www.globalaginvesting.com/downloads/files/United-States-Grain-Transportation-Outlook.pdf 15 https ://archive.org/stream/transportinguswh305hutc/transportinguswh305hutc_djvu.txt 16 http://uni tedsoybean.org/wp-content/uploads/2013/07/Panama-Canal-Expansion-Impact-on-US-Agricul ture.pdf
Page 40 of 49

market is comprised of low quality merchant and fluff pulp manufactured in South America. Primary fiber input is Eucalyptus.
The export merchant pulp market continues to decline globally as society in developed nations becomes more ‘paperless’. Some growth in certain geographic areas will persist where developing nations continue to use more paper, such as China. It is important to note market growth in the Asia region will not likely translate to growth in the breakbulk sector. This is due to low container rates in this trade-lane which will attract shippers away from breakbulk to the container mode.
The fluff pulp market is experiencing a global growth trend of 4 percent per year as reported by International Paper. The growth is driven by increased penetration of the diaper market in developing countries (China is currently only 20 percent penetrated), as well as aging populations in many developed nations. General consensus among shippers is that fluff pulp capacity will be added to U.S. Southeast in next three years. It is important to note market growth in the Asia region will not likely translate to growth in the breakbulk sector. This is due to low container rates in this trade-lane which will attract shippers away from breakbulk to the container mode. The breakbulk trend lines for fluff pulp into North Europe and the Mediterranean will also be affected by container rates in these trade lanes as shippers look for the most cost effective routing into these slower growth markets. Export merchant pulp is in decline overall. Export fluff pulp is in a growth cycle.
Primary port competition for export breakbulk pulp is currently the Port of Savannah. The volume in play for competition with the Port of Savannah originates in mills that are farther inland and rely on rail. The truck market volumes are well established and entrenched to the geographically optimal port options (i.e. Riegelwood to Wilmington). North Carolina should expect increased competition from Charleston and Norfolk in coming years.
There also exists a high degree of competition between modes of ocean transport, breakbulk versus ocean container. Rates in the container trade will affect shippers’ modal decisions and create pressure on the breakbulk carriers. If North Carolina cannot fully serve the container trade, the Authority will lose a portion of the market share to ports north and south with more container trade capacity and offerings. The largest export woodpulp competitors are the Port of Brunswick, Georgia and the Port of Savannah.
The import pulp market has been dominated by two port gateways on the east coast; Jacksonville and Baltimore. Essentially all of the volumes are three primary shippers (Cenibra, Ekman, and Fibria). Philadelphia secured the Fibria business from Baltimore in 2014. Baltimore is still the competitor with the largest portion of the addressable market.
Energy
With the largest offshore wind resource on the U.S. East Coast, North Carolina has a unique and energetic microclimate resulting in an impressive estimated capacity factor for offshore-wind energy off the North Carolina coast17.
Increasing demand from Europe for renewable fuel is changing the landscape of the forestry industry. By-products of timber harvesting - the tops and limbs and other residues that are unsuitable for the sawmilling and lumber industries are milled, dried and processed to create wood pellets. These wood pellets can then be used for supplement or completely replace coal as the fuel source used to fire boilers of electric power generation plants. According to forestry experts at N.C. State University, U.S. exports of pellets are expected to grow from three million tons a year in 2009 to ten million tons by 2015 in support of the European requirement to reduce its carbon footprint. The Port of Wilmington and the Port of Morehead City have new wood pellet export facilities in development that together will export an identified 2.4 million tons of wood pellets annually from North Carolina in 2020.
17 http://www.energync.net/about-us/governors-panel-on-offshore-energy
Page 41 of 49

There are also a number of other potential emerging energy opportunities that require more long term study and planning. These energy opportunities present challenges or changing market dynamics that may require resolution prior to investment. These energy sectors include off shore oil, natural gas, solar energy and biomass. Currently, natural gas does not have regional or local component to leverage; likewise, both solar and biomass are solely domestic products. Compressed natural gas is a domestic product, but could be a source of income for the Authority given the number of trucks that access the port. Oil and liquid natural gas are highly capital intensive commodities and would require more infrastructure (including pipelines) than is currently available, in addition to the significant community concerns they would raise. Breaking into these new markets would require significant private capital and high profile champions in addition to an exceptionally well-planned and rational statewide strategy. These energy industries operate in regions that have invested heavily and would present heavy competition.
Rubber
Natural rubber is imported to the U.S. for tire manufacturing from southeast Asia, Central America, and West Africa, with more than 90 percent of the total market for imported natural rubber comes from origins in southeast Asia. The smaller volumes of African and Central American rubber are currently all imported via ocean container. 100 percent of the breakbulk market for natural rubber to the U.S. southeast originates in southeast Asia, primarily Indonesia.
Currently the breakbulk import rubber market is dominated by two carriers: Pacific Lloyd Line (PACC) and Wallenius Wilhelmsen Lines (WWL). PACC transports rubber to two ports in the U.S.; Morehead City and New Orleans. WWL transports rubber into Savannah and Newport News.
The Port of Morehead City continues to be a leader in the importing of natural rubber. Goodyear drives the business with Michelin, Bridgestone and Yokohama filling out the vessels. There are occasional shipments by the traders, but infrequent. PACC continues to add on a surcharge for the Morehead City call, driving a competitive edge to the limit. Key objectives for maintaining market share include customer contact and development of programs to grow the tonnage amounts. This includes specific plans for entering into wharfage, handling, and other value add services rates and terms for a multi- year period with Goodyear, Michelin and Bridgestone. North Carolina Ports can leverage the multiyear agreements with the shippers to increase wharfage and value add service rates with PACC.
The current trend for rubber is slightly up. This is primarily due to increased demand as U.S. economy continues to improve. Additionally, in the last two years there have been significant investments new or expanded plants made or planned in U.S. southeast by major tire manufacturers. South Carolina alone has had three. These investments could drive additional breakbulk service with current or alternative carriers. The life cycle state of rubber is mature.
The ports of Norfolk, Charleston, and Savannah are all significant competitors. Charleston in particular will continue to push both the carriers and shippers for breakbulk service. All of the major shippers also utilize container mode for ocean freight which provides significant competition to the Authority and the breakbulk mode in general.
Cold Storage
Cold storage refers to the outsource warehousing of perishable goods kept in a climate-controlled environment. North Carolina is a major hub for global exportation of refrigerated pork and poultry products and a major player in the protein production export business. A new cold storage distribution center service would provide global market benefits to NC’s agricultural industry sectors (export) and food distribution sector (imports).
North Carolina leads the way nationally in total protein production between pork and poultry industries. Although North Carolina is not number one in either industry, North Carolina is number two in pork and turkey, fifth in poultry and added together makes North Carolina the largest in the US for total protein. North
Page 42 of 49

Carolina is also number one in production of sweet potatoes and a lead producer of seafood. These products along with worldwide demand for increasing amounts of food especially protein in the growing middle class of China, India, Russia, the Middle East and Africa will drive the demand for exporting North Carolina products.
For the Authority, a cold storage facility helps generate increased container space each week on the existing container carriers calling at the Port of Wilmington and enhances the ability to market and recruit additional container and break-bulk carrier services, serving existing and /or new global trade-lanes. Additional benefits include the opportunity for job growth, including the creation of a U.S. Department of Agriculture Inspection center, which facilitates and supports efforts to recruit additional cargo carrier services.
Steel
The breakbulk steel market includes both imports and exports and is comprised of many different product segments. These segments range in size, shape, and chemistry based on their different applications. Examples of these various product segments include: coils of sheet, coils of wire rod, structural, pipe, tube, sheet pile, billets, ingots, bars, rebar, etc. The storage and handling requirements for each product may vary. Typically higher value finished products require inside storage while lower value unfinished products can be stored outside.
Steel moves both inbound and outbound to/from U.S. in all major trade-lanes. These markets and relationships within them are complex. It is common to have four parties involved in an import sales transaction for some steel goods; including the producing mill, a foreign and domestic trading firm, as well as the end user of the product. The logistics decisions and associated liabilities for domestic freight, ocean freight, and port services will vary among these different groups depending on the terms of the sale. The Authority has maintained a steady book of steel business in both terminals with the CSX and NS which import 100% of their foreign rail through North Carolina’s ports. Additional accounts include Posco America and HSM.
Overall steel imports have been in a growth cycle in recent years. This is in large part due to over capacity in certain regions, such as China. Lower prices for iron ore and other raw materials has driven the growth in steel production. The other affect of increased production abroad is that export growth has been held in check for domestic steel producers. Both buyers and exporters will weigh the costs of buying or selling abroad vs. buying or selling domestically. As noted, the current trend is driving imports.
Roll on / Roll off
The Roll on / Roll off (RoRo) market is primarily driven by the import and export of vehicles. In addition, rolling stock machinery and equipment also contribute significant volumes in these trades. While infrastructure needs to handle RoRo cargoes are minimal from a port perspective, the auto manufacturers depend on auto processing facilities which provide services to the vehicles prior to shipment. Typically, third party auto processors will operate within port facilities. Good rail connectivity and service is typically very important for a thriving vehicle and machinery RoRo business. RoRo facilities also require a large acreage footprint. Primary utilization of RoRo cargoes is handled by private terminal operators at the Port of Wilmington. Morehead City RoRo services are primarily focused on military moves through the port.
Several opportunities to attract additional RoRo services to both ports continue to develop. These opportunities are buoyed by expansion of the Deere/Hitachi facility in Kernersville, Caterpillar’s Cary office, Makino machine tools that currently move through Lambert’s Point, Siemens wind turbines and natural rubber going through Norfolk. Expansion of facilities or the construction of new facilities in proximity to the ports can provide opportunities to induce carriers to call. The Authority should execute a targeted marketing outreach effort to commercial RoRo carriers like Wallenius, NYK, ACL/Grimaldi, etc. The Authority also should engage Bahri and cargo principals such as Caterpillar to develop commercial support for this RoRo service, which will provide access into the Red Sea and Persian Gulf regions.
Page 43 of 49

Heavy-Lift / Project Cargo
According to the Journal of Commerce, the market for breakbulk and heavy-lift ocean cargo is emerging from the doldrums it experienced in 2013. Although a backlog of global industrial projects carried the heavy-lift sector through 2012 and construction of new pipelines and wind farms in the U.S. filled inbound multipurpose breakbulk vessels in 2013, demand largely dried up. But the picture is brightening, and the market is positioned for significant recovery in 2014 - 2015.
The excitement in the project cargo business is the sheer number of chemical, petrochemical, refining and other projects being planned for construction along the Gulf Coast from New Orleans to the Mexican border in addition to energy-related projects being built in Montana and the Dakotas to handle the growth in natural gas fields being developed by hydraulic fracturing.
Houston is at the center of all the new developments. Energy and petrochemical companies have announced plans to invest $35 billion in plants lining the banks of the 52-mile Houston Ship Channel and may invest almost twice that as the gas industry develops further. Many of the investments are geared to retrofit those plants, which once processed petroleum imports for the domestic U.S. market, to refine domestic natural gas into products for export. Heavy-lift carriers also are benefiting from investments by foreign steelmakers in the U.S
Beyond the U.S., the outlook for the global project cargo market also appears to be picking up. Offshore oil fields are being developed in Africa, Southeast Asia and South America. Although the market for breakbulk cargo has dwindled in countries such as Brazil, which imposes high protectionist taxes on imported steel and forest products, this has spurred investment by global steelmakers to build plants in the markets they serve.
The timing for construction of all these projects comes as the breakbulk and heavy-lift carriers come to the end of the multipurpose vessel orders they placed in better economic times, when it looked like global projects would keep these new vessels filled. The multipurpose vessel order book begins to decline precipitously in 2015, so as demand increases, fewer new vessels are being delivered. Supply and demand came into equilibrium in the latter half of 2014, and vessel space may not be enough to meet demand for all these new projects. This will lift freight rates, which have been flat over the last year and plunged many ship operators into the red. Rates may continue to be under pressure at the beginning of 2015, but in the second half when volume accelerates and delivery of new multipurpose vessels tails off, the sector will recover more rapidly than others18.
The heavy lift segment in the Authority’s market is comprised of several consistent shippers, primarily exporting Power Generation (Siemens in Pineville, N.C., GE in Greenville, S.C., Toshiba Westinghouse – Nuclear, GE Hitachi – Nuclear, Babcock and Wilcox – Nuclear, Transformers: Siemens, Waukeshaw, Smit). Project cargoes are handled by the Authority or private terminal operators at the direction of the shipper. It is often directed by size and weight of the cargo, allowing for ships' gear direct to railcar or truck, which removes the Ports from the transaction, or requiring specialized gear that is supplied by the stevedore or terminal operator.
Heavy lift crane capacity exists in numerous competing ports including Norfolk, Baltimore, Philadelphia, Jacksonville, Savannah, and Charleston (with the heaviest lift) which likely would result in a highly competitive environment with a high cost threshold for new entry.
The growth trend for heavy lift and project cargo is limited volumes with heavy competition; project cargo has a relatively flat trend. The largest competitor is Charleston which enjoys good rail connectivity to GE Greenville; the Charleston heavy lift crane is well-positioned to attract business. Currently, there is poor rail clearance in Wilmington and recent potential Morehead City volumes were incented to Lambert’s Point by Norfolk Southern.
18 http://www.joc.com/mari time-news/international -freight-shipping/breakbulk-heavy-lift-market-poised-resurgence_20140122.html
Page 44 of 49

Value-added / Other Services
Operationally, the Authority has unique attributes that may be used to create additional value. Value added services within the structure of the port, specifically with the ability to provide services executed with high customer satisfaction and competitive price could be attractive and compelling for port customers.
Warehousing services could include handling cargo between storage facilities and modes of inland transportation as well as custom inventory management and control services for the beneficial cargo owner. By leveraging the Authority’s role as terminal operators, the Authority can extend its line of services into distribution and warehousing to attract new business and grow organically with existing warehouse clients.
The Authority may further extend its service offerings by developing transloading capabilities. Transloading cargo is not a new service, but one that is growing at an accelerated pace in response to a surging market for bulk material. Typically, transloading involves moving bulk material from one mode of inland transportation to another; however, today transloading often refers to loading bulk material into containers. At the Port of Wilmington, transloading is viewed as a potential substitute for traditional, at port intermodal container services and a strategy for building base-load volume that may motivate CSX to provide intermodal container service to and from the terminal. As with the extension of warehouse services, transloading offers a way to increase volume and revenue for the Authority through organic and new business opportunities.
Development of a permanent valued added service like a modern, scalable rail to ship (with storage) transload complex or bulk supercenter could provide inbound and outbound access to a variety of bulk and breakbulk customers. This would be an ideal approach to providing a number of different commodities/customers customized solutions for complex supply chains. By blending the benefits of shipping by rail and local/short haul trucking, transload facilities can serve customers who may not be located on a freight railroad or need expanded warehousing. Transloading works for a variety of commodities (including finished and unfinished goods, food products, lumber, woodpulp and paper, metals, building materials, and a variety of packaged bulk commodities) including special shipments that cannot travel their entire route by road. A non-dedicated complex allows for multiple users, increasing the investment value. A well-partnered bulk concept with multi-modal components and an outstanding business case could potentially be eligible for a federal funding partnership like U.S. Department of Transportation’s Transportation Investment Generating Economic Recovery (TIGER) grants.
Page 45 of 49

APPENDIX 8. PORT OF WILMINGTON The Port of Wilmington is located approximately 26 miles from the open sea on the Cape Fear River. Currently it has a channel depth of 42 feet Mean Low Low Water (MLLW). The port has nine berths with approximately 6,800 linear feet of wharf and provides cargo storage space for container, bulk, and breakbulk operations. Figure 19 shows an aerial of the Port of Wilmington.
Figure 14. Port of Wilmington Aerial
Source: Bing Maps
The Port handles containers, dry bulk and breakbulk. The Port of Wilmington handled 268,049 twenty-foot equivalent units (TEUs) in FY 2013 and 252,369 TEUs in FY 2014. Across all classes of freight, the port handled nearly 1.95 million tons in that same year. Containerized goods accounted for about 52 percent of the total; bulk freight accounted for about 41 percent of the total and breakbulk accounted for the remaining 7 percent. The recent global economic recession and U.S. housing decline has negatively affected the volumes of construction-related commodities, including breakbulk exports and imports handled by the ports. Across all commodities, the Port of Wilmington generated more than $32.6 million in operating revenues in fiscal year 2013 and more than $27.1 million in operating revenues in fiscal year 2014.
Figure 15. Bulk, Breakbulk, and Container Volumes Handled at Port of Wilmington (FY 2001-2014)
Source: NCSPA, 2014
-
1
2
3
4
5
6
2001 2002 2003 2004 2005 2006 2007 2008 2009 2010 2011 2012 2013 2014
Mill
ions
TOTAL CONTAINER TONNAGE
TOTAL BREAKBULK TONNAGE
TOTAL BULK TONNAGE
Page 46 of 49

Among the largest facilities at the Port of Wilmington is its container terminal, which has a gross area of approximately 85 acres, 6,000 twenty-foot ground slots (TGS) for container storage, and provides area for chassis storage. The container yard is primarily served by a single berth of approximately 1,250 feet at the southern-most end of the container terminal and a 400-footlong portion of the berth to the north, which has been recently rebuilt to be able to accommodate 100-foot gauge dock cranes.
The existing four 100-foot gauge cranes have an outreach of 18 containers and can load/unload container vessels up to about 8,000 TEUs as shown in Figure 11. The container terminal is supported by a 12-acre chassis storage yard, which lies outside the gate and across the street the port’s south gate container entrance.
The existing gate that provides truck access to the container yard is located in the southeast end of the terminal, but extends inside the middle of the container storage area. All containers are handled by mobile reach stackers (RS) inside the yard.
Page 47 of 49

APPENDIX 9. PORT OF MOREHEAD CITY The Port of Morehead City is located approximately four miles from the Atlantic Ocean and has a 45-foot MLLW deep channel from the sea buoy. It has nine berths with approximately 5,500 feet of wharf and handles both breakbulk and bulk cargo at its existing facilities. Radio Island, which is part of the Port of Morehead City, is located across the Newport River from the port and includes approximately 150 acres of land suitable for port industrial development. Figure 22 shows the location of the Port of Morehead City and Radio Island.
Figure 16: Port of Morehead City Aerial
Source: Bing Maps
The Authority handles only bulk and breakbulk goods at the Port of Morehead City. The Port of Morehead City generated nearly $10.8 million in operating revenues and handled at total volume of 1,810,174 million tons during FY 2013. The Port of Morehead City’s operating revenues grew to more than $11.3 million in FY 2014, handling 1,783,375 million tons.
Phosphate and sulfur products represent 68 percent of total tonnage handled by the Port of Morehead City in FY 2014. Breakbulk commodities handled include natural rubber, for which the Authority provides value-added inventory management and warehousing services on the wharf. Like at the Port of Wilmington, the slowdown in the construction industry has affected the volumes of import lumber, aggregate, and other construction materials handled at the facility.
Page 48 of 49

Figure 17: Bulk and Breakbulk Volumes Handled at Port of Morehead City (FY 2001-2014)
Source: NCSPA, 2014
The Port has an authorized channel depth of 45 feet at Radio Island, an adjacent facility, and the ocean channel has a 47-foot depth in the approach to the port. The ocean channel is relatively short compared to competing ports at only four miles. There is no air draft restriction at Morehead City. Three Morehead City berths have depths of 45 feet, but the six remaining berths offer only 35 feet to 41 feet depths19.
Road accessibility to Morehead City is a concern because trucks must pass through the middle of Morehead City to reach the port. This route during the summer months, with the tourism associated with the Crystal Coast region, makes the more than six-miles from the port to beyond the intersection of NC 24, which is the only way out of Morehead City to access U.S. 70, difficult. NCDOT has a number of initiatives underway to mitigate this conflict. The Gallants Channel Bridge project that is now underway will provide an alternative route to US 70. Until the Northern Carteret Bypass and Havelock Bypass are completed, this link would not be a viable alternative route to and from Morehead City. Interstate 95 (I-95) is approximately 120 miles from Morehead City via US 70 and I-795. After construction of the Gallants Channel Bridge, there could be an opportunity to follow NC 101 but this roadway is a rural two-lane road and would not effectively reduce travel time. In the meantime, all traffic would have to continue through Morehead City.
The Port is served by Norfolk Southern (NS), which runs three trains per week into the port. Rail freight passes through the center of Morehead City with numerous at-grade crossings that slow train speeds and create numerous traffic bottlenecks throughout the day. Carolina Coastal Railroad Company provides switching service within the port limits.
The U.S. military makes 10 to 15 calls through the port each year. The Port’s roll-on/roll-off (Ro/Ro) ramp is used for loading/unloading of vehicles and equipment and personnel and small barracks on property used by military personnel when they are working with cargo.20
19 Figure 1.2 Summary Overview of MHC Facilities in the “Port Business Case Study” 20 NC Mari time Strategy Study, AECom, June 26, 2012.
-
1
1
2
2
3
3
2001 2002 2003 2004 2005 2006 2007 2008 2009 2010 2011 2012 2013 2014
Mill
ions
TOTAL BREAKBULK TONNAGE
TOTAL BULK TONNAGE
Page 49 of 49