Strategic Managementd2oqb2vjj999su.cloudfront.net/users/000/094/891/819...Apple’s divisions...
29
APPLE Strategic Management Central Washington University Management 489: Kayla Horning, Mary Orthmann, Brady Rusch and Carolyn Vining Abstract Identifying Apple’s Critical Problem, Analyzing and Evaluating Business Practices and Implementing an Action Plan
Transcript of Strategic Managementd2oqb2vjj999su.cloudfront.net/users/000/094/891/819...Apple’s divisions...

APPLE Strategic Management
Central Washington University Management 489: Kayla Horning, Mary Orthmann, Brady Rusch and Carolyn Vining
Abstract Identifying Apple’s Critical Problem, Analyzing and Evaluating
Business Practices and Implementing an Action Plan
1 | P a g e
MGT489 Team # _1_ Assignment #3 – [Apple] Due Tuesday, 03-04-14
Members: Carolyn Vining, Kayla Horning, Mary Orthmann, Brady Rusch
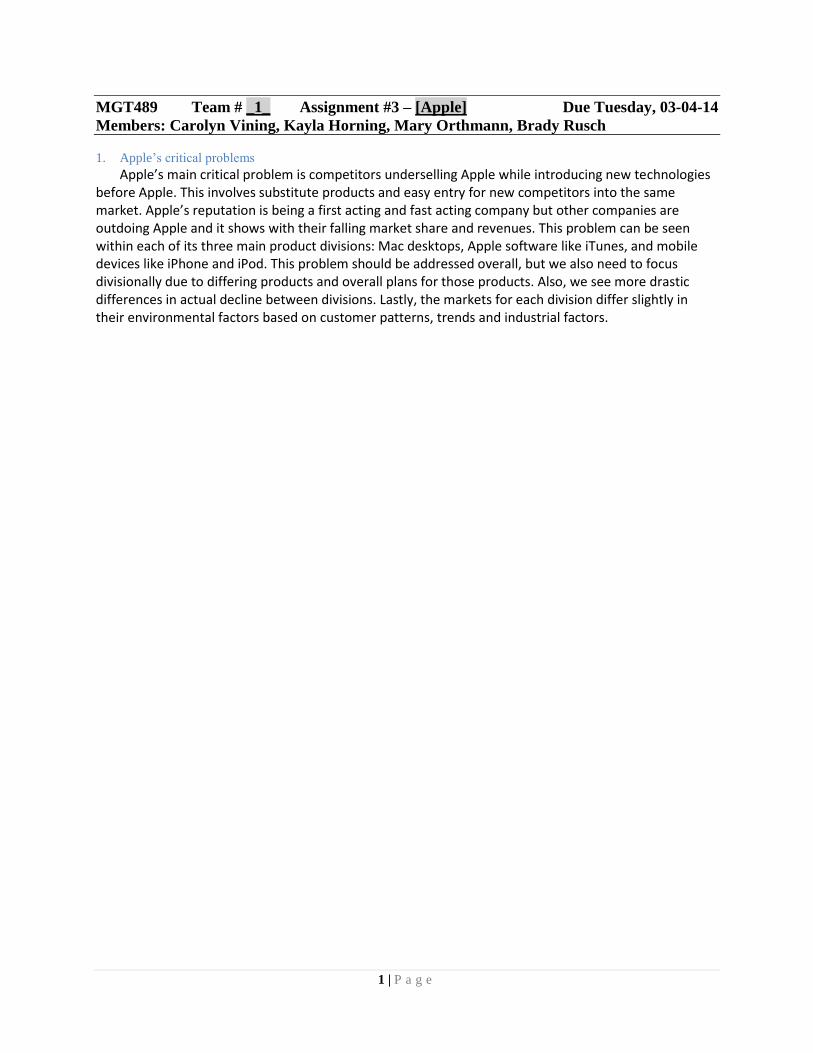
1. Apple’s critical problems
Apple’s main critical problem is competitors underselling Apple while introducing new technologies before Apple. This involves substitute products and easy entry for new competitors into the same market. Apple’s reputation is being a first acting and fast acting company but other companies are outdoing Apple and it shows with their falling market share and revenues. This problem can be seen within each of its three main product divisions: Mac desktops, Apple software like iTunes, and mobile devices like iPhone and iPod. This problem should be addressed overall, but we also need to focus divisionally due to differing products and overall plans for those products. Also, we see more drastic differences in actual decline between divisions. Lastly, the markets for each division differ slightly in their environmental factors based on customer patterns, trends and industrial factors.

2 | P a g e
2. External analysis
Table 1 Opportunities Threats Rationale
Factors General Environment Analysis
Demographic
Interactive customer experiences x
Apple believes in creating a retail environment where customers can be educated rather than just sold to
Customer Centricism x
Apple is customer centric allowing for testing before purchase decisions are made, customers have begun to demand this
Cannibalization of own products
x Because of the fast paced nature of Apple's updates, it is very possible to cannibalize existing products
Sociocultural
Celebrates Diversity x
Apple appeals to a wide variety of cultural backgrounds more effectively than competitors
Physical Environment
Plugged in Way of Life x
Customers are adapting a plugged in lifestyle always looking for convenient computing sources
Technological
Staying Relevant
x Apple's products are fast acting and set technological trends but as of lately they are being undercut
Increasing Technology in Schools x
There are many opportunities with schools to provide their technology and kick start education
The iTunes Store generated a total of $9.3 billion in net sales during 2013, a 24% increase from 2012 x
Apple can ride this increase in sales to push for a continuing increase in the following year
cloud music services x
Apple's cloud music services provide an easy way to access music from any source
Economic
Profit margins affected greatly by fluctuations in price of components
x
Apple holds a higher price point with their technology which can affect their profits if customers look for low price provider
Business Seasonality
x Depending on the seasons, business can spike up or down for specific products
Poor economic conditions affect demand of the products
x
Poor economic conditions shrink customer disposable income so Apple products are left out of decisions
Global
3 | P a g e
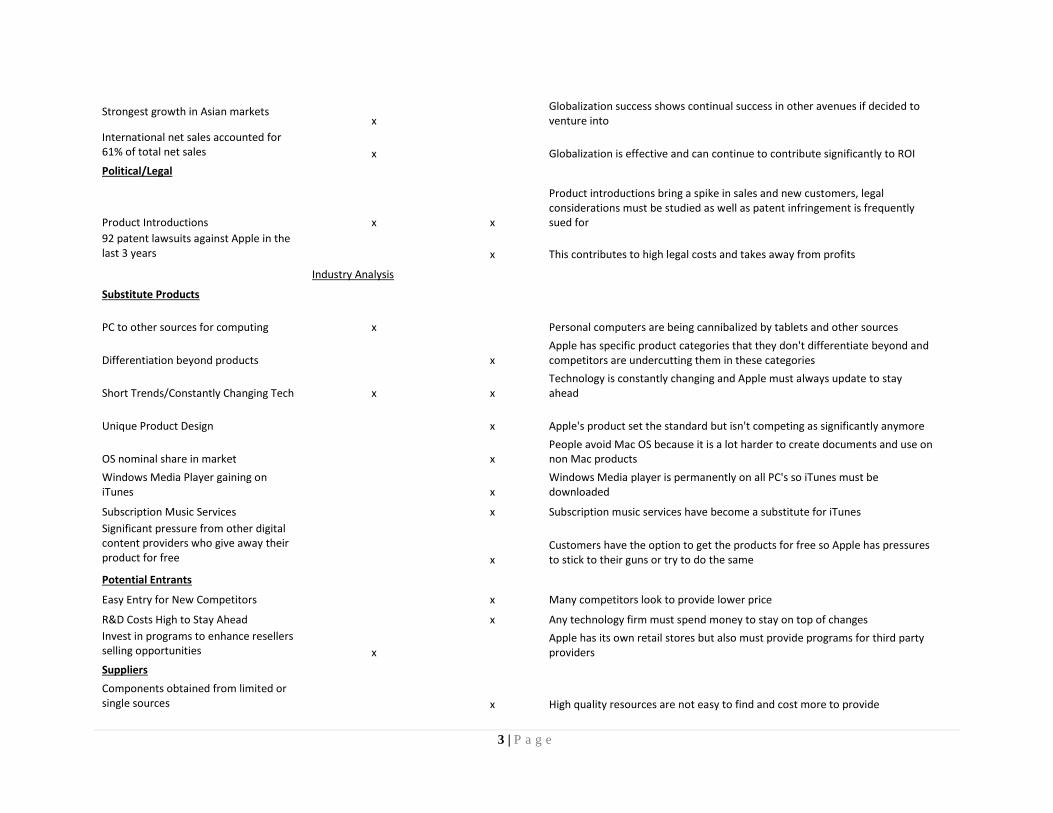
Strongest growth in Asian markets x
Globalization success shows continual success in other avenues if decided to venture into
International net sales accounted for 61% of total net sales x
Globalization is effective and can continue to contribute significantly to ROI
Political/Legal
Product Introductions x x
Product introductions bring a spike in sales and new customers, legal considerations must be studied as well as patent infringement is frequently sued for
92 patent lawsuits against Apple in the last 3 years
x This contributes to high legal costs and takes away from profits
Industry Analysis
Substitute Products
PC to other sources for computing x
Personal computers are being cannibalized by tablets and other sources
Differentiation beyond products
x Apple has specific product categories that they don't differentiate beyond and competitors are undercutting them in these categories
Short Trends/Constantly Changing Tech x x Technology is constantly changing and Apple must always update to stay ahead
Unique Product Design
x Apple's product set the standard but isn't competing as significantly anymore
OS nominal share in market
x People avoid Mac OS because it is a lot harder to create documents and use on non Mac products
Windows Media Player gaining on iTunes
x
Windows Media player is permanently on all PC's so iTunes must be downloaded
Subscription Music Services
x Subscription music services have become a substitute for iTunes
Significant pressure from other digital content providers who give away their product for free
x
Customers have the option to get the products for free so Apple has pressures to stick to their guns or try to do the same
Potential Entrants Easy Entry for New Competitors
x Many competitors look to provide lower price
R&D Costs High to Stay Ahead
x Any technology firm must spend money to stay on top of changes
Invest in programs to enhance resellers selling opportunities x
Apple has its own retail stores but also must provide programs for third party providers
Suppliers
Components obtained from limited or single sources
x High quality resources are not easy to find and cost more to provide
4 | P a g e
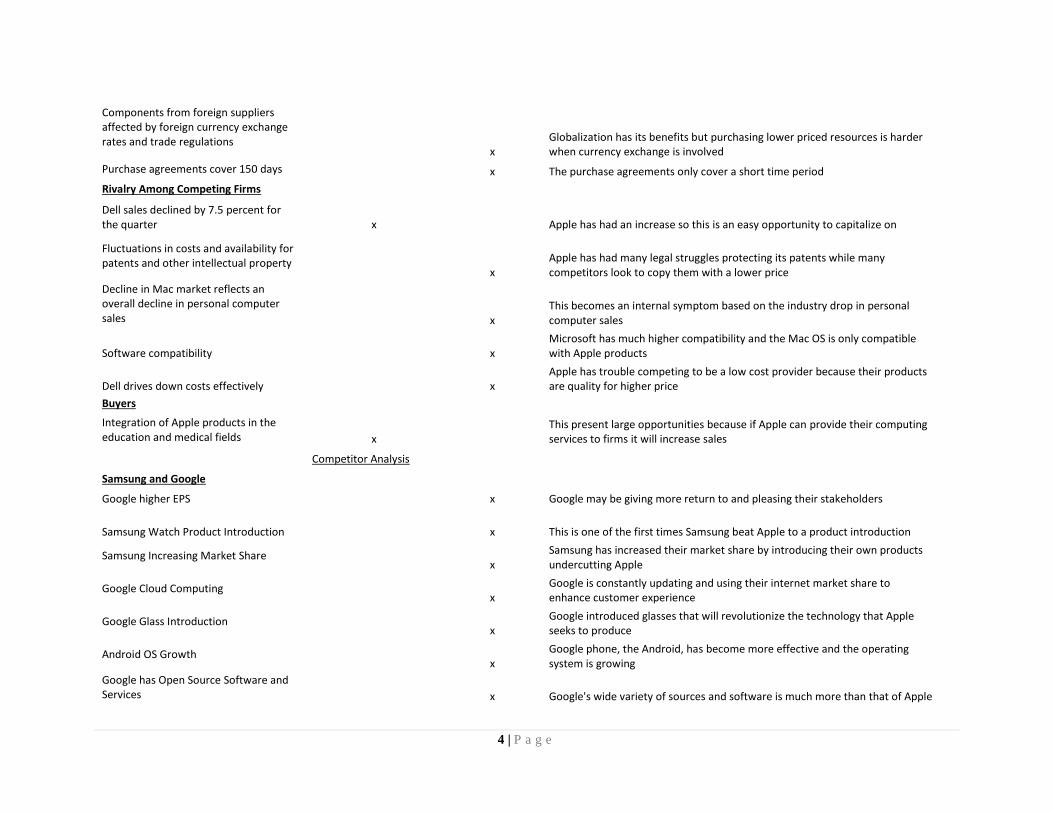
Components from foreign suppliers affected by foreign currency exchange rates and trade regulations
x
Globalization has its benefits but purchasing lower priced resources is harder when currency exchange is involved
Purchase agreements cover 150 days
x The purchase agreements only cover a short time period
Rivalry Among Competing Firms
Dell sales declined by 7.5 percent for the quarter x
Apple has had an increase so this is an easy opportunity to capitalize on
Fluctuations in costs and availability for patents and other intellectual property
x
Apple has had many legal struggles protecting its patents while many competitors look to copy them with a lower price
Decline in Mac market reflects an overall decline in personal computer sales
x
This becomes an internal symptom based on the industry drop in personal computer sales
Software compatibility
x Microsoft has much higher compatibility and the Mac OS is only compatible with Apple products
Dell drives down costs effectively
x Apple has trouble competing to be a low cost provider because their products are quality for higher price
Buyers
Integration of Apple products in the education and medical fields x
This present large opportunities because if Apple can provide their computing services to firms it will increase sales
Competitor Analysis
Samsung and Google Google higher EPS
x Google may be giving more return to and pleasing their stakeholders
Samsung Watch Product Introduction
x This is one of the first times Samsung beat Apple to a product introduction
Samsung Increasing Market Share
x
Samsung has increased their market share by introducing their own products undercutting Apple
Google Cloud Computing
x
Google is constantly updating and using their internet market share to enhance customer experience
Google Glass Introduction
x
Google introduced glasses that will revolutionize the technology that Apple seeks to produce
Android OS Growth
x
Google phone, the Android, has become more effective and the operating system is growing
Google has Open Source Software and Services
x Google's wide variety of sources and software is much more than that of Apple
5 | P a g e
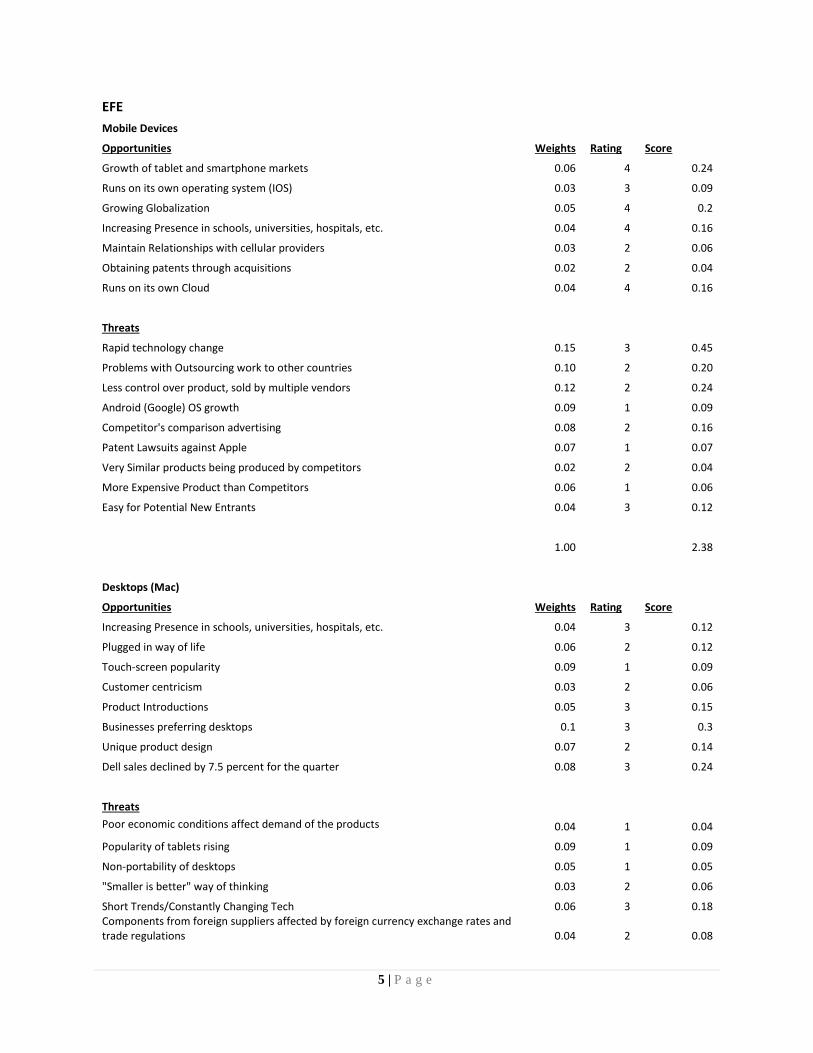
EFE Mobile Devices Opportunities Weights Rating Score
Growth of tablet and smartphone markets 0.06 4 0.24
Runs on its own operating system (IOS) 0.03 3 0.09
Growing Globalization 0.05 4 0.2
Increasing Presence in schools, universities, hospitals, etc. 0.04 4 0.16
Maintain Relationships with cellular providers 0.03 2 0.06
Obtaining patents through acquisitions 0.02 2 0.04
Runs on its own Cloud 0.04 4 0.16
Threats Rapid technology change 0.15 3 0.45
Problems with Outsourcing work to other countries 0.10 2 0.20
Less control over product, sold by multiple vendors 0.12 2 0.24
Android (Google) OS growth 0.09 1 0.09
Competitor's comparison advertising 0.08 2 0.16
Patent Lawsuits against Apple 0.07 1 0.07
Very Similar products being produced by competitors 0.02 2 0.04
More Expensive Product than Competitors 0.06 1 0.06
Easy for Potential New Entrants 0.04 3 0.12
1.00
2.38
Desktops (Mac) Opportunities Weights Rating Score
Increasing Presence in schools, universities, hospitals, etc. 0.04 3 0.12
Plugged in way of life 0.06 2 0.12
Touch-screen popularity 0.09 1 0.09
Customer centricism 0.03 2 0.06
Product Introductions 0.05 3 0.15
Businesses preferring desktops 0.1 3 0.3
Unique product design 0.07 2 0.14
Dell sales declined by 7.5 percent for the quarter 0.08 3 0.24
Threats Poor economic conditions affect demand of the products 0.04 1 0.04
Popularity of tablets rising 0.09 1 0.09
Non-portability of desktops 0.05 1 0.05
"Smaller is better" way of thinking 0.03 2 0.06
Short Trends/Constantly Changing Tech 0.06 3 0.18 Components from foreign suppliers affected by foreign currency exchange rates and trade regulations 0.04 2 0.08

6 | P a g e
Decline in Mac market reflects an overall decline in personal computer sales 0.1 2 0.2
Dell drives down costs effectively 0.07 1 0.07
1
1.99
Software (iTunes) Opportunities Weights Rating Score
Cloud music services 0.05 4 0.2 The iTunes Store generated a total of $9.3 billion in net sales during 2013, a 24% increase from 2012 0.1 4 0.4
Staying Relevant 0.09 3 0.27
Invest in programs to enhance resellers selling opportunities 0.05 2 0.1
Digital album downloads popularity 0.08 3 0.24
iTunes gift cards 0.11 4 0.44
iTunes exclusives 0.06 4 0.24
Threats Software compatibility 0.07 2 0.14
OS nominal share in market 0.1 1 0.1
Windows Media Player gaining on iTunes 0.06 2 0.12
Subscription Music Services 0.05 2 0.1
Fee Based Support Services 0.05 2 0.1 Significant pressure from other digital content providers who give away their product for free 0.07 1 0.07
Illegal music download sites 0.06 1 0.06
1
2.58
For the EFE matrix, we compared Apple’s 3 main divisions: mobile devices, desktops (Mac), and software (iTunes). Two of the divisions received below average total weighted scores. These two divisions were mobile devices with a score of 2.38 and desktops (Mac) with a score of 1.99. A score of 2.5 is about average, so anything below that is not responding well to the threats they have encountered, and similarly are not capitalizing on the opportunities they have. Mobile Devices score of 2.38 and Desktops score of 1.99 clearly shows that both of these divisions are doing quite poorly according to their respective total weighted scores under the mark of 2.5. However, despite two of Apple’s divisions scoring poorly in the EFE, Apple’s third division, software (iTunes), received an EFE score of 2.58, slightly above the average. Although, it is in fact above average, it barely made the mark and Apple will need to focus on raising its Software performance as well.
CPM
Apple Samsung Google
Critical Success Factors Weight Rating Weighted Score
Rating Weighted Score
Rating Weighted Score
Advertising .07 2 0.14 4 0.28 3 0.21
Market Share .08 4 0.32 3 0.24 2 0.16
Financial Position .06 4 0.24 3 0.18 2 0.12
Product Reliability .12 4 0.48 2 0.24 3 0.36
Consumer Loyalty .08 4 0.32 3 0.24 2 0.16
Customer Service .13 4 0.52 2 0.26 3 0.39
E-Commerce .05 3 0.15 2 0.10 4 0.20

7 | P a g e
Global Expansion .08 3 0.24 4 0.32 2 0.16
Price Competitiveness .02 1 0.02 4 0.08 3 0.06
Research & Development .14 4 0.56 2 0.28 3 0.42
Supplier Relations .10 1 0.10 3 0.30 2 0.20
Patent Availability .07 2 0.14 4 0.28 3 0.21
Total 1.00 3.23 2.80 2.65

8 | P a g e
3. Internal analysis
Table 2 Internal Factors Strengths Weaknesses Rationale
Management First Mover Company x
They are always setting the standard and have built a reputation for doing so
Functional Structure x
This allows for open lines of communication and easy flow between departments
Goals are current and well defined x
Apple understands why they exist and what their goals are in regards to their short and long term business
Finance/Accounting Revenue Increase of 52 percent x
Positive diagnosis of company's actions
Net Income Increase of 70 percent x
Even with costs, company is seeing an increase in their actual profits.
Direct Channels (30%) and Indirect Channels (70%) of Net Sales x
Decent Spread through both channels classifying them as effective
Earnings per share decrease by 10.33%
x This affects stockholder confidence and actual investments if they are getting the return they desire
Poor financial performance during downtime
x When Apple is stagnant in their innovation, the financial condition they are in is low
Profit margins higher than competing firms x
In the end Apple has a higher profit they can pull in when all other factors are supporting them
Marketing
Direct Contact Selling x
Personable customer interactions help customers make the best educated decision and feel cared for
Willing to pay more for sales personnel to promote a knowledgeable staff x
This is a good investment as we can see in increases in sales
Decrease in sales when new products are not launched
x
Apple always runs the risk of not launching a product due to different factors which will break a certain trust in customers
Placement of company stores in high traffic locations x
Placement of stores is vital to appeal to the right customers at the right times
Management Information Systems
iWork vs. Microsoft Office
x Microsoft Office has a higher market share
Dependence upon third party software providers
x This is always a risk because you have to be held by their effectiveness and if they fail, you fail
Research and Development
9 | P a g e
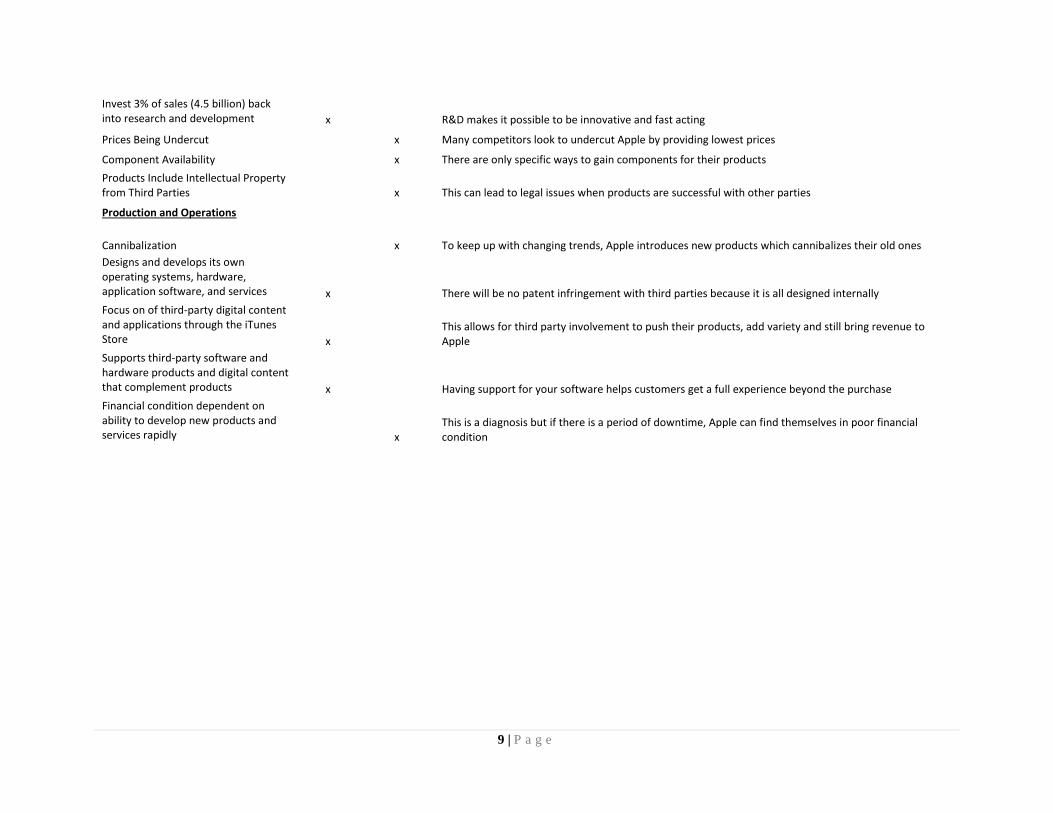
Invest 3% of sales (4.5 billion) back into research and development x
R&D makes it possible to be innovative and fast acting
Prices Being Undercut
x Many competitors look to undercut Apple by providing lowest prices
Component Availability
x There are only specific ways to gain components for their products
Products Include Intellectual Property from Third Parties
x This can lead to legal issues when products are successful with other parties
Production and Operations
Cannibalization
x To keep up with changing trends, Apple introduces new products which cannibalizes their old ones
Designs and develops its own operating systems, hardware, application software, and services x
There will be no patent infringement with third parties because it is all designed internally
Focus on of third-party digital content and applications through the iTunes Store x
This allows for third party involvement to push their products, add variety and still bring revenue to Apple
Supports third-party software and hardware products and digital content that complement products x
Having support for your software helps customers get a full experience beyond the purchase
Financial condition dependent on ability to develop new products and services rapidly
x
This is a diagnosis but if there is a period of downtime, Apple can find themselves in poor financial condition

10 | P a g e
VCA Analysis
Department: Management
Checklist Items: Functional department structure
Goals are current and well defined
Premier "first mover" company in any industry
Strategically placed store locations
Department: Marketing
Checklist Items: Loyal customer base
Premier "first mover" company in any industry
Apple brand well established
Direct Contact Selling
Strong marketing and advertising teams
Department: Finance/Accounting
Checklist Items: Revenue Increase of 52 percent
Net Income Increase of 70 percent
Direct Channels (30%) and Indirect Channels (70%) of Net Sales
Earnings per share decrease by 10.33%
Decreasing market share
Department: Production/Operations
Checklist Items: Knowledgeable sales staff
Cannibalization of own products
3rd party software providers
Designs and develops its own operating systems, hardware, application software, and services
Department: Research and Development
Checklist Items: Apple has a strong R&D department (receives 3% of sales)
Apple iTunes store (3rd party content)
Competitors undercutting prices
Availability of components
Defects of new products
Department: Management Information Systems
Checklist Items: IOS operating system has smaller market share compared to competing operating systems
Cloud music system
Data is updated regularly (real-time information)
Dependence upon third party software providers

11 | P a g e
IFE Matrix Mobile Devices
Key Internal Factors Weight Rating Weighted Score
Strengths
Premier "first mover" company in any industry 0.04 3 0.12
Functional department structure 0.03 3 0.09
Increase in revenues (52%) and net income (70%) 0.08 4 0.32
Apple brand well established 0.1 4 0.4
Apple has a strong R&D department (receives 3% of sales) 0.08 3 0.24
Apple iTunes store (3rd party content) 0.05 3 0.15
Strategically placed store locations 0.06 4 0.24
Designs and develops its own operating systems, hardware, application software, and services 0.08 4 0.32
Weaknesses
Cannibalization of own products 0.03 2 0.06
Earnings per share decrease by 10.33% 0.07 1 0.07
Decreasing market share 0.08 1 0.08
IOS operating system has smaller market share compared to competing operating systems 0.08 1 0.08
3rd party software providers 0.05 2 0.1
Competitors undercutting prices 0.04 1 0.04
Availability of components 0.07 1 0.07
Defects of new products 0.06 2 0.12
1 2.5
Desktops (Mac)
Key Internal Factors Weight Rating Weighted Score
Strengths
Each product designed similarly 0.05 3 0.15
Computer built into monitor 0.08 4 0.32
Large screen options 0.07 3 0.21
Easy to transport 0.04 3 0.12
$21.5 million in revenue 0.08 3 0.24
Unique Apple programs 0.06 4 0.24
Designs and develops its own operating systems, hardware, application software, and services 0.1 4 0.4
Weaknesses
iWork vs. Microsoft Office 0.1 1 0.1
Component Availability 0.06 2 0.12
Products Include Intellectual Property from Third Parties 0.08 2 0.16
Dependence upon third party software providers 0.08 2 0.16

12 | P a g e
Negative profits 0.11 1 0.11
(5%) Industry Growth Rate 0.06 1 0.06
Irrelevance of Desktops 0.03 2 0.06
1 2.45
Software (iTunes)
Key Internal Factors Weight Rating Weighted Score
Strengths
Focus on of third-party digital content and applications through the iTunes Store 0.05 3 0.15
Supports third-party software and hardware products and digital content that complement products 0.06 3 0.18
iTunes wide variety of selection 0.07 4 0.28
Design of iTunes store 0.05 3 0.15
Ease of use 0.07 3 0.21
Positive profits 0.1 3 0.3
High relative market share 0.1 4 0.4
Weaknesses
Products Include Intellectual Property from Third Parties 0.06 1 0.06
Dependence upon third party software providers 0.08 1 0.08
Constant updates 0.04 2 0.08
Requires desktop installment 0.05 2 0.1
Compatibility with non-Apple products 0.1 1 0.1
Increasing fees for products (from $0.99/song to $1.29) 0.08 2 0.16
9% revenues 0.09 1 0.09
1 2.34
For the IFE, we also compared the three divisions. The division that received the highest IFE score was the mobile division, with a score of 2.5. Following the mobile division was the desktop (Mac) division, with a score of 2.45. Finally, the software (iTunes) division received an IFE total weighted score of 2.34.
13 | P a g e
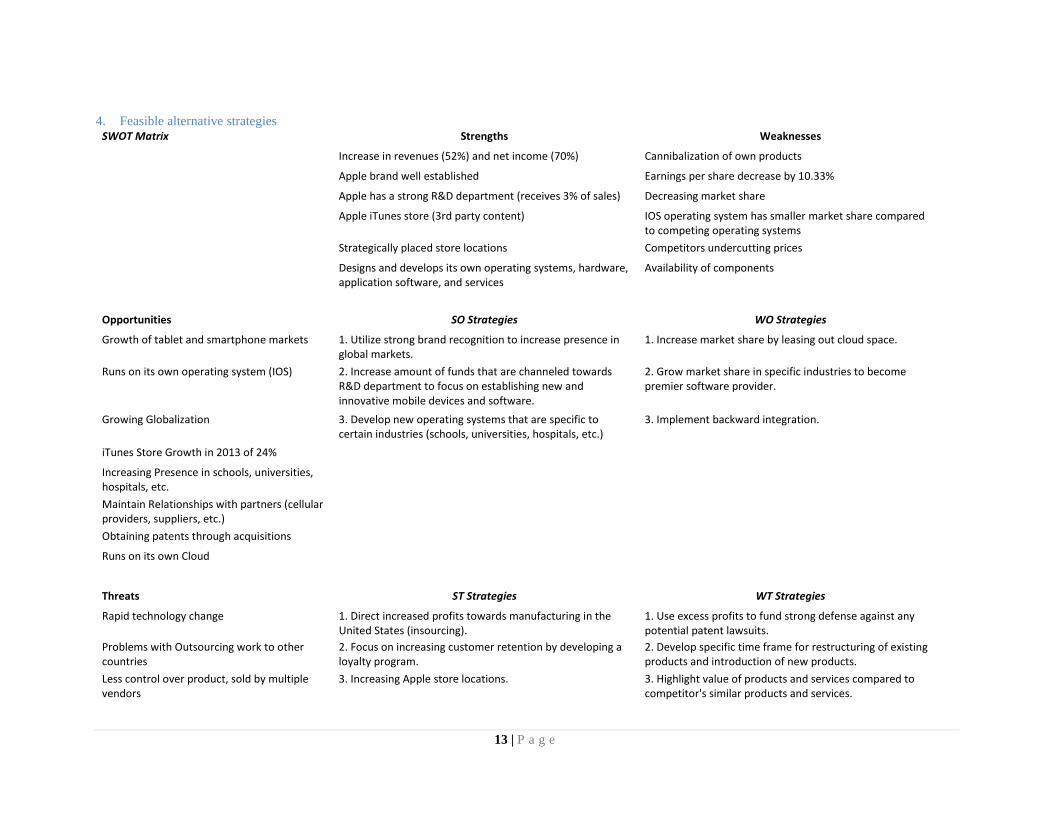
4. Feasible alternative strategies
SWOT Matrix Strengths Weaknesses
Increase in revenues (52%) and net income (70%) Cannibalization of own products
Apple brand well established Earnings per share decrease by 10.33%
Apple has a strong R&D department (receives 3% of sales) Decreasing market share
Apple iTunes store (3rd party content) IOS operating system has smaller market share compared to competing operating systems
Strategically placed store locations Competitors undercutting prices
Designs and develops its own operating systems, hardware, application software, and services
Availability of components
Opportunities SO Strategies WO Strategies
Growth of tablet and smartphone markets 1. Utilize strong brand recognition to increase presence in global markets.
1. Increase market share by leasing out cloud space.
Runs on its own operating system (IOS) 2. Increase amount of funds that are channeled towards R&D department to focus on establishing new and innovative mobile devices and software.
2. Grow market share in specific industries to become premier software provider.
Growing Globalization 3. Develop new operating systems that are specific to certain industries (schools, universities, hospitals, etc.)
3. Implement backward integration.
iTunes Store Growth in 2013 of 24%
Increasing Presence in schools, universities, hospitals, etc.
Maintain Relationships with partners (cellular providers, suppliers, etc.)
Obtaining patents through acquisitions
Runs on its own Cloud
Threats ST Strategies WT Strategies
Rapid technology change 1. Direct increased profits towards manufacturing in the United States (insourcing).
1. Use excess profits to fund strong defense against any potential patent lawsuits.
Problems with Outsourcing work to other countries
2. Focus on increasing customer retention by developing a loyalty program.
2. Develop specific time frame for restructuring of existing products and introduction of new products.
Less control over product, sold by multiple vendors
3. Increasing Apple store locations. 3. Highlight value of products and services compared to competitor's similar products and services.
14 | P a g e
Android (Google) OS growth
Competitor's comparison advertising
Patent Lawsuits against Apple
Very Similar products being produced by competitors
More Expensive Product than Competitors

15 | P a g e
SPACE Matrix
Internal Analysis External Analysis
Financial Position (FP)
Stability Position (SP) Net Profit Margin 7 Technological Changes -4
Return on Equity 5 Competitive Pressures -7
Earnings Per Share 5 Barriers to Entry into Market -3
Debt to Equity Ratio 5 Price Elasticity of Demand -2
Revenues 7 Patent Restrictions -6
Financial Position (FP) Average 5.8 Stability Position (SP) Average -4.4
Internal Analysis External Analysis
Competitive Position (CP)
Industry Position (IP) Market Share -6 Financial Stability 7
Customer Loyalty -1 International Growth Potential 7
Product Quality -3 Ease of Entry into Market 2
Control over Suppliers/Distributors -4 Profit Potential 6
Product Diversification -3 Resource Utilization 3
Competitive Position (CP) Average -3.4 Industry Position (IP) Average 5
1.6 x-axis CP + IP
1.4 y-axis FP + SP
-5
-4
-3
-2
-1
0
1
2
3
4
5
-5 -4 -3 -2 -1 0 1 2 3 4 5
Conservative Aggressive Competitive Defensive
16 | P a g e
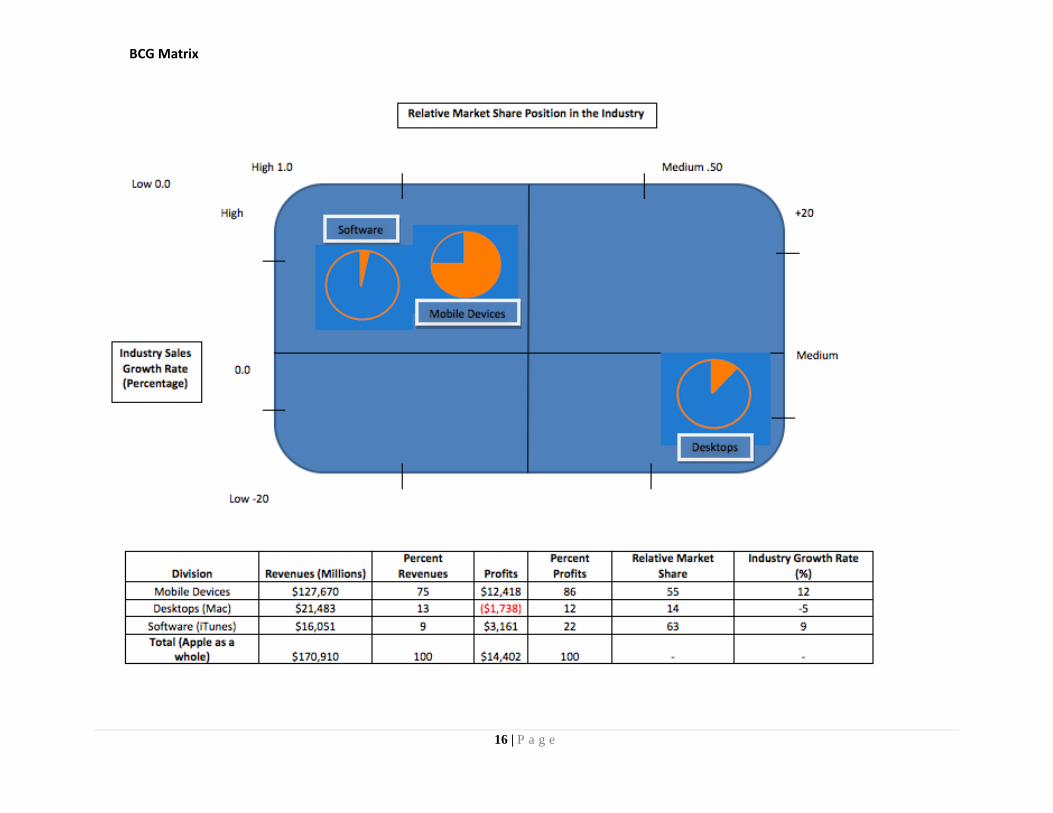
BCG Matrix

17 | P a g e
The BCG Matrix gives a look into the cash flows into our specific divisions, which we are
analyzing. Based on the sales growth and relative market share of each product division, we can categorize it and recommend strategies to help improve its position. Mobile Devices and Software are the strongest divisions as of now both with high industry growth rates and market shares. This classifies them as Stars. To put them in the scope of our critical problem, we would need to look at product development or market penetration to effectively uphold our competitive advantage which has been dwindling due to easy market entry and competitor product offerings. Apple needs to reclaim the fast acting status they developed and give consumers products that they cannot deny as being the best value and highest technology available. They need to define the newest innovation not try to keep up with it. Their Desktops (Mac) division has a low market share and negative industry sales growth rate. We can attribute that to all of their other innovations in mobile and software. Unfortunately, we believe there is some cannibalization of Mac sales due to the consumer shift to mobile computing. This position classifies the division as a Dog. The strategies associated with this category are retrenchment, divestiture, and liquidation. We don’t think we need to consider selling off parts or all of this division because it still has potential to be profitable and innovative. Looking at retrenching, Apple would want to consider which parts of the division still produce the highest potential and focus their attention to developing those products. There are many opportunities in schools and other professional environments where desktops are very much a part of their everyday functions. Apple should look into investing in providing all desktop and software needs for these schools, firms, etc. to help boost usage and in turn boost profits.

18 | P a g e
IE Matrix
The IE matrix compares the IFE scores and the EFE scores for each division. Both the mobile device and software (iTunes) divisions were placed in quadrant V, which falls into the hold and maintain category. Market penetration and product development are strategies that should be considered for divisions that fall into the hold and maintain category. The third division, desktops (Mac), scored in the VII quadrant, which is in the harvest or divest category. Typical strategies that are implemented in this category include retrenchment and divestiture activites.

19 | P a g e
5. Relative attractiveness of the alternative strategies
QSPM
Strategic Alternatives
1
2
Increase amount of funds that are channeled towards R&D department to focus on establishing new and innovative mobile devices and software.
Focus on increasing customer retention by developing a loyalty program.
Key Factors Weight AS TAS AS TAS
Opportunities Growth of tablet and smartphone markets 0.06 4 0.24 3 0.18
Runs on its own operating system (IOS) 0.03 3 0.09 1 0.03
Growing Globalization 0.05 4 0.2 4 0.2
iTunes Store Growth in 2013 of 24% 0.06 - - - -
Increasing Presence in schools, universities, hospitals, etc. 0.04 4 0.16 4 0.16 Maintain Relationships with cellular providers 0.01 2 0.02 3 0.03
Obtaining patents through acquisitions 0.02 4 0.08 1 0.02
Runs on its own Cloud 0.01 -
Threats Rapid technology change 0.15 4 0.6 4 0.6
Problems with Outsourcing work to other countries 0.10 - - - -
Less control over product, sold by multiple vendors 0.12 - - - -
Android (Google) OS growth 0.09 3 0.27 4 0.36
Competitor's comparison advertising 0.08 - - - -
Patent Lawsuits against Apple 0.07 3 0.21 1 0.07
Very Similar products being produced by competitors 0.02 4 0.08 4 0.08
More Expensive Product than Competitors 0.06 4 0.24 4 0.24
Easy for Potential New Entrants 0.03 - - -
Strengths Premier "first mover" company in any
industry 0.04 3 0.12 3 0.12

20 | P a g e
Functional department structure 0.03 1 0.03 1 0.03
Increase in revenues (52%) and net income (70%) 0.08 4 0.32 3 0.24
Apple brand well established 0.1 4 0.4 4 0.4
Apple has a strong R&D department (receives 3% of sales) 0.08 4 0.32 3 0.24
Apple iTunes store (3rd party content) 0.05 - - - -
Strategically placed store locations 0.06 1 0.06 4 0.24
Designs and develops its own operating systems, hardware, application software, and services 0.08 4 0.32 4 0.32
Weaknesses Cannibalization of own products 0.03 1 0.03 2 0.06
Earnings per share decrease by 10.33% 0.07 2 0.14 3 0.21
Decreasing market share 0.08 3 0.24 3 0.24
IOS has smaller market share compared to competing operating systems 0.08 2 0.16 3 0.24
3rd party software providers 0.05 - - - -
Competitors undercutting prices 0.04 1 0.04 3 0.12
Availability of components 0.07 3 0.21 1 0.07
Defects of new products 0.06 4 0.24 4 0.24
Total 2.00
4.82
4.74

21 | P a g e
6. Implementation of the most attractive alternative strategy
We chose to pursue strategy 1 based on its higher total attractiveness score of 4.82. Strategy 1 includes increasing the amount of funds that are channeled towards the Resource and Development department to focus on establishing new and innovative mobile devices and software. Apple’s R&D department will play a significant role in successfully implementing this strategy. Their main task will be to design effective and cutting-edge mobile devices and software. To do this, the R&D department will receive an increased budget; a total of 6% of Apple’s total sales, instead of 3%. The goal of the R&D department and Apple as a company will be to efficiently utilize this increased budget to design the newest and most innovative technological products. Apple already has a well-established brand and products that they can improve upon. Although they were the premier “first mover” company in the industry, Apple’s competition is increasing significantly by developing and releasing innovative products. An example of this includes Samsung’s new product, the Galaxy Gear smart watch. While developing these new and innovative products, or improving the existing products, it is very crucial to Apple’s investors that the R&D department keeps their plans classified. Any leak could lead to competitors learning of their new products, and developing cheaper substitute products to compete against Apple’s on the market. Implementing this strategy and raising the Research and Development budget from 3% of sales to 6% of sales could potentially cause Apple’s total sales to increase by 15% in 2014 and 25% in 2015.

22 | P a g e
7. An anticipation of the outcomes of the strategy you have suggested
Projected Income Statement (in Millions) Prior Year 2013 Projected Year 2014 Projected Year 2015
Net Sales 170,910$ 196,547$ 245,683$
Cost of Sales 106,606$ 122,597$ 153,246$
Gross Margin 64,304$ 73,950$ 92,437$
Operating Expenses
Research and Development 4,475$ 11,793$ 14,741$
Selling, General and Administrative 10,830$ 12,455$ 15,568$
Total Operating Expenses 15,305$ 24,247$ 30,309$
Operating Income 48,999$ 49,702$ 62,128$
Other Income/(expense); net 1,156$ 1,329$ 1,662$
Income before Provision for Income Tax 50,155$ 51,032$ 63,790$
Provision for Income Tax 13,118$ 13,347$ 16,684$
Net Income 37,037$ 37,684$ 47,106$

23 | P a g e
Projected Balance Sheet (in Millions) Prior Year 2013 Projected Year 2014 Projected Year 2015
ASSETS
Current Assets:
Cash and cash equivalents 14,259$ 16,398$ 20,497$
Short-term Marketable Securities 26,287$ 30,230$ 37,788$
Accounts Receivable 13,102$ 15,067$ 18,834$
Inventories 1,764$ 2,029$ 2,536$
Deferred Tax Assets 3,453$ 3,971$ 4,964$
Vendor Non-trade Receivables 7,539$ 8,670$ 10,837$
Other Current Assets 6,882$ 7,914$ 9,893$
Total Current Assets 73,286$ 84,279$ 105,349$
Long-term Marketable Securities 106,215$ 122,147$ 152,684.05$
Property, Plant and Equipment, net 16,597$ 19,087$ 23,858.17$
Goodwill 1,577$ 1,814$ 2,266.95$
Acquired Intangible Assets, net 4,179$ 4,806$ 6,007.31$
Other Assets 5,146$ 5,918$ 7,397.37$
Total Assets 207,000$ 238,050$ 297,563$
LIABILITIES AND SHAREHOLDERS' EQUITY
Current Liabilities:
Accounts Payable 22,367$ 25,722$ 32,152.61$
Accrued Expense 13,856$ 15,934$ 19,918.03$
Deferred Revenue 7,435$ 8,550$ 10,687.83$
Total Current Liabilities 43,658$ 50,207$ 62,758$
Deferred Revenue - Non-Current 2,625$ 3,427$ 4,772$
Long-Term Debt 16,960$ 17,200$ 17,440$
Other Non-Current Liabilities 20,208$ 25,135$ 34,991$
Total Liabilities 83,451$ 95,969$ 119,961$
Commitments and Contingencies
Shareholders' Equity:
Common Stock 19,764$ 25,874$ 33,430$
Retained Earnings 104,256$ 135,838$ 175,508$
Accumulated Other Comprehensive
Income/(Loss) (471)$ (479)$ (599)$
Total Shareholders' Equity 123,549$ 161,233$ 208,339$
Total Liabilities and Shareholders' Equity 207,000$ 238,050$ 297,563$

24 | P a g e

25 | P a g e
Comparative Ratios for Apple
% Change in Revenue
2013-2012 9.20% 19.79% 19.23% -6.70% 5.44%
2012-2011 44.58% 11.43% 32.37% -5.41% 11.84%
2011-2010 65.96% 22.19% 29.28% 0.96% 7.02%
2010-2009 52.02% -0.64% 23.97% 10.02% -3.31%
Liquidity Ratios Apple Samsung Google HP Microsoft
Current Ratio 1.68 1.86 4.58 1.11 2.71
Quick Ratio 1.40 1.48 4.28 0.69 2.53
Leverage Ratios
Debt-to-Equity Ratio 0.14 0.12 0.03 0.61 0.16
Financial Leverage 1.68 1.51 1.27 3.88 1.80
Activity Ratio
Inventory Turnover 83.45 7.57 55.55 13.97 13.17
Asset Turnover 0.89 1.19 0.58 1.05 0.59
Accounts Receivable Turnover 14.22 7.91 7.14 6.96 4.68
Fixed Asset Turnover 10.67 3.08 4.22 9.59 8.53
Profitability Ratios
Gross Profit Margin 37.62 37.02 56.78 23.08 73.99
Operating Profit Margin 28.67 14.44 23.34 6.35 34.38
Net Profit Margin 21.67 11.53 21.6 4.55 28.08
Return on Total Assets 17.89 13.77 12.62 4.77 16.58
Return on Stockholders' Equity 29.98 20.80 16.25 20.57 30.09
Earnings per Share 39.75 N/A 38.13 2.62 2.58
Price-Earnings Ratio 13.21 N/A 31.57 11.37 14.72
Growth Ratios
Sales 9.20% 19.79% 19.23% -6.70% 5.44%
Net Income -11.25% 68.82% 20.33% N/A* 28.77%
Earnings per Share 0.00% 0.00% 18.01% 0.00% 0.00%
Dividends per Share 330.19% 45.45% 0.00% 10.00% 17.11%
* NI negative 2012

26 | P a g e
Our project involves increasing Apple research and development spending to match that of the competition. The proposed amount of increase at this time is 6% of revenue. Our goal is that this increase in spending will lead to new product development, which in the past has led to large increases in revenue and a larger increase of stockholder’s wealth. In order to increase research and development we propose an increase in funding by a method of 100% debt financing. To fund our project, Apple will need to secure funding of $12 billion to stay competitive. An EPS of 49.58 is projected at this amount with an interest rate of 2% and a tax base of 26%. This method of financing is subject to changes in the stock market, concerns of stock devaluation, and interest rate fluctuations. Because research and development is a long-term project, we propose to track our results over a multi-year period. Our calculations show an increase of 15% based on our first year results. This takes into account that in the previous year Apple had a 9% increase from their previous year revenue. In past years the revenue increases were greater but this was based on new product releases. We feel 15% is competitive based on what we expect in comparison with what our competition is achieving with increased research and development spending. Our projection for the second year is set at 25% because at this stage Apple should see some of the benefits of the extra spending realized.
8. A proposal to evaluate the strategy you have suggested
Strategy Evaluation
SWOT Analysis: Through the use of the SWOT analysis we have come up with the following
strategies to help in the firm’s success:
o SO Strategies:
1. Utilize strong brand recognition to increase presence in global markets.
2. Increase amount of funds that are channeled towards R&D department to focus
on establishing new and innovative mobile devices, desktops, and software.
3. Develop new operating systems that are specific to certain industries (schools,
universities, hospitals, etc.)
o ST Strategies
1. Direct increased profits towards manufacturing in the United States
(insourcing).
2. Focus on increasing customer retention by developing a loyalty program.
3. Increasing Apple store locations.
o WO Strategies
1. Increase market share by leasing out cloud space.
2. Grow market share in specific industries to become premier software provider.
3. Implement backward integration.
o WT Strategies:
1. Use excess profits to fund strong defense against any potential patent lawsuits.
2. Develop specific time frame for restructuring of existing products and
introduction of new products.
3. Highlight value of products and services compared to competitor's similar
products and services.

27 | P a g e
Corrective Action: According to our QSPM, our strategies scored relatively high, so as long as
Apple continues to perform in such a manner and continually improve, there is no need for
them to take corrective action.
Firm Performance at Time 1 vs. Time 2 vs. Time 3…: We will evaluate the implemented
strategy’s effectiveness quarterly.
Firm Performance vs. competitors’ performance: According to the CPM, Apple’s weighted score
was the highest when compared to Samsung and Google, with total weighted scores of 3.23,
2.80 and 2.65 respectively. So although their market share may be decreasing and they have
major competitors that they must deal with constantly, Apple is still performing very well.
Firm Performance vs. industry averages:
o Mobile Devices: As of 2012, the mobile devices market share showed percentages of
Apple’s iPhone claiming 31.08%, iPod Touch had 4.41%, and iPad 29.28%. These
percentages made up most of the market share, and prove that Apple is dominating in
the industry (Barrientos, 2012).
o Desktops: Because of the huge increase in tablet and laptop purchases, desktops are
becoming a thing of the past. In 2013, Apple’s share of the market had them sitting at
11.6% with HP in the lead at 24.2% and Dell at 20.8% (Stevenson, 2013).
o Software: After researching the many companies that hold market share in the software
industry, we found an article placing Apple in the 62 percentile against Android’s 35%
and Windows Mobile’s 3% (Casteleyn, 2013).
Contingency Planning:
o Unfavorable events such as a major competitor introducing a ground breaking product
that has never been seen before.
o A trigger point would be when the product reached the testing phase.
o This contingent event would have the potential to harm Apple by losing loyal customers.
o Our contingency plan involves increasing the amount of funds that are channeled
towards R&D department to focus on establishing new and innovative mobile devices
and software.
o The Counter-Impact against the competitors introduction of a new innovative product is
that Apple has also been pulling resources and putting them directly into R&D and will
have their own product to launch and rebuttal the competitor’s product.
o Warning Signals such as chatter on blogs about a new innovative technology being
tested and soon to be launched, stock prices changing and loss of loyal customers would
throw up red flags for Apple.
o Our recommended Action Plan to Apple is that they re-evaluate their performance
quarterly, so as not to miss anything important and catch problems and potential
problems right away. Furthermore, to increase the amount of funding going towards
R&D so that they may stay on top of the market in creating new and innovative products
before their competitors have the chance to.

28 | P a g e
9. References
Barrientos, Miguel. Phonemarketshare.com. Mobile Device Market Share April 2012. Retrieved
from: http://www.phonemarketshare.com/
Casteleyn, Jonathan. Market Realist.com. Citrix enterprise access software shows Apple’s iOS
has the best global share. Retrieved from: http://marketrealist.com/2013/04/citrixs-enterprise-
access-software-show-apples-ios-has-the-best-global-share/
Farber, Dan. Cnet.com. Why Apples 2014 won’t be like 2013. Retrieved from
http://news.cnet.com/8301-13579_3-57615293-37/why-apples-2014-wont-be-like-2013/
Farber, D. (2013, December 17). Why Apple's 2014 won't be like 2013. CNET News. Retrieved
February 24, 2014, from http://news.cnet.com/8301-13579_3-57615293-37/why-apples-2014-
wont-be-like-2013/
http://appleinsider.com/articles/14/01/09/apples-domestic-mac-sales-surge-285-as-overall-pc-
market-shrinks-75mac market share
Hughes, N. (2014, January 14). Apple's domestic Mac sales surge 28.5% as overall PC market
shrinks 7.5% [u]. Apple Insider. Retrieved February 24, 2014, from
http://appleinsider.com/articles/14/01/09/apples-domestic-mac-sales-surge-285-as-overall-pc-
market-shrinks-75
http://www.inquisitr.com/622067/itunes-loses-marketshare-but-maintains-lead/itunes market
share
Johnson, J. (2013, April 17). iTunes Loses Marketshare But Maintains Lead. The Inquisitr News.
Retrieved February 24, 2014, from http://www.inquisitr.com/622067/itunes-loses-marketshare-
but-maintains-lead/
Stevenson, Andrew. Neowin.net. Apple’s PC Market share rises. Or falls, who knows. The
analysts clearly don’t! Retrieved from: http://www.neowin.net/news/apples-pc-market-share-
rises-or-falls-who-knows-the-analysts-clearly-dont