![Untitled - 1 [] Master Plan.pdflor 2 lot 1 neighborhood beiness district residential office district residential medium density district residential tm-household medium density district](https://static.fdocuments.net/doc/165x107/5f6bcdeca4f39d5f85499296/untitled-1-master-planpdf-lor-2-lot-1-neighborhood-beiness-district-residential.jpg)
Strategic Local Plan Background Note Residential Density · Background Note Residential Density ......
36
Strategic Local Plan Background Note Residential Density October 2014
Transcript of Strategic Local Plan Background Note Residential Density · Background Note Residential Density ......

Strategic Local Plan Background Note
Residential Density
October 2014

Background Note
Residential Density
An earlier version of this note was considered by the Council’s PlanningPolicy Committee on 3 July 2014. This version provides additional examples.The purpose of this Note is to illustrate housing density on some well knownsites across St Albans City and District and thus to give a range ofcomparators for typical residential layouts / designs.
Measuring housing density is a simple way of quantifying the intensity ofresidential development and efficiency in use of land for housing. Themeasurement also gives some insight into the environmental character ofhousing areas.
The Note gives local examples of:
Relationship between gross and net density in recent major residentialdevelopment
1. Jersey Farm; 1980’s2. Hill End / Cell Barnes; 1990s3. Napsbury; 1990 / 2000s
Net density calculations
1. New England Street area, St Albans2. King Harry Lane (new development in progress), St Albans3. Jersey Farm Estate, St Albans4. Oaklands Smallford Campus (current housing application as proposed),
St Albans5. Former Oaklands College City Campus housing redevelopment, St
Albans6. Part of Marshalswick Estate, St Albans7. Part of Chiswell Green8. Luton Road area, Harpenden9. Belmont Hill, St Albans10. Elm Lawns Close, St Albans11. Land Rear of Sandridge Road, St Albans12. Waverley Road, St Albans13. St Albans Hospital site14. Station Road, Harpenden (a)15. Station Road, Harpenden (b)16. Redbourn Lane, Harpenden17. Luton Road, Harpenden
Calculation and interpretation of residential density
Decisions on what housing density is appropriate for a location are influencedby many different factors.
Building height, block size and housing typology are the main factors thatinfluence the character of an area and perceptions of density.
However, higher density does not have to mean tall buildings with smallapartments that fail to relate to local character. In fact, high buildings can beless effective in maximising the use of land, especially in terms of therelationship of developed and open areas.
Good design is crucial to achieve environmental quality. Each design schemeshould establish the density appropriate for a particular location taking intoconsideration factors such as:
Context - density appropriate to context and allowing respect forsurrounding residential character
Quality of public realm - a legible and stimulating public realm Outdoor space - high quality communal space Private and public space mix - ability to manage spaces Parking - adequate and appropriate car parking levels which do not
dominate or detract from the external environment
Additional factors which might determine an appropriate density level include:
Surrounding built form Housing types Need for different types of housing Need to create variety of densities – density mix Capacity of facilities for residents
It is important to remember that density is a product of design, not adeterminant of it. Residential density should aim to support local infrastructuresuch as shops, schools, and local transport. Homes and Community Agency(HCA) “research has shown that there is no correlation between urban qualityand density. Developments driven by average densities and shaped byblanket standards (relating to privacy, open space, parking and highwaygeometry, for example) stultify design and tend to produce lowest-common-denominator blandness.”
In the St Albans City and District Strategic Local Plan (SLP) the factors ofwhat ‘housing types’ and the ‘need for different types of housing’ areparticularly important. The draft SLP says: “All new housing development willcontribute to a mix of different housing types in residential areas, taking intoaccount the existing pattern of housing in the area, evidence of local need andsite specific factors. It will in particular require the inclusion of more small andsmall to medium-sized housing, including one and two bedroom flats and 2

bedroom houses, in new development schemes in suitable locations, toincrease the proportion of such sized units in the district housing stock, towiden choice and to provide more relatively low cost market housing availableto buy. Floorspace, as well as room numbers and bedroom numbers, will beconsidered in judgments of relatively low cost market housing.
The Council requires the affordable housing size, type, and mix to broadlyreflect that being provided for the market element of all development.
The Council seeks the provision of a reasonable proportion of housingdesigned to the lifetime homes standard that can be readily adapted to meetthe needs of older people and people with disabilities.
Sheltered housing and extra care housing for older people and those withspecial needs will be encouraged on suitable sites in areas close to a range ofservices.
Further detail on requirements for appropriate housing size, type, mix andproportion of lifetime homes will be given in the DLP. “
Measuring density
There are different ways of measuring density, each of which providesdifferent information.
They include:
Dwellings per hectare (DPH) – this a common measure to indicateresidential density. However, apartments at 60dph may actually have smallerbuilt volume than larger houses at 30dph with related garaging.
Square meters per hectare – measuring amount of floorspace perhectare is another method to illustrate development intensity. It indicatesmore clearly how efficiently land is being used.
Floor area ratio (FAR) or plot ratio – this measurement express theratio between gross floor area and site area. It again indicates the intensity ofland use and gives some indication of massing volumes.
Bedspace per hectare – measuring bedspace per hectare indicatespopulation capacity rather than actual use (as some dwellings may be under-occupied.)
Habitable rooms per hectare – habitable room and bedspace densitiesgive an indication of resident population and a calculation of populationcapacity. Calculating habitable rooms per hectare can be helpful in

determination of likely demand for amenities and services such as publictransport.
For the purpose of this Note the simple dwellings per hectare has beenadopted.
The first part of the Note illustrates how density is viewed at a gross level. Itgives examples of the relationship between gross and net densitycalculations. Gross density calculations can be used to estimate andillustrate the potential development capacity of a site. The Green Belt ReviewPart 2 (SKM Enviros Consultancy Study) used the approach that up to 60% ofthe Gross Development Area (GDA) would be developed (termed NetDevelopment Area) and the remaining 40% would be required to provideinfrastructure, main roads, open space and public facilities.
The second part of the Note illustrates calculations of net density. A netdensity measurement includes access roads within the site, private gardenspaces, car parking areas, incidental open space and landscape andchildren’s play areas but normally excludes major distributor road, primaryschools, opens spaces serving a wider area and significant landscape bufferstrips.
Net density is the measure of density used for the SKM recommended netdevelopment areas and thus is a comparable measure to that used in theillustrations in this Note.
Work on density assumptions in the draft Strategic Local Plan (SLP) is basedon HCA research, in the form of a density matrix (Table 3.3 from the Homesand Communities Agency Urban Design Compendium – reference below).The matrix links typical residential densities to urban form (‘creating urbanstructure’). It draws on examples of development across the UK and Europe.Average densities are based on case studies analysed as part of theSustainable Residential Quality: Exploring the housing potential of large sitesresearch. The matrix recommends that residential densities of 30 to 50 DPH(alongside related services) should be applied in suburban locations. This isconsidered to be relevant to the SKM identified sub areas assessed for thedraft SLP, as they are located on the edges of existing settlements and exhibitsuburban characteristics.

Illustrative areas analysed for the purpose of this study can be considered inthe context of the Density Matrix.
The matrix is reproduced below:
(Note: This table is a direct extract from Homes and Community Agency Urban Design Compendium 1.Second row in column one should read ‘predominant’.)
Reference:Urban Design Compendium 2 (2007), Delivering Quality Places (2nd Ed), Homes andCommunity Agency

Relationship between gross and net density in recent major residential development – local examples
.


102 Ha = 18DPH
58 ha = 31DPH


Net density calculations – local examples

1. New EnglandStreet area, St Albans
Map and Aerial Photographs Photographs Density Calculations Notes
Land enclosed by NewEngland Street to theWest, Verulam Road tothe North and CollegeStreet to the South, StAlbans
This is a residentialarea with primarily 2storey cottage terracedhouses built in the 19th
Century. Additionalresidential developmenttook place at thebeginning of 20th
Century along VerulamRoad.
The site includes twocommercial units and asocial use with smallpockets of open space.
New England Street
Temperance Street
College Street
The site is 2.5 ha inarea and there are 144dwellings within thesite.
Net density of this siteis 57 DPH.
Some of the spaceadjoining New EnglandStreet has beenincluded in thecalculations to illustratethe density with areflection of thecharacter of the areaincluding some publicspace.
A major factor in highdensity is total relianceon-street parking.

2. King Harry Lane(new development inprogress), St Albans
Map and Aerial Photographs Photographs Density Calculations Notes
The development of thissite is divided into twophases. Phase one(northern side) is aproposal for 126dwellings (16 keyworker units, 45 extracare/assisted livingunits and 65 units ofaccommodation for theover 55s).
Outline planningpermission for phaseone development wasgranted on appeal inFebruary 2008.
Phase two (immediatelyto the south of phaseone development) is adevelopment of 150dwellings (ranging from2 – 2.5 storey houses)Permission for thisdevelopment wasgranted on appeal inApril 2010.
Illustrative Masterplan forphase one development.
Mortimer Crescent (phasetwo)
The site is 7.8 ha inarea the total numberof proposed dwellingsis 276.
Based on thesefigures, net density forthe whole site is 35DPH.
This is illustrative of arecently permitteddevelopment in asuburban location butincluding some openspaces.
Each site has differentownership but both sitesshare accessarrangements and acoordinated design ledapproach.

3. Jersey FarmEstate, St Albans
Map and Aerial Photographs Photographs DensityCalculations
Notes
Various parts ofJersey Farm Estate.
The development ofthe whole estate tookplace across 1970sand 80s.
Area 1 – North –eastern part of JerseyFarm.
Permission fordevelopment of thissite was granted inearly the early 1980s.
.
Lincoln Close
Pirton Close
Sandringham Crescent
Area 1The site is 6.8 ha inarea and there are156 houses within thesite.
Net density of thisarea is 23 DPH.
The site consists of 2storey detachedhouses. Average plotsize is 300 to 350 m2.
All the houses havegarages and off streetparking.
.

Area 2 – Southernpart of Jersey Farm
This part of JerseyFarm Estatedevelopment consistsmainly of 2 storeyterraced houses.
Permission wasgranted for thedevelopment of 118Dwellings (60 flatsand 58 homes) in the1970s.
Newgate Close
Newgate Close
Newgate Close
Area 2The site is 2.8ha wideand there are 88terraced houseswithin the site.
Net density for thissite is 31 DPH.
Houses are set backfrom the street andhave relatively largefront and backgardens.
There is a significantamount of designatedresident parkingspace and pockets ofgreen open spacewhich explains therelatively low densityfor a development ofterraced housing.

Area 3 – Middle partof Jersey Farm
This is a mixed usearea which includesresidential dwellings,commercial andcommunity uses
Permission for thecommercial VillageCentre Developmentwas granted in thelate 1970s followedby approval foradjoining residentialdevelopment in theearly 80s.
Harvesters
Twyford Road
Commercial Centre
Area 3The site in total is 3.5ha in area. Within thesite there are 92terraced houses,three blocks of flats(equivalent of 42 flatsin total) andcommercial centre(0.6 ha) whichincludesneighbourhoodsupermarket, fivesmall retail units,public toilets, medicaland communitycentre.
After taking away thevolume of commercialcentre area and itsparking, the netdensity for the site is46 DPH.
This relatively highdensity can beexplained by the highproportion of terracedhousing and flats.Dwellings of this kindare often included inthe design of a centralarea or local centrewithin a settlementand this will allowhigher overalldensities to beachieved. It alsointroduces variation inthe character of thebuilt environment.

4 OaklandsSmallford Campus(current housingapplication asproposed), St Albans
Map and Aerial Photographs Photographs DensityCalculations
Notes
A full application forcomprehensiveredevelopment toprovide new andrefurbished CollegeBuildings andresidentialdevelopment of 348dwellings, car parking,associated access andlandscaping wassubmitted in May2013. The applicationis still underconsultation.
The area marked onthe map is the areaproposed by theapplicant forresidentialdevelopment.
Landscape proposal
Proposed Residential Layout
The site is 13.68 hain area. Theapplication proposesdevelopment of 348residential dwellings.
Within the designproposal there is aquite significantamount of structuralopen space in thenorthern part of thesite and middle of thesite.
The overall density ofthe site is 26dph butafter taking away thearea of structuralopen space the netdensity for thisdevelopment is 31DPH.
The scheme proposesmainly 2 – 3 storeyhouses.
Density of the sitevaries depending oncharacter zones.Proposed ‘MainStreets’ will be lowerin density in the rangeof 30dph. ‘The lanes’will be mediumdensity (35dph) and‘Mews Links’ will behigher density rangingfrom 40 - 45dph.

5. Former OaklandsCollege City Campushousingredevelopment, StAlbans
Map and Aerial Photographs Photographs DensityCalculations
Notes
This is a formerOaklands College CityCampus site.
Permission fordemolition ofeducational buildings,change of use fromeducational use toresidential use of eightbuildings, retention oftwo building as hall andgym and erection of 15apartment blocksproviding a total of 329units was granted onan appeal in August2006.
The density calculationis for part of thedevelopment - thesection nowredeveloped.
Newsom Place
Lemsford Road
The site in total is3.3 ha in area.Within the siteboundary there are20 apartmentblocks (equivalentof 281 dwellings),gym and hall.
After taking awaythe area of thehall/gym buildingsthe net density forthis developmentis 93 DPH.
The scheme proposesmainly 3 – 4 storeyapartment blocks.
Parking is at reducedlevel due to proximity toCity services and publictransport. Some of theparking is underground.This high densitydevelopment isappropriate to an urbansite, but there is spacefor extensivelandscaping.

6. Part ofMarshalswickEstate, St Albans
Map and Aerial Photographs Photographs DensityCalculations
Notes
Land along SandpitLane immediately tothe north of currentOaklandsapplication.Marshalswick, StAlbans.
Barnfield Road
Southfield Way
Ardens Way
The site is 8.4 hain area and thereare 170 dwellingswithin the siteboundary.
Net density for thisarea is 20 DPH.
The area consistsof 2 – 2.5 storeydetached houseswith garages/ offstreet parking andrelatively largeback gardens.

7. Part of ChiswellGreen
Map and Aerial Photographs Photographs DensityCalculations
Notes
Land enclosed byNorth Orbital Road tothe East and WatfordRoad to the West,Chiswell Green
Manor Drive
Watford Drive
Forefield
The site is 9.7 ha inarea and there are145 dwellings withinthe site boundary.
Net density for thisarea is 15 DPH.
The site consists ofa mixture of housetypes from 1 storeybungalows to 2.5storey detachedhouses.

8. Luton Road,Harpenden
Map and Aerial Photographs Photographs DensityCalculations
Notes
Land enclosed byLuton Road to theNorth and TuffnellsWay to the South,Harpenden
Ridge Avenue
Wells Close
Tuffnells Way
The site is 10.8 hain area and thereare 190 dwellingswithin the siteboundary.
Net density for thisfor this site is 17DPH.
There is a mixture ofhouse types. From 1storey bungalows to2 – 2.5 storeyterraced anddetached houses.
Plot sizes vary from1100 m2 to 215 m2.
Most gardens aresubstantial andthere is generallyample off streetparking.

9. Belmont Hill, StAlbans
Map and Aerial Photographs Photographs Density Calculations Notes
De Tany Court atBelmont Hill, StAlbans (formerplaying fields)
De Tany Ct and related openspace (part of former playingfield)
De Tany Ct
De Tany Ct
The site is 2.24 ha intotal and there are 80dwellings within thesite.
Main open spaces are0.3 ha in total. Theseare retained parts ofthe former playingfields and can beregarded as morethan amenity openspace included in anet area.
Density of this site is35 DPH.
If calculated withoutplay area and openspace (south east ofthe site) the density ofthis site is 41 DPH.
This is a residentialarea with a mix of 2-3storey houses andmaisonettes built inlate 80s.
The site includes asubstantial play areaand riverside openspace serving thewider area and smallpockets of integralopen space.

10. Elm LawnsClose, St Albans
Map and Aerial Photographs Photographs Density Calculations Notes
Elm Lawns Close, offAvenue Road, StAlbans
Elm Lawns Close
Avenue Road
The site is 0.4 ha intotal and there are 24dwellings within thesite.
Net density of this siteis 60 DPH.
This residentialdevelopment is a mix of2- 3 Storey houses
This is a small site, butit illustrates higherdensity developmentwith car parking in a culde sac layout. Itcomprises housing interraced form.

11. Land Rear ofSandridge Road, StAlbans
Map and Aerial Photographs Photographs Density Calculations Notes
Archers Fields; R/O168 Sandridge Road,St Albans
Sandridge Road
Archers Fields
Archers Fields
The site is an urbaninfill of 0.75 ha in total.There are 27 dwellingswithin the site.
Net density of this siteis 36 DPH.
The site consists solelyof 2 storey houses, withgardens. They aremainly terraced, butincluding some linkeddetached anddetached. There is nointegral / amenity openspace. There is asubstantial unused roadfrontage (south side ofaccess road) whichresults in a lowerdensity figure than thelayout would achieve ifthe site were not urbaninfill, fitting into anexisting urban layout.

12. Waverley Road, StAlbans
Map and Aerial Photographs Photographs Density Calculations Notes
Pegasus Place offWaverley Road, StAlbans
Pegasus Place
Waverley Road
The site is an urbaninfill development of0.74 ha in total. Thereare 36 dwellings withinthe site.
Net density of this siteis 49 DPH.
The site consistsentirely of 2-3 storeyterraced houses withassociated parking andlandscaping. Thehouses have smallgardens. There is nointegral amenity openspace.

13. St AlbansHospital Sites
Map and Aerial Photographs Photographs Density Calculations Notes
Land adjacent StAlbans Hospital,Waverley Road, StAlbans.
Goldsmith Way
Newmarket Ct
Waverley Road with entrance toSt Albans City Hospital
The overall site is 9.2ha in total. The mainhospital site (shadedin red) is 3.2 ha. Thereare approximately 290dwellings within theremaining site (6 Ha).
Net density for theoverall site is 48 DPH.
The area includes awide range of dwellingtypes including somesubstantial blocks ofsmall flats.
The overall sitecalculation includessome significant areasof open space, the siteof a hospice and otherhospital related uses.
Densities within theoverall site varygreatly.
Some sub areas wheredwellings arepredominantly 2 -3storey houses areconsidered separatelybelow.
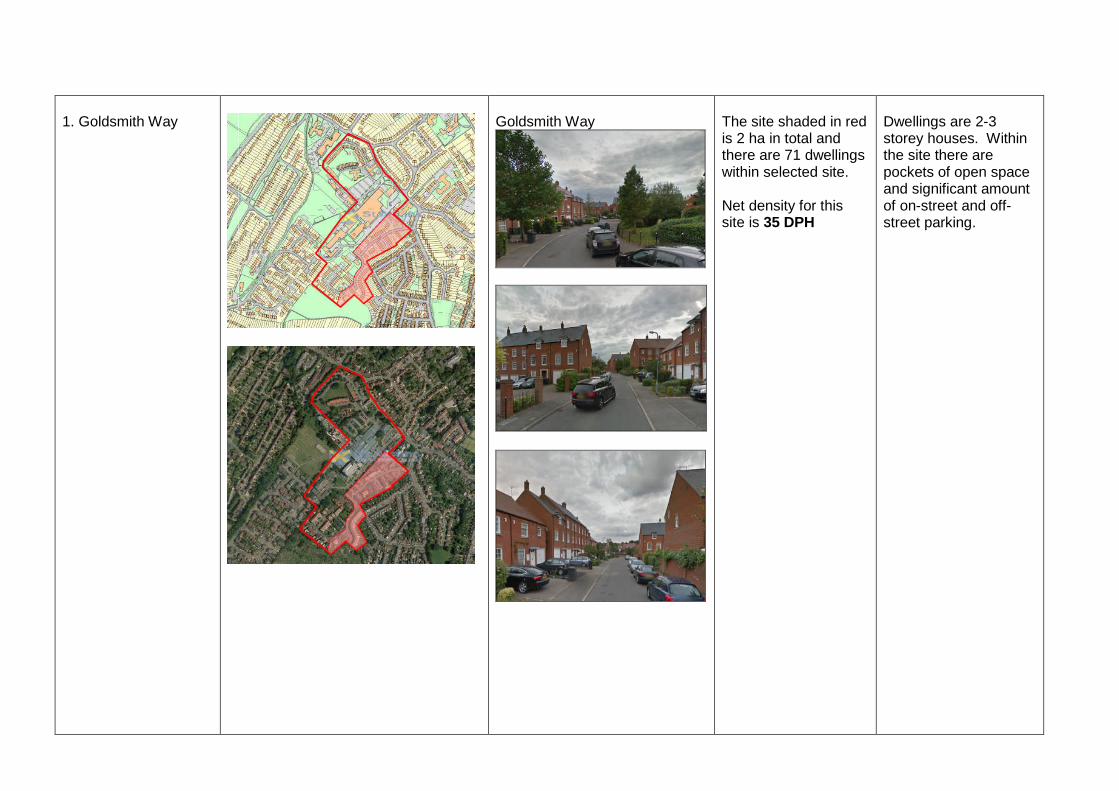
1. Goldsmith Way Goldsmith Way The site shaded in redis 2 ha in total andthere are 71 dwellingswithin selected site.
Net density for thissite is 35 DPH
Dwellings are 2-3storey houses. Withinthe site there arepockets of open spaceand significant amountof on-street and off-street parking.

2. NewmarketCourt
Newmarket Court The site shaded in redis 1.1 ha in total andthere are 43 dwellingswithin selected site.
Net density for thissite is 39 DPH
The site is a mixture ofhouses and flats withsignificant amount ofon and off streetparking space.

14. Station Road,Harpenden (a)
Map and Aerial Photographs Photographs Density Calculations Notes
Mallard Mews / StationRoad / WaveneyRoad, Harpenden
Mallard Mews
Waveney Road
Station Road
The site is 0.25 ha intotal and there are 15dwellings within thesite.
Density of this site is60 DPH.
This is an infilldevelopment with a mixof 2.5 – 3 storey flatsand houses andapartments. This is apart cul de sac partstreet frontagedevelopment.

15. Station Road,Harpenden (b)
Map and Aerial Photographs Photographs Density Calculations Notes
Station Road,Harpenden(flats)
Station Road
Station Road
Station Road
The application site is0.41 ha in total andthere are 48 dwellingswithin the site.
Net density of this siteis 117 DPH.
This developmentconsists of 2-3 threestorey blocks of flatswith associated parkingspaces to rear ofblocks.
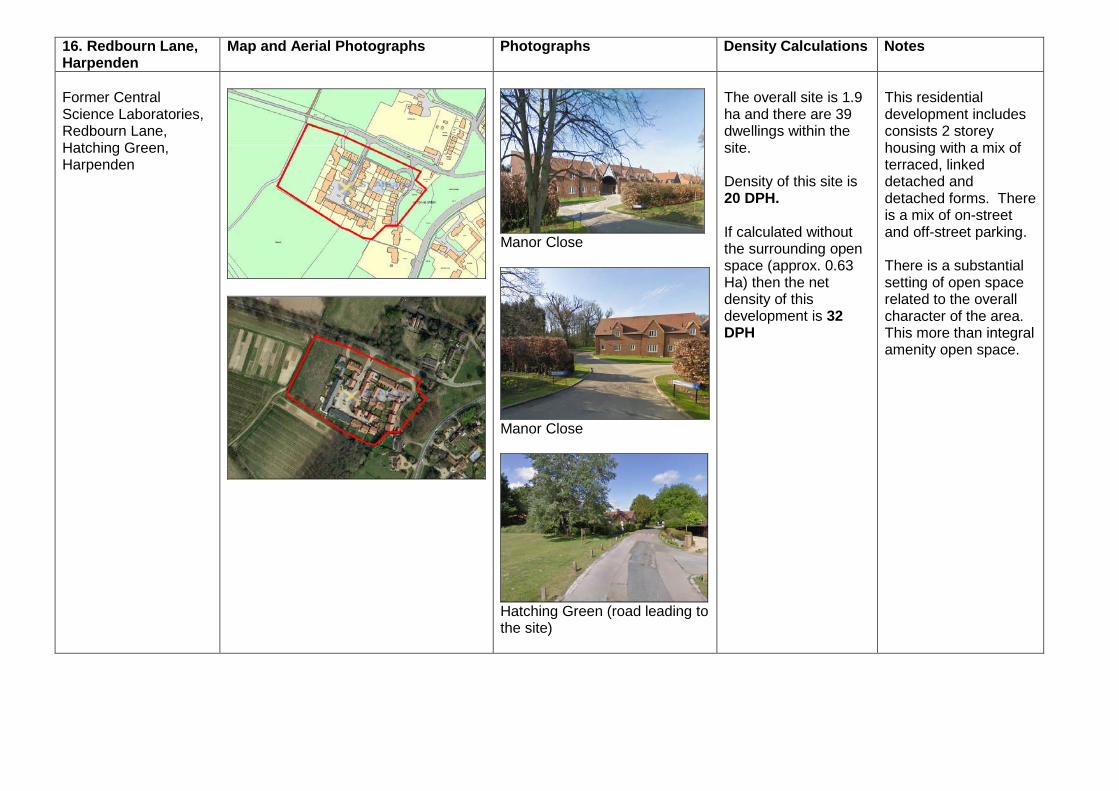
16. Redbourn Lane,Harpenden
Map and Aerial Photographs Photographs Density Calculations Notes
Former CentralScience Laboratories,Redbourn Lane,Hatching Green,Harpenden
Manor Close
Manor Close
Hatching Green (road leading tothe site)
The overall site is 1.9ha and there are 39dwellings within thesite.
Density of this site is20 DPH.
If calculated withoutthe surrounding openspace (approx. 0.63Ha) then the netdensity of thisdevelopment is 32DPH
This residentialdevelopment includesconsists 2 storeyhousing with a mix ofterraced, linkeddetached anddetached forms. Thereis a mix of on-streetand off-street parking.
There is a substantialsetting of open spacerelated to the overallcharacter of the area.This more than integralamenity open space.

17. Luton Road,Harpenden
Map and Aerial Photographs Photographs Density Calculations Notes
40 Luton Road,Harpenden
View from Townsend Road
View from Luton Road
Luton Road
The site is 0.14 ha intotal and there are 9dwellings within thesite.
Density of this site is64 DPH.
This residentialdevelopment consistsof 9 apartments in a 3storey building withaccommodation in theroof space and undercroft parking.
This is a small infill /redevelopmentscheme, but itillustrates how higherdensity componentswithin an overall area /scheme can contributeto character.