

Storage Wireless Wireline telecom - CML … · CML Microsystems Plc designs, manufactures and...
16
Storage Wireless Wireline telecom
Transcript of Storage Wireless Wireline telecom - CML … · CML Microsystems Plc designs, manufactures and...
Storage Wireless Wireline telecom
CML Microsystems Plc designs, manufactures and markets a range of semiconductors for global industrial and professional applications within the storage, wireless and wireline communications market areas.
Founded in 1968, CML operates internationally with subsidiaries across the UK, the USA, Germany, Singapore and Taiwan.
Visit us online at cmlmicroplc.com
Contents
Highlights 1
Chairman’s statement 2
Group Managing Director’s statement and operational and financial review 3
Condensed consolidated income statement 4
Condensed consolidated statement of comprehensive income 4
Condensed consolidated statement of financial position 5
Condensed consolidated cash flow statements 6
Condensed consolidated statement of changes in equity 7
Notes to the condensed consolidated financial statements 8
Glossary 12
1CML Microsystems PlcHalf Yearly Report FY2016
Highlights
Our results
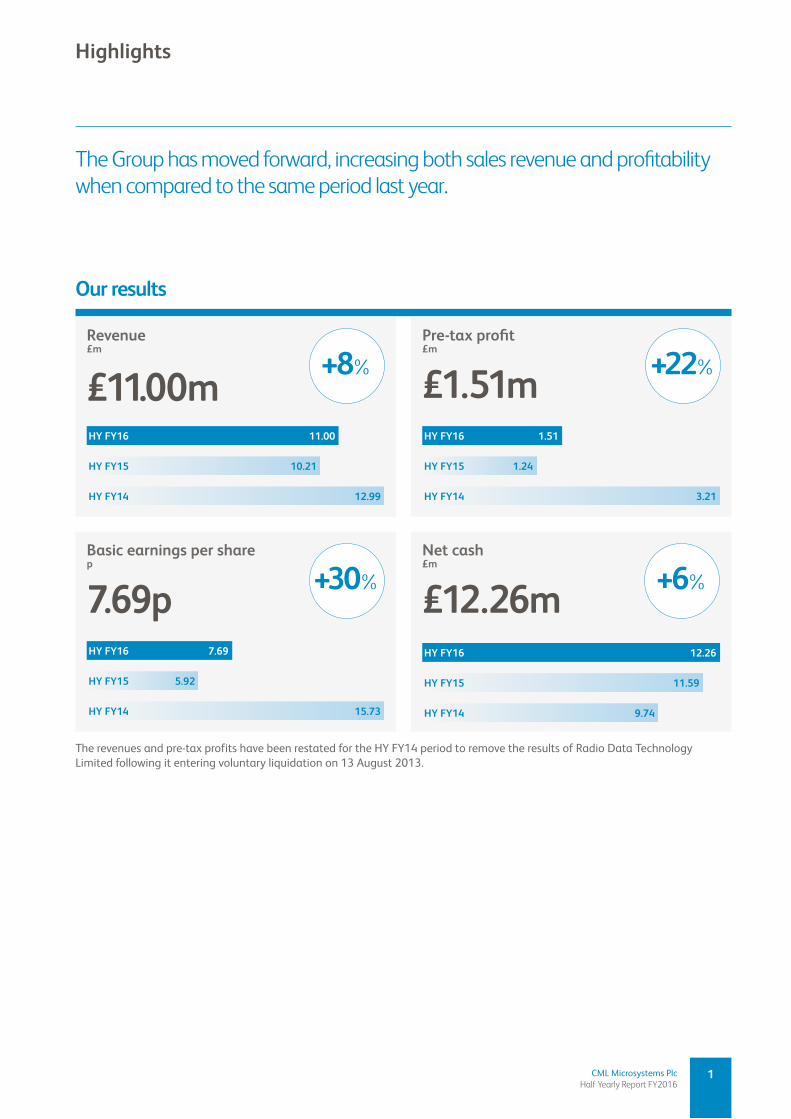
The Group has moved forward, increasing both sales revenue and profitability when compared to the same period last year.
The revenues and pre-tax profits have been restated for the HY FY14 period to remove the results of Radio Data Technology Limited following it entering voluntary liquidation on 13 August 2013.
Revenue£m
Pre‑tax profit£m
Basic earnings per sharep
Net cash£m
£11.00m £1.51m
7.69p £12.26m+6%
+8% +22%
+30%
12.99
10.21
11.00
HY FY14
HY FY15
HY FY16
3.21
1.24
1.51
HY FY14
HY FY15
HY FY16
15.73
5.92
7.69
HY FY14
HY FY15
HY FY16
9.74
11.59
12.26
HY FY14
HY FY15
HY FY16
2 CML Microsystems PlcHalf Yearly Report FY2016
I am pleased to state that as expected the Group has moved forward, increasing both sales revenue and profitability when compared to the same period last year. Results reported are broadly in line with expectations despite current global market conditions becoming more difficult.
In the first six month period to 30 September 2015, sales revenues increased 8% to £11.00m (2014: £10.21m) and pre-tax profits increased by 22% to £1.51m (2014: £1.24m). Cash at the period end reduced compared to the March year end mainly as a result of payment of the dividend, the planned increase in development expenditure and the purchase of our own shares to be held in treasury.
Recently, one or two of the market areas addressed are showing signs of softness and a small number of customers have delayed the launch of their new products, albeit only by a few months. This appears to be a short-term problem that has reduced the Board’s expected growth rate for the second half. Despite this caveat, the Board remains confident that the Group will move forward for the financial year as a whole.
The Group’s visible growth opportunities provide me with clear evidence that the execution of the Board’s strategy is driving progress, regardless of the short-term headwinds in some market areas. I am confident of a more significant improvement in the results over the medium and longer term.
As always the progress of any business is dependent upon the quality and dedication of its employees. The Board wishes to thank its employees worldwide for the performance and commitment they have shown throughout this period.
Nigel ClaRkGroup Non-Executive Chairman
24 November 2015
The Group’s visible growth opportunities provide me with clear evidence that the execution of the Board’s strategy is driving progress.
Chairman’s statement
3CML Microsystems PlcHalf Yearly Report FY2016
OpeRatiONal aNd FiNaNCial Review
The first six months of the current trading year produced a meaningful advance in revenue and profitability against the comparable period. Total sales reported to 30 September 2015 were £11.00m representing an increase of 8% (2014: £10.21m).
The overall rise was a result of improved trading from each of the three major market areas addressed; namely Storage, Wireless and Wireline Telecoms. Geographically, shipments into the Far East recorded the largest gain whilst across the customer base, the majority of the Group’s current top customers increased their spend.
Gross margin remained robust and drove gross profit 10% higher to £7.98m (2014: £7.22m). As previously communicated, the Group continued to invest in marketing, sales and support resources whilst simultaneously maintaining high levels of R&D investment. Distribution and administration costs increased to £6.62m (2014: £6.17m), delivering an operational profit (before share-based payments and finance income) of £1.54m (2014: £1.28m).
Other operating income, principally rental proceeds from commercial properties and regional engineering development grants, fell to £0.19m (2014: £0.22m).
Profit before taxation advanced by over 22% to £1.51m (2014: £1.24m) delivering a diluted earnings per share of 7.65p (2014: 5.84p).
Cash balances at 30 September 2015 stood at £12.26m which is a reduction on the 31 March 2015 position of £13.19m due mainly to the payment of a £1.12m dividend and the increased investment in development costs.
SummaRY
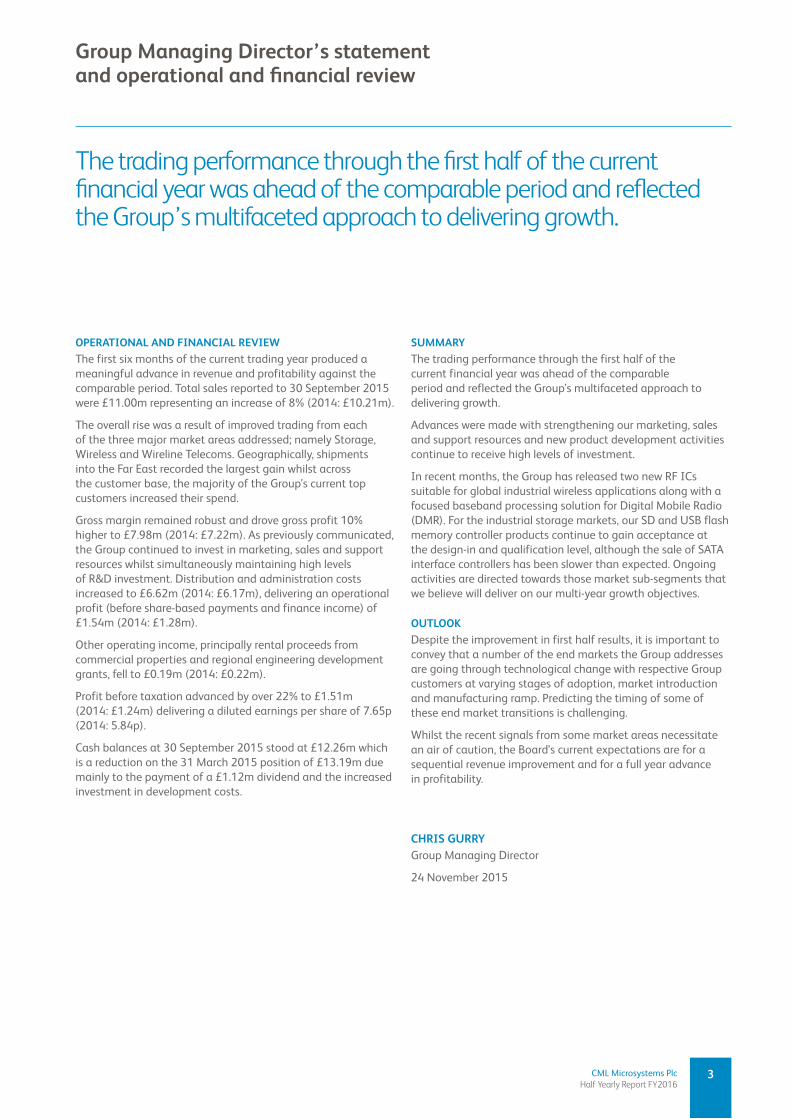
The trading performance through the first half of the current financial year was ahead of the comparable period and reflected the Group’s multifaceted approach to delivering growth.
Advances were made with strengthening our marketing, sales and support resources and new product development activities continue to receive high levels of investment.
In recent months, the Group has released two new RF ICs suitable for global industrial wireless applications along with a focused baseband processing solution for Digital Mobile Radio (DMR). For the industrial storage markets, our SD and USB flash memory controller products continue to gain acceptance at the design-in and qualification level, although the sale of SATA interface controllers has been slower than expected. Ongoing activities are directed towards those market sub-segments that we believe will deliver on our multi-year growth objectives.
OutlOOk
Despite the improvement in first half results, it is important to convey that a number of the end markets the Group addresses are going through technological change with respective Group customers at varying stages of adoption, market introduction and manufacturing ramp. Predicting the timing of some of these end market transitions is challenging.
Whilst the recent signals from some market areas necessitate an air of caution, the Board’s current expectations are for a sequential revenue improvement and for a full year advance in profitability.
CHRiS guRRYGroup Managing Director
24 November 2015
The trading performance through the first half of the current financial year was ahead of the comparable period and reflected the Group’s multifaceted approach to delivering growth.
group managing director’s statement and operational and financial review
4 CML Microsystems PlcHalf Yearly Report FY2016
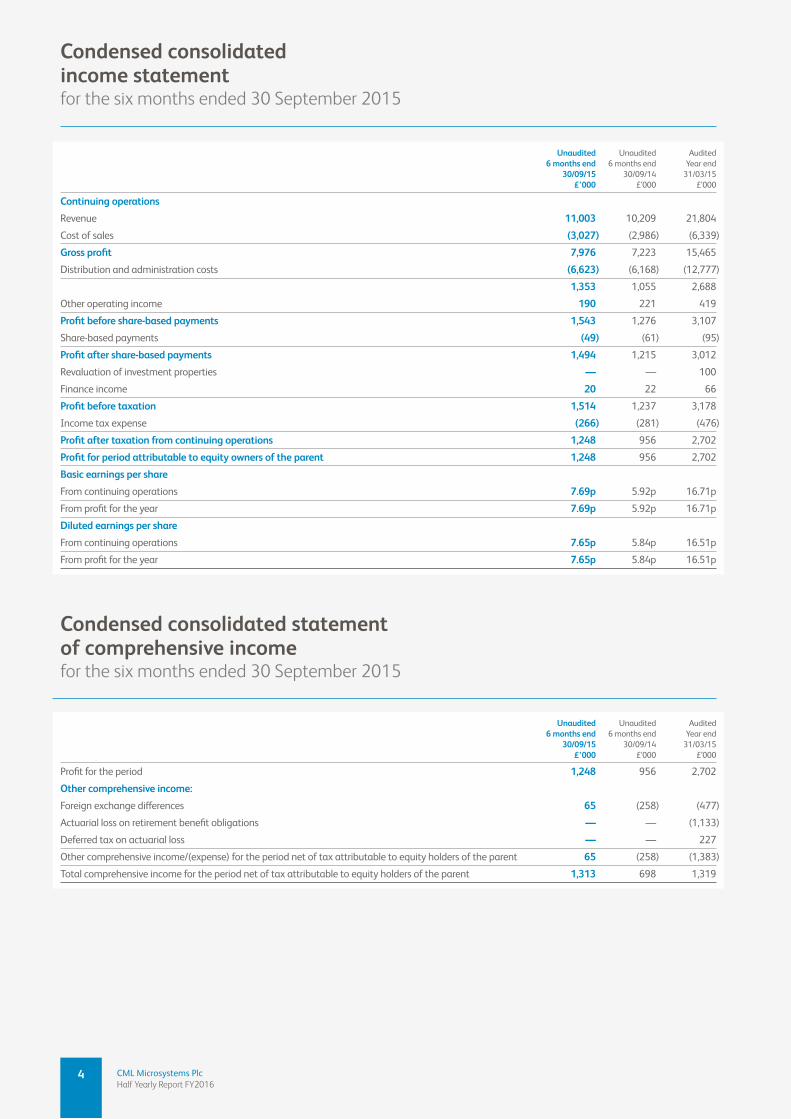
Condensed consolidated income statementfor the six months ended 30 September 2015
unaudited Unaudited Audited 6 months end 6 months end Year end 30/09/15 30/09/14 31/03/15 £’000 £’000 £’000
Continuing operations
Revenue 11,003 10,209 21,804
Cost of sales (3,027) (2,986) (6,339)
Gross profit 7,976 7,223 15,465
Distribution and administration costs (6,623) (6,168) (12,777)
1,353 1,055 2,688
Other operating income 190 221 419
Profit before share‑based payments 1,543 1,276 3,107
Share-based payments (49) (61) (95)
Profit after share‑based payments 1,494 1,215 3,012
Revaluation of investment properties — — 100
Finance income 20 22 66
Profit before taxation 1,514 1,237 3,178
Income tax expense (266) (281) (476)
Profit after taxation from continuing operations 1,248 956 2,702
Profit for period attributable to equity owners of the parent 1,248 956 2,702
Basic earnings per share
From continuing operations 7.69p 5.92p 16.71p
From profit for the year 7.69p 5.92p 16.71p
diluted earnings per share
From continuing operations 7.65p 5.84p 16.51p
From profit for the year 7.65p 5.84p 16.51p
Condensed consolidated statement of comprehensive incomefor the six months ended 30 September 2015
unaudited Unaudited Audited 6 months end 6 months end Year end 30/09/15 30/09/14 31/03/15 £’000 £’000 £’000
Profit for the period 1,248 956 2,702
Other comprehensive income:
Foreign exchange differences 65 (258) (477)
Actuarial loss on retirement benefit obligations — — (1,133)
Deferred tax on actuarial loss — — 227
Other comprehensive income/(expense) for the period net of tax attributable to equity holders of the parent 65 (258) (1,383)
Total comprehensive income for the period net of tax attributable to equity holders of the parent 1,313 698 1,319
5CML Microsystems PlcHalf Yearly Report FY2016
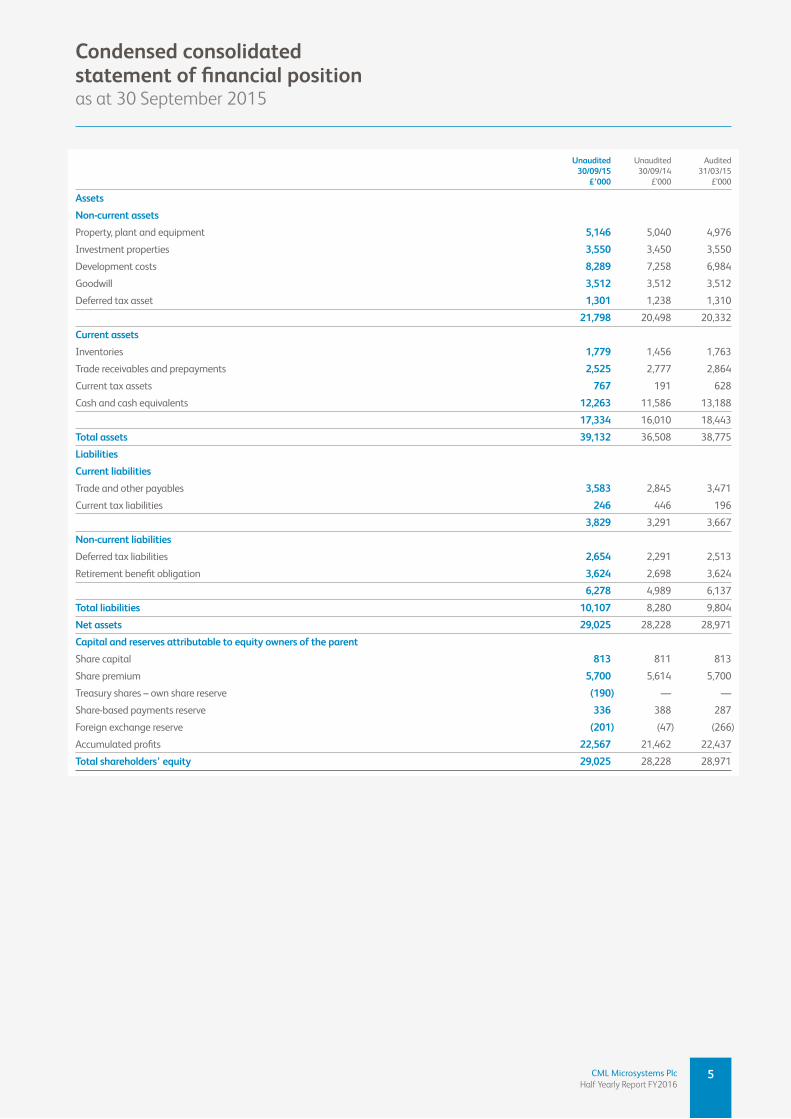
Condensed consolidated statement of financial positionas at 30 September 2015
unaudited Unaudited Audited 30/09/15 30/09/14 31/03/15 £’000 £’000 £’000
assets
Non-current assets
Property, plant and equipment 5,146 5,040 4,976
Investment properties 3,550 3,450 3,550
Development costs 8,289 7,258 6,984
Goodwill 3,512 3,512 3,512
Deferred tax asset 1,301 1,238 1,310
21,798 20,498 20,332
Current assets
Inventories 1,779 1,456 1,763
Trade receivables and prepayments 2,525 2,777 2,864
Current tax assets 767 191 628
Cash and cash equivalents 12,263 11,586 13,188
17,334 16,010 18,443
total assets 39,132 36,508 38,775
Liabilities
Current liabilities
Trade and other payables 3,583 2,845 3,471
Current tax liabilities 246 446 196
3,829 3,291 3,667
Non‑current liabilities
Deferred tax liabilities 2,654 2,291 2,513
Retirement benefit obligation 3,624 2,698 3,624
6,278 4,989 6,137
Total liabilities 10,107 8,280 9,804
Net assets 29,025 28,228 28,971
Capital and reserves attributable to equity owners of the parent
Share capital 813 811 813
Share premium 5,700 5,614 5,700
Treasury shares – own share reserve (190) — —
Share-based payments reserve 336 388 287
Foreign exchange reserve (201) (47) (266)
Accumulated profits 22,567 21,462 22,437
Total shareholders’ equity 29,025 28,228 28,971
6 CML Microsystems PlcHalf Yearly Report FY2016
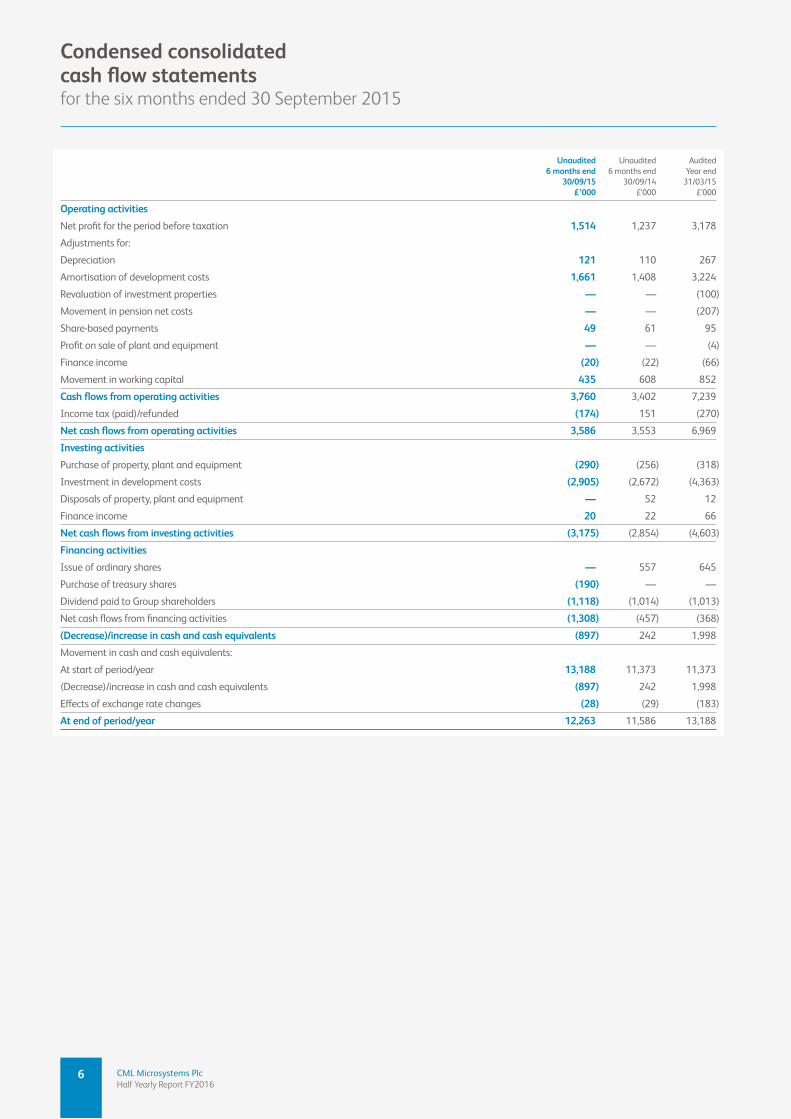
Condensed consolidated cash flow statementsfor the six months ended 30 September 2015
unaudited Unaudited Audited 6 months end 6 months end Year end 30/09/15 30/09/14 31/03/15 £’000 £’000 £’000
Operating activities
Net profit for the period before taxation 1,514 1,237 3,178
Adjustments for:
Depreciation 121 110 267
Amortisation of development costs 1,661 1,408 3,224
Revaluation of investment properties — — (100)
Movement in pension net costs — — (207)
Share-based payments 49 61 95
Profit on sale of plant and equipment — — (4)
Finance income (20) (22) (66)
Movement in working capital 435 608 852
Cash flows from operating activities 3,760 3,402 7,239
Income tax (paid)/refunded (174) 151 (270)
Net cash flows from operating activities 3,586 3,553 6,969
investing activities
Purchase of property, plant and equipment (290) (256) (318)
Investment in development costs (2,905) (2,672) (4,363)
Disposals of property, plant and equipment — 52 12
Finance income 20 22 66
Net cash flows from investing activities (3,175) (2,854) (4,603)
Financing activities
Issue of ordinary shares — 557 645
Purchase of treasury shares (190) — —
Dividend paid to Group shareholders (1,118) (1,014) (1,013)
Net cash flows from financing activities (1,308) (457) (368)
(Decrease)/increase in cash and cash equivalents (897) 242 1,998
Movement in cash and cash equivalents:
At start of period/year 13,188 11,373 11,373
(Decrease)/increase in cash and cash equivalents (897) 242 1,998
Effects of exchange rate changes (28) (29) (183)
At end of period/year 12,263 11,586 13,188
7CML Microsystems PlcHalf Yearly Report FY2016
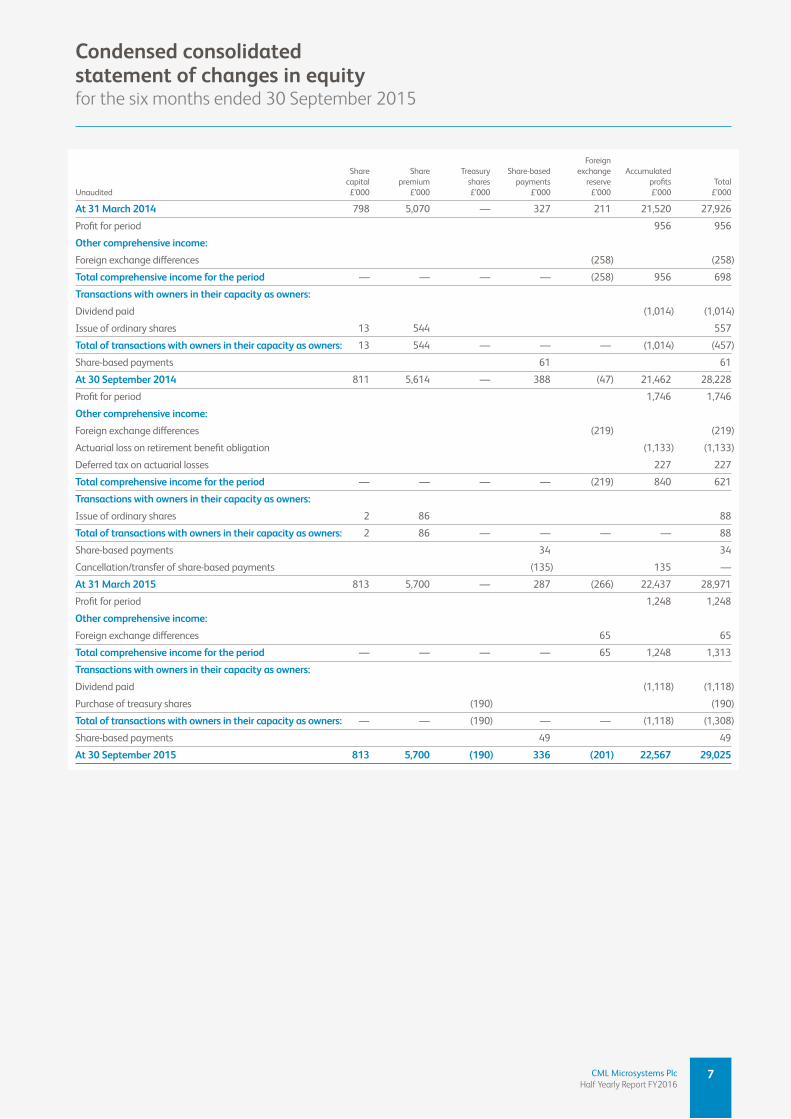
Condensed consolidated statement of changes in equityfor the six months ended 30 September 2015
Foreign Share Share Treasury Share-based exchange Accumulated capital premium shares payments reserve profits Total Unaudited £’000 £’000 £’000 £’000 £’000 £’000 £’000
at 31 march 2014 798 5,070 — 327 211 21,520 27,926
Profit for period 956 956
Other comprehensive income:
Foreign exchange differences (258) (258)
Total comprehensive income for the period — — — — (258) 956 698
Transactions with owners in their capacity as owners:
Dividend paid (1,014) (1,014)
Issue of ordinary shares 13 544 557
Total of transactions with owners in their capacity as owners: 13 544 — — — (1,014) (457)
Share-based payments 61 61
At 30 September 2014 811 5,614 — 388 (47) 21,462 28,228
Profit for period 1,746 1,746
Other comprehensive income:
Foreign exchange differences (219) (219)
Actuarial loss on retirement benefit obligation (1,133) (1,133)
Deferred tax on actuarial losses 227 227
Total comprehensive income for the period — — — — (219) 840 621
Transactions with owners in their capacity as owners:
Issue of ordinary shares 2 86 88
Total of transactions with owners in their capacity as owners: 2 86 — — — — 88
Share-based payments 34 34
Cancellation/transfer of share-based payments (135) 135 —
at 31 march 2015 813 5,700 — 287 (266) 22,437 28,971
Profit for period 1,248 1,248
Other comprehensive income:
Foreign exchange differences 65 65
Total comprehensive income for the period — — — — 65 1,248 1,313
Transactions with owners in their capacity as owners:
Dividend paid (1,118) (1,118)
Purchase of treasury shares (190) (190)
Total of transactions with owners in their capacity as owners: — — (190) — — (1,118) (1,308)
Share-based payments 49 49
At 30 September 2015 813 5,700 (190) 336 (201) 22,567 29,025
8 CML Microsystems PlcHalf Yearly Report FY2016
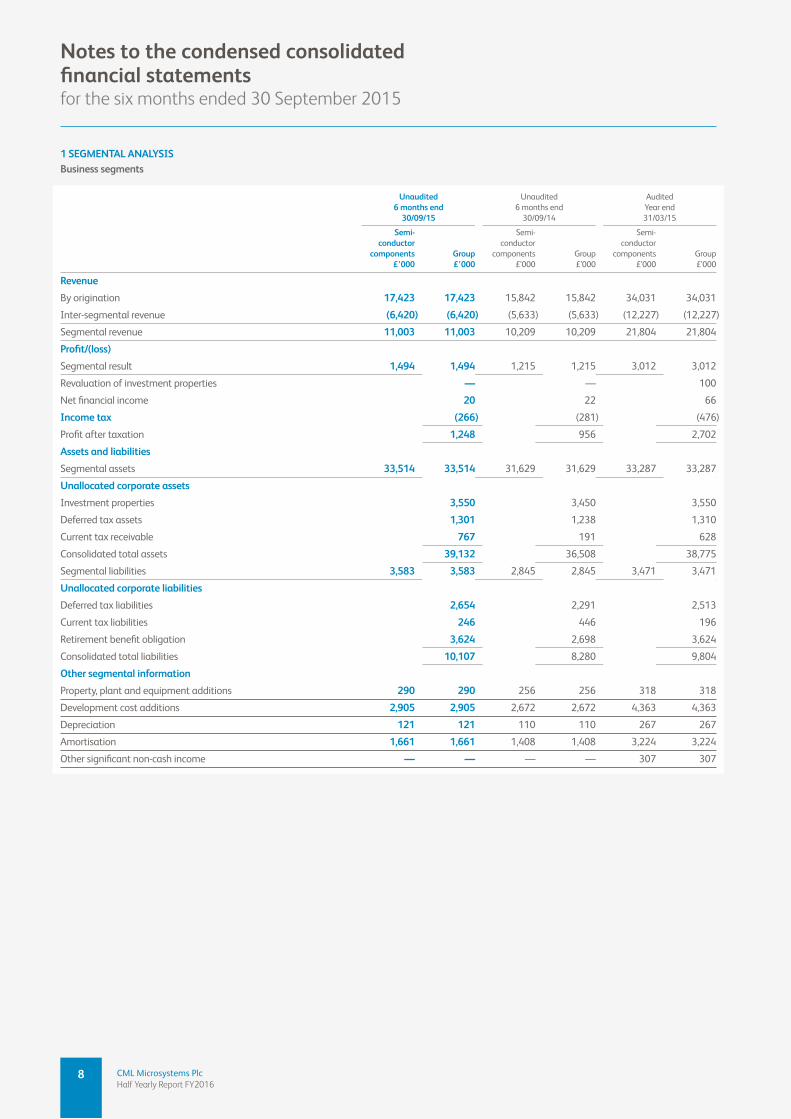
1 SegmeNtal aNalYSiSBusiness segments
unaudited Unaudited Audited 6 months end 6 months end Year end 30/09/15 30/09/14 31/03/15 Semi- Semi- Semi- conductor conductor conductor components group components Group components Group £’000 £’000 £’000 £’000 £’000 £’000
Revenue
By origination 17,423 17,423 15,842 15,842 34,031 34,031
Inter-segmental revenue (6,420) (6,420) (5,633) (5,633) (12,227) (12,227)
Segmental revenue 11,003 11,003 10,209 10,209 21,804 21,804
Profit/(loss)
Segmental result 1,494 1,494 1,215 1,215 3,012 3,012 Revaluation of investment properties — — 100
Net financial income 20 22 66
income tax (266) (281) (476) Profit after taxation 1,248 956 2,702 Assets and liabilities
Segmental assets 33,514 33,514 31,629 31,629 33,287 33,287 unallocated corporate assets
Investment properties 3,550 3,450 3,550
Deferred tax assets 1,301 1,238 1,310
Current tax receivable 767 191 628 Consolidated total assets 39,132 36,508 38,775 Segmental liabilities 3,583 3,583 2,845 2,845 3,471 3,471 Unallocated corporate liabilities
Deferred tax liabilities 2,654 2,291 2,513
Current tax liabilities 246 446 196
Retirement benefit obligation 3,624 2,698 3,624 Consolidated total liabilities 10,107 8,280 9,804 Other segmental information
Property, plant and equipment additions 290 290 256 256 318 318
Development cost additions 2,905 2,905 2,672 2,672 4,363 4,363
Depreciation 121 121 110 110 267 267
Amortisation 1,661 1,661 1,408 1,408 3,224 3,224
Other significant non-cash income — — — — 307 307
Notes to the condensed consolidated financial statementsfor the six months ended 30 September 2015
9CML Microsystems PlcHalf Yearly Report FY2016
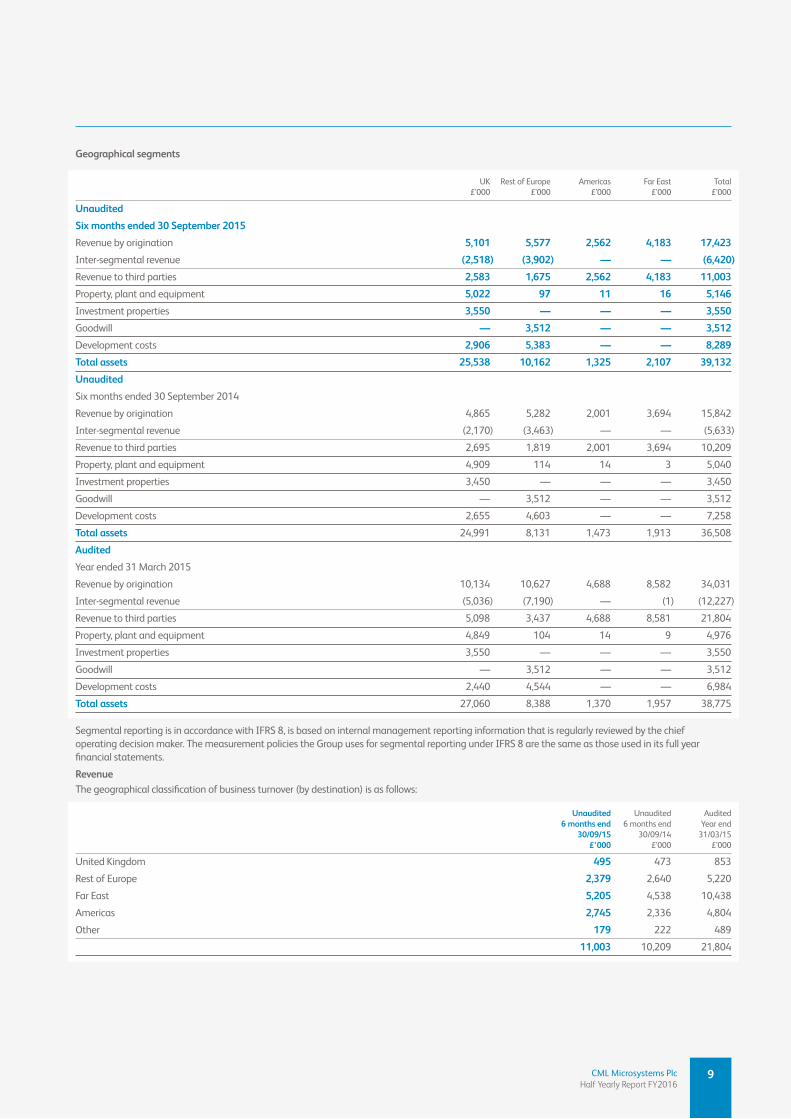
geographical segments
UK Rest of Europe Americas Far East Total £’000 £’000 £’000 £’000 £’000
unaudited
Six months ended 30 September 2015
Revenue by origination 5,101 5,577 2,562 4,183 17,423
Inter-segmental revenue (2,518) (3,902) — — (6,420)
Revenue to third parties 2,583 1,675 2,562 4,183 11,003
Property, plant and equipment 5,022 97 11 16 5,146
Investment properties 3,550 — — — 3,550
Goodwill — 3,512 — — 3,512
Development costs 2,906 5,383 — — 8,289
total assets 25,538 10,162 1,325 2,107 39,132
unaudited
Six months ended 30 September 2014
Revenue by origination 4,865 5,282 2,001 3,694 15,842
Inter-segmental revenue (2,170) (3,463) — — (5,633)
Revenue to third parties 2,695 1,819 2,001 3,694 10,209
Property, plant and equipment 4,909 114 14 3 5,040
Investment properties 3,450 — — — 3,450
Goodwill — 3,512 — — 3,512
Development costs 2,655 4,603 — — 7,258
total assets 24,991 8,131 1,473 1,913 36,508
audited
Year ended 31 March 2015
Revenue by origination 10,134 10,627 4,688 8,582 34,031
Inter-segmental revenue (5,036) (7,190) — (1) (12,227)
Revenue to third parties 5,098 3,437 4,688 8,581 21,804
Property, plant and equipment 4,849 104 14 9 4,976
Investment properties 3,550 — — — 3,550
Goodwill — 3,512 — — 3,512
Development costs 2,440 4,544 — — 6,984
total assets 27,060 8,388 1,370 1,957 38,775
Segmental reporting is in accordance with IFRS 8, is based on internal management reporting information that is regularly reviewed by the chief operating decision maker. The measurement policies the Group uses for segmental reporting under IFRS 8 are the same as those used in its full year financial statements.
RevenueThe geographical classification of business turnover (by destination) is as follows:
unaudited Unaudited Audited 6 months end 6 months end Year end 30/09/15 30/09/14 31/03/15 £’000 £’000 £’000
United Kingdom 495 473 853
Rest of Europe 2,379 2,640 5,220
Far East 5,205 4,538 10,438
Americas 2,745 2,336 4,804
Other 179 222 489
11,003 10,209 21,804
10 CML Microsystems PlcHalf Yearly Report FY2016
Notes to the condensed consolidated financial statements continuedfor the six months ended 30 September 2015
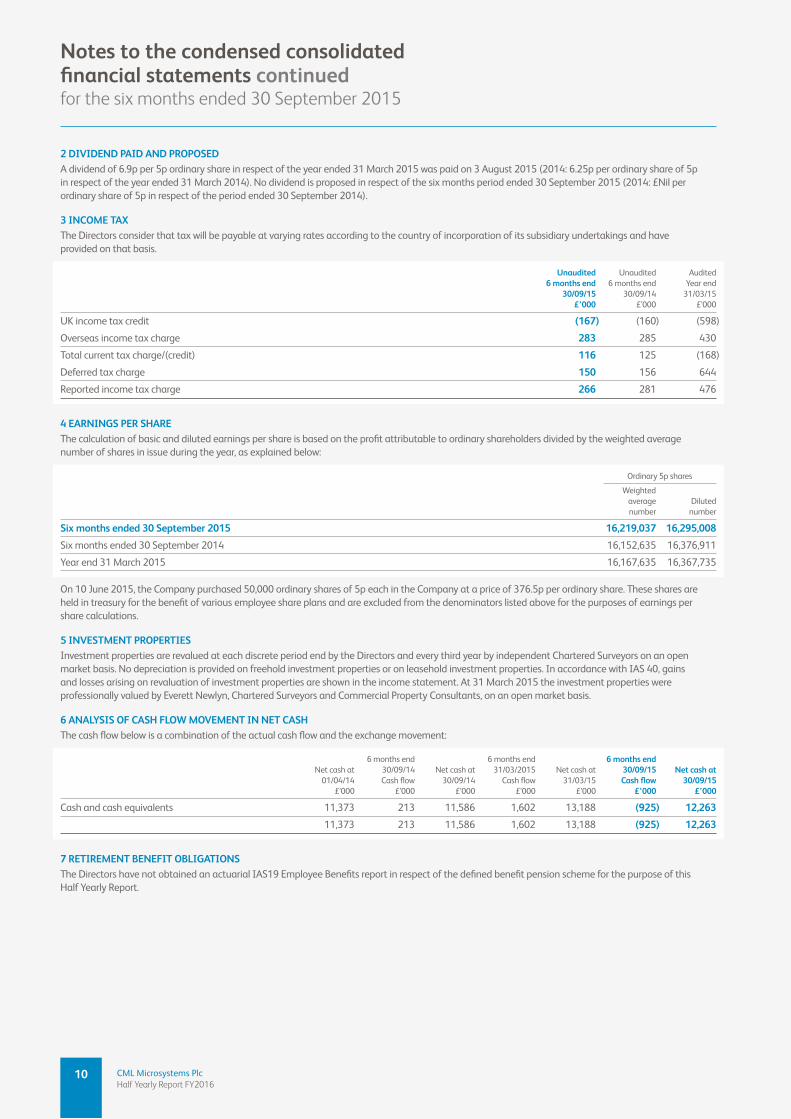
2 divideNd paid aNd pROpOSed A dividend of 6.9p per 5p ordinary share in respect of the year ended 31 March 2015 was paid on 3 August 2015 (2014: 6.25p per ordinary share of 5p in respect of the year ended 31 March 2014). No dividend is proposed in respect of the six months period ended 30 September 2015 (2014: £Nil per ordinary share of 5p in respect of the period ended 30 September 2014).
3 iNCOme taxThe Directors consider that tax will be payable at varying rates according to the country of incorporation of its subsidiary undertakings and have provided on that basis.
unaudited Unaudited Audited 6 months end 6 months end Year end 30/09/15 30/09/14 31/03/15 £’000 £’000 £’000
UK income tax credit (167) (160) (598)
Overseas income tax charge 283 285 430
Total current tax charge/(credit) 116 125 (168)
Deferred tax charge 150 156 644
Reported income tax charge 266 281 476
4 eaRNiNgS peR SHaReThe calculation of basic and diluted earnings per share is based on the profit attributable to ordinary shareholders divided by the weighted average number of shares in issue during the year, as explained below:
Ordinary 5p shares
Weighted average Diluted number number
Six months ended 30 September 2015 16,219,037 16,295,008
Six months ended 30 September 2014 16,152,635 16,376,911
Year end 31 March 2015 16,167,635 16,367,735
On 10 June 2015, the Company purchased 50,000 ordinary shares of 5p each in the Company at a price of 376.5p per ordinary share. These shares are held in treasury for the benefit of various employee share plans and are excluded from the denominators listed above for the purposes of earnings per share calculations.
5 iNveStmeNt pROpeRtieSInvestment properties are revalued at each discrete period end by the Directors and every third year by independent Chartered Surveyors on an open market basis. No depreciation is provided on freehold investment properties or on leasehold investment properties. In accordance with IAS 40, gains and losses arising on revaluation of investment properties are shown in the income statement. At 31 March 2015 the investment properties were professionally valued by Everett Newlyn, Chartered Surveyors and Commercial Property Consultants, on an open market basis.
6 aNalYSiS OF CaSH FlOw mOvemeNt iN Net CaSHThe cash flow below is a combination of the actual cash flow and the exchange movement:
6 months end 6 months end 6 months end Net cash at 30/09/14 Net cash at 31/03/2015 Net cash at 30/09/15 Net cash at 01/04/14 Cash flow 30/09/14 Cash flow 31/03/15 Cash flow 30/09/15 £’000 £’000 £’000 £’000 £’000 £’000 £’000
Cash and cash equivalents 11,373 213 11,586 1,602 13,188 (925) 12,263
11,373 213 11,586 1,602 13,188 (925) 12,263
7 RetiRemeNt BeNeFit OBligatiONSThe Directors have not obtained an actuarial IAS19 Employee Benefits report in respect of the defined benefit pension scheme for the purpose of this Half Yearly Report.
11CML Microsystems PlcHalf Yearly Report FY2016
8 pRiNCipal RiSkS aNd uNCeRtaiNtieSKey risks of a financial natureThe principal risks and uncertainties facing the Group are with foreign currencies and customer dependency. With the majority of the Group’s earnings being linked to the US Dollar, a decline in this currency would have a direct effect on revenue, although since the majority of the cost of sales are also linked to the US Dollar, this risk is reduced at the gross profit line. Additionally, though the Group has a very diverse customer base in certain market segments, key customers can represent a significant amount of revenue. Key customer relationships are closely monitored; however changes in buying patterns of a key customer could have an adverse effect on the Group’s performance.
Key risks of a non‑financial natureThe Group is a small player operating in a highly-competitive global market, which is undergoing continual geographical change. The Group’s ability to respond to many competitive factors including, but not limited to pricing, technological innovations, product quality, customer service, manufacturing capabilities and employment of qualified personnel will be key in the achievement of its objectives, but its ultimate success will depend on the demand for its customers’ products since the Group is a component supplier.
A substantial proportion of the Group’s revenue and earnings are derived from outside the UK and so the Group’s ability to achieve its financial objectives could be impacted by risks and uncertainties associated with local legal requirements, the enforceability of laws and contracts, changes in the tax laws, terrorist activities, natural disasters or health epidemics.
9 diReCtORS’ StatemeNt puRSuaNt tO tHe diSClOSuRe aNd tRaNSpaReNCY RuleSThe Directors confirm that, to the best of their knowledge:
a) the condensed financial statements, prepared in accordance with IFRS as adopted by the EU give a true and fair view of the assets, liabilities, financial position and profit of the Group and the undertakings included in the consolidation taken as a whole; and
b) the condensed set of financial statements have been prepared in accordance with IAS 34 Interim Financial Reporting; and
c) the Chairman’s statement and Group Managing Director’s statement and operational and financial review include a fair review of the development and performance of the business and the position of the Company and the undertakings included in the consolidation taken as a whole together with a description of the principal risks and uncertainties that they face.
The Directors are also responsible for the maintenance and integrity of the CML Microsystems Plc website. Legislation in the UK governing the preparation and dissemination of the financial statements may differ from legislation in other jurisdictions.
10 BaSiS OF pRepaRatiONThe basis of preparation and accounting policies used in preparation of the Half Yearly Financial Report are the same accounting policies set out in the year ended 31 March 2015 financial statements.
11 geNeRal Other than already stated within the Chairman’s statement and Group Managing Director’s statement and operational and financial review there have been no important events during the first six months of the financial year that have impacted this Half Yearly Financial Report.
There have been no related party transactions or changes in related party transactions described in the latest Annual Report that could have a material effect on the financial position or performance of the Group in the first six months of the financial year.
The principal risks and uncertainties within the business are contained within this report in note 8 above.
In the segmental analysis (note 1) inter-segmental transfers or transactions are entered into under commercial terms and conditions appropriate to the location of the entity whilst considering that the parties are related.
This Half Yearly Financial Report includes a fair review of the information required by DTR 4.2.7/8 (indication of important events and their impact, and description of principal risks and uncertainties for the remaining six months of the financial year).
This Half Yearly Financial Report does not include all the information and disclosures required in the Annual Report, and should be read in conjunction with the consolidated Annual Report for the year ended 31 March 2015.
The financial information contained in this Half Yearly Financial Report has been prepared using International Financial Reporting Standards as adopted by the European Union. This Half Yearly Financial Report does not constitute statutory accounts as defined by Section 434 of the Companies Act 2006. The financial information for the year ended 31 March 2015 is based on the statutory accounts for the financial year ended 31 March 2015 that have been filed with the Registrar of Companies and on which the Auditor gave an unqualified audit opinion.
The Auditor’s report on those accounts did not contain a statement under Section 498(2) or (3) of the Companies Act 2006. This Half Yearly Financial Report has not been audited or reviewed by the Group Auditor.
A copy of this Half Yearly Financial Report can be viewed on the Company website www.cmlmicroplc.com.
12 appROvalSThe Directors approved this Half Yearly Report on 24 November 2015.
12 CML Microsystems PlcHalf Yearly Report FY2016
Glossary
dmR digital mobile radio
eu European Union
iaS International Accounting Standard
iC integrated circuit
iFRS International Financial Reporting Standards
R&d research and development
RF radio frequency
Sata serial ATA interface
Sd secure digital
uSB universal serial bus
Visit us online at
cmlmicroplc.com
CML Microsystems PlcOval Park, Langford
Maldon, EssexCM9 6WG
T: +44 (0)1621 875500F: +44 (0)1621 875606