Module 2 Slide deck: Lessons in using (and misusing) California’s Child Welfare data

Stop Misusing Higher
Education-Specific Price Indices
Andrew Gillen
Jonathan Robe
Center for College Affordability and Productivity
A Policy Paper from the
Center for College Affordability and Productivity
March 2011

ii
About the Authors Andrew Gillen is the Research Director at the Center for College Affordability and Productivity. He received his PhD in Economics from Florida State University. He may be reached by email at [email protected]. Jonathan Robe is a Research Associate at the Center for College Affordability and Productivity. He may be reached by email at [email protected]. Center for College Affordability and Productivity The Center for College Affordability and Productivity (CCAP) is an independent, nonprofit research center based in Washington, DC that is dedicated to researching public policy and economic issues relating to postsecondary education. CCAP aims to facilitate a broader dialogue that challenges conventional thinking about costs, efficiency and innovation in postsecondary education in the United States. 1150 17th Street NW #910 Tel: (202) 375-7831 www.centerforcollegeaffordability.org Washington, DC 22036 Fax: (202) 375-7821 www.collegeaffordability.blogspot.com

iii
Table of Contents
Introduction .............................................................................................................................. 1
What is the Purpose of a Price Index? ................................................................................... 1
Limits on the Uses of Price Indices ........................................................................................ 1
HEPI and HECA ..................................................................................................................... 2
Higher Education Price Index (HEPI).................................................................................. 2
Higher Education Cost Adjustment (HECA) ........................................................................ 3
The Use (and Misuse) of HEPI and HECA .............................................................................. 4
Misuse: Adjusting Tuition for Inflation ..................................................................................... 4
Frame of Reference ........................................................................................................... 4
Confusing What Happened with an Argument for Why ....................................................... 4
A Simple Example .............................................................................................................. 5
Is it That Big of a Deal? ...................................................................................................... 6
Proper Use: Internal Budget Planning .................................................................................... 7
HEPI and HECA Suffer from Systematic Biases .................................................................... 8
Quality Bias ............................................................................................................................ 8
Productivity Bias....................................................................................................................10
Substitution Bias ...................................................................................................................11
HEPI is Self-Referential .........................................................................................................12
Conclusion ..............................................................................................................................13
References ..............................................................................................................................15
Appendix .................................................................................................................................17

Introduction Over the past half century, college costs (measured either by direct institutional expenditures or by tuition charges) have soared. To understand these trends, it is usually important to isolate the increases that are due to inflation in general as opposed to inflation in higher education. Some have argued that only higher education specific price indices—not broad based price indices—should be used for examining the rise in college costs over time because they are specially designed to accurately reflect the spending patterns of colleges and universities. While higher education specific price indices are useful for some purposes, such as internal budgeting, they are often misused. For instance, these indices are commonly used to adjust tuition levels over time, a task for which an industry specific price index is inappropriate. A wise man once noted that “the most common misuse of price indexes is to apply them to data or situations they were not designed to cover.”1 The author of that statement was none other than Dr. D. Kent Halstead, father of the Higher Education Price Index, which he created because he viewed the use of the Consumer Price Index as inappropriate in some situations. In a cruel twist of fate, his creation (and its offspring), are now the price indices that are routinely misused. These higher education specific indices are also subject to quality, productivity, and substitution biases, and in one instance, are self-referential. Although these indices do serve a limited function, most publicly available examples of their use are inappropriate. What is the Purpose of a Price Index?
A price index makes possible valid comparisons of the price of goods and services across time. Comparing, for example, the cost of a newspaper in the 1950s to the cost of a newspaper today is an “apples to oranges” comparison because the purchasing power of a dollar today is significantly different than it was in 1950. Adjusting the historical figures for inflation through the use of a price index allows for an “apples to apples” comparison. Essentially, the price index holds the purchasing power of a dollar constant over time to reveal any changes in the “real” cost of goods or services. Perhaps the best known and most widely used price index is the Consumer Price Index (CPI), calculated and published by the U.S. Bureau of Labor Statistics (BLS). The CPI measures the change in the overall price level over time for a group (called a basket) of consumer goods and services (such as food, housing, clothing, education, and medical services).2
Limits on the Uses of Price Indices
There are limits to the appropriate use of any given price index. For example, in calculating the change over time in prices paid by producers (that is, a change in the cost of inputs) it would be inappropriate to use the CPI since it focuses on goods and services that consumers buy. It would probably be preferable to use the Producer Price Index (PPI), also published by the BLS. While the PPI may be appropriate in this
1 D. Kent Halstead, Higher Education Prices and Price Indexes, Washington DC: U.S. Office of Education, 1975. 2 For a complete list of all expenditure categories included in the calculation of the CPI, see U.S. Bureau of Labor Statistics, “CPI Detailed Report: Data for September 2010,” Table 1. Washington DC: Bureau of Labor Statistics, 2010. The current and archived versions of this report are available at the BLS website: http://www.bls.gov/cpi/cpi_dr.htm. Accessed October 20, 2010.

Stop Misusing Higher Education Specific Price Indices
2
case, it is in turn of limited usefulness in others since it is not a measure of general inflation. To compare the cost of the output (as opposed to the inputs) over time, or the cost of inputs compared to other items, a commonly used measure of general inflation such as the CPI will need to be used.3 HEPI and HECA
As noted above, it may be possible to develop a more useful price index than the CPI for the task at hand. Within higher education, two such alternative price indices have been developed, the Higher Education Price Index (HEPI) and the Higher Education Cost Adjustment (HECA). Of these two, HEPI was developed first. Although there are important differences between the two indices and the methodologies employed to compute them, the underlying rationale for both is that a price index based on the spending patterns of colleges and universities is more appropriate than an index based on a broader range of goods and services purchased by consumers. The Commonfund Institute, which maintains the HEPI, argues that because the HEPI accounts for the difference in purchasing patterns between the higher education industry and consumers at large, it provides a “more accurate indicator of cost changes for colleges and universities.”4 A similar case is made for the HECA as well.5 This is a valid point, and HEPI and HECA can be useful indices in certain circumstances. However, while it is true that the goods and services purchased by institutions of higher education are not the same as those purchased by consumers, this fact does not imply that indices which account for these differences are necessarily superior to the CPI in measuring price changes in higher education for all purposes. As we document later on, there are legitimate uses of both HEPI and HECA, but there are illegitimate uses as well. Before getting into the details it is necessary to briefly review how the HEPI and HECA were developed and how they are calculated. Higher Education Price Index (HEPI)
Dr. D. Kent Halstead is credited with first developing the HEPI for the U.S. Department of Health, Education and Welfare (the precursor to the Department of Education) in 1975. Halstead argued that colleges and universities needed a new price index which more closely matched their expenditure patterns, going so far as to declare such an index to be “far superior to substitute proxy indexes such as the Consumer Price Index or the gross national product (GNP) explicit deflator which are intended for entirely different purposes.”6 Throughout the years, Halstead continued to update the HEPI.7 Since 2005, HEPI has been maintained by the Commonfund Institute, and it relies upon eight separate “cost factors” to construct the overall index. These factors are: faculty salaries, administrative salaries, clerical salaries, service employee salaries, fringe benefits, miscellaneous services, supplies and materials,
3 Another general measure of inflation that is gaining in acceptance is the Personal Consumption Expenditures (PCE), published by the Bureau of Economic Analysis. 4 Commonfund Institute, “2010 HEPI Update,” Commonfund, 2010, p. 2. 5 State Higher Education Executives Organization, “State Higher Education Finance FY 2009: Technical Paper A,” Washington DC: State Higher Education Executives Organization, 2010. 6 D. Kent Halstead, Higher Education Prices and Price Indexes, Washington DC: U.S. Department of Education, 1975, p. 4. 7 See, for instance, D. Kent Halstead, Higher Education Prices and Price Indexes 1975 Supplement, Washington DC: U.S. Office of Education, 1976 and D. Kent Halstead, Inflation Measures for Schools and Colleges, Washington DC: U.S. Department of Education, 1983.

Stop Misusing Higher Education Specific Price Indices
3
and utilities.8 The weighting of each expenditure category is determined by regression analysis (though it appears as though a sample of just 41 colleges is used) that essentially reports the share of total spending for each category. The heaviest weights accompany faculty and clerical salaries and fringe benefits, reflecting their relatively large share in college and university budgets. Higher Education Cost Adjustment (HECA) As we will discuss in more detail later, one of the principal criticisms of the HEPI is that it is self-referential. To address this as well as other concerns, the State Higher Education Executives Officers (SHEEO) created the Higher Education Cost Adjustment (HECA) as an alternate measure to account for the difference between the goods and services purchased by consumers and those purchased by higher education institutions. The calculation of HECA depends on only two factors, both of which are separate price indices published by the federal government. The first factor, which measures changes in labor costs, is the Employment Cost Index (ECI) for management, professional, and related occupations (not seasonally adjusted) which is published by the BLS.9 The second factor, which measures changes in the prices of goods and services purchased by schools, is the GDP Implicit Price Deflator (GDP IPD), published by the Bureau of Economic Analysis (BEA). HECA weights the ECI at 75 percent and the GDP IPD at 25 percent, on the logic that colleges and universities spend about 75 percent of their budgets on labor and 25 percent on goods and services.10 Whatever the differences between HEPI and HECA, there is no fundamental difference in the philosophical approach that either index takes to measuring trends in the real cost of higher education. Far from questioning the fundamental approach the HEPI takes, the creators of HECA try to correct for problems with the HEPI (such as the self-referential issue) ) by conforming to what they view as the “professional standards for price indexing.”11 Both indices assume that faculty and staff salaries are the major drivers of higher education expenditures and that this needs to be accounted for in any proper analysis of the rise in the real cost of college over time. It is helpful to break down our criticisms of HEPI and HECA into two broad categories: widespread misuse and sources of bias. (It should be noted that we are using the term bias in the statistical sense of deviation from the true value, not in the sense of prejudice or favoritism.) In addition, as the misuse of published material by others is, in most cases, not necessarily the fault of the publisher, unless otherwise noted, our criticisms should not be construed as directed against the makers of HEPI and HECA. Instead, we are pointing out the limits of the indices' appropriate use and how they are often misused in practice, as well as highlighting more general problems of which their users should be aware.
8 Commonfund Institute, “2010 HEPI Update,” Commonfund, 2010, p. 5. 9 Until 2006, HECA relied upon the ECI for white collar workers (excluding sales) but this index was discontinued by the Bureau of Labor Statistics in March 2006. 10 State Higher Education Executives Organization, “State Higher Education Finance FY 2009: Technical Paper A,” Washington DC: State Higher Education Executives Organization, 2010. 11 Ibid.

Stop Misusing Higher Education Specific Price Indices
4
The Use (and Misuse) of HEPI and HECA It is worthwhile to recall that both HEPI and HECA attempt to measure the change in the cost of providing an education by measuring the cost of inputs which institutions use in providing a college education. Both indices do so by measuring the change in the cost of a basket of those inputs over time. Given this, there are certain purposes for which HEPI and HECA are appropriate indices to use, and many others where their use is inappropriate. Misuse: Adjusting Tuition for Inflation
Perhaps the most common misuse of HEPI and HECA is to adjust tuition levels for inflation. The question of how tuition 20 years ago compares to tuition today simply cannot be answered by the HEPI and HECA because they are not designed to measure inflation in general but rather just inflation of higher education inputs. The distinction is subtle but important. Unfortunately, the most frequent public use of the HEPI and HECA is to discount tuition rates over time and then to argue that real tuition has not been increasing as much as other price indices, such as the CPI, would indicate. This is completely inappropriate because it does not allow for a common frame of reference and because it confuses what happened with an argument for why it happened.
Frame of Reference
The main use of price indices is to allow for valid comparisons of values from different years and also to allow for comparisons across sectors. For instance, we want to know not only how the price of computers has evolved over time, but also how that price evolution compares to the price evolution of other items, such as automobiles or televisions. We cannot evaluate that if we use an industry specific price index for computers. By using a price index that is specific to higher education, the HEPI and HECA make it impossible to compare figures for higher education to figures for other sectors of the economy, and this greatly limits their usefulness. In other words, telling someone that HEPI adjusted tuition in 2008 was $4,355 in 1990 dollars yields no useful information because nothing else is adjusted using the HEPI; the figure therefore lacks context. In contrast, telling someone that tuition in 2008 was $5,046 in 1990 dollars after adjusting for inflation using the CPI puts the figure in a context that we can all understand because everything else is adjusted using the CPI as well. This allows for comparisons over time and between higher education and other sectors. Confusing What Happened with an Argument for Why
To describe the evolution of college tuition over time in a meaningful way, it is necessary to adjust for inflation using the CPI or another broad based price index (such as the GDP IPD) in order to compare tuition to non-tuition items. Only then can the HEPI or HECA be used to attempt to explain why tuition grew more or less slowly than other variables that were also adjusted using the CPI. In other words, one must first use the CPI to establish what happened (e.g., tuition went up by 5%) and only then use the HEPI or HECA to argue why it happened (e.g., tuition went up 5% in part because the price of inputs for higher education went up 4%). Of course, this line of argument requires additional assumptions and is therefore open to additional scrutiny. For instance, why should an increase in an input such as the cost of conducting research necessarily lead to an increase in tuition?

Stop Misusing Higher Education Specific Price Indices
5
A Simple Example
To illustrate how inappropriate it is to use the HEPI and HECA to adjust tuition levels, imagine for a moment that the oil industry created a Gasoline Cost Index (GCI) to try to explain changes in the price of gasoline by constructing an index that adjusts for the costs to produce gasoline. The only product used in its calculation is the price of a barrel of oil. The oil industry then claims that the GCI can be used to convert historical figures on the price of gas into “real” inflation adjusted terms. Doing so results in the blue dashed line in Figure 1. Now imagine the oil industry issuing press releases “showing” that the price of gas declined from $3.56 in 2001 to $2.16 in 2008. As we all know, this is absolutely absurd. Over this time period, the price of gas relative to other goods and services increased, rather than decreased. In fact, when the price of gas is adjusted using an appropriate broad-based price index (the CPI), that is exactly what we see. The solid red line shows that when using the CPI to adjust for inflation, the price of gas rose from $1.85 in 2001 to $3.68 in 2008.
As this example demonstrates, inappropriately using an industry specific input based price index such as the GCI, HEPI, or HECA can lead to flawed depictions of price trends that do not reflect reality. Their use in these contexts is a poor choice, especially considering the ease with which more appropriate price indices are available.
$1.50
$2.00
$2.50
$3.00
$3.50
$4.00
2001 2002 2003 2004 2005 2006 2007 2008
Real Price of Gas - GCI Real price of Gas - CPI
FIGURE 1THE “REAL” PRICE OF GAS:
ILLUSTRATING THE DANGERS OF AN INDUSTRY-SPECIFIC INPUT BASED PRICE INDEX
SOURCES: Nominal Gas Prices and CPI figures come from the Bureau of Labor Statistics, the nominal price of a barrel of oil come from inflationdata.com.

Stop Misusing Higher Education Specific Price Indices
6
Is it That Big of a Deal?
Some people may argue that while the points above are technically true, it doesn‟t really matter that much since inflation rates as measured by the CPI, HEPI, and HECA are all generally pretty close. As Table 1 shows, on average, they have differed by less than 0.9% per year over the past two decades. The problem with this line of reasoning is that, due to compounding, over time those small differences add up. Consider two recent examples from the literature that document just how much small yearly differences can make when compounded year after year. The first example concerns the poverty rate, or the percentage of individuals whose income is below the poverty line. The U.S. Census Bureau, which calculates the official government statistics on poverty in the United States, uses the CPI to update the poverty line on an annual basis.12 Official statistics report that the poverty rate has changed very little over the past forty years, but for much of this time, the CPI systemically overstated inflation by ignoring, among other things, substitution away from goods that increase more in price. Therefore, the official poverty rate
tends to overstate poverty because prices have not been rising as fast as the [CPI] suggests... If we use the chained CPI instead—allowing for substitution at both the lower and higher levels of aggregation—the poverty rate in 2005 is 25 percent lower than the official statistic. If we make a further adjustment to the poverty thresholds by taking into account the value of improved quality and new goods… poverty rates in 2005 fall to less than half the rate in the official statistics.13
While the difference between using the original CPI and the chained and quality adjusted CPI is small for any given year (less than 1% difference in reported inflation), over 40 years, this leads to estimates of the prevalence of poverty that differ by a factor of two. The second illustration of how small differences add up concerns wages. When using the CPI to adjust for inflation, between 1975 and 2005 average hourly earnings as reported in micro surveys fell by 4 percent. But at the macro level, income per hour increased by 39% over the same time frame.14 A large part of the difference is attributable to the fact that different price indices are used. The micro data tend to use the CPI, while the macro data use the Personal Consumption Expenditures (PCE) Deflator.15
12 See U.S. Census Bureau, “How the Census Bureau Measures Poverty,” Census.gov, September 16, 2010, available at http://www.census.gov/hhes/www/poverty/about/overview/measure.html/. Accessed November 10, 2010. 13 Christian Broda, Ephraim Leibtag, and David E. Weinstein, “The Role of Prices in Measuring the Poor‟s Living Standards,” Journal of Economic Perspectives, 23:2, Spring 2009. 14 Terry J. Fitzgerald, “Has Middle America Stagnated?” The Region, September 2007.
TABLE 1
AVERAGE INFLATION RATES AS REPORTED BY THE CPI, HEPI, AND HECA
Price Index Average Annual Inflation Rate from 1990-2009
CPI 2.80% HECA 3.23% HEPI 3.68%
SOURCES: Commonfund Institute, SHEEO‟s State Higher
Education Finance (various years), and BLS.

Stop Misusing Higher Education Specific Price Indices
7
While the difference between these figures was relatively small (about 0.5% per year), over a 30 year period, those small differences added up. When using the PCE deflator for the micro series, average hourly earnings increased by 10% between 1975 and 2005, erasing about a third of difference.16 As should be clear from these examples, small differences in any given year can add up to large differences over many years. That is precisely what we see with the CPI, HEPI, and HECA. Figure 2 shows average undergraduate tuition in the US from 1990 to 2009 adjusted by the CPI, HEPI and HECA. The HEPI and HECA adjusted figures systematically understate the true increase in tuition over time. Specifically, the HEPI understates real tuition (relative to the CPI) by 17% in 2009 while the HECA overstates it by 8% in the same year. Over the entire twenty year period, while the CPI indicates real tuition increased by 86%, the HECA indicates it went up by a significantly lower 72% and the HEPI by only 59%. To be sure, the HEPI and HECA are not the only price indices that are used inappropriately. For instance, although the BLS has for a number of years stressed that the CPI is not a cost-of-living index (it is a fixed weight index), many people still treat it as such.17 The difference between the misuse of the CPI and the misuse of the HEPI and HECA is that the CPI is the closest thing we have to a cost-of-living index, whereas the HEPI and HECA are not the closest things we have to a measure of general inflation. Proper Use: Internal Budget Planning
While it is clear that it is inappropriate to use industry specific price indices such as the HEPI and HECA in some contexts, their use is still justified in others, as even the staunchest critics of the HEPI have acknowledged.18 One such legitimate application is budget planning because administrators tasked with estimating future budget requirements will find an industry specific price index more useful than a broad-based index such as the CPI in assessing likely future costs. This is because the industry specific index is a closer match to actual spending patterns of the institutions. If the rate of change in prices between the things colleges buy and all the other items in the economy is different, then the industry specific price index will give a more accurate picture of budgetary requirements. However, some people may extend this legitimate use of HEPI and HECA into the illegitimate realm by arguing that a HEPI or HECA forecast of a 5% increase in costs somehow requires universities to obtain 5% more revenue from tuition and state appropriations. This is wrong. A mechanical calculation of the cost of maintaining the status quo does not in any way legitimize the status quo. If a university is spending money inappropriately, forecasts of future revenue needs using HECA and HEPI will merely report an estimate of the budget needed to continue wasting money.
15 The CPI uses the prices of a fixed basket of goods to find the inflation rate, while the PCE uses what consumers actually bought. 16 Fitzgerald, “Has Middle America Stagnated?” The remaining difference is largely accounted for by the inclusion of benefits (which average hourly earnings do not count), and the fact that the macro data includes all workers, while the micro data contains most of the lower paid jobs, but not all high paying jobs. 17 Robert A. Pollak, “The Consumer Price Index: A Research Agenda and Three Proposals,” Journal of Economic Perspectives, 12:1:69-78, Winter 1998. 18 See, for instance, Richard K. Vedder, Going Broke by Degree: Why College Costs Too Much, Washington DC: American Enterprise Institute, 2004, p. 41.

Stop Misusing Higher Education Specific Price Indices
8
HEPI and HECA Suffer from Systematic Biases A separate issue from when it is appropriate to use a price index is how accurate the price index is, and it is the question to which we now turn. There are a number of reasons to suspect that HEPI and HECA do not give an accurate measure of the change in the cost of providing an education because they both suffer from several systematic biases.19 Quality Bias
The first source of systematic bias in HEPI and HECA concerns quality and can be further separated into two issues: quality of the object of interest and the quality of its components. The first issue with quality stems from the fact that HEPI and HECA are input-based price indices. Unlike most price indices (such as the CPI or the GDP IPD), input-based indices do not directly measure the price of the good or service in question. Instead, they measure changes in the cost of providing it. This would be akin to the CPI measuring changes in the price of apples, not by directly measuring the price of apples, but rather by measuring the price of the seeds, fertilizer, labor, and transportation needed to grow and sell apples. For a good like apples, this is completely unnecessary because the output (the apple) is 19 Again, for clarity‟s sake, we emphasize that we are referring to bias in the statistical sense of deviation from the true value, not the cognitive sense of favoritism or prejudice.
$2,500
$3,000
$3,500
$4,000
$4,500
$5,000
$5,50019
90
1991
1992
1993
1994
1995
1996
1997
1998
1999
2000
2001
2002
2003
2004
2005
2006
2007
2008
2009
FIGURE 2REAL AVERAGE UNDERGRADUATE TUITION IN 1990 DOLLARS
HEPI HECA CPI
SOURCES: National Center for Education Statistics, Bureau of Labor Statistics, Commonfund, Bureau of Economic AnalysisNOTES: Price index values for the HEPI and the CPI are indexed by each fiscal year ending June 30; price index values for the HECA are indexed for the second quarter of each year.

Stop Misusing Higher Education Specific Price Indices
9
both readily observed and measured. It is both easier and more accurate simply to record the price of apples directly. However, when the good or service is not directly observable or measurable, there is little choice but to infer the final “price” by using the prices of required inputs. But when a price index relies upon inputs, the index is plagued by a fundamental “defect” and “cannot convey a very distinct” measure of the actual price level because there is no way to ensure that the quality of the item remains constant.20 To illustrate, suppose that the price of computers rose 10% last year, but that the quality of computers also increased. Because an input based index needs to assume constant quality for computers, it simply cannot distinguish between the part of the price increase attributable to the change in quality and the part of the price increase attributable to cost inflation. This problem is keenly felt in measuring price changes in higher education because it is extremely difficult—perhaps even impossible—to accurately and definitively measure the outputs of a college education, as Halstead himself acknowledged when he first created the HEPI several decades ago.21 The fact that the HEPI and HECA use an input based approach is the direct result of the difficulty presented in quantifying educational quality. However, in order to determine how much the cost of education increases over time, it is necessary to hold constant the quality of the education provided, otherwise there is a risk of confusing changes in quality with changes in costs. The Commonfund and SHEEO are, of course, aware of this and strive to report cost figures for both the HEPI and the HECA which “maintain the status quo.”22 But they do so by simply assuming no change in the quality of education provided, so long as the inputs used do not change. If educational quality improves for a given set of inputs, then HEPI and HECA will be biased—they will overstate the true cost of providing a given quality of education. Similarly, if the quality of education falls, HEPI and HECA will understate the true cost of providing an education. The second issue involving quality is much more common to price indices as a whole and involves the quality of the items measured (in terms of an input based price index, this refers to the quality of inputs as opposed to the quality of the true object of interest). For instance, the CPI used to price a fixed basket of goods to determine changes in the cost of living. The problem was that many products could not be fixed from one year to the next. New models of cars, computers, and refrigerators displaced older models, which were often no longer available. Comparing the price of the new model to the old model is not appropriate if there are quality differences between them. This is a problem facing nearly all price indices. As Noble laureate George Stigler, et al. noted almost fifty years ago:
If a poll were taken of professional economists and statisticians, in all probability they would designate (and by a wide majority) the failure of the price indexes to take full account of quality changes as the most important defect in these indexes. And by almost as large a majority, they would believe that this failure
20 Douglas C. Dacy, “A Price and Productivity Index for a Nonhomogeneous Product,” Journal of the American Statistical
Association, Vol. 59, No. 306 (Jun., 1964), pp. 469-480. 21 Halstead, Higher Education Prices and Price Indexes, 1975, p. 4. 22 Commondfund Institute, “HEPI Design and Use,” Commondfund Institute, 2010.

Stop Misusing Higher Education Specific Price Indices
10
introduces a systematic upward bias in the price indexes—that quality changes have on average been quality improvements.23
The CPI has increasingly been correcting for this problem by, among other methods, using hedonic techniques to isolate the fraction of the price differential attributable to quality changes. The HECA, being a weighted average of other price indices, incorporates some of the recent improvements in those price indices; however, none of these techniques have been adopted for the HEPI. In other words, the HEPI only measures costs while the CPI (tries) to measure costs after adjusting for quality. The Commonfund uses the following example to illustrate how this difference plays out in practice for the HEPI:
Let‟s say it costs $2,000 to replace an old computer that originally cost $1,500. The new computer, however, is twice as fast as the old one. HEPI would report that as a $500 increase, while CPI would report the new computer as a $500 price decrease due to the „quality adjustment.‟24
The failure to account for changes in quality quite clearly leads to an upward bias in the HEPI, as the entire change in the cost of inputs is attributed to cost inflation, when in fact, some of the cost increase is due to quality improvements. To summarize, because there is no method to quantify and measure educational quality, keeping quality fixed (a necessary condition for an unbiased price index) is not possible. HEPI and HECA implicitly assume constant quality, and therefore offer biased estimates of higher education cost changes if there are changes in educational quality. In cases where the quality of education improves, they overstate the increase in the cost of providing an education. Similarly, in those cases where educational quality falls, the HEPI and the HECA would systematically understate any cost increases. Furthermore, the HEPI is also upwardly biased because it ignores quality changes in inputs (HECA is less biased in this regard, since it indirectly incorporates quality adjustments). Productivity Bias
Like most price indices based upon input prices for labor and materials, the HEPI and HECA have another problem: they “are inadequate because they take no account of productivity changes… Such a cost index will always overstate the actual price if some gains in productivity have occurred.”25 Assuming proportionality between inputs and outputs is certainly reasonable in some instances. If one professor can teach 50 students a year, it seems logical to reason that two professors could teach 100. But many of the questions that price indices address are more complicated. For instance, we may want to know how much more it costs to provide a college education now than it did ten years ago. The number of students per professor now may or may not be the same as it was ten years ago. If it is different,
23 George J. Stigler et al., “Problems Common to the Indexes in The Price Statistics of the Federal Government,” National Bureau of Economic Research, 1961. 24 John Griswold, “What's the Best Yardstick to Measure Inflation?” Trusteeship, July/August 2006. 25 Douglas C. Dacy, “A Price and Productivity Index for a Nonhomogeneous Product,” Journal of the American Statistical
Association, 59:306:469-480, June, 1964.
Stop Misusing Higher Education Specific Price Indices
11
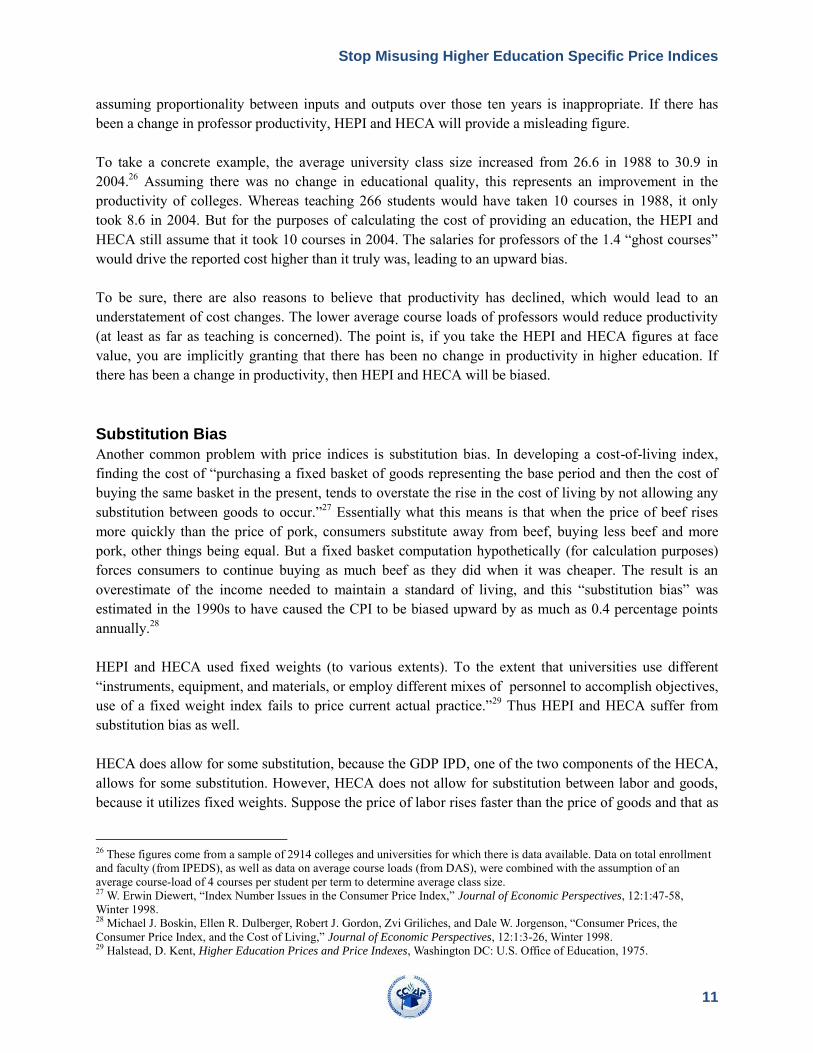
assuming proportionality between inputs and outputs over those ten years is inappropriate. If there has been a change in professor productivity, HEPI and HECA will provide a misleading figure. To take a concrete example, the average university class size increased from 26.6 in 1988 to 30.9 in 2004.26 Assuming there was no change in educational quality, this represents an improvement in the productivity of colleges. Whereas teaching 266 students would have taken 10 courses in 1988, it only took 8.6 in 2004. But for the purposes of calculating the cost of providing an education, the HEPI and HECA still assume that it took 10 courses in 2004. The salaries for professors of the 1.4 “ghost courses” would drive the reported cost higher than it truly was, leading to an upward bias. To be sure, there are also reasons to believe that productivity has declined, which would lead to an understatement of cost changes. The lower average course loads of professors would reduce productivity (at least as far as teaching is concerned). The point is, if you take the HEPI and HECA figures at face value, you are implicitly granting that there has been no change in productivity in higher education. If there has been a change in productivity, then HEPI and HECA will be biased. Substitution Bias
Another common problem with price indices is substitution bias. In developing a cost-of-living index, finding the cost of “purchasing a fixed basket of goods representing the base period and then the cost of buying the same basket in the present, tends to overstate the rise in the cost of living by not allowing any substitution between goods to occur.”27 Essentially what this means is that when the price of beef rises more quickly than the price of pork, consumers substitute away from beef, buying less beef and more pork, other things being equal. But a fixed basket computation hypothetically (for calculation purposes) forces consumers to continue buying as much beef as they did when it was cheaper. The result is an overestimate of the income needed to maintain a standard of living, and this “substitution bias” was estimated in the 1990s to have caused the CPI to be biased upward by as much as 0.4 percentage points annually.28 HEPI and HECA used fixed weights (to various extents). To the extent that universities use different “instruments, equipment, and materials, or employ different mixes of personnel to accomplish objectives, use of a fixed weight index fails to price current actual practice.”29 Thus HEPI and HECA suffer from substitution bias as well. HECA does allow for some substitution, because the GDP IPD, one of the two components of the HECA, allows for some substitution. However, HECA does not allow for substitution between labor and goods, because it utilizes fixed weights. Suppose the price of labor rises faster than the price of goods and that as
26 These figures come from a sample of 2914 colleges and universities for which there is data available. Data on total enrollment and faculty (from IPEDS), as well as data on average course loads (from DAS), were combined with the assumption of an average course-load of 4 courses per student per term to determine average class size. 27 W. Erwin Diewert, “Index Number Issues in the Consumer Price Index,” Journal of Economic Perspectives, 12:1:47-58, Winter 1998. 28 Michael J. Boskin, Ellen R. Dulberger, Robert J. Gordon, Zvi Griliches, and Dale W. Jorgenson, “Consumer Prices, the Consumer Price Index, and the Cost of Living,” Journal of Economic Perspectives, 12:1:3-26, Winter 1998. 29 Halstead, D. Kent, Higher Education Prices and Price Indexes, Washington DC: U.S. Office of Education, 1975.

Stop Misusing Higher Education Specific Price Indices
12
a result, universities substitute away from labor and towards goods (perhaps by investing in IT improvements). The HECA would not account for this substitution and would, for purposes of calculating costs, continue to hypothetically force universities to use more labor than they actually did. This results in an overestimate of the change in the cost of providing an education. Similarly, the HEPI changes the weights assigned to each spending category, which allows for substitution between categories, but this does not allow for substitution within a particular category. Suppose the price of blue dry erase markers goes up relative to red dry erase markers. We would expect colleges to change their purchases by buying fewer blue, and more red markers. But if the survey used to measure the change in prices for supplies and materials is a fixed basket, then it does not allow for such substitution; thus, HEPI would be biased upwards. A more concrete example that applies to both HEPI and HECA is available in the shift towards contingent faculty. Contingent faculty (part-time and adjunct professors as well as graduate students with teaching responsibilities) make up 70% of college instructional staff and teach more than half of all courses in the country.30 This represents a dramatic change from years past. Part time faculty made up about a quarter of faculty at public, four-year comprehensive universities in 1987 but nearly 40% in 2003. Two thirds of instructors at public, two-year colleges were part time in 2003, up from around half in 1987.31 Neither the ECI (used by the HECA), nor the AAUP survey of faculty salaries (used by the HEPI) takes into account the shift from full-time faculty to contingent faculty. While institutions all over the country are increasingly relying upon lower cost contingent faculty to teach courses, HEPI and HECA essentially assume that well paid tenured faculty are still teaching them (full-time faculty are paid about 4 times as much per course as part-time faculty).32 Thus, even though labor costs have declined dramatically for many courses, HEPI and HECA report that they are rising. Thus, the widespread shift in higher education towards a heavier reliance on contingent faculty means that HEPI and HECA suffer from upward substitution bias.
HEPI is Self-Referential
The last problem is relevant only to the HEPI, a problem which is widely discussed and is, in fact, one of the main reasons HECA exists as an alternative price index. As Robert Dickeson and Stanley Ikenberry put it, the HEPI “has lost favor recently, primarily because the salary portion—the AAUP survey—was self-referential.”33 HEPI is self-referential in the sense that it relies upon labor costs (faculty, administrative, and clerical salaries) which are “influenced by university policy decisions.”34 Richard Vedder further observed that this is a problem because
30 JBL Associates, Inc., “Reversing Course: The Troubled State of Academic Staffing and a Path Forward,” Washington DC: The American Federation of Teachers, 2010. 31 Ibid. 32 Ibid. 33 Robert C. Dickeson and Stanley O. Ikenberry, “Prioritizing Academic Programs and Services: Reallocating Resources to Achieve Strategic Balance, Revised and Updated,” San Francisco: John Wiley & Sons, 2010, p. 2. 34 Richard K. Vedder, Going Broke by Degree: Why College Costs Too Much, Washington DC: American Enterprise Institute, 2004, p. 41.

Stop Misusing Higher Education Specific Price Indices
13
if administrative salaries rise, then the Higher Education Price Index rises. Colleges can give their employees huge salary increases, claim that „higher education costs are soaring,‟ and demand larger government subsidies, etc., as a consequence.35
This self-referential problem potentially makes any application of the HEPI problematic and causes the HEPI to deviate from the standard approach price indices follow.36 After all, if colleges and universities themselves can determine and directly control the actual prices for staff salaries (which are, in turn, used to calculate the HEPI), then that index is not a good measure of the external prices facing those same institutions. In contrast, the CPI is a good measure of the prices consumers pay because consumers cannot change the prices of the goods and services they purchase. There is, therefore, a fundamental difference between the approach the BLS takes to compute the CPI and that used to compute the HEPI: while consumers cannot directly control the prices they pay (as measured by the CPI), college can directly control the prices of the most important components upon which the HEPI relies. What this means in practice is that the use of the HEPI removes an important incentive for higher education institutions to control costs because colleges can decide to increase staff salaries and, by so doing, cause their overall price index (as measured by the HEPI) to rise as well. This contributes to the academic arms race. HECA avoids the self-referential problem by utilizing an index of salary costs that is not specific to higher education. In other words, while HEPI increases in part because university leaders decide to pay themselves more, HECA increases because it costs more to employ higher skilled management and professional employees (those who are most often employed by universities) in general.
Conclusion In order to compare the price of things over time, it is necessary to use a price index to adjust for inflation. The HEPI and HECA were designed to more accurately account for the spending patterns of colleges and universities. However, there are some methodological problems with HEPI and HECA. Both suffer from inherent biases regarding quality, productivity, and substitution causing them, in practice, to overstate the rate of inflation. In addition, HEPI is self-referential. In spite of these problems, HEPI and HECA mirror university spending patterns more closely than other price indices and as such are quite useful for certain purposes, such as internal budget planning. However, as industry specific price indices, they are of very limited use. Table 2 indicates what price index is most appropriate to address various questions in higher education. HEPI and HECA don‟t show up very frequently. While HEPI and HECA can be appropriately used for budget forecasting, internal university documents relating to future budgets are rarely publically available. This means that virtually every instance of the
35 Richard Vedder, “Federal Tax Policy Regarding Universities: Endowment and Beyond,” Washington DC: Center for College Affordability and Productivity, 2008. 36 See “Appendix III, Rationale for Preference for the Higher Education Cost Adjustment (HECA)” in Peter McPherson and David Shulenburger, University Tuition, Consumer Choice and Affordability, Washington DC: NASULGC, November 2008.

Stop Misusing Higher Education Specific Price Indices
14
use of the HEPI and HECA in the public domain is inappropriate. Those who use HEPI or HECA should be aware of the problems we highlighted in this report, namely that HEPI and HECA likely suffer from quality, productivity, and substitution bias, and that HEPI is self-referential.
More importantly, however, organizations and institutions need to ensure that they are using the appropriate price index for the issue they are examining. For most purposes (including indexing college tuition for inflation), the use of HEPI or HECA is simply inappropriate.
TABLE 2
APPROPRIATE USE OF PRICE INDICES Purpose Appropriate Price Index or Measure
Adjusting Tuition for Inflation CPI
Computing Changes in College Affordability Median Income Cost of Living Adjustments for Higher Education Workers
CPI
Forecasting Future Budget Needs HEPI or HECA

Stop Misusing Higher Education Specific Price Indices
15
References Boskin, Michael J., Dulberger, Ellen R., Gordon, Robert J., Griliches, Zvi, and Jorgenson, Dale W., “Consumer Prices, the Consumer Price Index, and the Cost of Living,” Journal of Economic
Perspectives, 12:1:3-26, Winter 1998. Broda, Christian, Leibtag, Ephraim, and Weinstein, David E., “The Role of Prices in Measuring the Poor‟s Living Standards,” Journal of Economic Perspectives, 23:2, Spring 2009. Commonfund Institute, “2010 HEPI Update,” Wilton, CT: Commonfund, 2010. Commondfund Institute, “HEPI Design and Use,” Commondfund Institute, 2010. Dacy, Douglas C., “A Price and Productivity Index for a Nonhomogeneous Product,” Journal of the
American Statistical Association, Vol. 59, No. 306 (Jun., 1964), pp. 469-480. Dickeson, Robert C. and Ikenberry, Stanley O., Prioritizing Academic Programs and Services:
Reallocating Resources to Achieve Strategic Balance, Revised and Updated, San Francisco: John Wiley & Sons, 2010. Diewert, W. Erwin, “Index Number Issues in the Consumer Price Index,” Journal of Economic
Perspectives, 12:1:47-58, Winter 1998. Fitzgerald Terry J., “Has Middle America Stagnated?” The Region, September 2007. Griswold, John, “What's the Best Yardstick to Measure Inflation?” Trusteeship, July/August 2006. Halstead, D. Kent, Higher Education Prices and Price Indexes, Washington DC: U.S. Office of Education, 1975. Halstead, D. Kent, Inflation Measures for Schools and Colleges, Washington DC: U.S. Department of Education, 1983. JBL Associates, Inc., Reversing Course: The Troubled State of Academic Staffing and a Path Forward, Washington DC: The American Federation of Teachers, 2010. McPherson, Peter and Shulenburger, David, Appendix III: Rationale for Preference for the Higher Education Cost Adjustment (HECA) in University Tuition, Consumer Choice and Affordability, Washington DC: NASULGC, November 2008. Pollak, Robert A., “The Consumer Price Index: A Research Agenda and Three Proposals,” Journal of
Economic Perspectives, 12:1:69-78, Winter 1998. State Higher Education Executives Organization, “State Higher Education Finance FY 2009: Technical Paper A,” Boulder, CO: State Higher Education Executives Organization, 2010. Stigler, George J. et al., Problems Common to the Indexes in The Price Statistics of the Federal
Government, National Bureau of Economic Research, 1961. Available at: http://www.nber.org/books/repo61-1.

Stop Misusing Higher Education Specific Price Indices
16
U.S. Census Bureau, “How the Census Bureau Measures Poverty,” Census.gov, September 16, 2010, available at http://www.census.gov/hhes/www/poverty/about/overview/measure.html/. Accessed November 10, 2010. Vedder, Richard K., “Federal Tax Policy Regarding Universities: Endowment and Beyond,” Washington DC: Center for College Affordability and Productivity, 2008. Vedder, Richard K., Going Broke by Degree: Why College Costs Too Much, Washington DC: American Enterprise Institute, 2004.

Stop Misusing Higher Education Specific Price Indices
17
Appendix
TABLE 3 INDEX VALUES FOR VARIOUS PRICE INDICES (1961-2010)a
Fiscal Year
HEPI CPI HECA (Estimated)b
HECA (Actual)c
GDP IPD
1961 18.18 23.42 -- -- 26.09 1962 18.82 23.65 -- -- 26.46 1963 19.60 23.96 -- -- 26.72 1964 20.31 24.27 -- -- 27.13 1965 21.16 24.57 -- -- 27.62 1966 22.23 25.19 -- -- 28.32 1967 23.37 25.89 -- -- 29.17 1968 24.79 26.74 -- -- 30.42 1969 26.35 28.05 -- -- 31.88 1970 28.05 29.75 -- -- 33.68 1971 29.90 31.30 -- -- 35.36 1972 31.46 32.38 -- -- 36.77 1973 33.17 33.69 -- -- 38.65 1974 35.44 36.71 -- -- 41.94 1975 38.57 40.80 -- -- 46.18 1976 41.05 43.66 -- -- 48.91 1977 43.68 46.21 -- -- 52.05 1978 46.66 49.30 -- -- 55.63 1979 50.07 53.94 -- -- 60.23 1980 55.04 61.13 -- -- 65.53 1981 60.94 68.16 66.00 -- 71.97 1982 66.69 74.03 70.84 -- 76.51 1983 71.02 77.28 74.91 -- 79.65 1984 74.43 80.14 78.73 -- 82.79 1985 78.69 83.23 81.92 -- 85.40 1986 82.60 85.63 84.75 -- 87.21 1987 85.87 87.56 87.52 -- 89.63 1988 89.63 91.19 91.18 -- 92.63 1989 94.32 95.44 95.31 -- 96.40 1990 100.00 100.00 100.00 100.00 100.00 1991 105.26 105.41 104.19 104.44 103.56 1992 109.02 108.81 107.74 108.05 106.15 1993 112.14 112.21 111.33 111.93 108.49 1994 115.98 114.99 114.52 115.39 110.69

Stop Misusing Higher Education Specific Price Indices
18
Fiscal Year
HEPI CPI HECA (Estimated)b
HECA (Actual)c
GDP IPD
1995 119.39 118.39 117.52 118.61 113.06 1996 122.87 121.64 120.59 121.80 115.27 1997 126.70 125.12 123.60 125.19 117.30 1998 131.18 127.36 126.91 129.14 118.63 1999 134.30 129.52 130.34 132.85 120.40 2000 139.84 133.31 135.06 138.33 122.85 2001 148.22 137.87 140.33 144.47 125.94 2002 151.07 140.34 144.62 148.97 127.73 2003 158.74 143.35 149.40 153.61 130.37 2004 164.56 146.52 154.48 158.94 134.07 2005 171.02 150.93 159.70 164.42 138.24 2006 179.76 156.65 164.88 169.36 143.16 2007 184.87 160.74 170.91 175.10 147.60 2008 194.03 166.69 176.04 180.18 150.60 2009 198.37 169.01 179.08 182.83 152.31 2010 200.14 170.63 181.52
153.60
SOURCES: Commonfund Institute, Bureau of Labor Statistics, Bureau of Economic Analysis, State Higher Education Executive Officers. NOTES: aAll numbers indexed to 1990=100. bHECA (Estimated) values are estimates calculated by the authors using historical data provided by the BLS and BEA. cHECA (Actual) are the actual values for the HECA reported by SHEEO.