Review of wildfire indices Indices applicable for a ...
39
Review of wildfire indices Indices applicable for a Swedish context Pagnon Eriksson, Claude; Johansson, Nils 2020 Document Version: Publisher's PDF, also known as Version of record Link to publication Citation for published version (APA): Pagnon Eriksson, C., & Johansson, N. (2020). Review of wildfire indices: Indices applicable for a Swedish context. (TVBB; No. 3233). Division of Fire Safety Engineering. Total number of authors: 2 General rights Unless other specific re-use rights are stated the following general rights apply: Copyright and moral rights for the publications made accessible in the public portal are retained by the authors and/or other copyright owners and it is a condition of accessing publications that users recognise and abide by the legal requirements associated with these rights. • Users may download and print one copy of any publication from the public portal for the purpose of private study or research. • You may not further distribute the material or use it for any profit-making activity or commercial gain • You may freely distribute the URL identifying the publication in the public portal Read more about Creative commons licenses: https://creativecommons.org/licenses/ Take down policy If you believe that this document breaches copyright please contact us providing details, and we will remove access to the work immediately and investigate your claim.
Transcript of Review of wildfire indices Indices applicable for a ...
LUND UNIVERSITY
PO Box 117221 00 Lund+46 46-222 00 00
Review of wildfire indices
Indices applicable for a Swedish contextPagnon Eriksson, Claude; Johansson, Nils
2020
Document Version:Publisher's PDF, also known as Version of record
Link to publication
Citation for published version (APA):Pagnon Eriksson, C., & Johansson, N. (2020). Review of wildfire indices: Indices applicable for a Swedishcontext. (TVBB; No. 3233). Division of Fire Safety Engineering.
Total number of authors:2
General rightsUnless other specific re-use rights are stated the following general rights apply:Copyright and moral rights for the publications made accessible in the public portal are retained by the authorsand/or other copyright owners and it is a condition of accessing publications that users recognise and abide by thelegal requirements associated with these rights. • Users may download and print one copy of any publication from the public portal for the purpose of private studyor research. • You may not further distribute the material or use it for any profit-making activity or commercial gain • You may freely distribute the URL identifying the publication in the public portal
Read more about Creative commons licenses: https://creativecommons.org/licenses/Take down policyIf you believe that this document breaches copyright please contact us providing details, and we will removeaccess to the work immediately and investigate your claim.
Rev iew of wildfire indices Indices applicable for a Swedish context Claude Pagnon Eriksson, Nils Johansson
FIRE SAFETY ENGINEERING | LUND UNIVERSITY
Rev iew of wildfire indices Indices applicable for a Swedish context
Claude Pagnon Eriksson
Nils Johansson
Lund 2020
Review of wildfire indices - Indices applicable for a Swedish context
Claude Pagnon Eriksson, Nils Johansson
Report 3233
ISRN: LUTVDG/TVBB--3233--SE
Antal sidor/Number of pages: 32
Sökord/Keywords
Wildfires, wildfire risk index, Fire Weather Index, HBV index, multi-hazard, Extreme-Index
Abstract
Wildfire risk indices can be used in order to be better prepared for wildfires. In Sweden, the Canadian Fire Weather Index (FWI) is currently used to predict fire behaviour based on meteorological data such as wind velocity, temperature and rainfall. Additionally, the HBV model, used to calculate moisture content in soil layers, serves to predict the ignition risk in Sweden. There are however many different wildfire indices used in the world and this study aims to review and identify wildfire risk indices that could also be applicable for a Swedish context. Eleven wildfire risk indices or methods were discovered through a comprehensive literature review. These are described in the report, including required input parameters, information about testing or validation of the method and finally advantages and disadvantages of the method with regards to its potential use in a Swedish context. Four indices were deemed more relevant and suggested for further analysis including evaluation against wildfire data in Sweden: the Fire Weather Index (FWI), the Fosberg Fire Weather Index (FFWI), the Keetch-Byram Drought Index (KBDI) and the Nesterov Index.
© Copyright:
Division of Fire Safety Engineering, Faculty of Engineering, Lund University, Lund 2020
Avdelningen för Brandteknik, Lunds tekniska högskola, Lunds universitet, Lund 2020
Division of Fire Safety Engineering
Faculty of Engineering
Lund University
P.O. Box 118
SE-221 00 Lund
Sweden
www.brand.lth.se
Brandteknik
Lunds tekniska högskola
Lunds universitet
Box 118
221 00 Lund
www.brand.lth.se
Summary The world continuously faces challenges that can be caused by extreme weather events such as wildfires and flooding. Therefore, a need exists to quantify and visualize risk as a basis for decision-making by nations, regional and local governments, and first responders. This report is part of the project “EXTREME-INDEX: A new multi-hazard vulnerability index”, financed by MSB and FORMAS.
The project will develop and implement a multi-hazard tool which can include different types of extreme natural events, for example wildfires, heatwaves, droughts and flooding, and the potential interaction between these different events. The tool will consist of several single-hazard indices and a methodology for their combination.
The focus of this report is to present a literature review of existing wildfire risk indices and include the identification of wildfire risk indices applicable for a Swedish context. Different fire danger rating systems are used all over the world in order to inform decision-makers. These fire danger rating systems usually consist of indices which describe the fire conditions. The indices monitor the changes in conditions – usually related to the moisture content of the soil. The current wildfire risk assessment methods used in Sweden are the FWI (Canadian Forest Fire Weather Index) for calculating forest fire danger based on meteorological parameters and the HBV-model (Hydrologiska Byråns Vattenbalansavdelning) for calculating the ignition risk based on moisture in the uppermost soil layer.
A systematic method was used in the review and 509 unique titles were studied based on a list of inclusion and exclusion criteria. Eleven different methods which were determined to be relevant for the project are described in this report; Burning Index, Fire Potential Index (FPI), Fire Weather Index (FWI), Forest Fire Behaviour Tables, Fosberg Fire Weather Index (FFWI), Haines Index, Keetch-Byram Drought Index (KBDI), Integrated Fire Index, Index F, Mark 5 Forest Fire Danger Meter and Nesterov Index. Each method was described including its required input variables, whether testing or validation of the method has been done and the method’s advantages and disadvantages.
The review resulted in a proposal of four indices which are recommended for further use in the EXTREME-INDEX project. The four indices are the Fire Weather Index (FWI), Fosberg Fire Weather Index (FFWI), Keetch-Byram Drought Index (KBDI) and the Nesterov Index. The models selected for further use in the project need to be calibrated and evaluated for Swedish conditions.
Preface This is an interim report in Work Package 2 (WP2) in the project “EXTREME-INDEX: A new multi-hazard vulnerability index” financed by MSB and FORMAS.
The project will develop and implement a multi-hazard tool which can include different types of extreme natural events, e.g., wildfires, heatwaves, droughts and storms as well as pluvial, fluvial and coastal flooding, and the potential interaction between these different events. The tool will consist of several single-hazard indices and a methodology for their combination. The combined index will be associated with an assessment of the rescue service capabilities and possible human response.
In WP2 an inventory of the indices, tools and methods available for risk assessments for natural hazards (with focus on wildfires and flooding) is conducted. The inventory will provide direct input to WP3 and WP4.
The focus in this report is to review and identify wildfire risk indices applicable for a Swedish context.
Contents
1 Background .................................................................................................................................1
1.1 Objective............................................................................................................................1
2 Current wildfire risk assessment methods in Sweden ..................................................................2
2.1 Wildfires ............................................................................................................................2
2.2 Grassland fires ...................................................................................................................3
3 Methodology ..............................................................................................................................4
3.1 Define keywords ................................................................................................................4
3.2 Search databases ...............................................................................................................4
3.3 Review results ....................................................................................................................5
3.4 Review and analysis of full papers ......................................................................................6
4 Description of indices ..................................................................................................................7
4.1 Burning Index .....................................................................................................................7
4.2 Fire Potential Index ............................................................................................................8
4.3 Fire Weather Index........................................................................................................... 10
4.4 Forest Fire Behaviour Tables ............................................................................................ 13
4.5 Fosberg Fire Weather Index ............................................................................................. 15
4.6 Haines Index (LASI) ........................................................................................................... 17
4.7 Keetch-Byram Drought Index ........................................................................................... 19
4.8 Integrated Fire Index ........................................................................................................ 20
4.9 Index F ............................................................................................................................. 22
4.10 Mark 5 Forest Fire Danger Meter ..................................................................................... 24
4.11 Nesterov .......................................................................................................................... 26
5 Summary of findings and conclusion ......................................................................................... 28
References ........................................................................................................................................ 29
1
1 Background The world is facing challenges due to natural hazards that can partly be caused by extreme weather events, for example, wildfires and flooding. Therefore, a need exists to quantify and visualize risk as a basis for decision-making by nations, regional and local governments, and first responders. Efficient management to mitigate consequences or minimize the vulnerability of society to hazards requires the quantification of those hazards and risks. That quantification could involve information on the type of event, probability of the specific event occurring, magnitude of the event as well as exposure to the hazard and associated damages. In the case of wildfire, variables like temperature, moisture content and wind velocity are used to create indices and hazard maps to represent the wildfire danger. Similarly, early warning systems or hazard maps can be developed based on other variables for flooding.
A society’s exposure to hazards and the magnitude of potential consequences can be expressed using a so-called risk index. Risk indices can be constructed for different types of hazards and they can be applicable for different areas and levels of the society, from individual buildings or facilities to countries and parts of continents. An example of the former is the fire risk index methods for buildings; such an index can be applied on a certain building as a cost-effective screening tool for prioritizations between different fire safety measures (Watts, 2016). On the other hand, there are risk index methods on a larger level (national and international), like the WorldRiskIndex (Welle, T. & Birkmann, J., 2015). This index provides an approach to assess risk and vulnerability towards hazards on a country scale, and allows the comparison of countries at a global scale.
In a project financed by the Swedish Civil Contingencies Agency (MSB) and FORMAS a multi-hazard risk index, EXTREME-INDEX, will be developed in order to assist prediction of emerging risks on a local, regional and national level to support various stakeholders for strategic training and resource planning. The tool will consist of several single hazard indices and methodology for their combination. The focus in this project will be on implementation of wildfires (forest and WUI) and flooding/storms (urban and coastal) into the developed framework.
Different fire danger rating systems are used all over the world in order to inform decision-makers (de Groot et al., 2015). These fire danger rating systems usually consist of indices which describe the fire conditions. The indices monitor the changes in conditions – generally related to the moisture content of the soil – and can be used to decide when proactive measures need be taken to mitigate the wildfire risk. There are wildfires indices that can be used to forecast the fire danger for the same day or the coming days but there are also those who are used for long-term seasonal forecasting (de Groot et al., 2015).
The EXTREME-INDEX will, as mentioned above, integrate existing index methods, and even though the FWI method is in use in Sweden today several other methods exist around the world. Consequently, there might be other methods to calculate wildfire risk that are relevant for Sweden and that are suitable to combine with other hazard indices like risk indices for floods. A review of different wildfire risk indices is therefore considered to be highly relevant to perform.
1.1 Objective
The objective of the work behind this report is to review and identify wildfire risk indices applicable for a Swedish context. One or several indices will be suggested to be included in the next part of the project “EXTREME-INDEX: A new multi-hazard vulnerability index”.
2
2 Current wildfire risk assessment methods in Sweden 2.1 Wildfires
The Canadian Fire Weather Index (van Wagner, 1987) is the model currently used in Sweden to assess the wildfire risk, specifically related to fire spread and behaviour (MSB, n.d.(a)). In order to calculate the FWI, the country is divided into a grid consisting of 11x11 km2 squares. An index value is calculated for each square based on information about various weather parameters. The higher the index, the higher the fire danger is. Since the FWI is based on weather parameters it is continuously updated. The methodology behind the FWI and its composition is described in more detail in section 4.3. It is however already worth mentioning that the index is widely used in the world and is a very well established method consisting of different sub-indices that provide the user with information about the initial fire spread as well as fire behaviour based on moisture contents in the different soil layers.
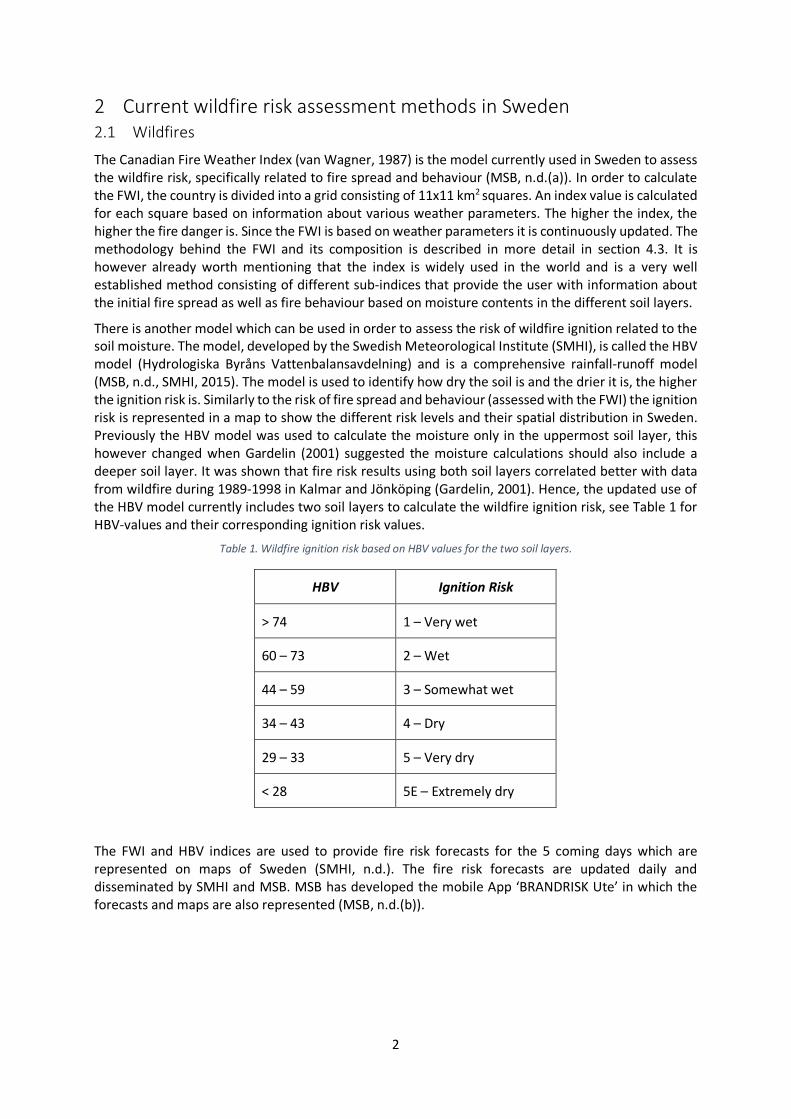
There is another model which can be used in order to assess the risk of wildfire ignition related to the soil moisture. The model, developed by the Swedish Meteorological Institute (SMHI), is called the HBV model (Hydrologiska Byråns Vattenbalansavdelning) and is a comprehensive rainfall-runoff model (MSB, n.d., SMHI, 2015). The model is used to identify how dry the soil is and the drier it is, the higher the ignition risk is. Similarly to the risk of fire spread and behaviour (assessed with the FWI) the ignition risk is represented in a map to show the different risk levels and their spatial distribution in Sweden. Previously the HBV model was used to calculate the moisture only in the uppermost soil layer, this however changed when Gardelin (2001) suggested the moisture calculations should also include a deeper soil layer. It was shown that fire risk results using both soil layers correlated better with data from wildfire during 1989-1998 in Kalmar and Jönköping (Gardelin, 2001). Hence, the updated use of the HBV model currently includes two soil layers to calculate the wildfire ignition risk, see Table 1 for HBV-values and their corresponding ignition risk values.
Table 1. Wildfire ignition risk based on HBV values for the two soil layers.
HBV Ignition Risk
> 74 1 – Very wet
60 – 73 2 – Wet
44 – 59 3 – Somewhat wet
34 – 43 4 – Dry
29 – 33 5 – Very dry
< 28 5E – Extremely dry
The FWI and HBV indices are used to provide fire risk forecasts for the 5 coming days which are represented on maps of Sweden (SMHI, n.d.). The fire risk forecasts are updated daily and disseminated by SMHI and MSB. MSB has developed the mobile App ‘BRANDRISK Ute’ in which the forecasts and maps are also represented (MSB, n.d.(b)).
3
2.2 Grassland fires
In addition to wildfires, grassland fires are also common in Sweden. These are assessed in a different way from the forest fire risk. The assessment of grassland fire danger is twofold (MSB, 2020); during the summer and fall seasons, the methods used for forest fires (FWI and HBV) are used as indicators of the grassfire risk in dried out grass from the current year. But during the spring, grassfires can start in the dead grass from the previous year once the snow has melted (MSB, 2020). In this case the risk for grassland fire is assessed in another with another method (Andréasson & Gardelin, 2003).
The current method for springtime grassland fire warning was developed by SMHI and consists of two models. The first model is used to define the duration of the period of grassland fire risk during spring. The second model indicates how big the grassland fire risk is during that period. Both models are based on data from past grassland fires that occurred in Sweden between 1996 and 2000 (Andréasson & Gardelin, 2003). The start of the grassland fire risk period based on data correlates well with the time when the snow cover has melted as calculated with the HBV-model. The end of the grassland fire risk period is calculated with a temperature sum starting on the 1st of January which indicates when there is enough new grass to prevent fire in dead grass from the previous year. The snow-melt and the temperature sum are thus used to calculate the extent of the grassland fire season which can be illustrated in a map as different geographic locations have varying lengths of grassfire season.
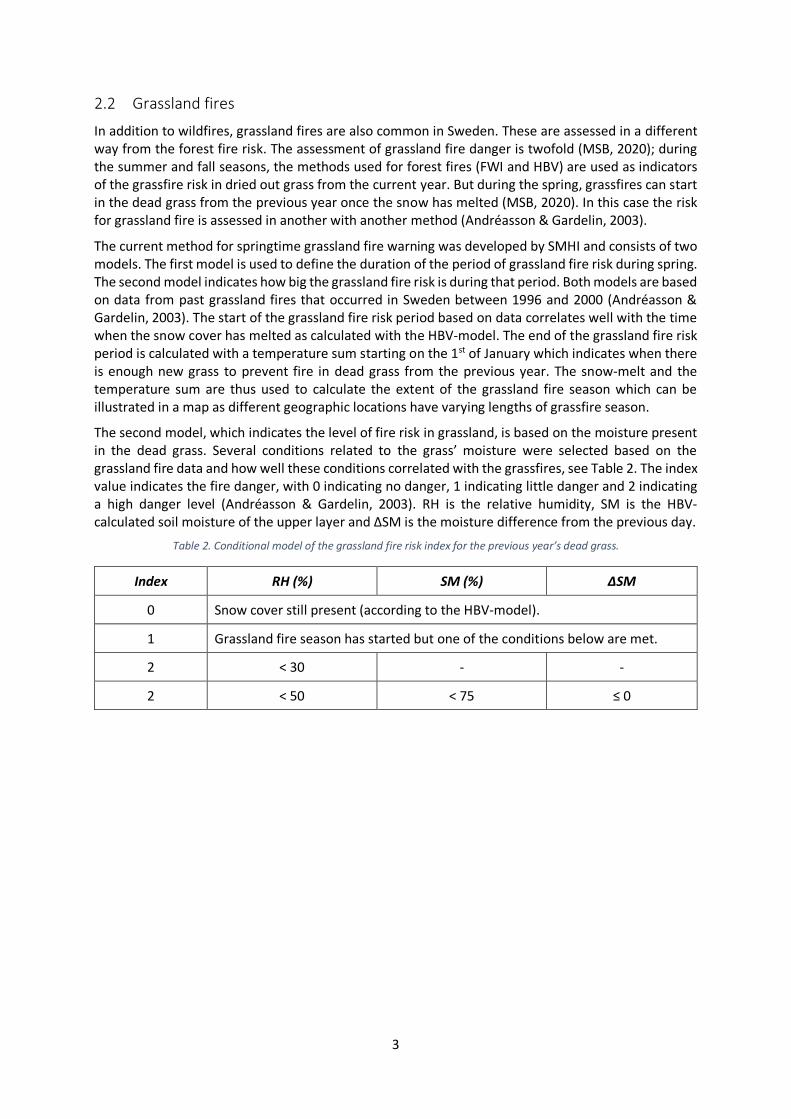
The second model, which indicates the level of fire risk in grassland, is based on the moisture present in the dead grass. Several conditions related to the grass’ moisture were selected based on the grassland fire data and how well these conditions correlated with the grassfires, see Table 2. The index value indicates the fire danger, with 0 indicating no danger, 1 indicating little danger and 2 indicating a high danger level (Andréasson & Gardelin, 2003). RH is the relative humidity, SM is the HBV-calculated soil moisture of the upper layer and ΔSM is the moisture difference from the previous day.
Table 2. Conditional model of the grassland fire risk index for the previous year’s dead grass.
Index RH (%) SM (%) ΔSM
0 Snow cover still present (according to the HBV-model).
1 Grassland fire season has started but one of the conditions below are met.
2 < 30 - -
2 < 50 < 75 ≤ 0
4
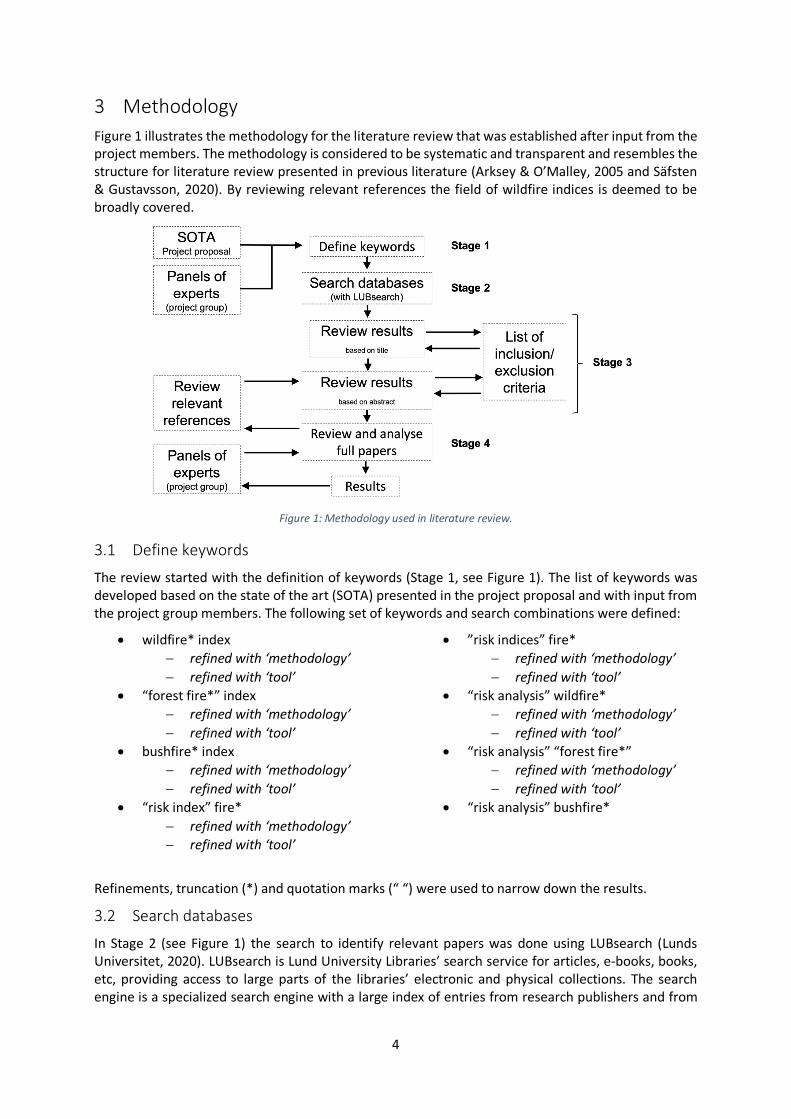
3 Methodology Figure 1 illustrates the methodology for the literature review that was established after input from the project members. The methodology is considered to be systematic and transparent and resembles the structure for literature review presented in previous literature (Arksey & O’Malley, 2005 and Säfsten & Gustavsson, 2020). By reviewing relevant references the field of wildfire indices is deemed to be broadly covered.
Figure 1: Methodology used in literature review.
3.1 Define keywords
The review started with the definition of keywords (Stage 1, see Figure 1). The list of keywords was developed based on the state of the art (SOTA) presented in the project proposal and with input from the project group members. The following set of keywords and search combinations were defined:
• wildfire* index − refined with ‘methodology’ − refined with ‘tool’
• “forest fire*” index − refined with ‘methodology’ − refined with ‘tool’
• bushfire* index − refined with ‘methodology’ − refined with ‘tool’
• “risk index” fire* − refined with ‘methodology’ − refined with ‘tool’
• ”risk indices” fire* − refined with ‘methodology’ − refined with ‘tool’
• “risk analysis” wildfire* − refined with ‘methodology’ − refined with ‘tool’
• “risk analysis” “forest fire*” − refined with ‘methodology’ − refined with ‘tool’
• “risk analysis” bushfire*
Refinements, truncation (*) and quotation marks (“ “) were used to narrow down the results.
3.2 Search databases
In Stage 2 (see Figure 1) the search to identify relevant papers was done using LUBsearch (Lunds Universitet, 2020). LUBsearch is Lund University Libraries’ search service for articles, e-books, books, etc, providing access to large parts of the libraries’ electronic and physical collections. The search engine is a specialized search engine with a large index of entries from research publishers and from
5
subject databases. The content of the library catalogue, LUBcat, is also included, along with large parts of Lund University Research Portal through SwePub.
Both Web of Science and Scopus are included in LUBsearch. Web of Science includes a range of different types of publications, like: journal papers, websites and conference proceedings. Scopus claims to be the largest abstract and citation database of peer-reviewed literature, scientific journals, books and conference proceedings. Scopus has a larger coverage (> 20,000 journals) compared to Web of Science (> 12,000 journals). However, Web of Science is said to have a greater time period of coverage than Scopus. By using LUBsearch the scientific literature is considered to be covered satisfyingly.
3.3 Review results
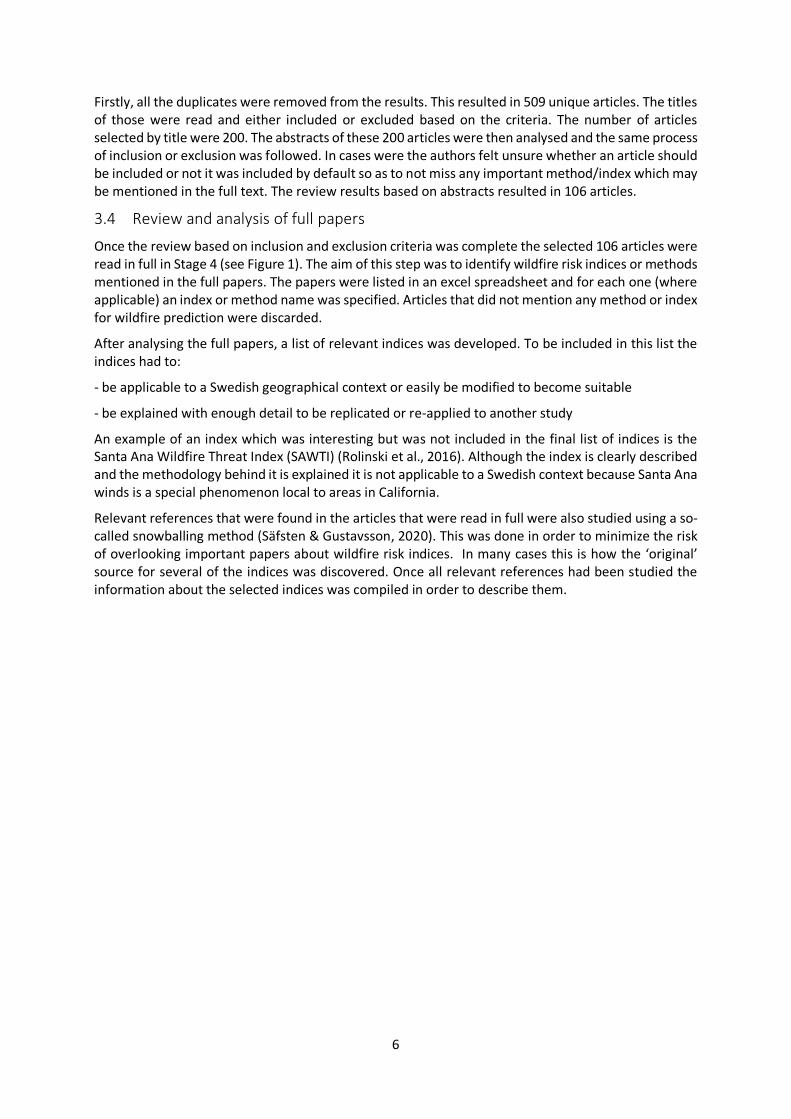
The search resulted in a total of 923 titles. All of the results were exported to a reference management system and reviewed in two steps according to Stage 3 in Figure 1. A random selection of titles and abstracts were then read to get a broad view of the search results. Inclusion and exclusion criteria were then generated to refine the review results and select the most relevant titles and abstracts. The list of criteria was continuously updated during the review and new criteria were added when deemed necessary.
The inclusion and exclusion criteria are presented in Table 3. The list was created, during Stage 3, to achieve higher inter-rater reliability by guiding the raters when selecting articles to include and reduce subjectivity in those decisions.
Table 3. Inclusion and exclusion criteria used in the review of the database search results.
Inclusion criteria Exclusion criteria
Articles mentioning tools, methods or risk assessment/analysis approaches for wildfires will be included.
Articles that don’t mention a tool, method or risk assessment/analysis approach in the abstract will be excluded.
Articles with unspecific or broad titles will initially be included.
Articles that don’t mention wildfires in the abstract will be excluded.
Articles focusing on “pre-fire” mapping will be included.
Articles focusing on “post-fire” mapping or recovery will be excluded (e.g. locating burned areas).
Articles focusing on tools, methods or risk assessment/analysis approaches during wildfires will be included.
Articles about prescribed fires will be excluded.
Case studies using indices/models previously unknown to the authors will be included.
Articles focusing on real-time detection of forest fires will be excluded.
Articles focusing on droughts will be excluded.
Articles focusing only on data collection will be excluded.
Articles not in English will be excluded.
6
Firstly, all the duplicates were removed from the results. This resulted in 509 unique articles. The titles of those were read and either included or excluded based on the criteria. The number of articles selected by title were 200. The abstracts of these 200 articles were then analysed and the same process of inclusion or exclusion was followed. In cases were the authors felt unsure whether an article should be included or not it was included by default so as to not miss any important method/index which may be mentioned in the full text. The review results based on abstracts resulted in 106 articles.
3.4 Review and analysis of full papers
Once the review based on inclusion and exclusion criteria was complete the selected 106 articles were read in full in Stage 4 (see Figure 1). The aim of this step was to identify wildfire risk indices or methods mentioned in the full papers. The papers were listed in an excel spreadsheet and for each one (where applicable) an index or method name was specified. Articles that did not mention any method or index for wildfire prediction were discarded.
After analysing the full papers, a list of relevant indices was developed. To be included in this list the indices had to:
- be applicable to a Swedish geographical context or easily be modified to become suitable
- be explained with enough detail to be replicated or re-applied to another study
An example of an index which was interesting but was not included in the final list of indices is the Santa Ana Wildfire Threat Index (SAWTI) (Rolinski et al., 2016). Although the index is clearly described and the methodology behind it is explained it is not applicable to a Swedish context because Santa Ana winds is a special phenomenon local to areas in California.
Relevant references that were found in the articles that were read in full were also studied using a so-called snowballing method (Säfsten & Gustavsson, 2020). This was done in order to minimize the risk of overlooking important papers about wildfire risk indices. In many cases this is how the ‘original’ source for several of the indices was discovered. Once all relevant references had been studied the information about the selected indices was compiled in order to describe them.
7
4 Description of indices In this Chapter the results of the review presented in Chapter 3 is given. A short description of the indices considered most relevant and interesting to use for Swedish conditions are presented. For each index, advantages and disadvantages are presented and used to determine the adequacy of the index for further use in the project. The indices are presented in alphabetical order.
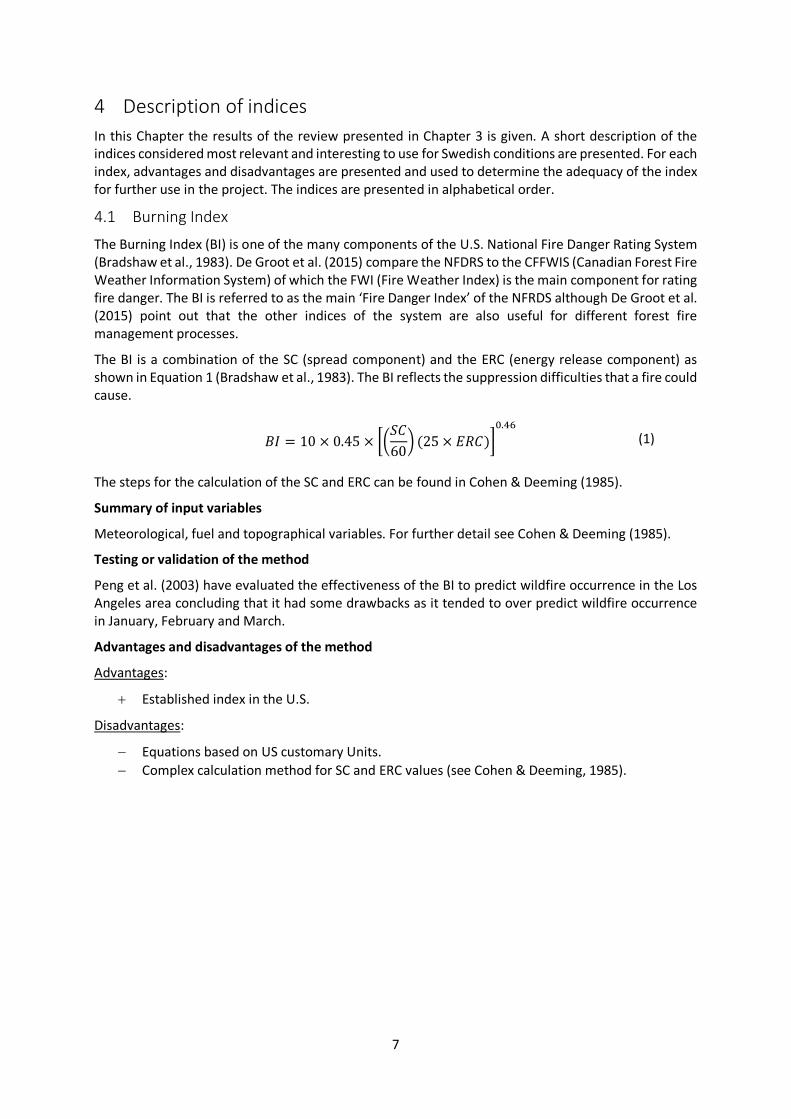
4.1 Burning Index
The Burning Index (BI) is one of the many components of the U.S. National Fire Danger Rating System (Bradshaw et al., 1983). De Groot et al. (2015) compare the NFDRS to the CFFWIS (Canadian Forest Fire Weather Information System) of which the FWI (Fire Weather Index) is the main component for rating fire danger. The BI is referred to as the main ‘Fire Danger Index’ of the NFRDS although De Groot et al. (2015) point out that the other indices of the system are also useful for different forest fire management processes.
The BI is a combination of the SC (spread component) and the ERC (energy release component) as shown in Equation 1 (Bradshaw et al., 1983). The BI reflects the suppression difficulties that a fire could cause.
𝐵𝐵𝐵𝐵 = 10 × 0.45 × ��𝑆𝑆𝑆𝑆60� (25 × 𝐸𝐸𝐸𝐸𝑆𝑆)�
0.46
(1)
The steps for the calculation of the SC and ERC can be found in Cohen & Deeming (1985).
Summary of input variables
Meteorological, fuel and topographical variables. For further detail see Cohen & Deeming (1985).
Testing or validation of the method
Peng et al. (2003) have evaluated the effectiveness of the BI to predict wildfire occurrence in the Los Angeles area concluding that it had some drawbacks as it tended to over predict wildfire occurrence in January, February and March.
Advantages and disadvantages of the method
Advantages:
+ Established index in the U.S.
Disadvantages:
− Equations based on US customary Units. − Complex calculation method for SC and ERC values (see Cohen & Deeming, 1985).
8
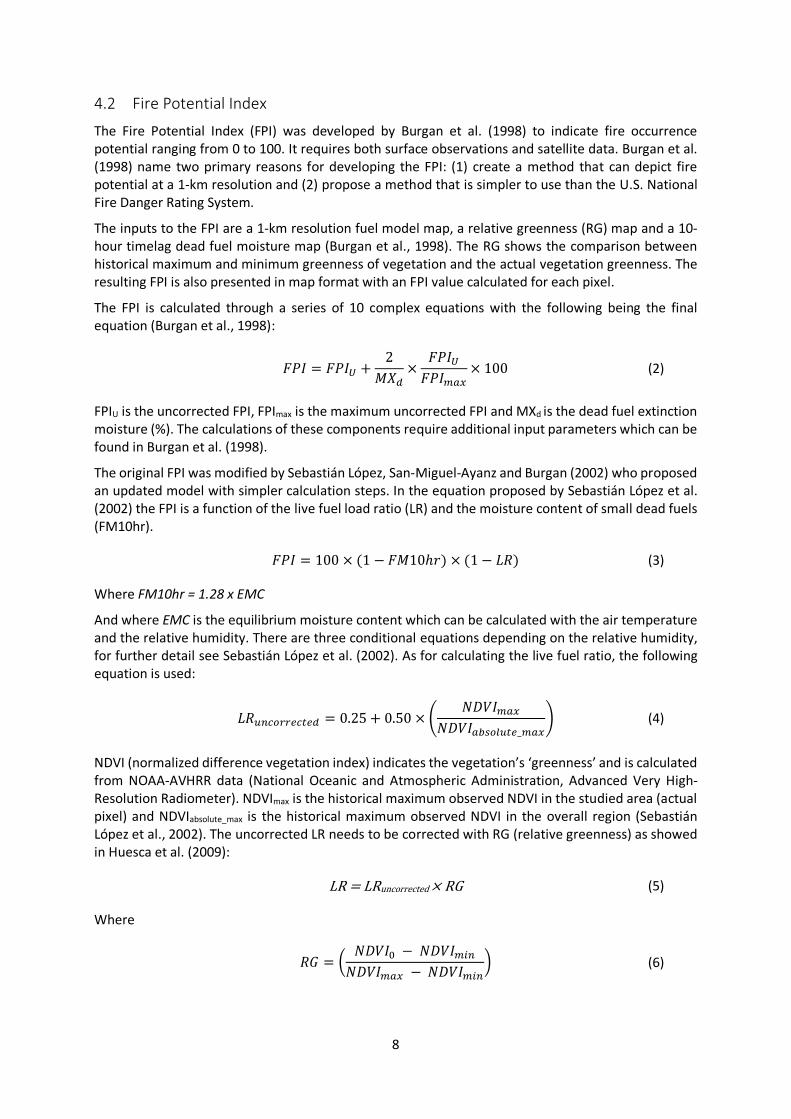
4.2 Fire Potential Index
The Fire Potential Index (FPI) was developed by Burgan et al. (1998) to indicate fire occurrence potential ranging from 0 to 100. It requires both surface observations and satellite data. Burgan et al. (1998) name two primary reasons for developing the FPI: (1) create a method that can depict fire potential at a 1-km resolution and (2) propose a method that is simpler to use than the U.S. National Fire Danger Rating System.
The inputs to the FPI are a 1-km resolution fuel model map, a relative greenness (RG) map and a 10-hour timelag dead fuel moisture map (Burgan et al., 1998). The RG shows the comparison between historical maximum and minimum greenness of vegetation and the actual vegetation greenness. The resulting FPI is also presented in map format with an FPI value calculated for each pixel.
The FPI is calculated through a series of 10 complex equations with the following being the final equation (Burgan et al., 1998):
𝐹𝐹𝐹𝐹𝐵𝐵 = 𝐹𝐹𝐹𝐹𝐵𝐵𝑈𝑈 +2
𝑀𝑀𝑀𝑀𝑑𝑑×
𝐹𝐹𝐹𝐹𝐵𝐵𝑈𝑈𝐹𝐹𝐹𝐹𝐵𝐵𝑚𝑚𝑚𝑚𝑚𝑚
× 100 (2)
FPIU is the uncorrected FPI, FPImax is the maximum uncorrected FPI and MXd is the dead fuel extinction moisture (%). The calculations of these components require additional input parameters which can be found in Burgan et al. (1998).
The original FPI was modified by Sebastián López, San-Miguel-Ayanz and Burgan (2002) who proposed an updated model with simpler calculation steps. In the equation proposed by Sebastián López et al. (2002) the FPI is a function of the live fuel load ratio (LR) and the moisture content of small dead fuels (FM10hr).
𝐹𝐹𝐹𝐹𝐵𝐵 = 100 × (1 − 𝐹𝐹𝑀𝑀10ℎ𝑟𝑟) × (1− 𝐿𝐿𝐸𝐸) (3)
Where FM10hr = 1.28 x EMC
And where EMC is the equilibrium moisture content which can be calculated with the air temperature and the relative humidity. There are three conditional equations depending on the relative humidity, for further detail see Sebastián López et al. (2002). As for calculating the live fuel ratio, the following equation is used:
𝐿𝐿𝐸𝐸𝑢𝑢𝑢𝑢𝑢𝑢𝑢𝑢𝑢𝑢𝑢𝑢𝑢𝑢𝑢𝑢𝑢𝑢𝑢𝑢𝑑𝑑 = 0.25 + 0.50 × �𝑁𝑁𝑁𝑁𝑁𝑁𝐵𝐵𝑚𝑚𝑚𝑚𝑚𝑚
𝑁𝑁𝑁𝑁𝑁𝑁𝐵𝐵𝑚𝑚𝑎𝑎𝑎𝑎𝑢𝑢𝑎𝑎𝑢𝑢𝑢𝑢𝑢𝑢_𝑚𝑚𝑚𝑚𝑚𝑚� (4)
NDVI (normalized difference vegetation index) indicates the vegetation’s ‘greenness’ and is calculated from NOAA-AVHRR data (National Oceanic and Atmospheric Administration, Advanced Very High-Resolution Radiometer). NDVImax is the historical maximum observed NDVI in the studied area (actual pixel) and NDVIabsolute_max is the historical maximum observed NDVI in the overall region (Sebastián López et al., 2002). The uncorrected LR needs to be corrected with RG (relative greenness) as showed in Huesca et al. (2009):
LR = LRuncorrected × RG (5)
Where
𝐸𝐸𝑅𝑅 = �𝑁𝑁𝑁𝑁𝑁𝑁𝐵𝐵0 − 𝑁𝑁𝑁𝑁𝑁𝑁𝐵𝐵𝑚𝑚𝑚𝑚𝑢𝑢
𝑁𝑁𝑁𝑁𝑁𝑁𝐵𝐵𝑚𝑚𝑚𝑚𝑚𝑚 − 𝑁𝑁𝑁𝑁𝑁𝑁𝐵𝐵𝑚𝑚𝑚𝑚𝑢𝑢� (6)
9
Carrao et al. (2003) describe that for the NDVI0 value (the highest observed value of a pixel at a given time) they used a 10-day composite period to create a balance between having enough time for the image processing and still having fairly recent NDVI values.
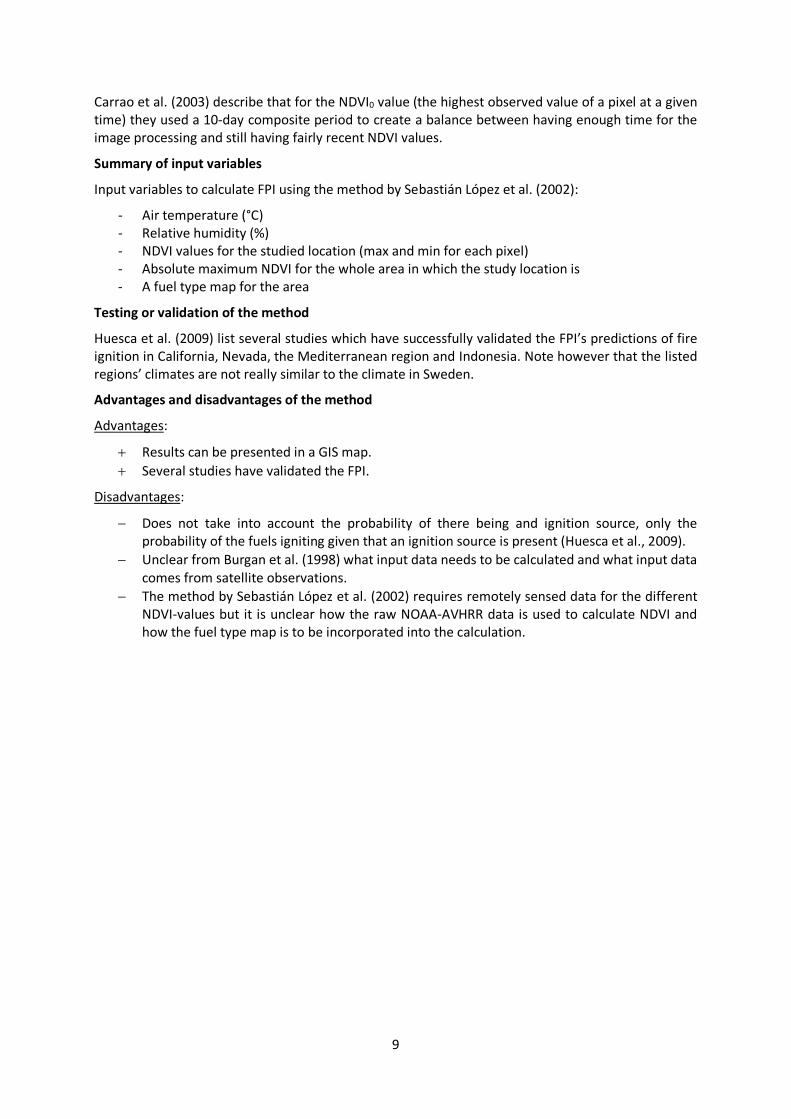
Summary of input variables
Input variables to calculate FPI using the method by Sebastián López et al. (2002):
- Air temperature (°C) - Relative humidity (%) - NDVI values for the studied location (max and min for each pixel) - Absolute maximum NDVI for the whole area in which the study location is - A fuel type map for the area
Testing or validation of the method
Huesca et al. (2009) list several studies which have successfully validated the FPI’s predictions of fire ignition in California, Nevada, the Mediterranean region and Indonesia. Note however that the listed regions’ climates are not really similar to the climate in Sweden.
Advantages and disadvantages of the method
Advantages:
+ Results can be presented in a GIS map. + Several studies have validated the FPI.
Disadvantages:
− Does not take into account the probability of there being and ignition source, only the probability of the fuels igniting given that an ignition source is present (Huesca et al., 2009).
− Unclear from Burgan et al. (1998) what input data needs to be calculated and what input data comes from satellite observations.
− The method by Sebastián López et al. (2002) requires remotely sensed data for the different NDVI-values but it is unclear how the raw NOAA-AVHRR data is used to calculate NDVI and how the fuel type map is to be incorporated into the calculation.
10
4.3 Fire Weather Index
The Fire Weather Index (FWI) is a component of the Canadian Forest Fire Weather Index System (CFFWIS) which in turn is a sub-system of the national system used in Canada: the Canadian Forest Fire Danger Rating System (CFFDRS) (de Groot, 1987). The FWI, presented in 1970, was developed by researchers from the Canadian Forestry Service. It has a strong link with research which started in the 20s and early models developed in Canada based on field sampling and field experiments. The FWI has been revised several times since its original version (van Wagner, 1987).
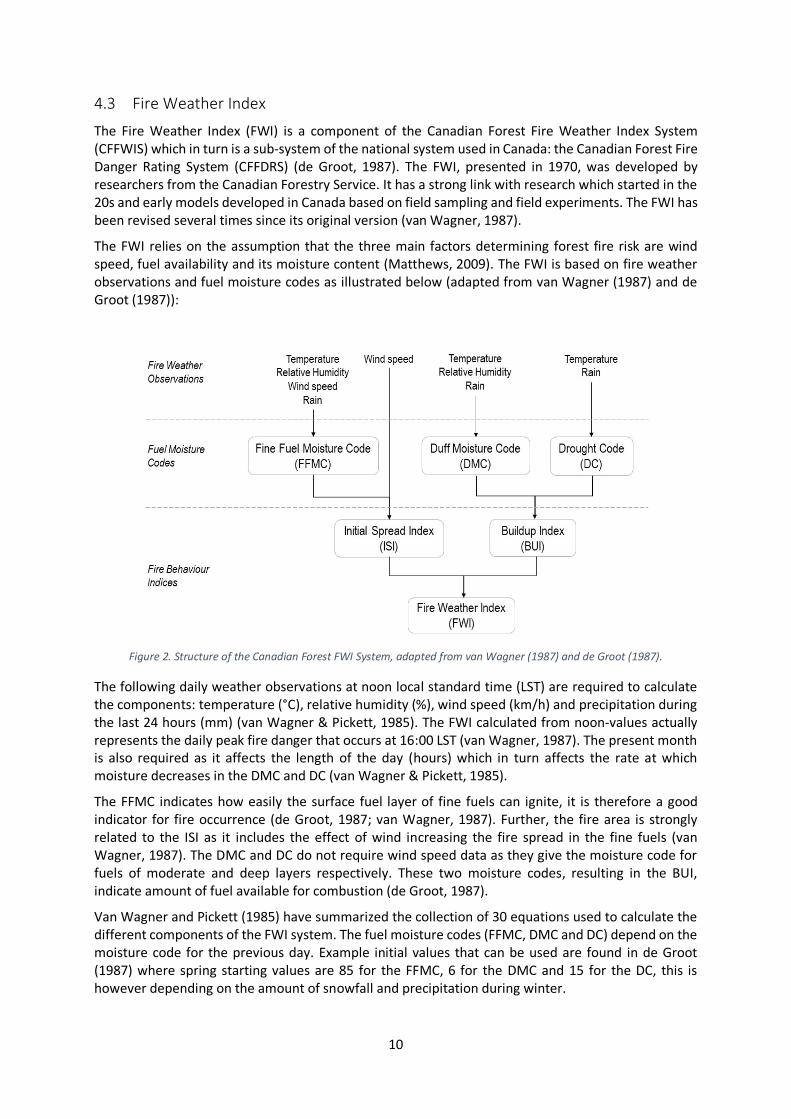
The FWI relies on the assumption that the three main factors determining forest fire risk are wind speed, fuel availability and its moisture content (Matthews, 2009). The FWI is based on fire weather observations and fuel moisture codes as illustrated below (adapted from van Wagner (1987) and de Groot (1987)):
Figure 2. Structure of the Canadian Forest FWI System, adapted from van Wagner (1987) and de Groot (1987).
The following daily weather observations at noon local standard time (LST) are required to calculate the components: temperature (°C), relative humidity (%), wind speed (km/h) and precipitation during the last 24 hours (mm) (van Wagner & Pickett, 1985). The FWI calculated from noon-values actually represents the daily peak fire danger that occurs at 16:00 LST (van Wagner, 1987). The present month is also required as it affects the length of the day (hours) which in turn affects the rate at which moisture decreases in the DMC and DC (van Wagner & Pickett, 1985).
The FFMC indicates how easily the surface fuel layer of fine fuels can ignite, it is therefore a good indicator for fire occurrence (de Groot, 1987; van Wagner, 1987). Further, the fire area is strongly related to the ISI as it includes the effect of wind increasing the fire spread in the fine fuels (van Wagner, 1987). The DMC and DC do not require wind speed data as they give the moisture code for fuels of moderate and deep layers respectively. These two moisture codes, resulting in the BUI, indicate amount of fuel available for combustion (de Groot, 1987).
Van Wagner and Pickett (1985) have summarized the collection of 30 equations used to calculate the different components of the FWI system. The fuel moisture codes (FFMC, DMC and DC) depend on the moisture code for the previous day. Example initial values that can be used are found in de Groot (1987) where spring starting values are 85 for the FFMC, 6 for the DMC and 15 for the DC, this is however depending on the amount of snowfall and precipitation during winter.
11
The resulting index values are usually rounded to the nearest whole value. The FWI can range from zero to ‘infinity’ as it does not have a maximum value. Different intervals can be given danger classes, for example ‘very low’ to ‘extreme’. Van Wagner (1987) stresses that setting the danger ratings and corresponding FWI values should be done locally as the fire weather differs between regions. For a description of a possible method for choosing danger classes see Van Wagner (1987).
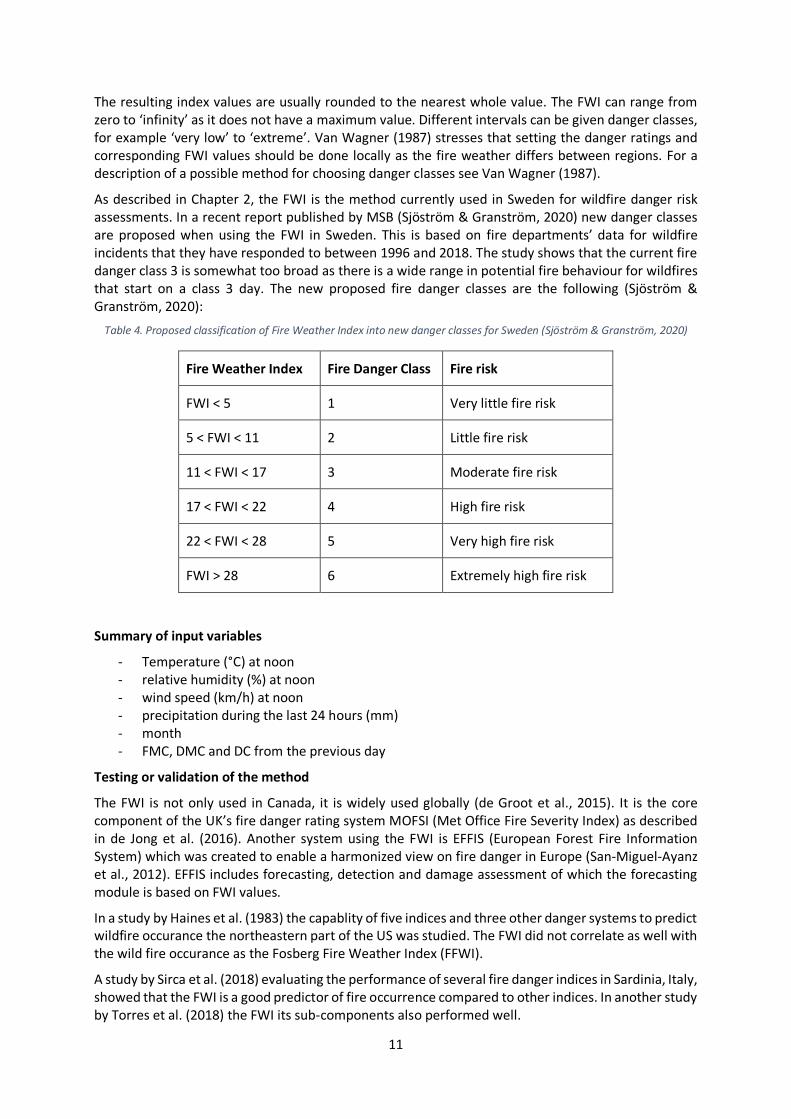
As described in Chapter 2, the FWI is the method currently used in Sweden for wildfire danger risk assessments. In a recent report published by MSB (Sjöström & Granström, 2020) new danger classes are proposed when using the FWI in Sweden. This is based on fire departments’ data for wildfire incidents that they have responded to between 1996 and 2018. The study shows that the current fire danger class 3 is somewhat too broad as there is a wide range in potential fire behaviour for wildfires that start on a class 3 day. The new proposed fire danger classes are the following (Sjöström & Granström, 2020):
Table 4. Proposed classification of Fire Weather Index into new danger classes for Sweden (Sjöström & Granström, 2020)
Fire Weather Index Fire Danger Class Fire risk
FWI < 5 1 Very little fire risk
5 < FWI < 11 2 Little fire risk
11 < FWI < 17 3 Moderate fire risk
17 < FWI < 22 4 High fire risk
22 < FWI < 28 5 Very high fire risk
FWI > 28 6 Extremely high fire risk
Summary of input variables
- Temperature (°C) at noon - relative humidity (%) at noon - wind speed (km/h) at noon - precipitation during the last 24 hours (mm) - month - FMC, DMC and DC from the previous day
Testing or validation of the method
The FWI is not only used in Canada, it is widely used globally (de Groot et al., 2015). It is the core component of the UK’s fire danger rating system MOFSI (Met Office Fire Severity Index) as described in de Jong et al. (2016). Another system using the FWI is EFFIS (European Forest Fire Information System) which was created to enable a harmonized view on fire danger in Europe (San-Miguel-Ayanz et al., 2012). EFFIS includes forecasting, detection and damage assessment of which the forecasting module is based on FWI values.
In a study by Haines et al. (1983) the capablity of five indices and three other danger systems to predict wildfire occurance the northeastern part of the US was studied. The FWI did not correlate as well with the wild fire occurance as the Fosberg Fire Weather Index (FFWI).
A study by Sirca et al. (2018) evaluating the performance of several fire danger indices in Sardinia, Italy, showed that the FWI is a good predictor of fire occurrence compared to other indices. In another study by Torres et al. (2018) the FWI its sub-components also performed well.
12
Advantages and disadvantages of the method
Advantages:
+ The index requires basic weather data which can be easily accessed. + It is a widely established and used index. (Currently used in Sweden.) + The different sub-components can be used to interpret different potential fire characteristics.
Disadvantages:
− There is large amount of equations (30) and steps to calculate the FWI. − Startup time required / calibration as FMC, DMC and DC are required for the previous day. − The FWI does not take into account fuel types and topography.
13
4.4 Forest Fire Behaviour Tables
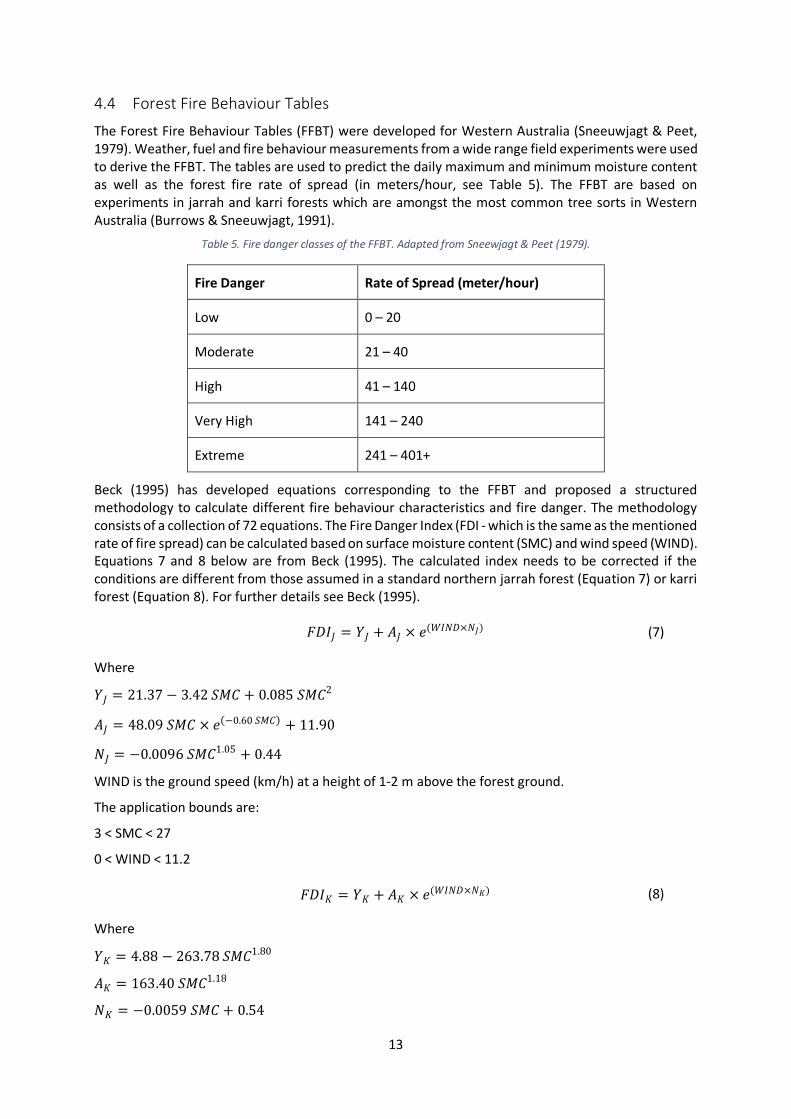
The Forest Fire Behaviour Tables (FFBT) were developed for Western Australia (Sneeuwjagt & Peet, 1979). Weather, fuel and fire behaviour measurements from a wide range field experiments were used to derive the FFBT. The tables are used to predict the daily maximum and minimum moisture content as well as the forest fire rate of spread (in meters/hour, see Table 5). The FFBT are based on experiments in jarrah and karri forests which are amongst the most common tree sorts in Western Australia (Burrows & Sneeuwjagt, 1991).
Table 5. Fire danger classes of the FFBT. Adapted from Sneewjagt & Peet (1979).
Fire Danger Rate of Spread (meter/hour)
Low 0 – 20
Moderate 21 – 40
High 41 – 140
Very High 141 – 240
Extreme 241 – 401+
Beck (1995) has developed equations corresponding to the FFBT and proposed a structured methodology to calculate different fire behaviour characteristics and fire danger. The methodology consists of a collection of 72 equations. The Fire Danger Index (FDI - which is the same as the mentioned rate of fire spread) can be calculated based on surface moisture content (SMC) and wind speed (WIND). Equations 7 and 8 below are from Beck (1995). The calculated index needs to be corrected if the conditions are different from those assumed in a standard northern jarrah forest (Equation 7) or karri forest (Equation 8). For further details see Beck (1995).
𝐹𝐹𝑁𝑁𝐵𝐵𝐽𝐽 = 𝑌𝑌𝐽𝐽 + 𝐴𝐴𝐽𝐽 × 𝑒𝑒(𝑊𝑊𝐵𝐵𝑁𝑁𝑁𝑁×𝑁𝑁𝐽𝐽) (7)
Where
𝑌𝑌𝐽𝐽 = 21.37 − 3.42 𝑆𝑆𝑀𝑀𝑆𝑆 + 0.085 𝑆𝑆𝑀𝑀𝑆𝑆2
𝐴𝐴𝐽𝐽 = 48.09 𝑆𝑆𝑀𝑀𝑆𝑆 × 𝑒𝑒(−0.60 𝑆𝑆𝑀𝑀𝑆𝑆) + 11.90
𝑁𝑁𝐽𝐽 = −0.0096 𝑆𝑆𝑀𝑀𝑆𝑆1.05 + 0.44
WIND is the ground speed (km/h) at a height of 1-2 m above the forest ground.
The application bounds are:
3 < SMC < 27
0 < WIND < 11.2
𝐹𝐹𝑁𝑁𝐵𝐵𝐾𝐾 = 𝑌𝑌𝐾𝐾 + 𝐴𝐴𝐾𝐾 × 𝑒𝑒(𝑊𝑊𝐵𝐵𝑁𝑁𝑁𝑁×𝑁𝑁𝐾𝐾) (8)
Where
𝑌𝑌𝐾𝐾 = 4.88 − 263.78 𝑆𝑆𝑀𝑀𝑆𝑆1.80
𝐴𝐴𝐾𝐾 = 163.40 𝑆𝑆𝑀𝑀𝑆𝑆1.18
𝑁𝑁𝐾𝐾 = −0.0059 𝑆𝑆𝑀𝑀𝑆𝑆 + 0.54
14
The application bounds are:
3 < SMC < 25
0 < WIND < 7.2
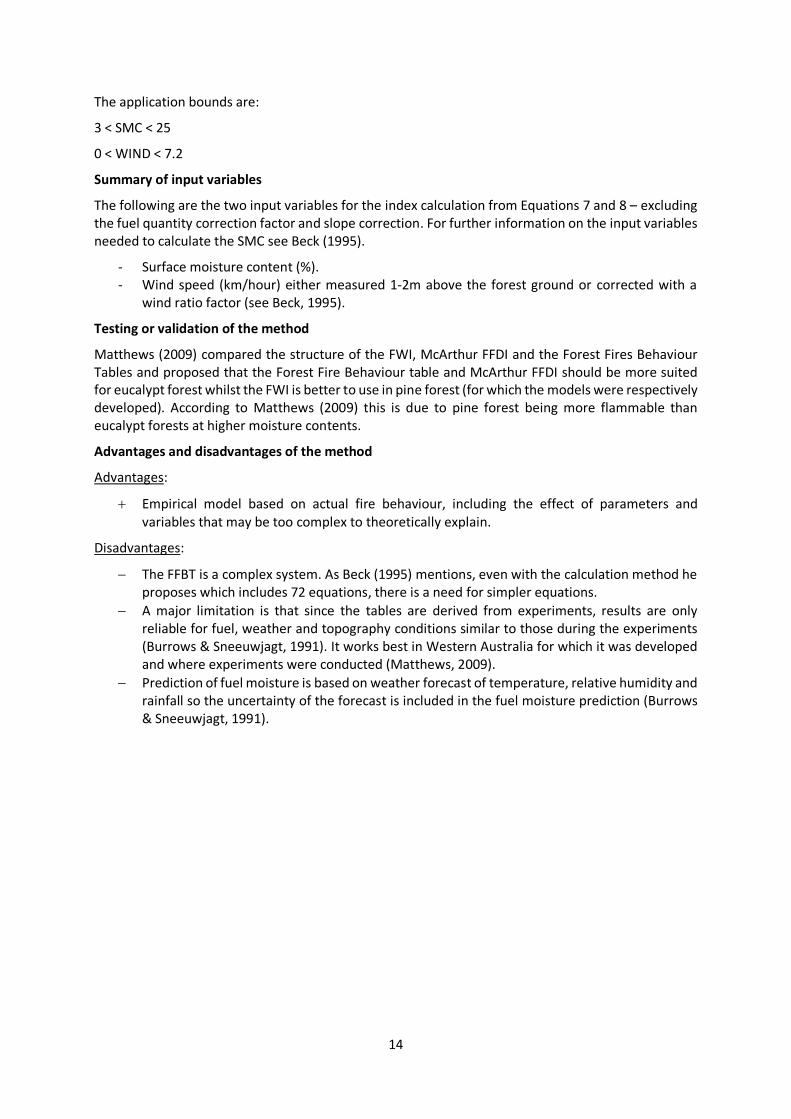
Summary of input variables
The following are the two input variables for the index calculation from Equations 7 and 8 – excluding the fuel quantity correction factor and slope correction. For further information on the input variables needed to calculate the SMC see Beck (1995).
- Surface moisture content (%). - Wind speed (km/hour) either measured 1-2m above the forest ground or corrected with a
wind ratio factor (see Beck, 1995).
Testing or validation of the method
Matthews (2009) compared the structure of the FWI, McArthur FFDI and the Forest Fires Behaviour Tables and proposed that the Forest Fire Behaviour table and McArthur FFDI should be more suited for eucalypt forest whilst the FWI is better to use in pine forest (for which the models were respectively developed). According to Matthews (2009) this is due to pine forest being more flammable than eucalypt forests at higher moisture contents.
Advantages and disadvantages of the method
Advantages:
+ Empirical model based on actual fire behaviour, including the effect of parameters and variables that may be too complex to theoretically explain.
Disadvantages:
− The FFBT is a complex system. As Beck (1995) mentions, even with the calculation method he proposes which includes 72 equations, there is a need for simpler equations.
− A major limitation is that since the tables are derived from experiments, results are only reliable for fuel, weather and topography conditions similar to those during the experiments (Burrows & Sneeuwjagt, 1991). It works best in Western Australia for which it was developed and where experiments were conducted (Matthews, 2009).
− Prediction of fuel moisture is based on weather forecast of temperature, relative humidity and rainfall so the uncertainty of the forecast is included in the fuel moisture prediction (Burrows & Sneeuwjagt, 1991).
15
4.5 Fosberg Fire Weather Index
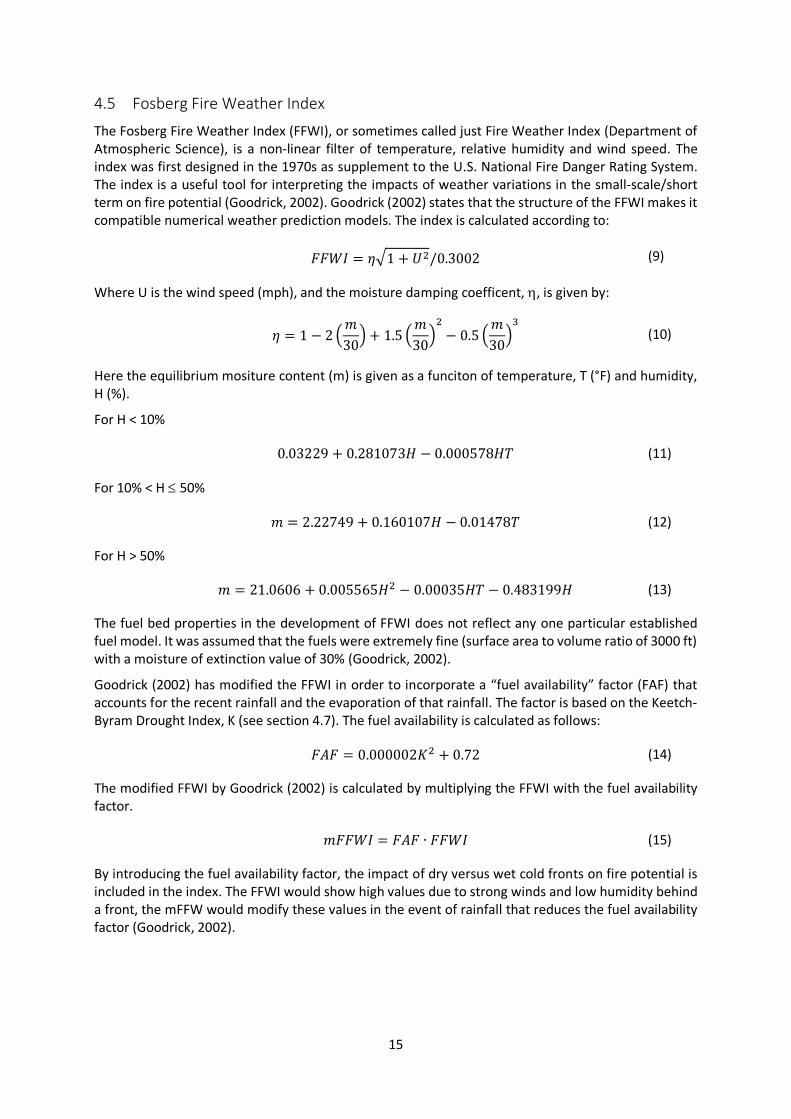
The Fosberg Fire Weather Index (FFWI), or sometimes called just Fire Weather Index (Department of Atmospheric Science), is a non-linear filter of temperature, relative humidity and wind speed. The index was first designed in the 1970s as supplement to the U.S. National Fire Danger Rating System. The index is a useful tool for interpreting the impacts of weather variations in the small-scale/short term on fire potential (Goodrick, 2002). Goodrick (2002) states that the structure of the FFWI makes it compatible numerical weather prediction models. The index is calculated according to:
𝐹𝐹𝐹𝐹𝑊𝑊𝐵𝐵 = 𝜂𝜂�1 + 𝑈𝑈2/0.3002 (9)
Where U is the wind speed (mph), and the moisture damping coefficent, η, is given by:
𝜂𝜂 = 1 − 2 �𝑚𝑚30�+ 1.5 �
𝑚𝑚30�2− 0.5 �
𝑚𝑚30�3 (10)
Here the equilibrium mositure content (m) is given as a funciton of temperature, T (°F) and humidity, H (%).
For H < 10%
0.03229 + 0.281073𝐻𝐻 − 0.000578𝐻𝐻𝐻𝐻 (11)
For 10% < H ≤ 50%
𝑚𝑚 = 2.22749 + 0.160107𝐻𝐻 − 0.01478𝐻𝐻 (12)
For H > 50%
𝑚𝑚 = 21.0606 + 0.005565𝐻𝐻2 − 0.00035𝐻𝐻𝐻𝐻 − 0.483199𝐻𝐻 (13)
The fuel bed properties in the development of FFWI does not reflect any one particular established fuel model. It was assumed that the fuels were extremely fine (surface area to volume ratio of 3000 ft) with a moisture of extinction value of 30% (Goodrick, 2002).
Goodrick (2002) has modified the FFWI in order to incorporate a “fuel availability” factor (FAF) that accounts for the recent rainfall and the evaporation of that rainfall. The factor is based on the Keetch-Byram Drought Index, K (see section 4.7). The fuel availability is calculated as follows:
𝐹𝐹𝐴𝐴𝐹𝐹 = 0.000002𝐾𝐾2 + 0.72 (14)
The modified FFWI by Goodrick (2002) is calculated by multiplying the FFWI with the fuel availability factor.
𝑚𝑚𝐹𝐹𝐹𝐹𝑊𝑊𝐵𝐵 = 𝐹𝐹𝐴𝐴𝐹𝐹 ∙ 𝐹𝐹𝐹𝐹𝑊𝑊𝐵𝐵 (15)
By introducing the fuel availability factor, the impact of dry versus wet cold fronts on fire potential is included in the index. The FFWI would show high values due to strong winds and low humidity behind a front, the mFFW would modify these values in the event of rainfall that reduces the fuel availability factor (Goodrick, 2002).
16
Summary of input variables
− Wind speed, U (mph) − Temperature, T (°F) − Humidity, H (%) − Keetch-Byram Drought Index, K
Testing or validation of the method
Haines et al. (1983) studied the capablity of five indices and three other danger systems to predict wildfire occurance. The predictive capablitiy was compared to data from 10 wildfires at seven locations in the northeastern part of the U.S. It was seen that FFWI had the strongest non-linear correlation amongst the studied methods.
Another study (Sirca et al., 2018) of the performance of the indices in a Mediterranean area (Sardinia) showed that the FFWI had good results, it showed the second best results of amongst 9 indices for its predictive performance.
Advantages and disadvantages of the method
Advantages:
+ Established method, that is in current use in the U.S. + The FFWI has been evaluated in different places (the U.S. and Sardinia) and showed good
results.
Disadvantages:
− Topography or geographical variables are not included in the index. − Ignition factors such as human activity or the vicinity to urban areas, are not taken in account. − Not known to have been evaluated for northern European conditions.

17
4.6 Haines Index (LASI)
The Haines Index (HI) was originally developed under the name Lower Atmosphere Severity Index (LASI) (Haines, 1988). It is used to predict the potential for large wildfires based on the conditions of the lower atmosphere.
The HI is based on data from 74 fires that occurred in the U.S. and were considered to be the ‘worst fire situations’ during the last 20 years (i.e. back to the 1960s) (Haines, 1988). No information is however given on the size of what is considered a ‘major fire’ in the study by Haines (1988). The historical data was analyzed and used to derive the values for the A and B components, see Table 6. Haines index is calculated with Equation 16, using the values from Table 6.
HI = A + B (16)
Table 6. Values of A and B for the calculation of HI at the three different elevation levels. T and TD indicate temperature and dew point temperature at the respective pressure levels.
Elevation Stability component (A) Humidity component (B)
Low
∆𝐻𝐻𝐴𝐴 = 𝐻𝐻950 − 𝐻𝐻850
ΔTA < 4°C
4°C < ΔTA < 7°C
ΔTA > 7°C
A = 1
A = 2
A = 3
∆𝐻𝐻𝐵𝐵 = 𝐻𝐻850 − 𝐻𝐻𝑑𝑑850
ΔTB < 6°C
6°C < ΔTB < 9°C
ΔTB > 9°C
B = 1
B = 2
B = 3
Mid
∆𝐻𝐻𝐴𝐴 = 𝐻𝐻850 − 𝐻𝐻700
ΔTA < 6°C
6°C < ΔTA < 10°C
ΔTA > 10°C
A = 1
A = 2
A = 3
∆𝐻𝐻𝐵𝐵 = 𝐻𝐻850 − 𝐻𝐻𝑑𝑑850
ΔTB < 6°C
6°C < ΔTB < 12°C
ΔTB > 12°C
B = 1
B = 2
B = 3
High
∆𝐻𝐻𝐴𝐴 = 𝐻𝐻700 − 𝐻𝐻500
ΔTA < 18°C
18°C < ΔTA < 21°C
ΔTA > 21°C
A = 1
A = 2
A = 3
∆𝐻𝐻𝐵𝐵 = 𝐻𝐻700 − 𝐻𝐻𝑑𝑑700
ΔTB < 15°C
15°C < ΔTB < 20°C
ΔTB > 20°C
B = 1
B = 2
B = 3
As explained by Haines (1988) one should first identify the elevation level which applies to the region where the HI is to be calculated.
This depends on the surface elevation above sea level. To select the elevation level of the studied region the following classification given by Barberà et al. (2015) can be used. The elevation level is:
- Low, if the surface elevation above sea level is < 305 m - Mid, if the surface elevation above sea level is between 305 and 914 m - High, if the surface elevation above sea level is > 914 m
Then the temperature (°C) at the two pressure levels of the chosen elevation is needed to decide the value for A. To decide the value for B, the temperature of one of the two pressure levels and the dew point temperature of the same pressure level is needed. Observations should be done when the temperatures and instability reach their maximum value, in the Mediterranean Basin this is at 1200 GMT (Tatli & Türkes, 2014).
The following danger classes (‘potential for large fire’) are given by Haines (1988) for HI:
2 or 3 = very low, 4 = low, 5 = moderate, 6 = high.
18
Summary of input variables
If the actual elevation level has pressure boundaries P1 and P2:
- Temperature (°C) at P1 - Temperature (°C) at P2 - Dew point temperature (°C) at either P1 or P2
Testing or validation of the method
Tatli & Türkes (2014) and Barberà et al. (2015) present several studies in both the U.S. and Australia that have shown that the Haines Index is a good predictor of fire activity.
Advantages and disadvantages of the method
Advantages:
+ Considers factors which are different from the majority of other wildfire indices and it seems to work well in predicting large wildfires.
+ Very simple to calculate once data is obtained.
Disadvantages:
− The required data for the input parameters may be difficult to obtain, during the study by Tatli & Türkes (2014) there wasn’t enough radiosonde data. They used reanalysis fields to derive temperature data and had to extrapolate data for one of the pressure levels which is a rather complicated method. The same method was employed by Barberà et al. (2015).
− Does not take into account meteorological effects on wildfires which have been shown with many other indices to be of importance.
19
4.7 Keetch-Byram Drought Index
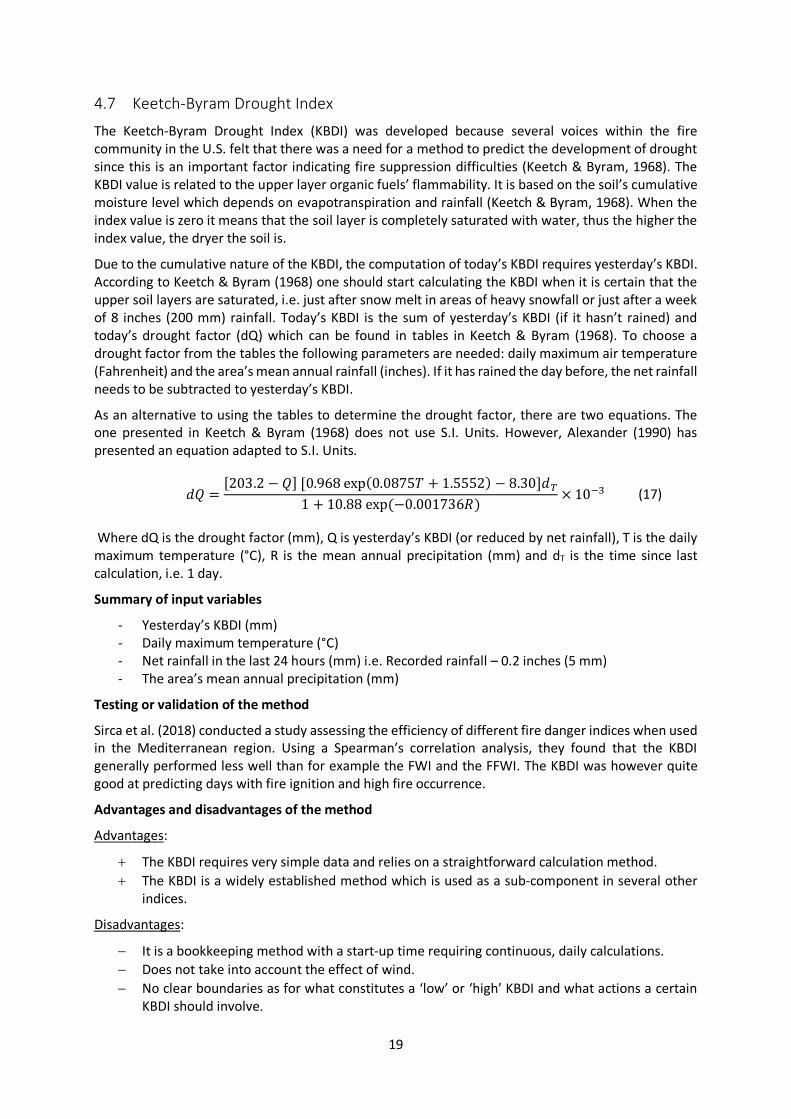
The Keetch-Byram Drought Index (KBDI) was developed because several voices within the fire community in the U.S. felt that there was a need for a method to predict the development of drought since this is an important factor indicating fire suppression difficulties (Keetch & Byram, 1968). The KBDI value is related to the upper layer organic fuels’ flammability. It is based on the soil’s cumulative moisture level which depends on evapotranspiration and rainfall (Keetch & Byram, 1968). When the index value is zero it means that the soil layer is completely saturated with water, thus the higher the index value, the dryer the soil is.
Due to the cumulative nature of the KBDI, the computation of today’s KBDI requires yesterday’s KBDI. According to Keetch & Byram (1968) one should start calculating the KBDI when it is certain that the upper soil layers are saturated, i.e. just after snow melt in areas of heavy snowfall or just after a week of 8 inches (200 mm) rainfall. Today’s KBDI is the sum of yesterday’s KBDI (if it hasn’t rained) and today’s drought factor (dQ) which can be found in tables in Keetch & Byram (1968). To choose a drought factor from the tables the following parameters are needed: daily maximum air temperature (Fahrenheit) and the area’s mean annual rainfall (inches). If it has rained the day before, the net rainfall needs to be subtracted to yesterday’s KBDI.
As an alternative to using the tables to determine the drought factor, there are two equations. The one presented in Keetch & Byram (1968) does not use S.I. Units. However, Alexander (1990) has presented an equation adapted to S.I. Units.
𝑑𝑑𝑑𝑑 =[203.2 −𝑑𝑑] [0.968 exp(0.0875𝐻𝐻 + 1.5552) − 8.30]𝑑𝑑𝑇𝑇
1 + 10.88 exp (−0.001736𝐸𝐸)× 10−3 (17)
Where dQ is the drought factor (mm), Q is yesterday’s KBDI (or reduced by net rainfall), T is the daily maximum temperature (°C), R is the mean annual precipitation (mm) and dT is the time since last calculation, i.e. 1 day.
Summary of input variables
- Yesterday’s KBDI (mm) - Daily maximum temperature (°C) - Net rainfall in the last 24 hours (mm) i.e. Recorded rainfall – 0.2 inches (5 mm) - The area’s mean annual precipitation (mm)
Testing or validation of the method
Sirca et al. (2018) conducted a study assessing the efficiency of different fire danger indices when used in the Mediterranean region. Using a Spearman’s correlation analysis, they found that the KBDI generally performed less well than for example the FWI and the FFWI. The KBDI was however quite good at predicting days with fire ignition and high fire occurrence.
Advantages and disadvantages of the method
Advantages:
+ The KBDI requires very simple data and relies on a straightforward calculation method. + The KBDI is a widely established method which is used as a sub-component in several other
indices.
Disadvantages:
− It is a bookkeeping method with a start-up time requiring continuous, daily calculations. − Does not take into account the effect of wind. − No clear boundaries as for what constitutes a ‘low’ or ‘high’ KBDI and what actions a certain
KBDI should involve.
20
4.8 Integrated Fire Index
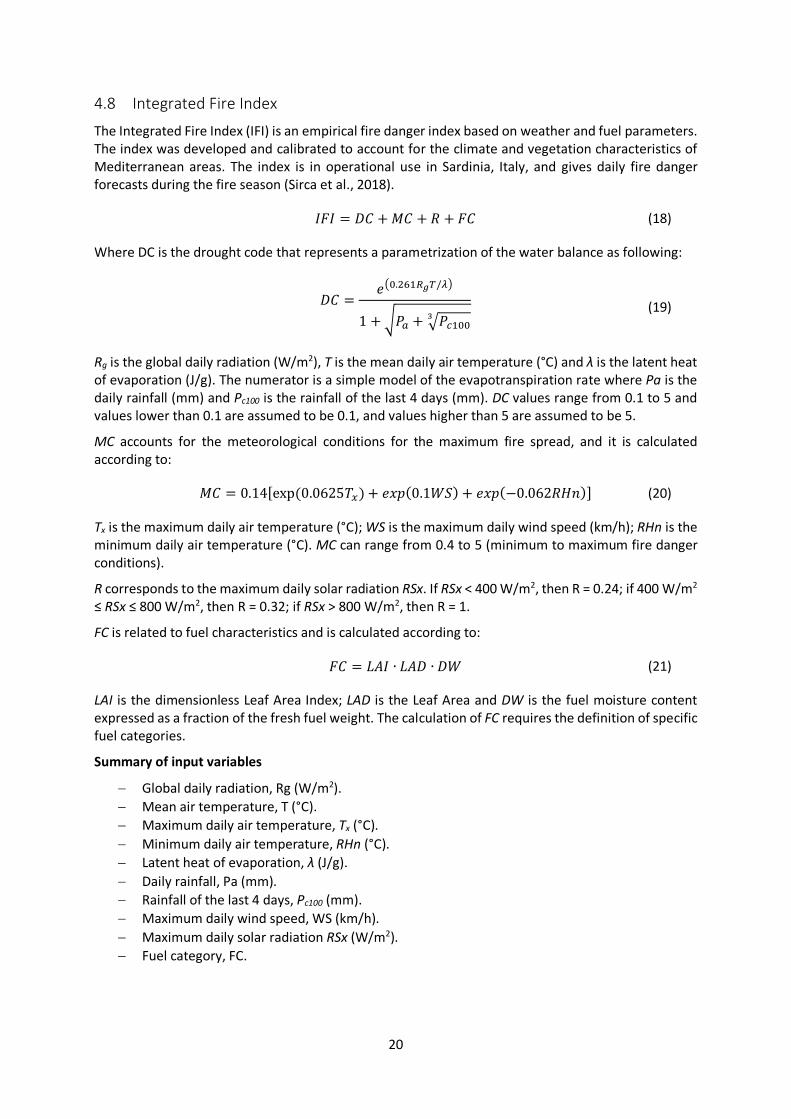
The Integrated Fire Index (IFI) is an empirical fire danger index based on weather and fuel parameters. The index was developed and calibrated to account for the climate and vegetation characteristics of Mediterranean areas. The index is in operational use in Sardinia, Italy, and gives daily fire danger forecasts during the fire season (Sirca et al., 2018).
𝐵𝐵𝐹𝐹𝐵𝐵 = 𝑁𝑁𝑆𝑆 +𝑀𝑀𝑆𝑆 + 𝐸𝐸 + 𝐹𝐹𝑆𝑆 (18)
Where DC is the drought code that represents a parametrization of the water balance as following:
𝑁𝑁𝑆𝑆 =𝑒𝑒�0.261𝑅𝑅𝑔𝑔𝑇𝑇/𝜆𝜆�
1 +�𝐹𝐹𝑚𝑚 + �𝐹𝐹𝑢𝑢1003
(19)
Rg is the global daily radiation (W/m2), T is the mean daily air temperature (°C) and λ is the latent heat of evaporation (J/g). The numerator is a simple model of the evapotranspiration rate where Pa is the daily rainfall (mm) and Pc100 is the rainfall of the last 4 days (mm). DC values range from 0.1 to 5 and values lower than 0.1 are assumed to be 0.1, and values higher than 5 are assumed to be 5.
MC accounts for the meteorological conditions for the maximum fire spread, and it is calculated according to:
𝑀𝑀𝑆𝑆 = 0.14[exp (0.0625𝐻𝐻𝑚𝑚) + 𝑒𝑒𝑒𝑒𝑒𝑒(0.1𝑊𝑊𝑆𝑆) + 𝑒𝑒𝑒𝑒𝑒𝑒(−0.062𝐸𝐸𝐻𝐻𝑅𝑅)] (20)
Tx is the maximum daily air temperature (°C); WS is the maximum daily wind speed (km/h); RHn is the minimum daily air temperature (°C). MC can range from 0.4 to 5 (minimum to maximum fire danger conditions).
R corresponds to the maximum daily solar radiation RSx. If RSx < 400 W/m2, then R = 0.24; if 400 W/m2 ≤ RSx ≤ 800 W/m2, then R = 0.32; if RSx > 800 W/m2, then R = 1.
FC is related to fuel characteristics and is calculated according to:
𝐹𝐹𝑆𝑆 = 𝐿𝐿𝐴𝐴𝐵𝐵 ∙ 𝐿𝐿𝐴𝐴𝑁𝑁 ∙ 𝑁𝑁𝑊𝑊 (21)
LAI is the dimensionless Leaf Area Index; LAD is the Leaf Area and DW is the fuel moisture content expressed as a fraction of the fresh fuel weight. The calculation of FC requires the definition of specific fuel categories.
Summary of input variables
− Global daily radiation, Rg (W/m2). − Mean air temperature, T (°C). − Maximum daily air temperature, Tx (°C). − Minimum daily air temperature, RHn (°C). − Latent heat of evaporation, λ (J/g). − Daily rainfall, Pa (mm). − Rainfall of the last 4 days, Pc100 (mm). − Maximum daily wind speed, WS (km/h). − Maximum daily solar radiation RSx (W/m2). − Fuel category, FC.
21
Testing or validation of the method
In a study (Sirca et al., 2018) of the performance of the indices in a Mediterranean area (Sardinia) the IFI was judged to be one of the indices that performed best.
Advantages and disadvantages of the method
Advantages:
+ Takes a lot of parameters into account (which can increase complexity and be a disadvantage).
Disadvantages:
− Relatively new method, that seems to only have been reviewed by the developers (no third party).
− Developed for Mediterranean conditions, not known to have been evaluated for northern European conditions.
− No account of topography or geographical variables. − No account of human activity, e.g. the vicinity to urban areas.
22
4.9 Index F
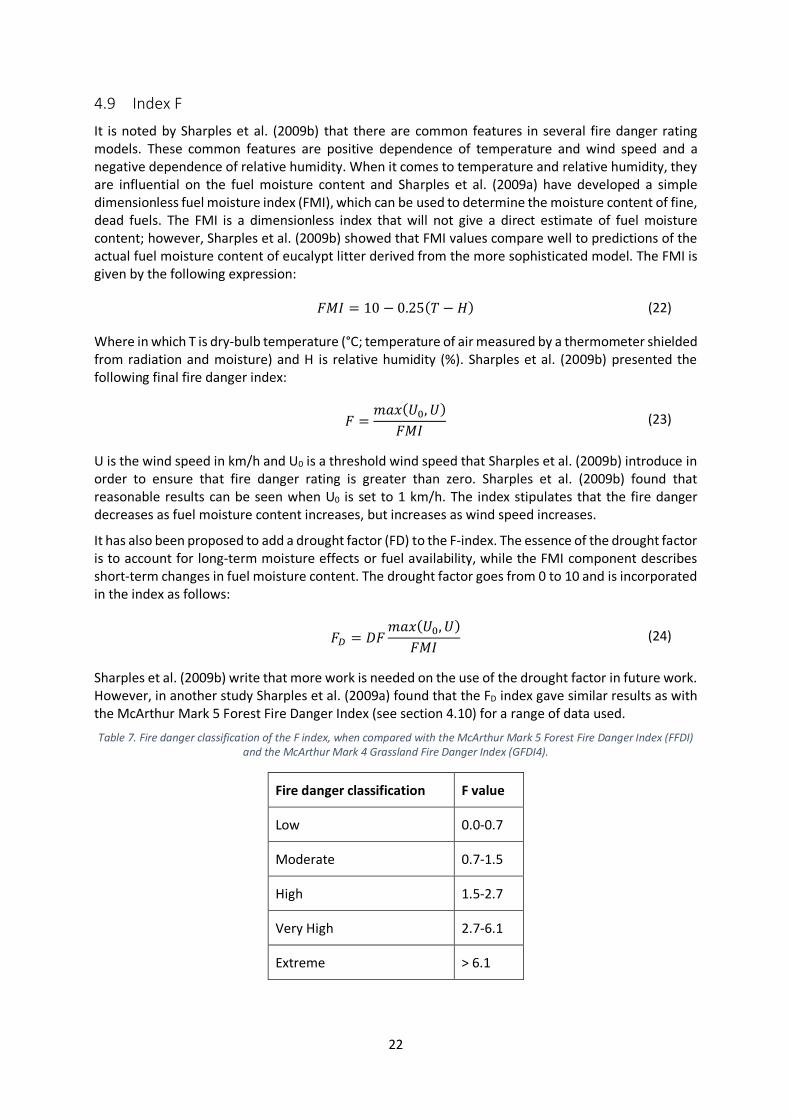
It is noted by Sharples et al. (2009b) that there are common features in several fire danger rating models. These common features are positive dependence of temperature and wind speed and a negative dependence of relative humidity. When it comes to temperature and relative humidity, they are influential on the fuel moisture content and Sharples et al. (2009a) have developed a simple dimensionless fuel moisture index (FMI), which can be used to determine the moisture content of fine, dead fuels. The FMI is a dimensionless index that will not give a direct estimate of fuel moisture content; however, Sharples et al. (2009b) showed that FMI values compare well to predictions of the actual fuel moisture content of eucalypt litter derived from the more sophisticated model. The FMI is given by the following expression:
𝐹𝐹𝑀𝑀𝐵𝐵 = 10 − 0.25(𝐻𝐻 − 𝐻𝐻) (22)
Where in which T is dry-bulb temperature (°C; temperature of air measured by a thermometer shielded from radiation and moisture) and H is relative humidity (%). Sharples et al. (2009b) presented the following final fire danger index:
𝐹𝐹 =𝑚𝑚𝑚𝑚𝑒𝑒(𝑈𝑈0,𝑈𝑈)
𝐹𝐹𝑀𝑀𝐵𝐵 (23)
U is the wind speed in km/h and U0 is a threshold wind speed that Sharples et al. (2009b) introduce in order to ensure that fire danger rating is greater than zero. Sharples et al. (2009b) found that reasonable results can be seen when U0 is set to 1 km/h. The index stipulates that the fire danger decreases as fuel moisture content increases, but increases as wind speed increases.
It has also been proposed to add a drought factor (FD) to the F-index. The essence of the drought factor is to account for long-term moisture effects or fuel availability, while the FMI component describes short-term changes in fuel moisture content. The drought factor goes from 0 to 10 and is incorporated in the index as follows:
𝐹𝐹𝐷𝐷 = 𝑁𝑁𝐹𝐹𝑚𝑚𝑚𝑚𝑒𝑒(𝑈𝑈0,𝑈𝑈)
𝐹𝐹𝑀𝑀𝐵𝐵 (24)
Sharples et al. (2009b) write that more work is needed on the use of the drought factor in future work. However, in another study Sharples et al. (2009a) found that the FD index gave similar results as with the McArthur Mark 5 Forest Fire Danger Index (see section 4.10) for a range of data used.
Table 7. Fire danger classification of the F index, when compared with the McArthur Mark 5 Forest Fire Danger Index (FFDI) and the McArthur Mark 4 Grassland Fire Danger Index (GFDI4).
Fire danger classification F value
Low 0.0-0.7
Moderate 0.7-1.5
High 1.5-2.7
Very High 2.7-6.1
Extreme > 6.1
23
Summary of input variables
− Wind speed, U (km/h) − Temperature, T (°C) − Humidity, H (%) − Drought factor
Testing or validation of the method
Sharples et al. (2009b) argue that the F-index provides a measure of fire danger rating that is roughly equivalent to that provided by the other indices, and in their paper, comparisons between fire danger ratings derived from existing models and the F index are made with data from Australia. The results were displayed in the form of scatter-plots and linear and rank correlation and error statistics were calculated. Comparisons were also made in in time series plots. In the comparisons the largest differences between the F index and the other indices occurred when the temperature and wind speed are high and relative humidity is low.
In another study (Sirca et al., 2018) of the performance of the indices in a Mediterranean area (Sardinia) it was shown that the F index had a significant fit to the observations, and the F index was ranked as 7 out of 9 studied indices.
Advantages and disadvantages of the method
Advantages:
+ Simple and straightforward calculation method.
Disadvantages:
− Relativley new method, that seems to only been reviewed by the developers (no third party). − Adjusted/benchmarked against existing methods, not known to be evaluated for northern
European conditions. − No account of topography or geographical variables. − No account of human activity, e.g. the vicinity to urban areas. − Limitied in the description of the cumulative drought.
24
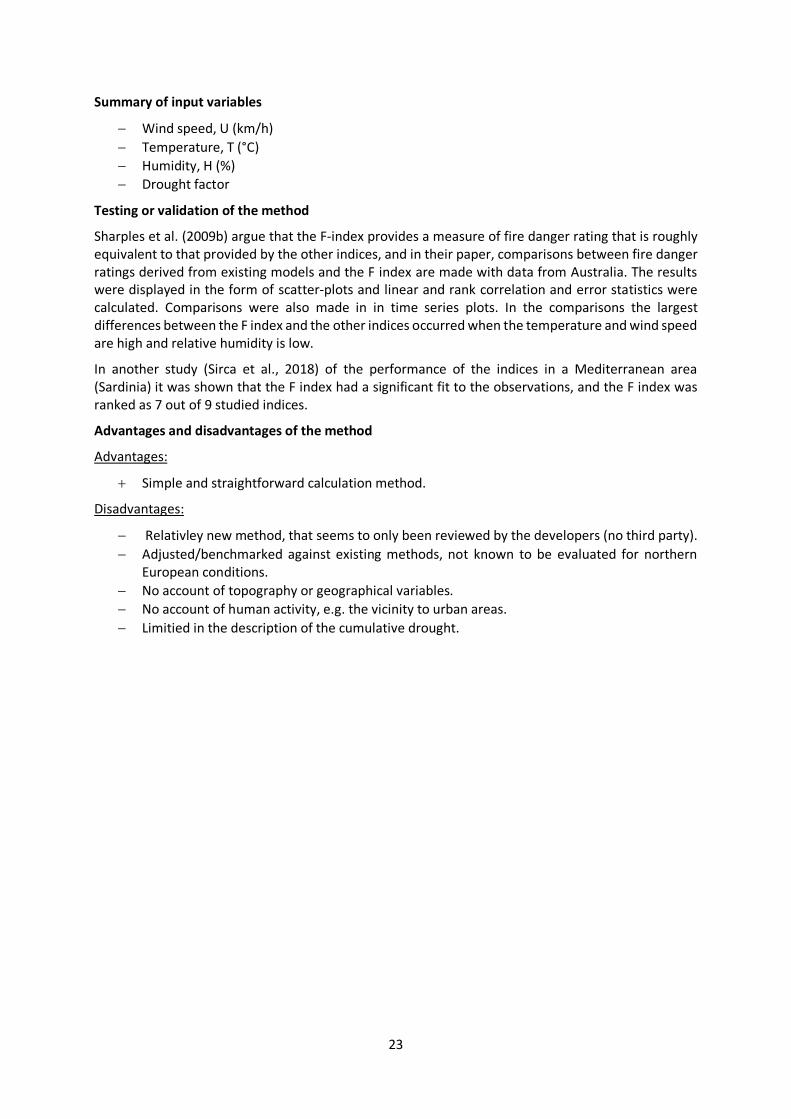
4.10 Mark 5 Forest Fire Danger Meter The McArthur Forest Fire Danger Meters were developed in the 1960s and have been widely used in eastern Australia. The meters are based on observations from more than 800 experimental and wild fire observations and were constructed without knowledge about the relations between variables. The forest fire danger meter currently in use in Australia is the Mark 5 Forest Fire Danger Meter, which has been said to be directly related to the chance of a fire igniting, its rate of spread and the difficulty of suppression. The meter produces an index referred to as the Forest Fire Danger Rating or Forest Fire Danger Index (FFDI) (CSIRO, n.d.), and since it is more practical to express the fire danger as with an equation, Noble et al. (1980) fitted equations to the meters. Noble et al. chose to base the equations on the meters rather than on the original data. This was because not all the original data was available and also to ensure a direct equivalence between the equations and the meters. The equation for the Forest Fire Danger Index that was developed is as follows:
𝐹𝐹 = 2.0exp (−0.450 + 0.987ln (𝑁𝑁) − 0.0345𝐻𝐻 + 0.0338𝐻𝐻 + 0.0234𝑁𝑁 (25)
Where F is the Forest Fire Danger Index, D is the drought factor, H is the relative humidity (%), T is the air temperature (°C) and V is the average wind velocity at 10 meters height (km/h) (Noble et al., 1980). The drought factor is calculated with the help of dryness of the ground (Keetch-Byram Drought Index, see section 4.7) according to the following equation (Noble et al., 1980).
𝑁𝑁 = 0.191(𝐵𝐵 + 104)(𝑁𝑁 + 1)1.5/(3.52(𝑁𝑁 + 1)1.5 + 𝐹𝐹 − 1) (26)
Where N is the time since rain (days), P is the amount of rain that fell (mm) and I is the Keech-Byram Drought Index (in mm equivalents). Griffiths (1999) has later argued that the calculation method for the Drought Factor presented by Noble et al. (1980) does not reproduce McArthur's meter well. Instead Griffiths proposes an alternative method to calculate the Drought Factor by taking the most significant recent rain events in to account (see Griffiths, 1999).
It is important to note that the equations are a different way of expressing McArthur's data, and they do not affect the accuracy of the predictions.
The method is the basis for the scheme for fire danger classification used in Australia. Fire danger conditions are classified as low, medium, high, very high or extreme and these classes correspond to a numeric fire danger value (see Table 8). An index of 1 translates into a fire that will not burn, or burn so slowly that control presents little difficulty. An index of 100 translates into a fire that will burn so fast and intensively that control is practically impossible.
Table 8. Fire danger classification used in eastern Australia with corresponding FFDI-values.
Fire danger classification FFDI value
Low 0-5
Moderate 5-12
High 12-24
Very High 24-50
Extreme 50-100
25
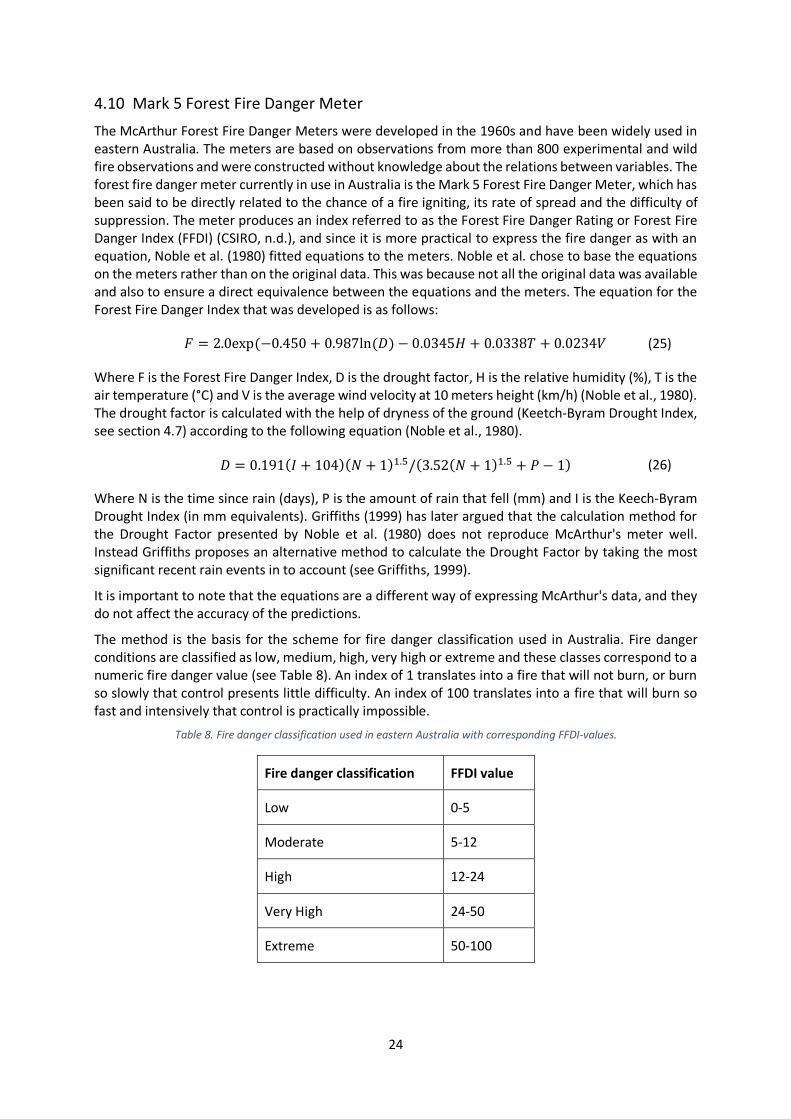
There are also equations for other relevant parameters in the McArthur forest fire danger meters. The rate of forward spread of fire on level to undulating (hilly) ground is express as:
𝐸𝐸 = 0.0011 ∙ 𝐹𝐹 ∙ 𝑊𝑊 (27)
Where F is the fire danger index and W is the fuel weight (tonnes/ha). The rate of forward spread on ground with the slope 𝜃𝜃 is:
𝐸𝐸𝜃𝜃 = 𝐸𝐸 ∙ 𝑒𝑒𝑒𝑒𝑒𝑒(0.069 ∙ 𝜃𝜃) (28)
The flame height, Z (m), and distance of spotting from flame front, S (km), are calculated according to:
𝑍𝑍 = 13.0 ∙ 𝐸𝐸 + 0.24 ∙ 𝑊𝑊 − 2.0 (29)
𝑆𝑆 = 𝐸𝐸 ∙ (4.17− 0.033 ∙ 𝑊𝑊)− 0.36 (30)
Summary of input variables
− Wind speed at 10 meters, V (km/h) − Temperature, T (°C) − Humidity, H (%) − Keech-Byram Drought Index − Time since last rainfall (in days), and the amount of rain that fell (mm)
Testing or validation of the method
In a study by Sirca et al. (2018), the McArthur Mark 5 (Mk5) Forest Danger Index performed well and was ranked as 5 out of 9 studied indices.
Advantages and disadvantage of the method
Advantages:
+ It is an established method. + The method provides several additional output parameters such as forward spread rate and
flame length.
Disadvantages:
− It is developed based on empirical data from Australia, not known to be evaluated for northern European conditions.
− No account of topography or geographical variables. − Potential ignition factors are not taken into account.
26
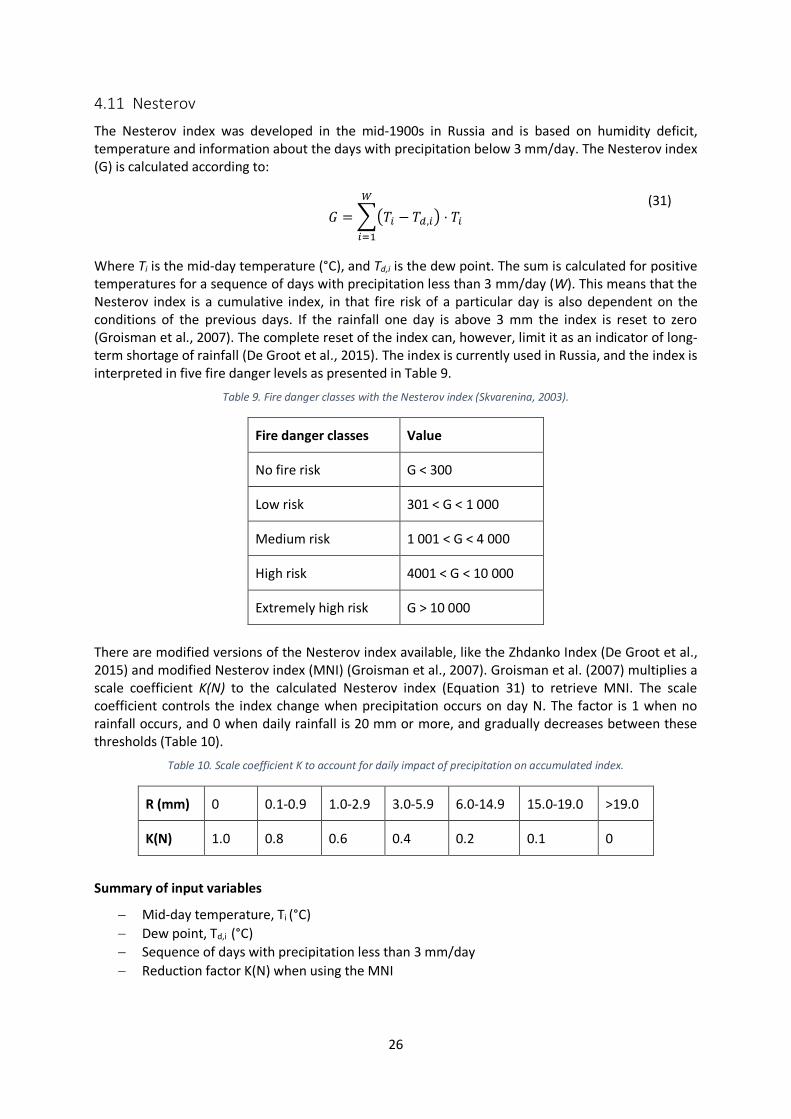
4.11 Nesterov
The Nesterov index was developed in the mid-1900s in Russia and is based on humidity deficit, temperature and information about the days with precipitation below 3 mm/day. The Nesterov index (G) is calculated according to:
𝑅𝑅 = ��𝐻𝐻𝑚𝑚 − 𝐻𝐻𝑑𝑑,𝑚𝑚� ⋅ 𝐻𝐻𝑚𝑚
𝑊𝑊
𝑚𝑚=1
(31)
Where Ti is the mid-day temperature (°C), and Td,i is the dew point. The sum is calculated for positive temperatures for a sequence of days with precipitation less than 3 mm/day (W). This means that the Nesterov index is a cumulative index, in that fire risk of a particular day is also dependent on the conditions of the previous days. If the rainfall one day is above 3 mm the index is reset to zero (Groisman et al., 2007). The complete reset of the index can, however, limit it as an indicator of long-term shortage of rainfall (De Groot et al., 2015). The index is currently used in Russia, and the index is interpreted in five fire danger levels as presented in Table 9.
Table 9. Fire danger classes with the Nesterov index (Skvarenina, 2003).
Fire danger classes Value
No fire risk G < 300
Low risk 301 < G < 1 000
Medium risk 1 001 < G < 4 000
High risk 4001 < G < 10 000
Extremely high risk G > 10 000
There are modified versions of the Nesterov index available, like the Zhdanko Index (De Groot et al., 2015) and modified Nesterov index (MNI) (Groisman et al., 2007). Groisman et al. (2007) multiplies a scale coefficient K(N) to the calculated Nesterov index (Equation 31) to retrieve MNI. The scale coefficient controls the index change when precipitation occurs on day N. The factor is 1 when no rainfall occurs, and 0 when daily rainfall is 20 mm or more, and gradually decreases between these thresholds (Table 10).
Table 10. Scale coefficient K to account for daily impact of precipitation on accumulated index.
R (mm) 0 0.1-0.9 1.0-2.9 3.0-5.9 6.0-14.9 15.0-19.0 >19.0
K(N) 1.0 0.8 0.6 0.4 0.2 0.1 0
Summary of input variables
− Mid-day temperature, Ti (°C) − Dew point, Td,i (°C) − Sequence of days with precipitation less than 3 mm/day − Reduction factor K(N) when using the MNI
27
Testing or validiaton of the method
In a study by Groisman et al. (2007) it was seen that, after normalization, the Nesterov index correlated well with other indices as well as regional statistics of forest fires in Northern Eurasia.
In another study (Sirca et al., 2018) of the performance of the indices in a Mediterranean area (Sardinia) the Nesterov index was ranked as 5 out of 9 studied indices.
In a study by Torres et al. (2017) the objective was to analyze the efficiency of several different indices in the prediction of forest fires in Viçosa, Brazil. Days when the index value was in the medium risk category were compared to days when fire was identified by satellite data (a total of 79 days during a ten-year period). The nine tested indices had a success rate from 64.5% to 76.6% with that of the Nesterov index being 70.2%.
The Nesterov index has also been evaluted for German conditions (Holsten et al., 2013), and it was seen that the correlation between fire danger classes and actual fires was weaker for the Nesterov index than the other investigated indices.
Advantages and disadvantages of the method:
Advantages:
+ An established method that is easily calculated. + Has been applied in northern Europe and Russia.
Disadvantages:
− The index does not seem to perform that well in some comparative studies. − Unlike many other indices, wind speed is not included. − No account of topography or geographical variables. − No account of human activity, e.g. the vicinity to urban areas.
28
5 Summary of findings and conclusion A thorough literature review of different wildfire risk index methods has been conducted and the results of this study are presented in this report. A total of 8 searches using keywords deemed to be relevant for the subject, resulted in a total of 509 unique publications that were systematically reviewed (see Chapter 3). The review resulted in a list of risk index methods of which eleven wildfire index methods were described in more detail (see Chapter 4).
All of these index methods were considered relevant for the project; however, it is not reasonable to continue with an in-depth study of all of these methods. Therefore, the following four methods (not in any specific order) are recommended for further use in the project:
The Fire Weather Index is a widely used and established index which is the wildfire risk index used in Sweden today. Its sub-components are cumulative but they require simple meteorological input data and are relatively easy to compute. Since it is such an established index it has been tested several times and is generally considered a good predictor of fire occurrence.
The Keetch-Byram Drought Index is also an established method and it is even used as a sub-component in other indices, for instance the Fosberg Fire Weather Index. It is cumulative like the FWI sub-components and also requires simple data for its calculation.
The Fosberg Fire Weather Index is an established index that has been seen to work well in north eastern parts of the U.S. The index is, in comparison with some of the other studied indices, comprehensive and requires rather straightforward input data.
The Nesterov index is an established index that is used and developed for northern Eurasia, which makes it interesting to apply for Swedish conditions, as an alternative to the FWI. The Nesterov index accounts for the conditions during previous days (making it a cumulative index) and the inputs to the index are straightforward.
It is interesting to notice that the HVB model that was developed by SMHI (MSB, n.d.) and is used in Sweden today for assessing the risk for ignition did not come up in the literature review. It was not mentioned in any of the sources. Possible reasons for this could be that the literature is not in English or has not been made available online. However, since this is (together with the FWI) one of the models currently used in Sweden it should also, at least, be considered for further use in the project and has been described in Chapter 2.
Models selected for further use in the project should be calibrated and evaluated for Swedish conditions. This can be done by studying how well the index predicts trends in fire occurrences or how predictions correspond with the current index in use (FWI).
29
References Alexander, M. E. (1990). Computer Calculation of the Keetch-Byram Drought Index – Programmers
Beware! Fire Management Notes, 51(4), 23-25.
Andréasson, J. & Gardelin, M. (2003). Utveckling av en modell för gräsbrandsvarning under våren. Retrieved 2020-10-01 from: https://rib.msb.se/dok.aspx?Tab=2&dokid=19025
Arksey, H. & O’Malley, L. (2005). Scoping studies: towards a methodological framework. International Journal of Social Research Methodology, 8, 9-32. doi:10.1080/1364557032000119616
Barberà, M. J., Niclòs, R., Estrela, M. J. & Valiente, J. A. (2015). Climatology of the stability and humidity terms in the Haines Index to improve the estimate of forest fire risk in the Western Mediterranean Basin (Valencia region, Spain). International Journal of Climatology, 35, 1212–1223. doi:10.1002/joc.4048
Beck, J. A. (1995). Equations for the Forest Fires Behaviour Tables for Western Australia. CALM Science, 1(3), 325-348.
Bradshaw, L. S., Deeming, J. E., Burgan, R. E. & Cohen, J. D. (1983). The 1978 National Fire Danger Rating System: Technical Documentation (General Technical Report INT-169). Ogden, UT: U.S. Department of Agriculture, Forest Service
Burgan, R. E., Klaver, R. W. & Klaver, J. M. (1998). Fuel Models and Fire Potential from Satellite and Surface Observations. International Journal of Wildland Fire, 8(3), 159-170.
Burrows, N. D. & Sneeuwjagt, R. J. (1991). McArthur’s Forest Fire Danger Meter and the Forest Fire Behaviour Tables for Western Australia: Derivation, applications and limitations. In Cheney, N. P. & Gill, A. M. (Eds.) Proceedings of conference on bushfire modeling and fire danger rating systems, Canberra, Australia, 1988 July 11–12. (p.65-77). Canberra: CSIRO Division of Forestry
Carrao, H., Freire, S. & Caetano, M. R. (2003). Fire risk mapping using satellite imagery and ancillary data: toward operationality. In the Proceedings of SPIE 4879, Remote Sensing for Agriculture, Ecosystems, and Hydrology IV. doi:10.1117/12.462431
CSIRO (n.d.) McArthur Mk5 Forest Fire Danger Meter. Retrieved 2020-10-01 from: https://www.csiro.au/en/Research/Environment/Extreme-Events/Bushfire/frontline-support/Fire-danger-meters/Mk5-forest-fire-danger-meter
Cohen, J. D. & Deeming, J. E. (1985). The National Fire Danger Rating System: basic equations (General Technical Report PSW-GTR-82). Berkeley, CA: U.S. Department of Agriculture, Forest Service
De Groot, W. J. (1987). Interpreting the Canadian Forest Fire Weather Index (FWI) System. In the Proceedings of the Fourth Central Regional Fire Weather Committee Scientific and Technical Seminar, Winnipeg, Manitoba (p.3-14). Edmonton, Alberta: Canadian Forestry Service, Northern Forestry Centre
De Groot, W. J., Wotton, B. M. & Flannigan, M. D. (2015). Wildland Fire Danger Rating and Early Warning Systems. In Paton, D. (Ed.) Wildfire Hazards, Risks, and Disasters (p. 207-228). Amsterdam: Elsevier
De Jong, M. C., Wooster, M. J., Kitchen, K., Manley, C., Gazzard, R. & McCall, F. F. (2016). Calibration and evaluation of the Canadian Forest Fire Weather Index (FWI) System for improved wildland fire danger rating in the United Kingdom. Natural Hazards and Earth System Sciences, 16, 1217–1237. doi:10.5194/nhess-16-1217-2016
30
Department of Atmospheric Science (n.d.). Fosberg fire weather index, University of Washington. Retrieved 2020-10-01 from: https://a.atmos.washington.edu/wrfrt/descript/definitions/fosbergindex.html
Gardelin, M. (2001). Brandriskprognoser med hjälp av en skiktad markfuktighetsmodell: vidareutveckling av HBV-modellen. Räddningsverket. Retrieved 2020-09-28 from: https://rib.msb.se/dok.aspx?Tab=2&dokid=17723
Goodrick, S. L. (2002). Modification of the Fosberg fire weather index to include drought. International Journal of Wildland Fire 11, 205–211.
Griffiths, D. (1999). Improved Formula for the Drought Factor in McArthur's Forest Fire Danger Meter, Australian Forestry, 62:2, 202-206, doi:10.1080/00049158.1999.10674783
Groisman, P. Y., Sherstyukov, B. G., Razuvaev, V. N., Knight, R. W., Enloe, J. G., Stroumentova, N. S. et al. (2007). Potential forest fire danger over Northern Eurasia: Changes during the 20th century. Global and Planetary Change, 56, 371-386. doi:10.1016/j.gloplacha.2006.07.029
Haines, D. A. (1988). A Lower Atmosphere Severity Index for Wildlife Fires. National Weather Digest, 13(3), 23-27.
Haines, D., Main, W., Frost, J. & Simard, A. (1983). Fire-Danger Rating and Wildfire Occurrence in the Northeastern United States, Forest Sci., 4, 679-696.
Holsten, A., Dominic, A. R., Costa, L., Kropp, J. P. (2013). Evaluation of the performance of meteorological forest fire indices for German federal states, For. Ecol. Manage., 28, 123-131, doi: 10.1016/j.foreco.2012.08.035
Huesca, M., Litago, J., Palacios-Orueta, A., Montes, F., Sebastián-López, A. & Escribano, P. (2009). Assessment of forest fire seasonality using MODIS fire potential: A time series approach. Agricultural and Forest Meteorology, 149, 1946–1955, doi:10.1016/j.agrformet.2009.06.022
Keetch, J. J. & Byram, G. M. (1968). A Drought Index for Forest Fire Control (Research Paper SE-38). Asheville, NC: U.S. Department of Agriculture, Forest Service
Lunds Universitet. (2020). LUBsearch & Electronic Resources: What is LUBsearch? Retrieved 2020-10-01 from: https://libguides.lub.lu.se/lubsearchandelectronicresources
Matthews, S. (2009.) A comparison of fire danger rating systems for use in forests. Australian Meteorological and Oceanographic Journal, 58, 41-48, doi:10.22499/2.5801.005
MSB. (2020). Brandriskprognoser och brandriskkartor. Retrieved 2020-07-03 from: https://www.msb.se/sv/amnesomraden/skydd-mot-olyckor-och-farliga-amnen/naturolyckor-och-klimat/skogsbrand-och-vegetationsbrand/brandriskprognoser/
MSB. (n.d.(a)). Brandrisk skog och mark – fakta och modeller. Retrieved 2020-04-29 from: https://www.msb.se/ExternData/SMHI/brand_fakta.pdf
MSB. (n.d.(b)). BRANDRISK Ute. Retrieved 2020-09-28 from: https://www.msb.se/sv/om-msb/informationskanaler/appar/brandrisk-ute/
Peng, R. D, Schoenberg, F. P, & Woods, J. (2003). Multi-dimensional Point Process Models for Evaluating a Wildfire Hazard Index. UCLA: Department of Statistics, UCLA. Retrieved 2020-10-01 from: https://escholarship.org/uc/item/4r37990g
31
Rolinski, T., Capps, S. B., Fovell, R. G., Cao, Y., D’Agostino, B. J. & Vanderburg, S. (2016). The Santa Ana Wildfire Threat Index: Methodology and Operational Implementation. Weather and Forecasting, 31(1), 1881-1897. doi:10.1175/WAF-D-15-0141.1
San-Miguel-Ayanz, J., Schulte, E., Schmuck, G., Camia, A., Strobl, P., Liberta, G., … Amatulli, G. (2012). Comprehensive Monitoring of Wildfires in Europe: The European Forest Fire Information System (EFFIS). In Tiefenbacher, J. (Ed.) Approaches to Managing Disaster - Assessing Hazards, Emergencies and Disaster Impacts. doi:10.5772/28441
Sebastián López, A., San-Miguel-Ayanz, J. & Burgan, R. E. (2002). Integration of satellite sensor data, fuel type maps and meteorological observations for evaluation of forest fire risk at the pan-European scale. International Journal of Remote Sensing, 23(13), 2713-2719. doi:10.1080/01431160110107761
Sharples, J. J., McRae, R. H. D., Weber, R. O. & Gill, A. M. (2009a). A simple index for assessing fuel moisture content. Environmental Modelling and Software, 24, 637-646.
Sharples, J. J., McRae, R. H. D., Weber, R. O. & Gill, A. M. (2009b). A simple index for assessing fire danger rating. Environmental Modelling and Software, 24, 764–774.
Sirca, C., Salis, M., Arca, B., Duce, P. & Spano, D. (2018). Assessing the performance of fire danger indexes in a Mediterranean area. iForest - Biogeosciences and Forestry, 11(5), 563-571. doi:10.3832/ifor2679-011
Sirca C., Spano D., Duce P., Delogu G., Cicalo, G. O. (2007). Performance of a newly developed integrated fire rating index in Sardinia, Ital, In Proceedings of “Wildfire 2007 - 4th International Wildland Fire Conference” (Viegas, X. D. ed), 13-17 May 2007, Seville, Spain
Sjöström, J. & Granström, A. (2020). Skogsbränder och gräsbränder i Sverige - Trender och mönster under senare decennier (MSB report 1536). Retrieved 2020-10-01 from: https://www.ri.se/sites/default/files/2020-04/Rapport%20brandf%C3%B6rdelning.pdf
Skvarenina, J., Mindas, J. Holecy, J. & Tucek, J. (2003) Analysis of the natural and meteorological conditions during two largest forest fire events in the Slovak Paradise National Park. Retrieved 2020-10-01 from: http://www.fria.gr/WARM/chapters/warmCh04Skvarenina.pdf
SMHI (2015) HBV. Retrieved 2020-07-03 from: https://www.smhi.se/en/research/research-departments/hydrology/hbv-1.90007
SMHI (n. d.) Brandriskprognos 5 dygn. Retrieved 2020-09-28 from: https://www.smhi.se/vader/varningar-och-risker/brandrisk
Sneeuwjagt, R. J. & Peet, G. B. (1979). Forest Fire Behaviour Tables for Western Australia (2nd ed.). Forest Department Western Australia
Säfsten, K. & Gustavsson, M. (2020). Research Methodology. Studentlitteratur.
Tatli, H. & Türkes, M. (2014). Climatological evaluation of Haines forest fire weather index over the Mediterranean Basin. Meteorological Applications, 21, 545–552. doi:10.1002/met.1367
Torres, F. T. P., Lima, G. S. & Alvares, B. F. (2018). Fire Behavior Variables and Hazard Indices of Forest Fires. Revista Árvore, 42(3), e420306. doi:10.1590/1806-90882018000300006
Torres, F. T. P., Lima, G. S., Martins, S. V. & Valverde, S. R. (2017). Analysis of efficiency of fire danger indices in forest fire prediction, Revista Árvore, 41(2), e410209, doi:10.1590/1806-90882017000200009
32
Van Wagner, C. E. (1987). Development and Structure of the Canadian Forest Fire Weather Index System (Forestry Technical Report. 35). Chalk River, ON: Canadian Forest Service, Petawawa National Forestry Institute
Van Wagner, C. E., & Pickett, T. L. (1985). Equations and FORTRAN program for the Canadian Forest Fire Weather Index System (Forestry Technical Report 33). Chalk River, ON: Canadian Forest Service, Petawawa National Forestry Institute
Watts, J. M. (2016). Fire Risk Indexing. In SFPE Handbook of Fire Protection Engineering, 5th ed. Quincy, Mass.: Bethesda, Md.: National Fire Protection Association; Society of Fire Protection Engineers
Welle, T. & Birkmann, J. (2015). The World Risk Index – An approach to assess risk and vulnerability on a global scale. Journal of Extreme Events, 2(1). doi:10.1142/S2345737615500037