Stem form responses to differing areas of weed control around planted Douglas-fir trees Robin Rose,...
27
Stem form responses to differing areas of weed control around planted Douglas-fir trees Robin Rose, Douglas A. Maguire, and Scott Ketchum Department of Forest Science Oregon State University
-
Upload
toby-barker -
Category
Documents
-
view
213 -
download
0
Transcript of Stem form responses to differing areas of weed control around planted Douglas-fir trees Robin Rose,...

Stem form responses to differing areas of weed control around
planted Douglas-fir trees
Robin Rose, Douglas A. Maguire, and Scott Ketchum
Department of Forest Science
Oregon State University

Introduction
Discerning differences in stem form and volume among silvicultural treatments.
Introduction
DBH and height respond to control of competing vegetation.
Consequently stem volume also responds to vegetation control.

Introduction
As trees develop under intensive management:Form differs from a cone
(/12)D2H,Trees large enough for existing
volume or taper equations.

Introduction
Application of volume and taper equations:Regional development;May not include intensively managed
stands;Averages lose subtle differences;

Introduction
Volume and taper equations:Most are functions of only DBH and
HT.Consequences:
Insufficient for detecting treatment differences.

One solution
Measure upper stem diameters.Assess existing volume or taper
equations.Develop new site-specific
equations.

Past work
Upper stem measurements were made at sites near Marcola and Summit:Fit Kozak’s variable-exponent taper
equation:Tested parameters across treatments;No treatment effect was found.

Past work
Compared empirical volumes to Bruce and DeMars (1974) volume estimates.Bias increased with progressively
more weed control.

Past work
Compared volumes to a coneControl:
Cone underpredict volume,Trees more parabolic.
Weed control:Cone overpredicts volume,Tree more neiloid.

Objective
Compare upper stem measurements to those predicted by Jim Flewelling’s taper system.

Methods
SitesSummit, OR:
Central region of the Oregon Coast Range.
Marcola, OR:Western Cascade Mountain
foothills.

Summit
Marcola
Methods
Experimental design Completely randomized design, 8 treatments, 3 replicates, Plot area = 0.112 ac, 49 seedlings planted at 9.8 ft square
spacing.
Methods
Treatments No herbicide, 4 ft2 full control, 16 ft2 full control, 36 ft2 full control, 64 ft2 full control, 100 ft2 full control, 100 ft2 woody vegetation control, 100 ft2 herbaceous vegetation control.
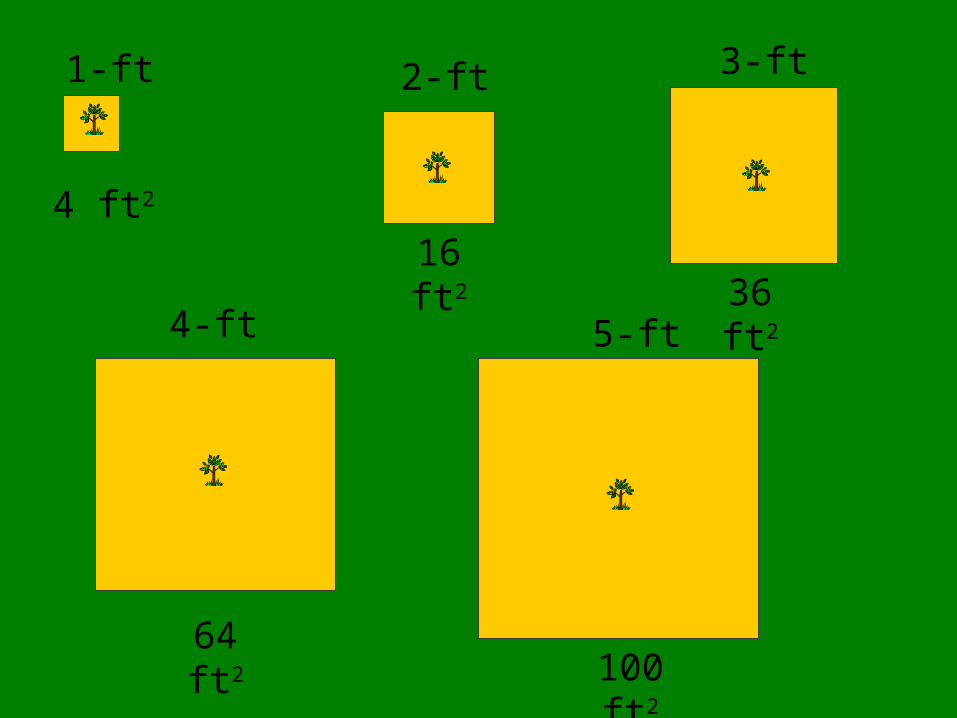
1-ft 2-ft 3-ft
4-ft 5-ft
4 ft2
64 ft2
16 ft2
36 ft2
100 ft2

Methods
Diameter outside bark was collected at tree base, breast height, 8 ft, and every 4 ft above 8 ft.
Observed DOB’s were compared to those predicted by Flewelling system. Consistent bias – inferences unaffected Changing bias – inferences questionable

Results
Average differences:Summit:
DOB overpredictedAcross most of stem profile
Marcola:Low at upper and lower stem positions.High at middle stem positions.

Difference = observed - predicted
0
5
10
15
20
25
30
-0.5 -0.4 -0.3 -0.2 -0.1 0 0.1 0.2 0.3
Difference (in)
Hei
gh
t (f
t)
Marcola
Summit
positive difference--model underpredicts diameternegative difference--model overpredicts diameter
Results
Averages by treatment:General overprediction over stem
profileLargest overpredictions:
Upper stem positionsGreater for more intensive control

Difference = observed - predictedSummit and Marcola averaged
0
5
10
15
20
25
30
-0.5 -0.4 -0.3 -0.2 -0.1 0 0.1 0.2
Difference (in)
Hei
gh
t (f
t)
4
1636
64
1000
herbwoody
positive difference--model underpredicts diameter
negative difference--model overpredicts diameter
100
0
4

DiscussionIf Flewelling predictions are
regional averages:More intensive weed control
Narrower upper stem profiles.Less intensive weed control
Slightly narrower lower stem profiles.

Results
Treatment differences by site:Marcola:
Underpredicts near base (greater weed control);
Underpredicts near top;Overpredict near middle of tree.

Difference = observed - predictedMarcola site only
0
5
10
15
20
25
30
-0.4 -0.3 -0.2 -0.1 0 0.1 0.2 0.3 0.4 0.5 0.6
Difference (in)
Hei
gh
t (f
t)
4
1636
64
1000
herbwoody
positive difference--model underpredicts diameternegative difference--model overpredicts diameter
1000
4
Results
Treatment differences by site:Summit:
Overpredicts over entire stem profile;
Overpredictions increase with greater weed control.
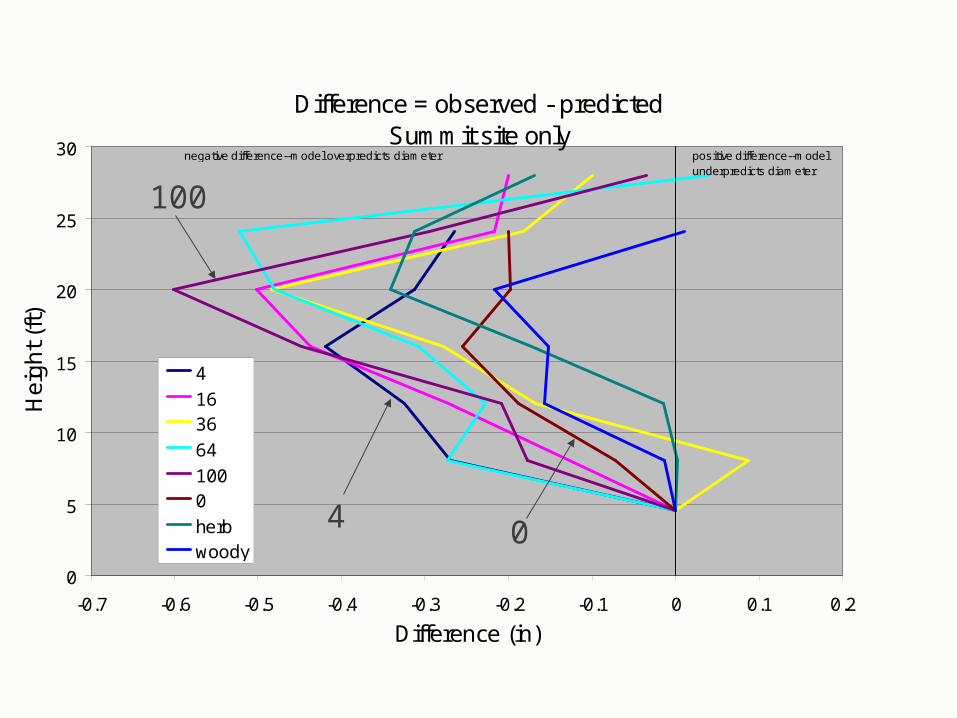
Difference = observed - predictedSummit site only
0
5
10
15
20
25
30
-0.7 -0.6 -0.5 -0.4 -0.3 -0.2 -0.1 0 0.1 0.2
Difference (in)
Hei
gh
t (f
t)
4
1636
64
1000
herbwoody
positive difference--model underpredicts diameter
negative difference--model overpredicts diameter
100
4 0

Conclusions
Biases in predicted DOB’s are small.
Systematic bias among treatments.Bias the estimated effects of
treatments on stem profiles.Formal statistical analyses on
implications are continuing.