Stem and Leaf Diagrams © Christine Crisp “Teach A Level Maths” Statistics 1.
30
Stem and Leaf Stem and Leaf Diagrams Diagrams © Christine Crisp “ “ Teach A Level Teach A Level Maths” Maths” Statistics 1 Statistics 1
-
Upload
stanley-campbell -
Category
Documents
-
view
234 -
download
2
Transcript of Stem and Leaf Diagrams © Christine Crisp “Teach A Level Maths” Statistics 1.

Stem and Leaf Stem and Leaf DiagramsDiagrams
© Christine Crisp
““Teach A Level Teach A Level Maths”Maths”
Statistics 1Statistics 1
Stem and Leaf Diagrams
"Certain images and/or photos on this presentation are the copyrighted property of JupiterImages and are being used with permission under license. These images and/or photos may not be copied or downloaded without permission from JupiterImages"
Statistics 1
AQA
EDEXCELMEI/OCR
OCR
Stem and Leaf Diagrams
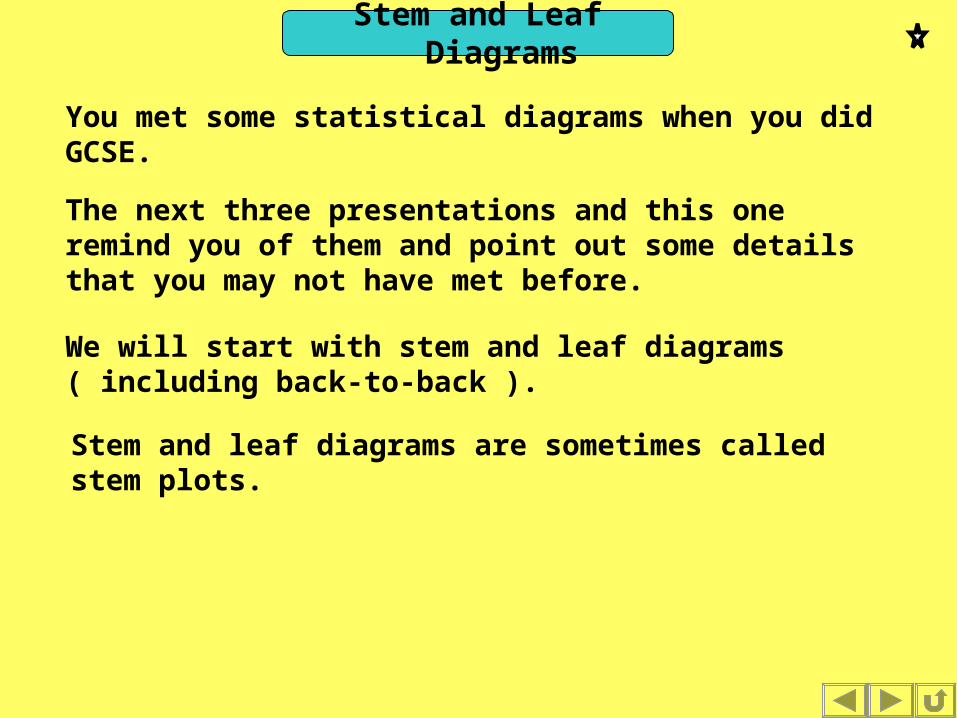
You met some statistical diagrams when you did GCSE.
The next three presentations and this one remind you of them and point out some details that you may not have met before.
We will start with stem and leaf diagrams ( including back-to-back ).
Stem and leaf diagrams are sometimes called stem plots.
Stem and Leaf Diagrams
Weekly hours of 30 men
5
4
4
3
3
2
2
5 1
4 5 6
4 1 1 2
3 5 5 5 5 5 5 6 6
3 0 0 1 1 2 2 2 2 3 3 3 4 4 4
2 8
2 1
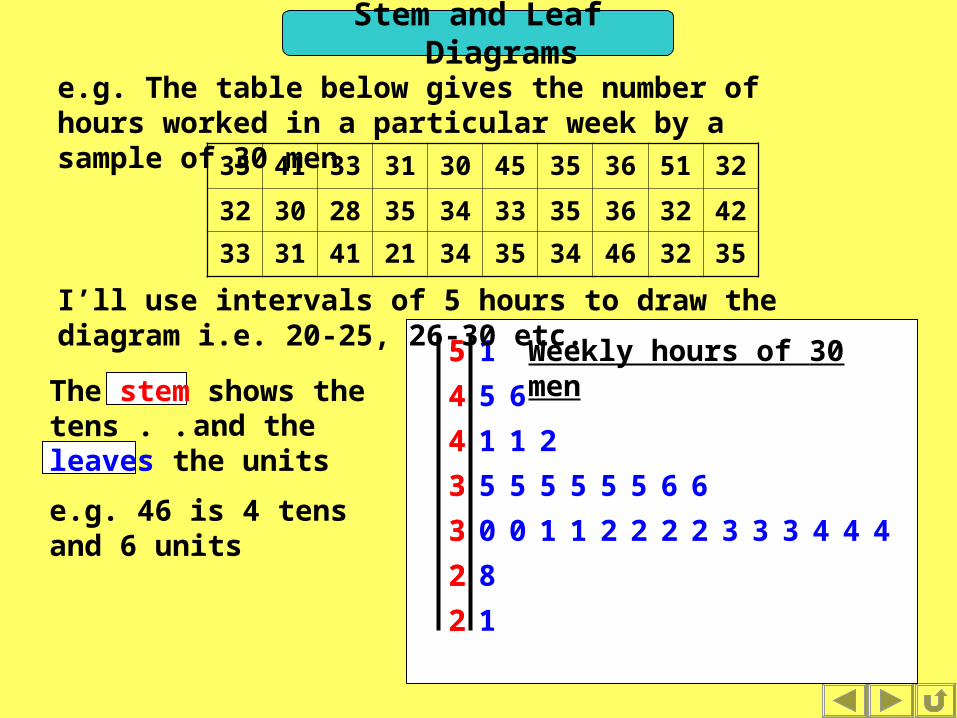
e.g. The table below gives the number of hours worked in a particular week by a sample of 30 men 35 41 33 31 30 45 35 36 51 32
32 30 28 35 34 33 35 36 32 42
33 31 41 21 34 35 34 46 32 35
The stem shows the tens . . .
I’ll use intervals of 5 hours to draw the diagram i.e. 20-25, 26-30 etc.
and the leaves the units
e.g. 46 is 4 tens and 6 units

Stem and Leaf Diagrams
Weekly hours of 30 men
e.g. The table below gives the number of hours worked in a particular week by a sample of 30 men
5 1
4 5 6
4 1 1 2
3 5 5 5 5 5 5 6 6
3 0 0 1 1 2 2 2 2 3 3 3 4 4 4
2 8
2 1
I’ll use intervals of 5 hours to draw the diagram i.e. 20-25, 26-30 etc.
35 41 33 31 30 45 35 36 51 32
32 30 28 35 34 33 35 36 32 42
33 31 41 21 34 35 34 46 32 35
e.g. 46 is 4 tens and 6 units
Weekly hours of 30 menThe stem shows the
tens . . . and the leaves the units
Stem and Leaf Diagrams
Weekly hours of 30 men
e.g. The table below gives the number of hours worked in a particular week by a sample of 30 men
5 1
4 5 6
4 1 1 2
3 5 5 5 5 5 5 6 6
3 0 0 1 1 2 2 2 2 3 3 3 4 4 4
2 8
2 1
I’ll use intervals of 5 hours to draw the diagram i.e. 20-25, 26-30 etc.
35 41 33 31 30 45 35 36 51 32
32 30 28 35 34 33 35 36 32 42
33 31 41 21 34 35 34 46 32 35
e.g. 46 is 4 tens and 6 units
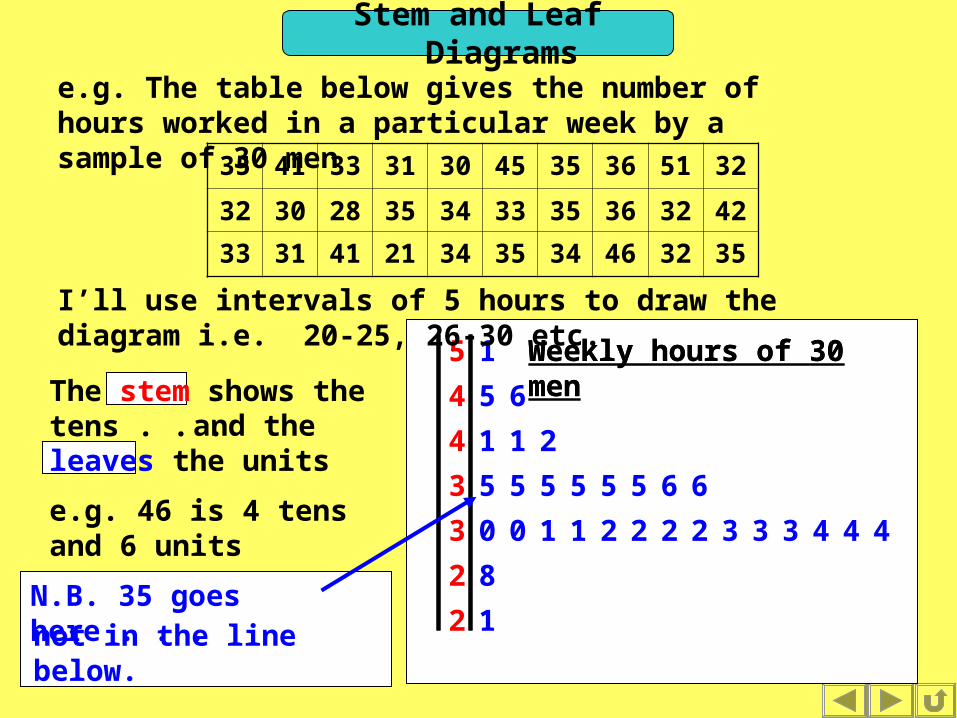
Weekly hours of 30 men
N.B. 35 goes here . . . not in the line below.
The stem shows the tens . . . and the leaves the units

Stem and Leaf Diagrams
e.g. The table below gives the number of hours worked in a particular week by a sample of 30 men
5 1
4 5 6
4 1 1 2
3 5 5 5 5 5 5 6 6
3 0 0 1 1 2 2 2 2 3 3 3 4 4 4
2 8
2 1
I’ll use intervals of 5 hours to draw the diagram i.e. 20-25, 26-30 etc.
35 41 33 31 30 45 35 36 51 32
32 30 28 35 34 33 35 36 32 42
33 31 41 21 34 35 34 46 32 35
e.g. 46 is 4 tens and 6 unitsWe must show a key.
Key: 3 5 means 35 hours
Weekly hours of 30 menThe stem shows the
tens . . . and the leaves the units

Stem and Leaf Diagrams
5 1
4 5 6
4 1 1 2
3 5 5 5 5 5 5 6 6
3 0 0 1 1 2 2 2 2 3 3 3 4 4 4
2 8
2 1
Weekly hours of 30 men
If you tip your head to the right and look at the diagram you can see it is just a bar chart with more detail.Points to
notice:• The leaves are in numerical order• The diagram uses raw ( not grouped )
data
Key: 3 5 means 35 hours
Stem and Leaf Diagrams
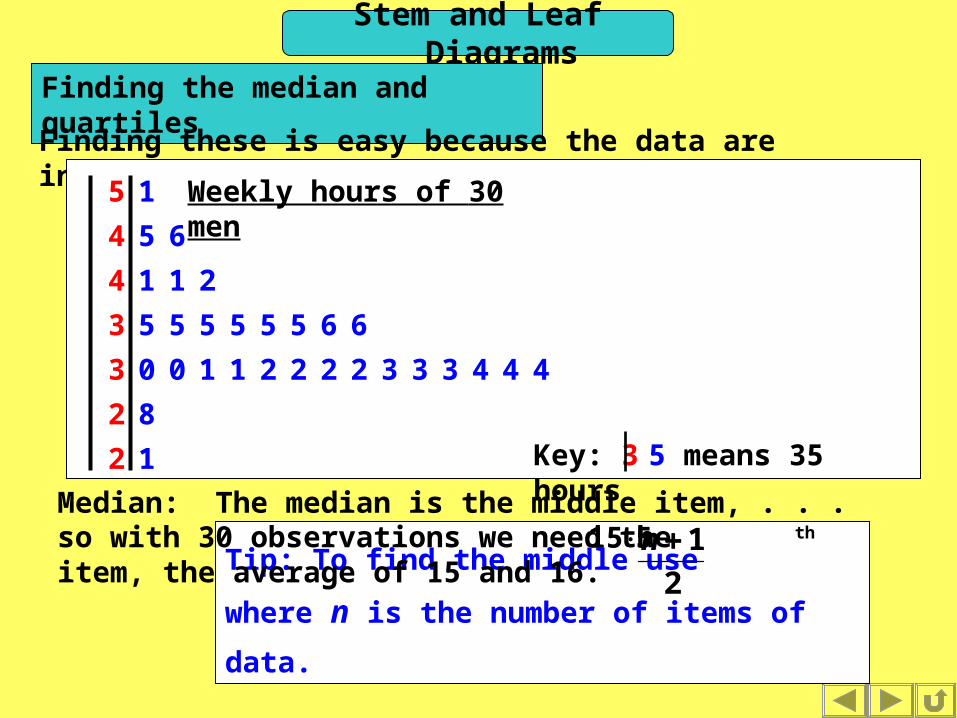
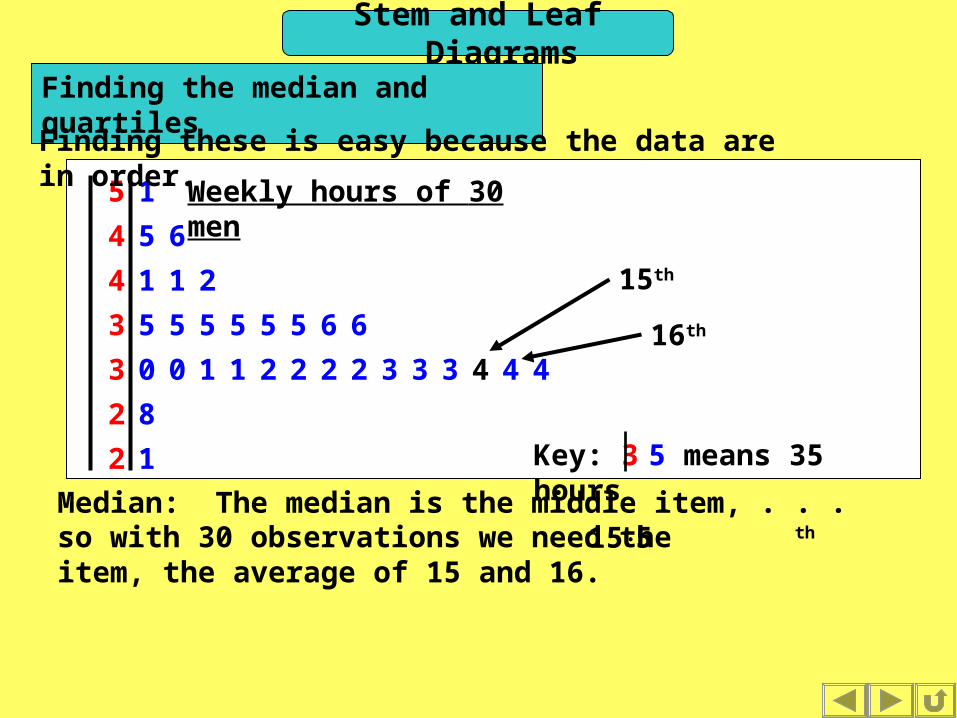
Finding the median and quartilesFinding these is easy because the data are in order.
Median: The median is the middle item, . . .
Tip: To find the middle use where
n is the number of items of data.2
1nso with 30 observations we need the th item, the average of 15 and 16.
515
12
82
444333222211003
665555553
2114
654
15 Weekly hours of 30 men
Key: 3 5 means 35 hours
Stem and Leaf Diagrams
12
82
444333222211003
665555553
2114
654
15 Weekly hours of 30 men
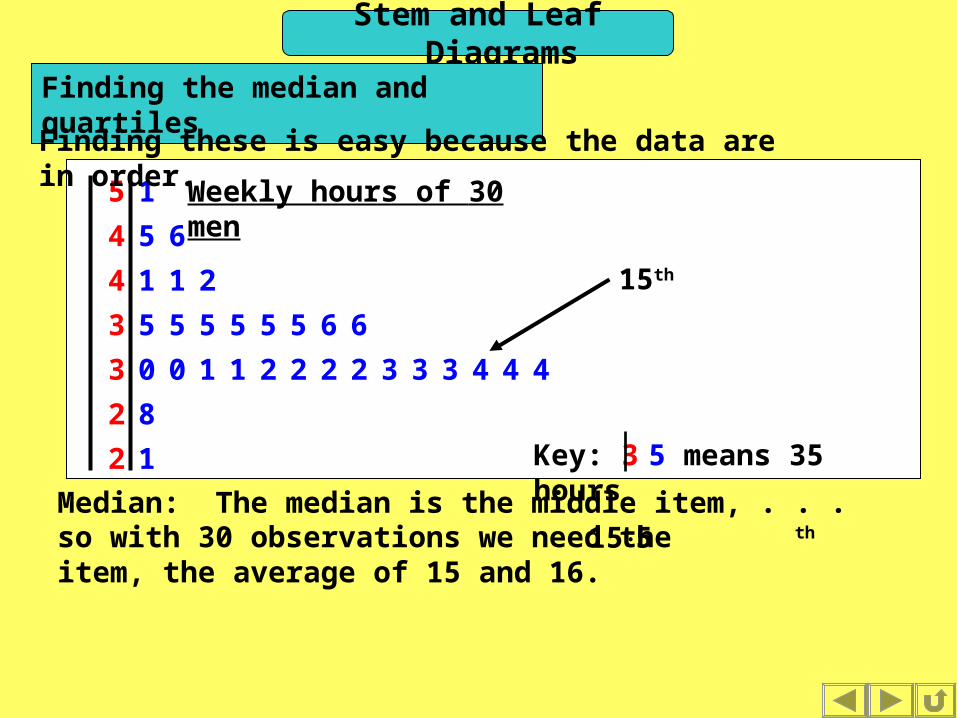
Finding the median and quartilesFinding these is easy because the data are in order.
15th
Median: The median is the middle item, . . . so with 30 observations we need the th item, the average of 15 and 16.
515
Key: 3 5 means 35 hours
Stem and Leaf Diagrams
12
82
444333222211003
665555553
2114
654
15 Weekly hours of 30 men
Finding the median and quartilesFinding these is easy because the data are in order.
15th
16th
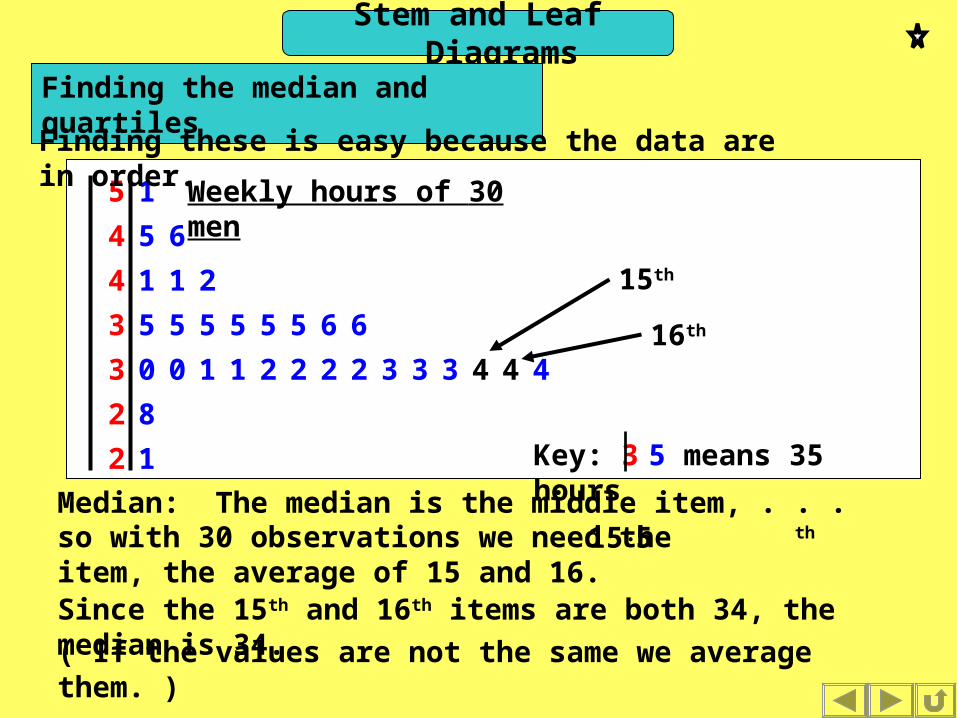
Since the 15th and 16th items are both 34, the median is 34.
Median: The median is the middle item, . . . so with 30 observations we need the th item, the average of 15 and 16.
515
( If the values are not the same we average them. )
Key: 3 5 means 35 hours
Stem and Leaf Diagrams
12
82
444333222211003
665555553
2114
654
15 Weekly hours of 30 men
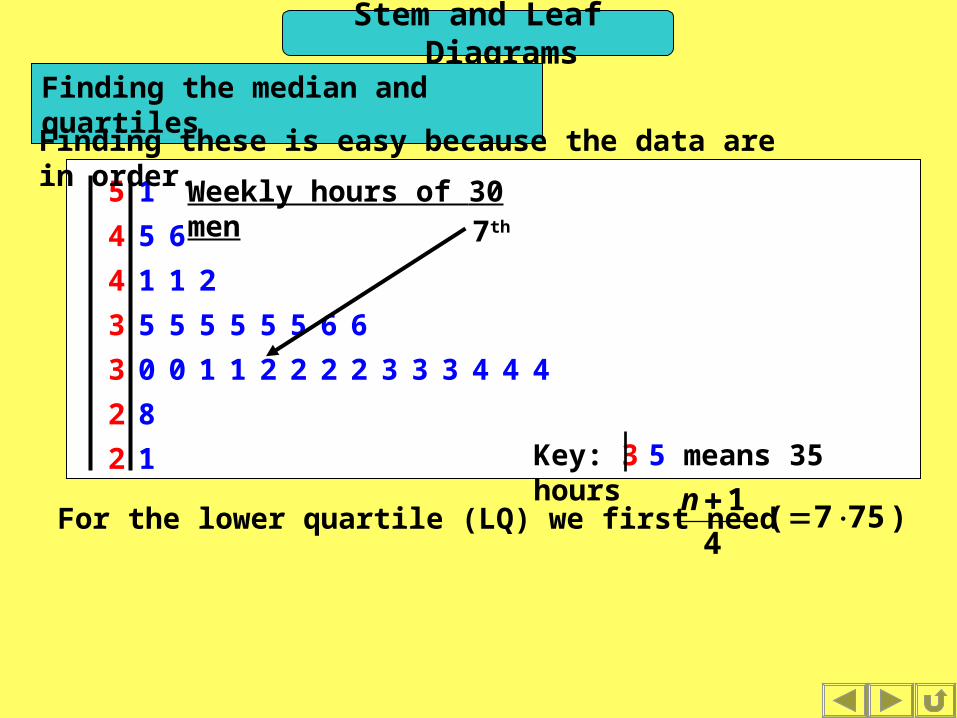
Finding the median and quartilesFinding these is easy because the data are in order.
For the lower quartile (LQ) we first need 4
1n)757(
7th
Key: 3 5 means 35 hours

Stem and Leaf Diagrams
12
82
444333222211003
665555553
2114
654
15 Weekly hours of 30 men
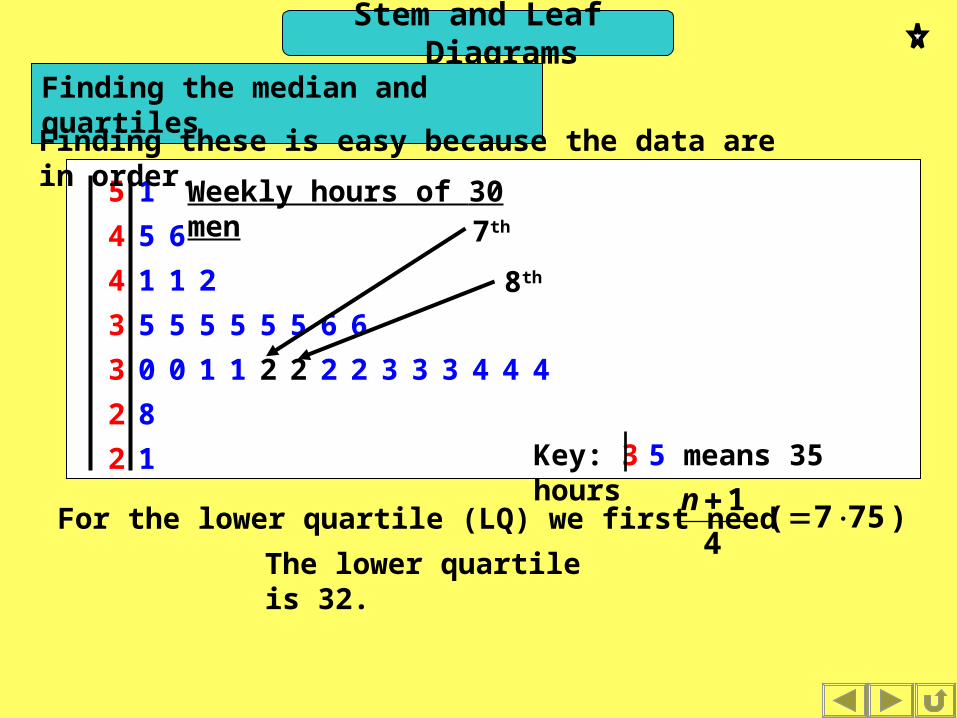
Finding the median and quartilesFinding these is easy because the data are in order.
7th
8th
For the lower quartile (LQ) we first need 4
1n)757(
Key: 3 5 means 35 hours
Stem and Leaf Diagrams
12
82
444333222211003
665555553
2114
654
15 Weekly hours of 30 men
Finding the median and quartilesFinding these is easy because the data are in order.
7th
8th
The lower quartile is 32.
For the lower quartile (LQ) we first need 4
1n)757(
Key: 3 5 means 35 hours

Stem and Leaf Diagrams
Finding the median and quartilesIf the values of the 7th and 8th observation are not the same, we interpolate to find the LQ.
and we want the 7·75th value, we need to add 0·75 of the gap between the 7th and 8th to the 7th value.
e.g. If we had7th value: 328th value: 36
So, The gap is 36 – 32 = 4.
0.75 of 4 is 3.
LQ = 32 + 3 = 35
Stem and Leaf Diagrams
12
82
444333222211003
665555553
2114
654
15 Weekly hours of 30 men
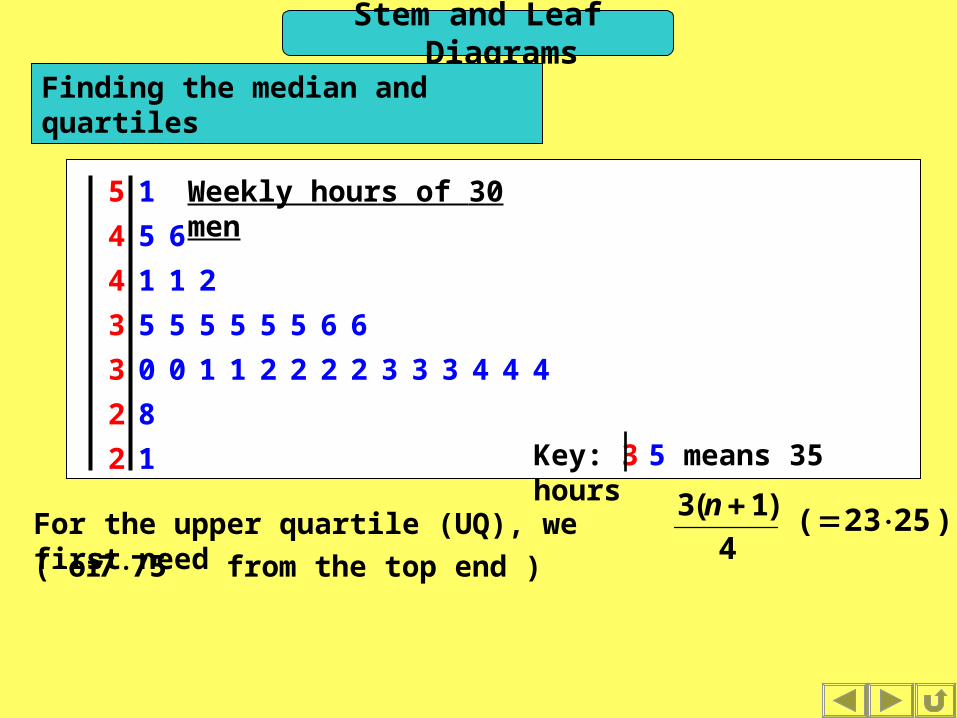
Finding the median and quartiles
)2523( For the upper quartile (UQ), we first need 4
)1(3 n
( or from the top end )757
Key: 3 5 means 35 hours
Stem and Leaf Diagrams
12
82
444333222211003
665555553
2114
654
15 Weekly hours of 30 men
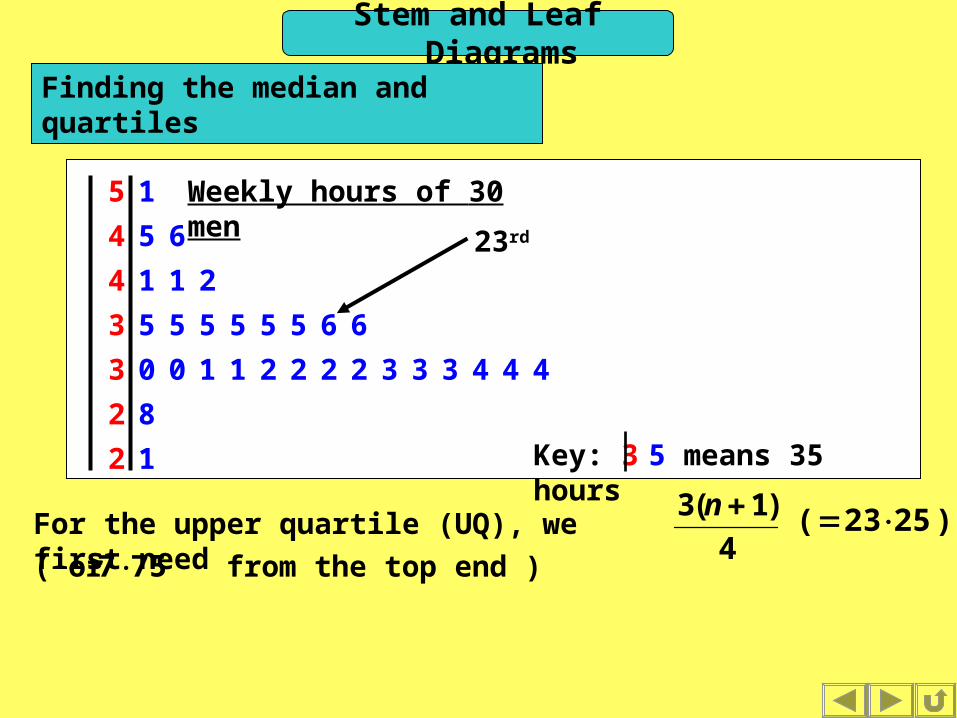
Finding the median and quartiles
23rd
)2523( For the upper quartile (UQ), we first need 4
)1(3 n
( or from the top end )757
Key: 3 5 means 35 hours
Stem and Leaf Diagrams
12
82
444333222211003
665555553
2114
654
15 Weekly hours of 30 men
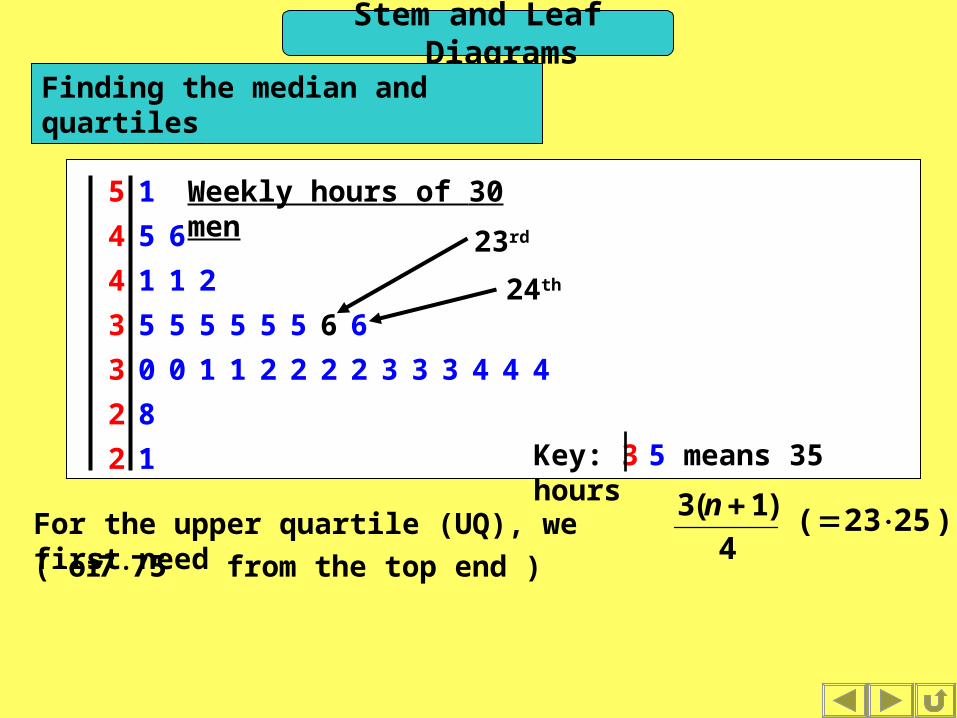
Finding the median and quartiles
23rd
24th
)2523( For the upper quartile (UQ), we first need 4
)1(3 n
( or from the top end )757
Key: 3 5 means 35 hours
Stem and Leaf Diagrams
12
82
444333222211003
665555553
2114
654
15 Weekly hours of 30 men
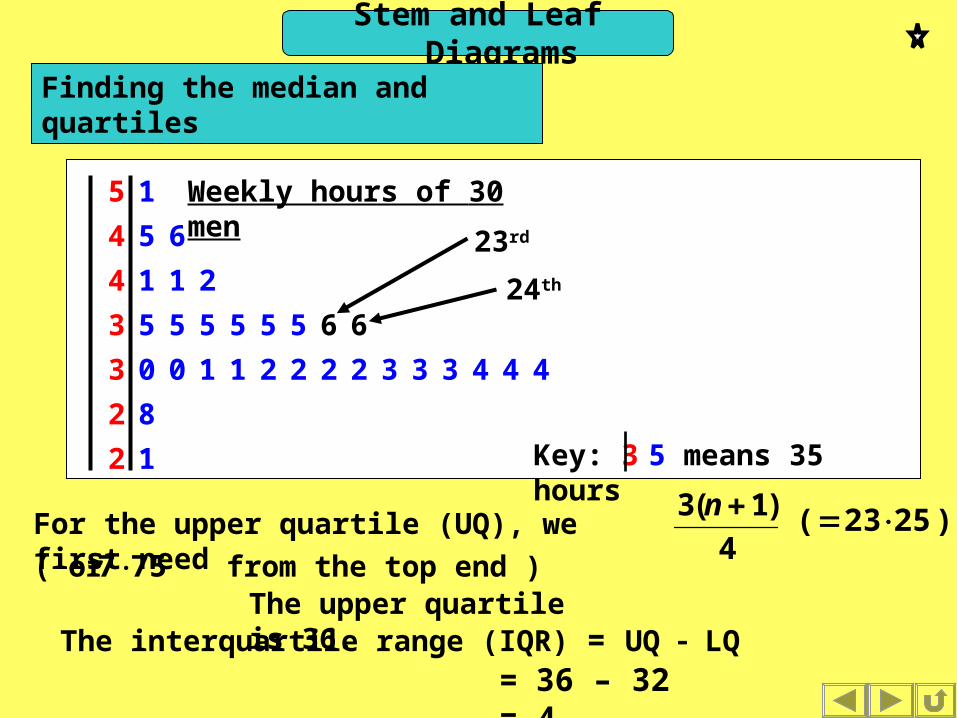
Finding the median and quartiles
23rd
24th
The upper quartile is 36.The interquartile range (IQR) = UQ LQ
= 36 – 32 = 4
)2523( For the upper quartile (UQ), we first need 4
)1(3 n
( or from the top end )757
Key: 3 5 means 35 hours
Stem and Leaf Diagrams
12
82
444333222211003
665555553
2114
654
15 Weekly hours of 30 men
Key: 3 5 means 35 hours
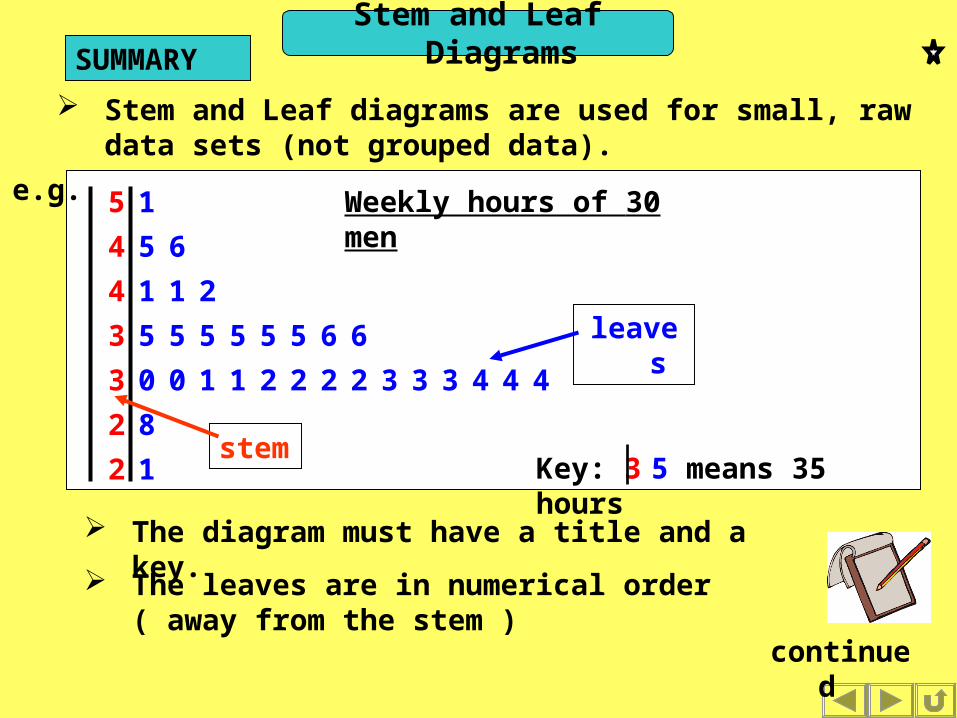
Stem and Leaf diagrams are used for small, raw data sets (not grouped data).
e.g.
The leaves are in numerical order ( away from the stem )
stem
leaves
The diagram must have a title and a key.
continued
SUMMARY

Stem and Leaf Diagrams
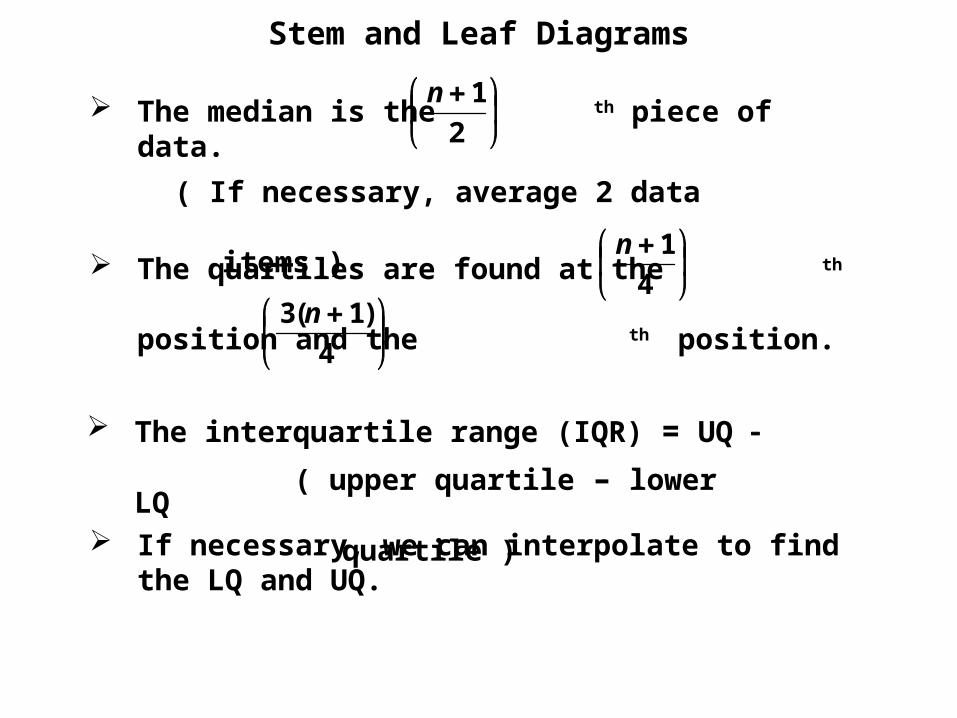
The median is the th piece of data.
2
1n
The quartiles are found at the th
position and the th position.
4
1n
4
)1(3 n
( If necessary, average 2 data
items )
The interquartile range (IQR) = UQ
LQ( upper quartile – lower
quartile ) If necessary, we can interpolate to find the
LQ and UQ.

Back-to-Back Stem and Leaf Diagrams
12
82
444333222211003
665555553
2114
654
15
Weekly hours Men
Key: 3 5 means 35 hrs
4 3
0
8 8 6 6 5 5 5 5
4 4 4 3 3 3 2 2 2
8
3 3 1 0
5 5 1
4 4 2 1
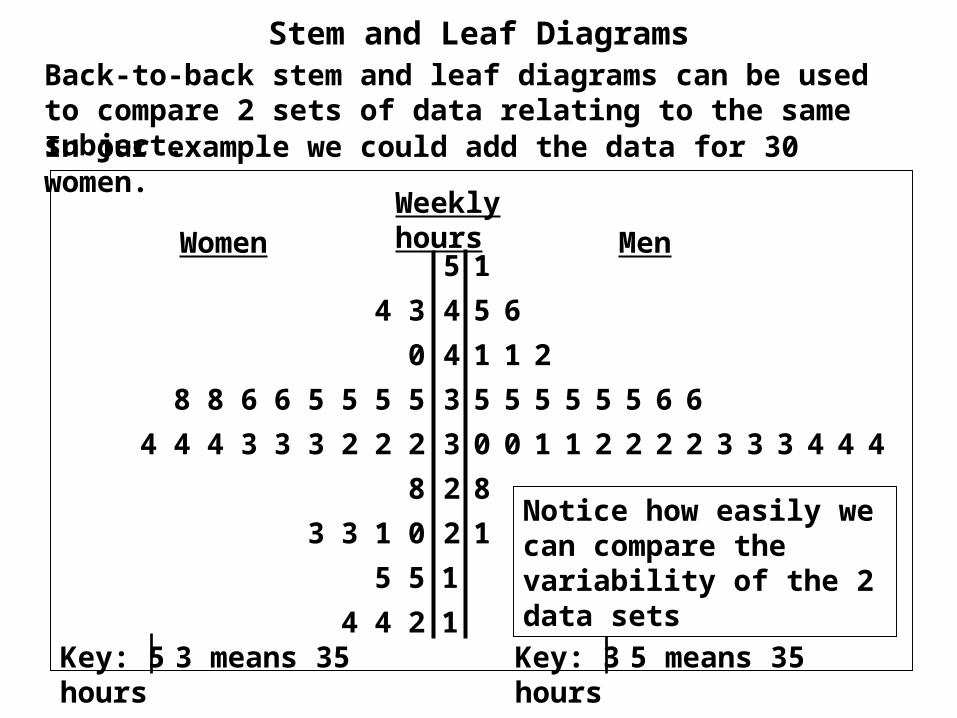
Back-to-back stem and leaf diagrams can be used to compare 2 sets of data relating to the same subject.In our example we could add the data for 30 women.
Women
Notice how easily we can compare the variability of the 2 data sets
Key: 5 3 means 35 hrs
Back-to-Back Stem and Leaf Diagrams
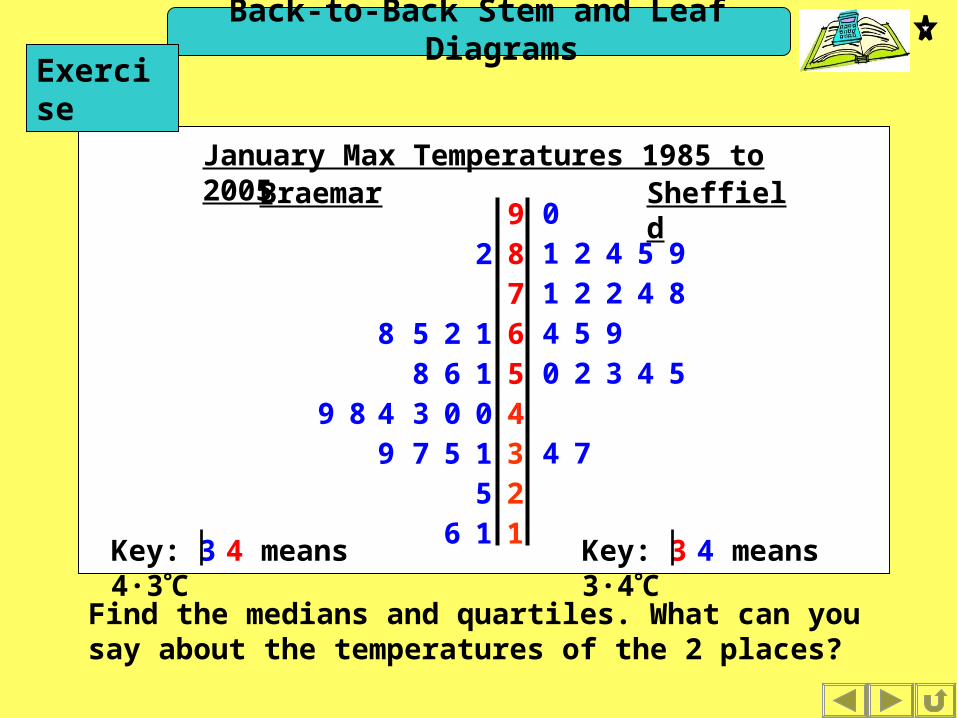
456789
January Max Temperatures 1985 to 2005 Sheffiel
d
11625315794003489
1681258
2
Braemar
74
54320954
8422195421
0
Exercise
Find the medians and quartiles. What can you say about the temperatures of the 2 places?
Key: 3 4 means 3·4C
Key: 3 4 means 4·3C
Back-to-Back Stem and Leaf Diagrams
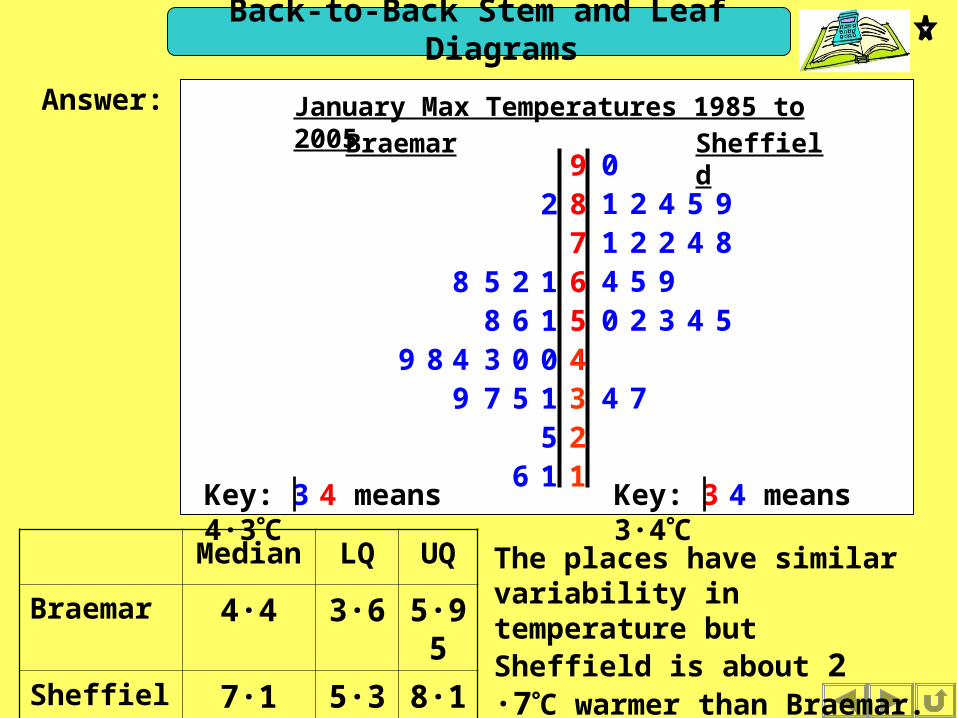
Answer:
The places have similar variability in temperature but Sheffield is about 2 ·7C warmer than Braemar.
Median
LQ UQ
Braemar 4·4 3·6 5·95
Sheffield
7·1 5·35 8·15
456789
January Max Temperatures 1985 to 2005 Sheffiel
d
11625315794003489
1681258
2
Braemar
74
54320954
8422195421
0
Key: 3 4 means 3·4C
Key: 3 4 means 4·3C


The following slides contain repeats of information on earlier slides, shown without colour, so that they can be printed and photocopied.For most purposes the slides can be printed as “Handouts” with up to 6 slides per sheet.

Stem and Leaf Diagrams
Weekly hours of 30 men
2
2
3
3
4
4
5
12
82
444333222211003
665555553
2114
654
15
Key: 3 5 means 35 hours
This is used for small, raw data sets (not grouped data).
e.g.
The leaves are in numerical order ( away from the stem )
stem
leaves
The diagram must have a title and a key.
SUMMARY
Stem and Leaf Diagrams
The median is the th piece of data.
2
1n
The quartiles are found at the th
position and the th position.
4
1n
4
)1(3 n
( If necessary, average 2 data
items )
If necessary, we can interpolate to find the LQ and UQ.
The interquartile range (IQR) = UQ
LQ( upper quartile – lower
quartile )
Stem and Leaf Diagrams
12
82
444333222211003
665555553
2114
654
15
Key: 3 5 means 35 hours
Weekly hours Men
1244
155
0133
8
222333444
55556688
0
34
Back-to-back stem and leaf diagrams can be used to compare 2 sets of data relating to the same subject.In our example we could add the data for 30 women.
Women
Key: 5 3 means 35 hours
Notice how easily we can compare the variability of the 2 data sets