Discrete Random Variables © Christine Crisp “Teach A Level Maths” Statistics 1.
Upload
mildred-flynnCategory
view
233download
3
The Central Limit The Central Limit TheoremTheorem
© Christine Crisp
““Teach A Level Maths”Teach A Level Maths”
Statistics 2Statistics 2

In the previous presentation we met a question where the sample was small. So, we couldn’t be sure that the estimate of the population mean was a good one.A numerical measure of the accuracy of an estimate can be made if we know the standard deviation of the population.
How Good are Estimates?
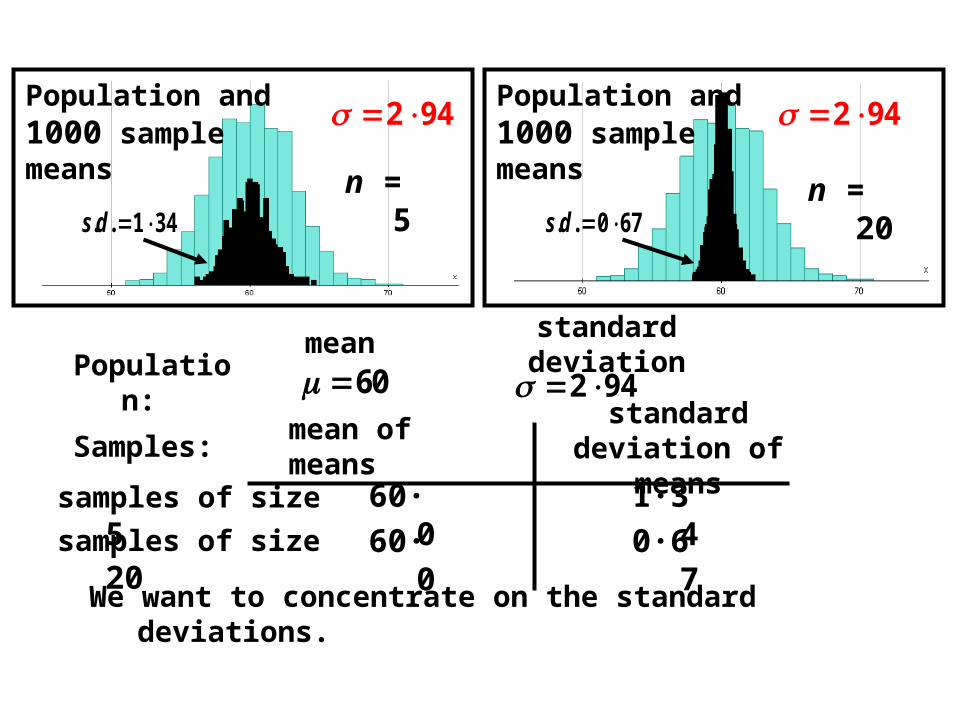
To explain this, we’ll look again at the diagrams showing the means of 1000 samples from a population of weights of hens’ eggs.
n = 20
Population and 1000 sample means
n = 5
Population and 1000 sample means
60 942 Populatio
n:
mean standard deviation
We want to concentrate on the standard deviations.
mean of means
standard deviation of
meansSamples:
942 942
samples of size 5
1·3460·0
samples of size 20 0·6760·0
341.. ds 670.. ds
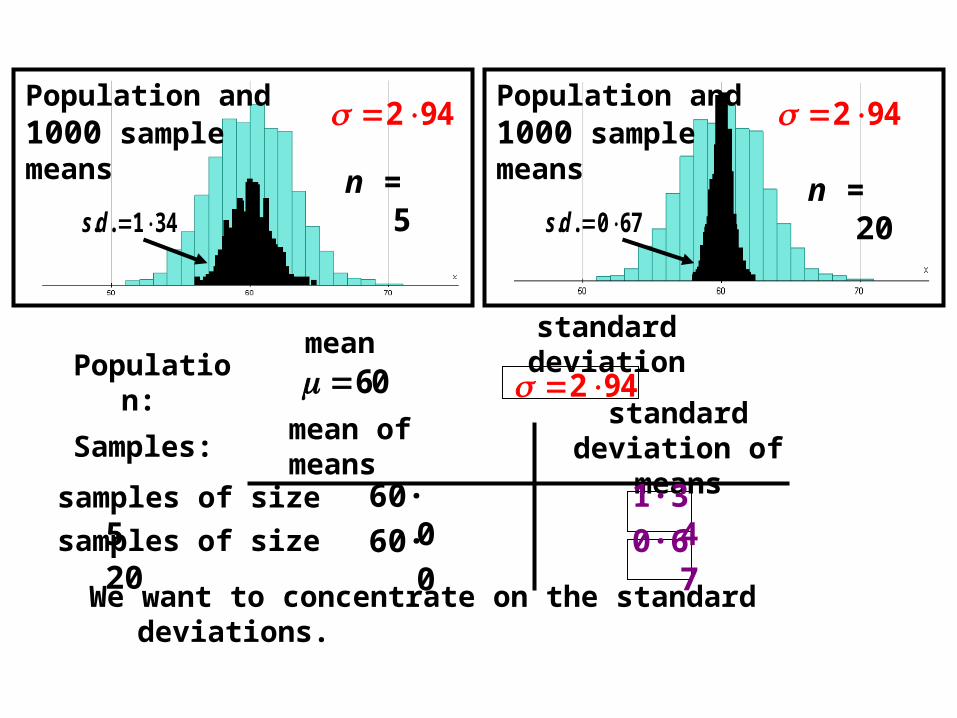
60 942 Populatio
n:
mean standard deviation
We want to concentrate on the standard deviations.
mean of means
standard deviation of
meansSamples:
n = 20
Population and 1000 sample means
n = 5
Population and 1000 sample means
942 942
341.. ds 670.. ds
samples of size 5
1·3460·0
samples of size 20 0·6760·0
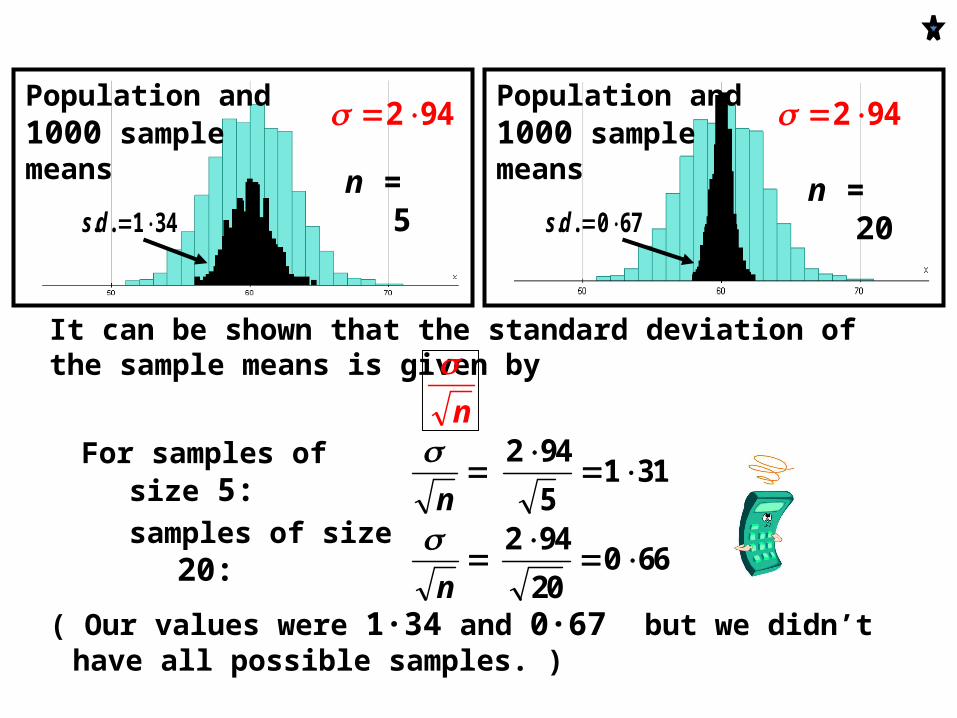
It can be shown that the standard deviation of the sample means is given by
n
For samples of size 5:
n
311
5
942
samples of size 20:
n
660
20
942
( Our values were 1·34 and 0·67 but we didn’t have all possible samples. )
n = 20
Population and 1000 sample means
n = 5
Population and 1000 sample means
942 942
341.. ds 670.. ds
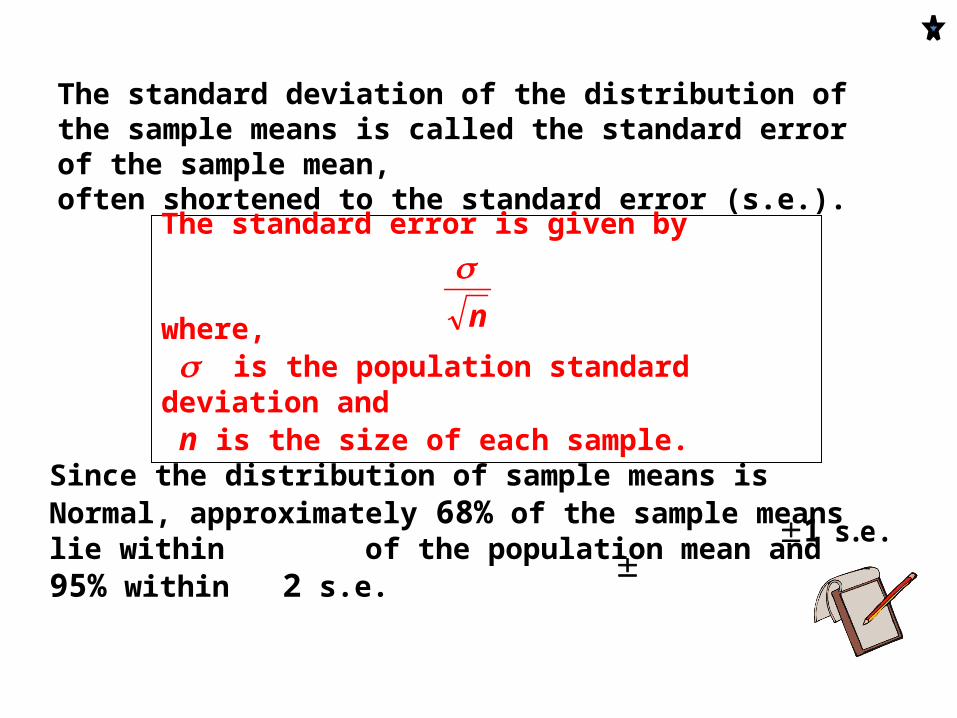
The standard deviation of the distribution of the sample means is called the standard error of the sample mean, often shortened to the standard error (s.e.).
The standard error is given by
where, is the population standard deviation and n is the size of each sample.
n
Since the distribution of sample means is Normal, approximately 68% of the sample means lie within of the population mean and 95% within 2 s.e.
s.e.1
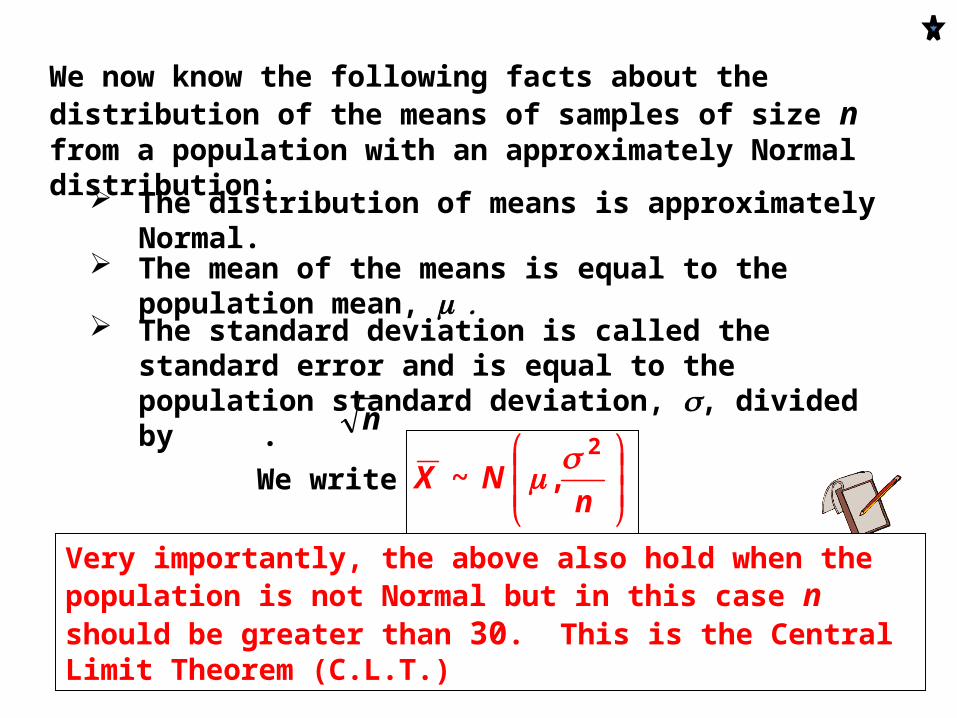
We now know the following facts about the distribution of the means of samples of size n from a population with an approximately Normal distribution: The distribution of means is approximately
Normal. The mean of the means is equal to the
population mean, The standard deviation is called the
standard error and is equal to the population standard deviation, , divided by . n
We write
nNX
2
,~
Very importantly, the above also hold when the population is not Normal but in this case n should be greater than 30. This is the Central Limit Theorem (C.L.T.)
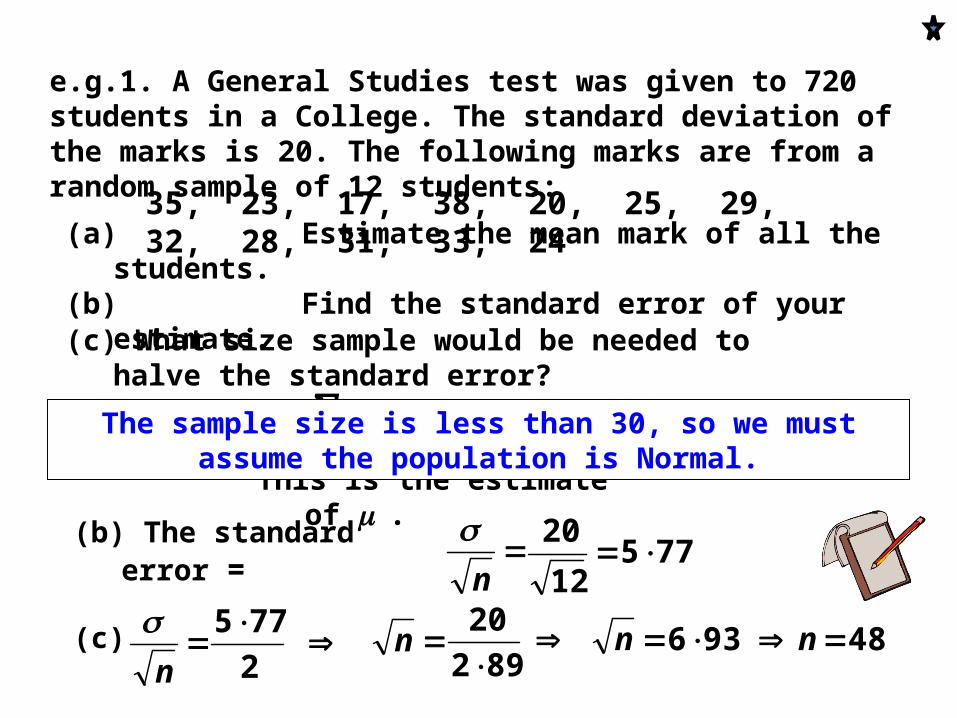
e.g.1. A General Studies test was given to 720 students in a College. The standard deviation of the marks is 20. The following marks are from a random sample of 12 students:
Solution: (a)
35, 23, 17, 38, 20, 25, 29, 32, 28, 31, 33, 24
92712
29...2348
x
(b) The standard error =
This is the estimate of .
n
xx
n
775
12
20
(a)Estimate the mean mark of all the students.(b)Find the standard error of your estimate.(c) What size sample would be needed to
halve the standard error?
(c)
2
775
n
48936 nn
892
20
n
The sample size is less than 30, so we must assume the population is Normal.
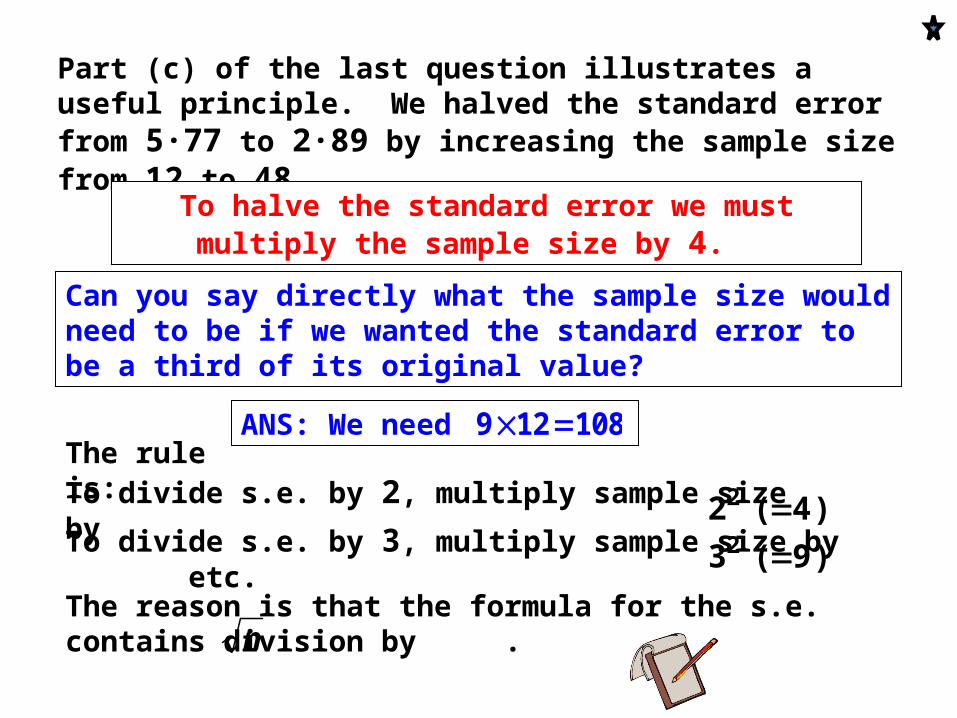
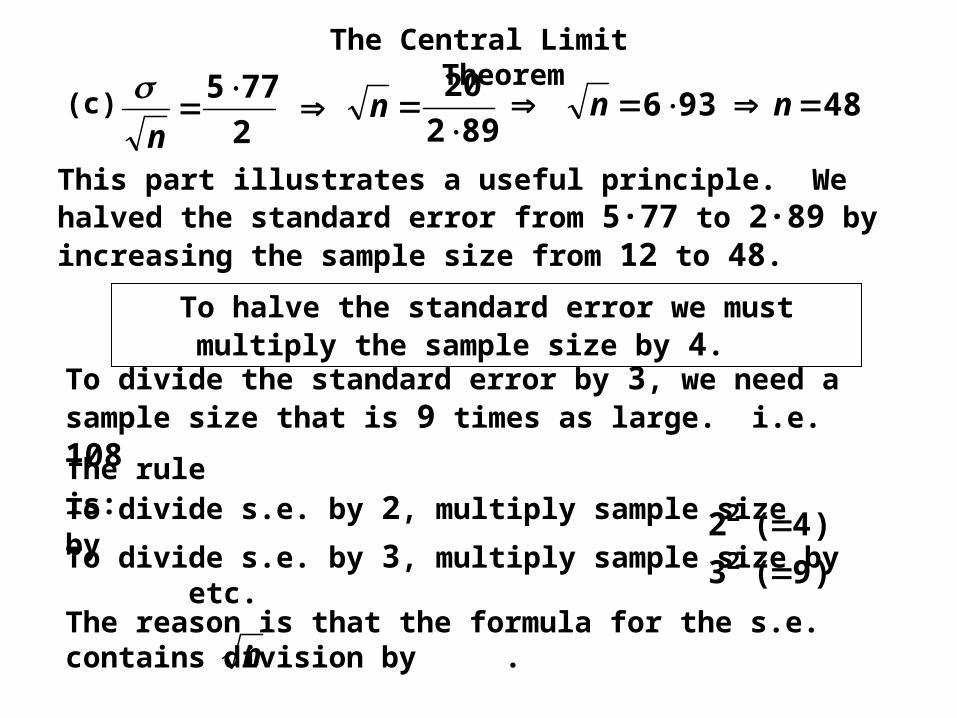
Part (c) of the last question illustrates a useful principle. We halved the standard error from 5·77 to 2·89 by increasing the sample size from 12 to 48.
To halve the standard error we must multiply the sample size by 4.
Can you say directly what the sample size would need to be if we wanted the standard error to be a third of its original value?
ANS: We need 108129 The rule is:To divide s.e. by 2, multiply sample size by )4(22 To divide s.e. by 3, multiply sample size by etc.
)9(32 The reason is that the formula for the s.e. contains division by . n
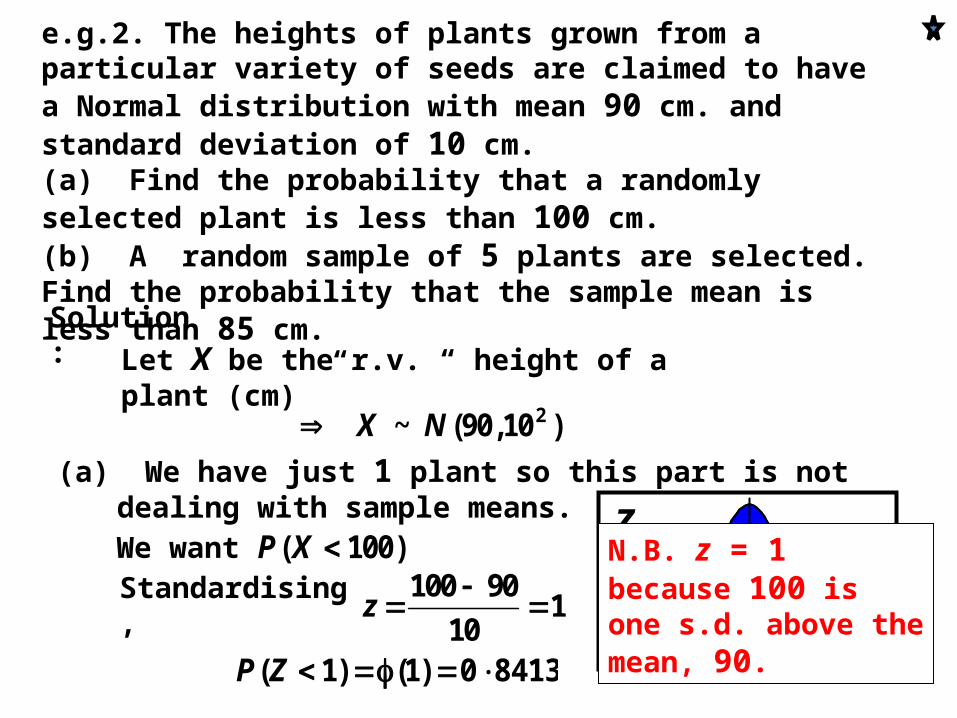
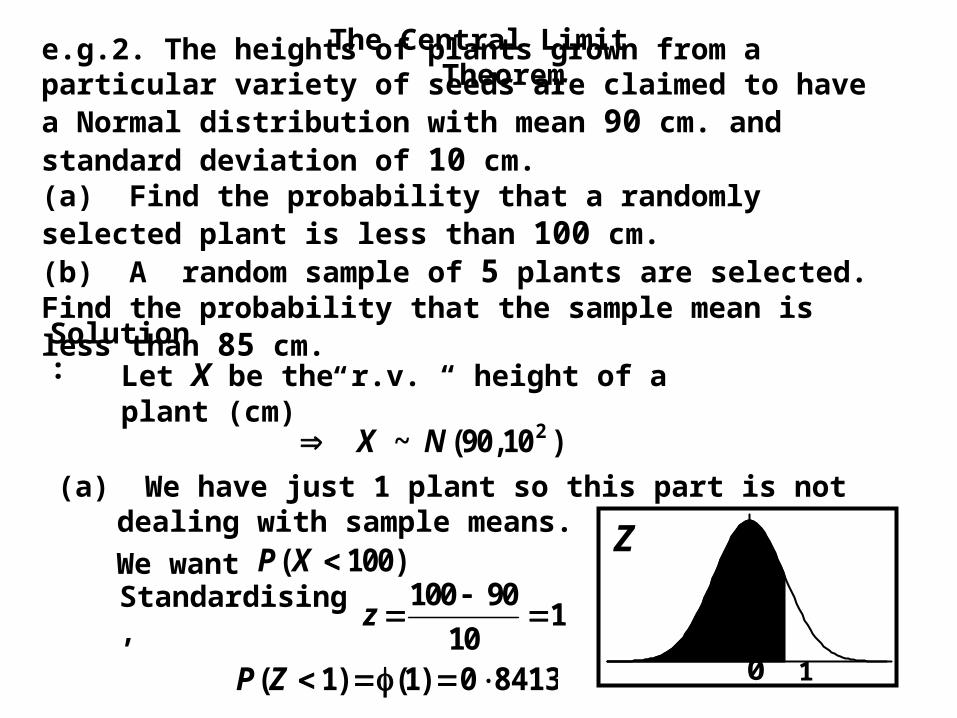
e.g.2. The heights of plants grown from a particular variety of seeds are claimed to have a Normal distribution with mean 90 cm. and standard deviation of 10 cm.(a) Find the probability that a randomly selected plant is less than 100 cm.(b) A random sample of 5 plants are selected. Find the probability that the sample mean is less than 85 cm.Solution: Let X be the r.v. “ height of a plant
(cm) ”
(a) We have just 1 plant so this part is not dealing with sample means.
)10,90(~ 2NX
)100( XPWe want
84130)1()1( ZP
110
90100
zStandardising,
10
ZN.B. z = 1 because 100 is one s.d. above the mean, 90.
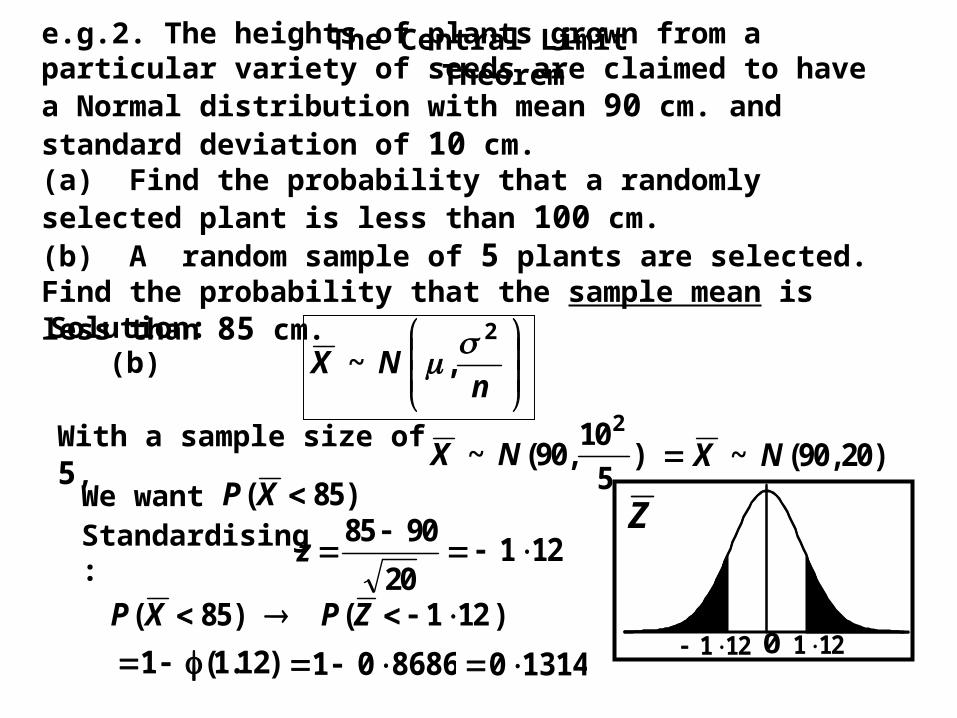
e.g.2. The heights of plants grown from a particular variety of seeds are claimed to have a Normal distribution with mean 90 cm. and standard deviation of 10 cm.(a) Find the probability that a randomly selected plant is less than 100 cm.(b) A random sample of 5 plants are selected. Find the probability that the sample mean is less than 85 cm.Solution: (b)
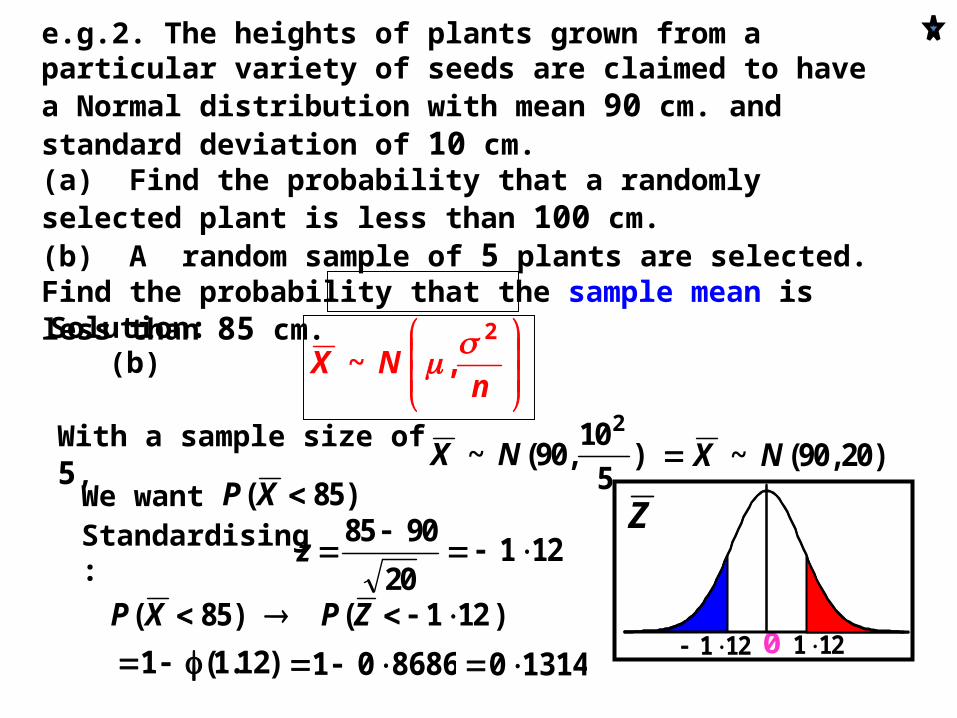
121 0
Z
121
With a sample size of 5,
)5
10,90(~
2
NX
nNX
2
,~
)121()85( ZPXP
)85( XPWe want
Standardising:
20
9085z
)20,90(~ NX
121
)12.1(1 868601 13140
e.g.2. The heights of plants grown from a particular variety of seeds are claimed to have a Normal distribution with mean 90 cm. and standard deviation of 10 cm.(a) Find the probability that a randomly selected plant is less than 100 cm.(b) A random sample of 5 plants are selected. Find the probability that the sample mean is less than 85 cm.Solution: (b)
Exercise
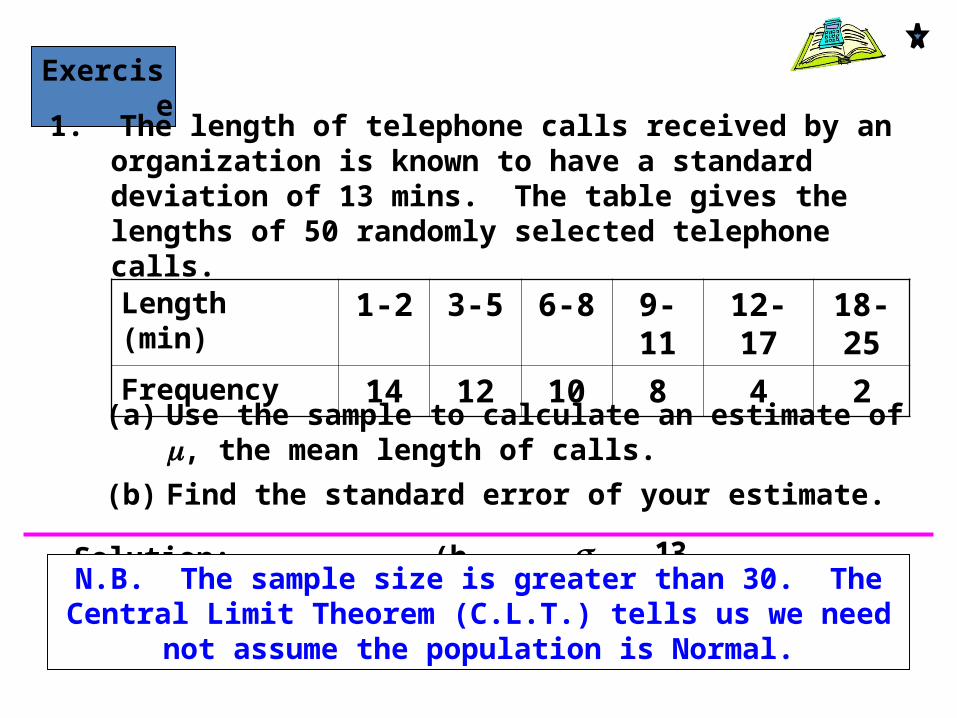
1. The length of telephone calls received by an organization is known to have a standard deviation of 13 mins. The table gives the lengths of 50 randomly selected telephone calls.Length (min)
1-2 3-5 6-8 9-11 12-17 18-25
Frequency 14 12 10 8 4 2(a) Use the sample to calculate an estimate of ,
the mean length of calls.
(b) Find the standard error of your estimate.
Solution: (a)
46 x (b)
84150
13..
nes
N.B. The sample size is greater than 30. The
Central Limit Theorem (C.L.T.) tells us we need not assume the population is Normal.
Exercise
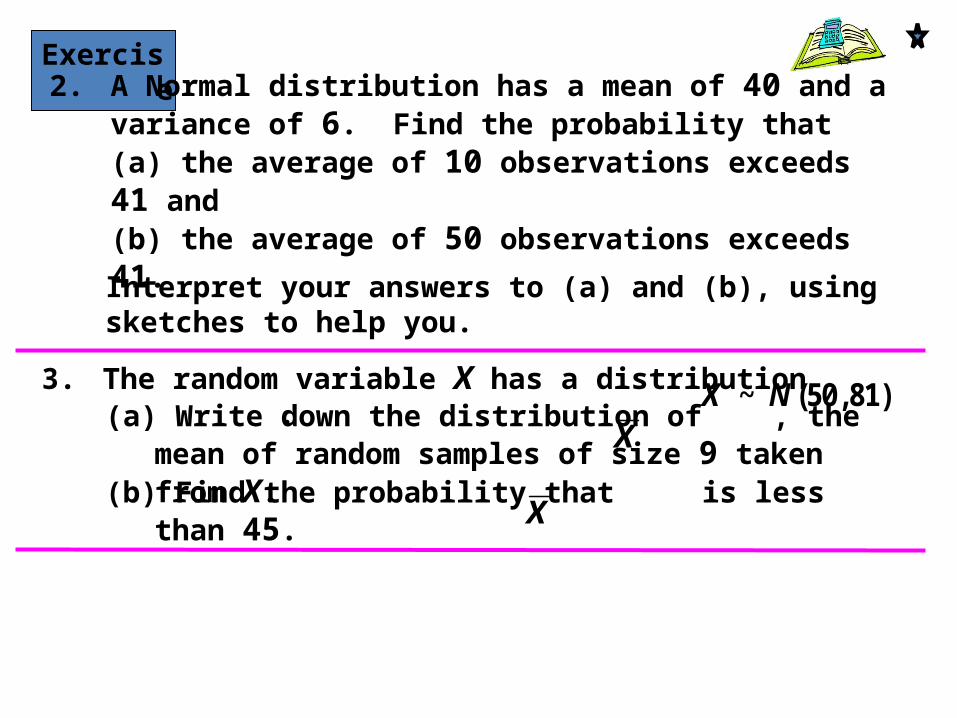
2. A Normal distribution has a mean of 40 and a variance of 6. Find the probability that (a) the average of 10 observations exceeds 41 and (b) the average of 50 observations exceeds 41.
3. The random variable X has a distribution . (a) Write down the distribution of , the mean
of random samples of size 9 taken from X.
)81,50(~ NX
(b) Find the probability that is less than 45.
X
X
Interpret your answers to (a) and (b), using sketches to help you.
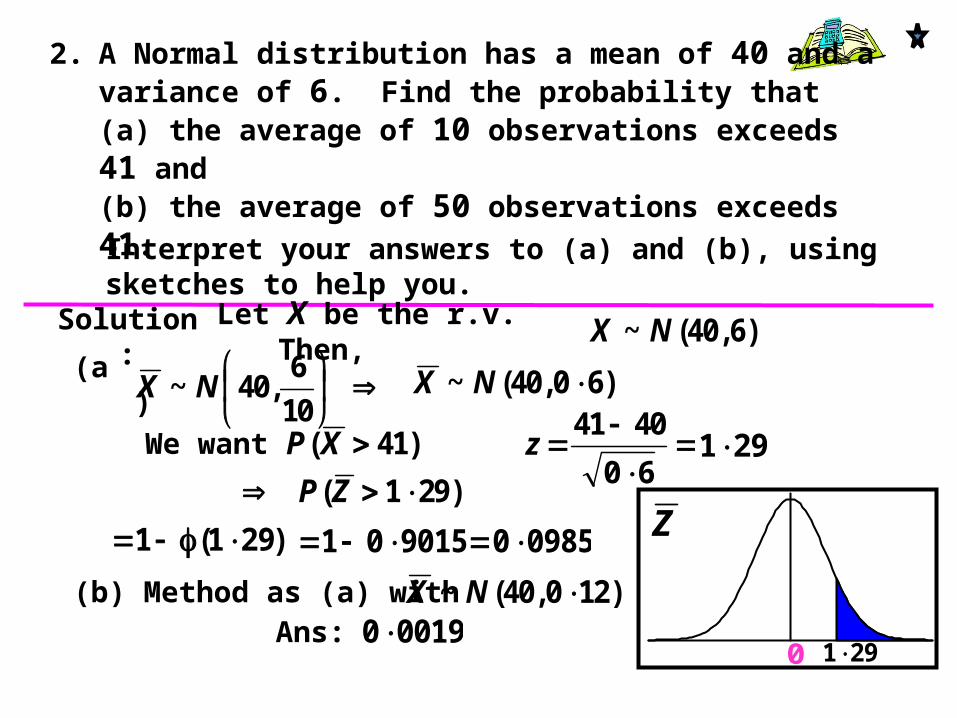
2. A Normal distribution has a mean of 40 and a variance of 6. Find the probability that (a) the average of 10 observations exceeds 41 and (b) the average of 50 observations exceeds 41.
Solution:
60
4041z
Let X be the r.v. Then, )6,40(~ NX(a
)
10
6,40~ NX )60,40(~ NX
)41( XPWe
want
291
Z
0 291
)291( ZP
)291(1 09850901501
(b) Method as (a) with )120,40(~ NXAns: 00190
Interpret your answers to (a) and (b), using sketches to help you.
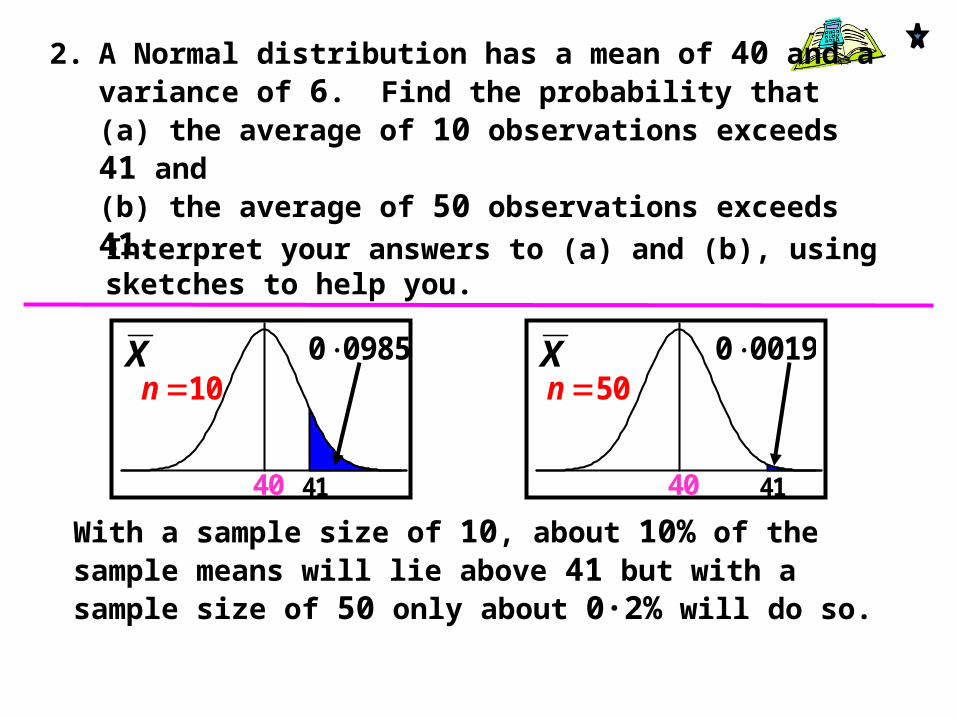
With a sample size of 10, about 10% of the sample means will lie above 41 but with a sample size of 50 only about 0·2% will do so.
X
40 41
09850 10n
X
40 41
00190 50n
2. A Normal distribution has a mean of 40 and a variance of 6. Find the probability that (a) the average of 10 observations exceeds 41 and (b) the average of 50 observations exceeds 41. Interpret your answers to (a) and (b), using sketches to help you.
Z
0671 671
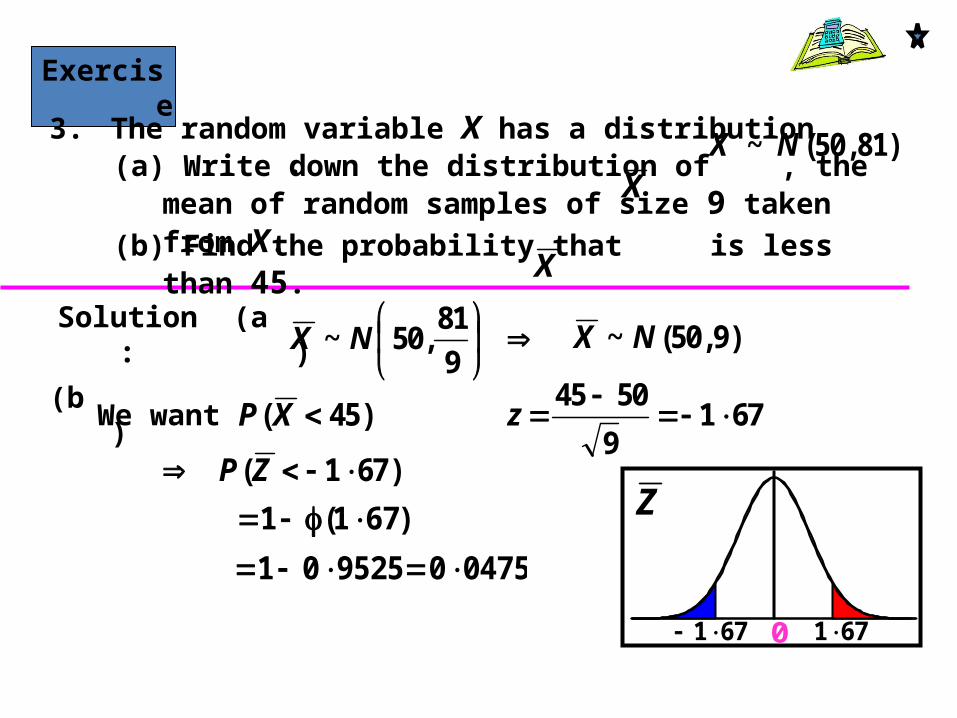
Exercise
(a)
Solution:
6719
5045
z
9
81,50~ NX )9,50(~ NX
)671( ZP
)671(1 04750952501
3. The random variable X has a distribution . (a) Write down the distribution of , the mean
of random samples of size 9 taken from X.
)81,50(~ NX
(b) Find the probability that is less than 45.
X
X
)45( XPWe
want
(b)

The following slides contain repeats of information on earlier slides, shown without colour, so that they can be printed and photocopied.For most purposes the slides can be printed as “Handouts” with up to 6 slides per sheet.
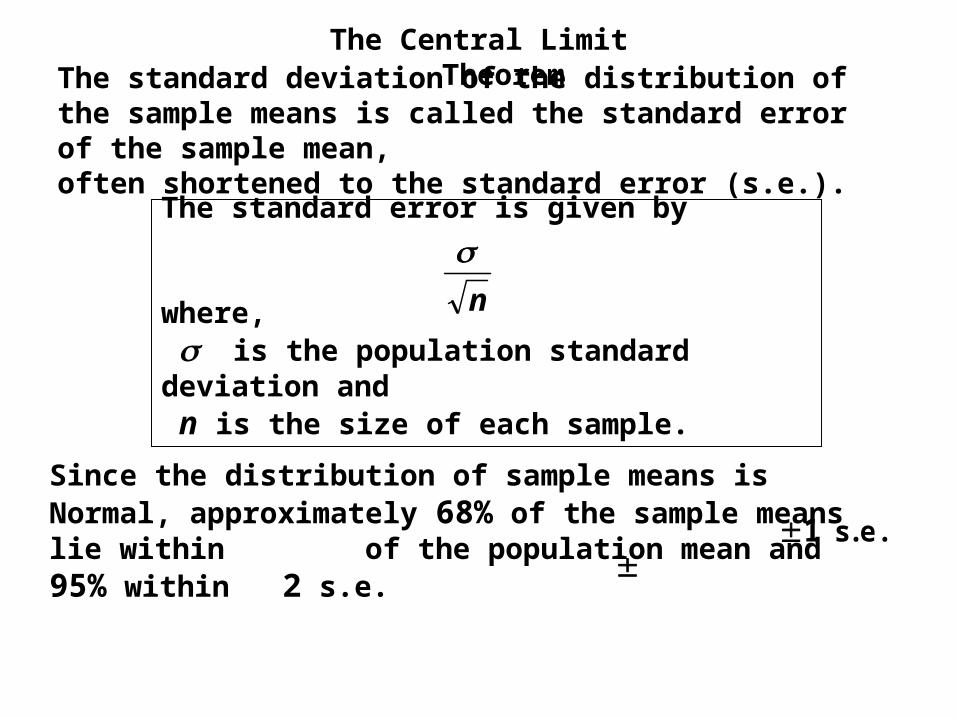
The Central Limit TheoremThe standard deviation of the distribution of the
sample means is called the standard error of the sample mean, often shortened to the standard error (s.e.).
The standard error is given by
where, is the population standard deviation and n is the size of each sample.
n
Since the distribution of sample means is Normal, approximately 68% of the sample means lie within of the population mean and 95% within 2 s.e.
s.e.1
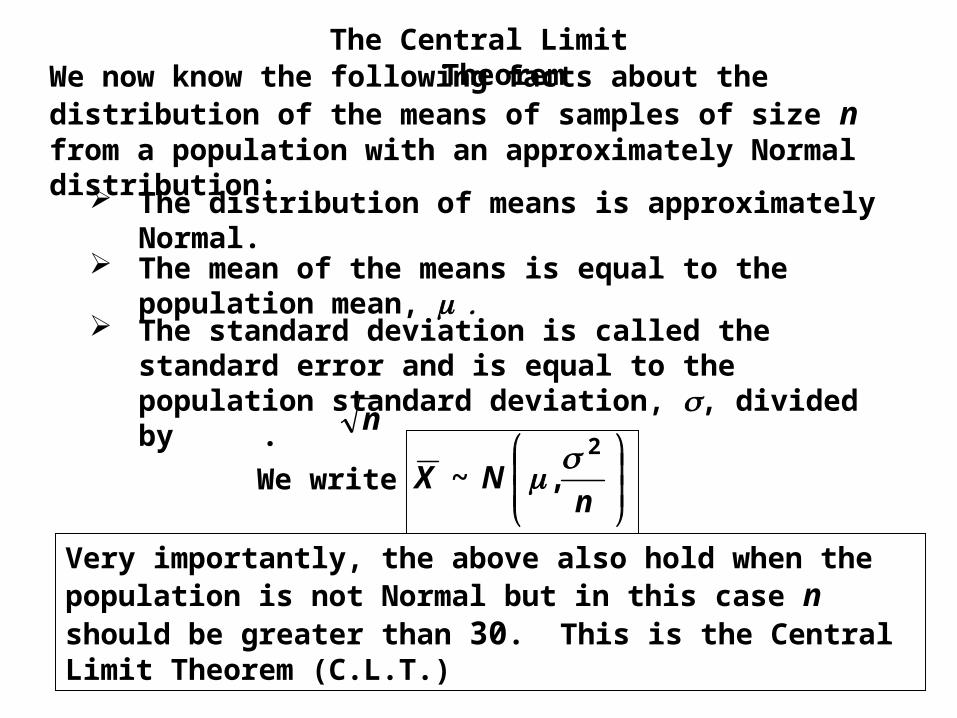
The Central Limit TheoremWe now know the following facts about the
distribution of the means of samples of size n from a population with an approximately Normal distribution: The distribution of means is approximately
Normal. The mean of the means is equal to the
population mean, The standard deviation is called the
standard error and is equal to the population standard deviation, , divided by . n
We write
nNX
2
,~
Very importantly, the above also hold when the population is not Normal but in this case n should be greater than 30. This is the Central Limit Theorem (C.L.T.)
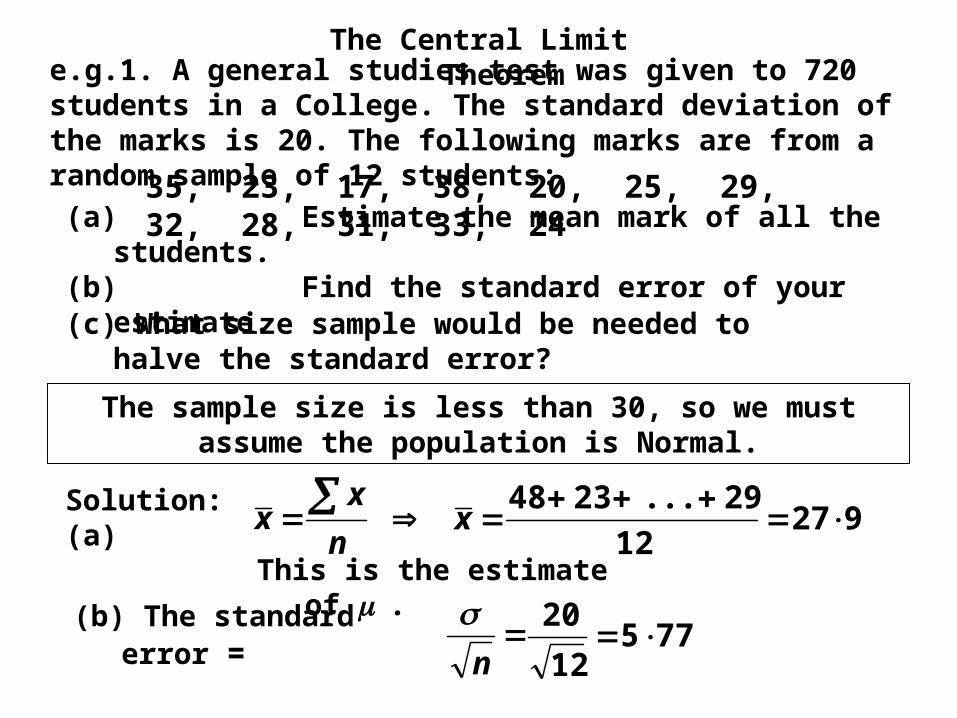
The Central Limit Theoreme.g.1. A general studies test was given to 720
students in a College. The standard deviation of the marks is 20. The following marks are from a random sample of 12 students:
Solution: (a)
35, 23, 17, 38, 20, 25, 29, 32, 28, 31, 33, 24
92712
29...2348
x
(b) The standard error =
This is the estimate of .
n
xx
n
775
12
20
(a)Estimate the mean mark of all the students.(b)Find the standard error of your estimate.(c) What size sample would be needed to
halve the standard error?
The sample size is less than 30, so we must assume the population is Normal.
The Central Limit Theorem
This part illustrates a useful principle. We halved the standard error from 5·77 to 2·89 by increasing the sample size from 12 to 48.
To halve the standard error we must multiply the sample size by 4.
To divide the standard error by 3, we need a sample size that is 9 times as large. i.e. 108
The rule is:To divide s.e. by 2, multiply sample size by )4(22 To divide s.e. by 3, multiply sample size by etc.
)9(32 The reason is that the formula for the s.e. contains division by . n
(c)
2
775
n
48936 nn
892
20
n
The Central Limit Theorem
e.g.2. The heights of plants grown from a particular variety of seeds are claimed to have a Normal distribution with mean 90 cm. and standard deviation of 10 cm.(a) Find the probability that a randomly selected plant is less than 100 cm.(b) A random sample of 5 plants are selected. Find the probability that the sample mean is less than 85 cm.Solution: Let X be the r.v. “ height of a plant
(cm) ”
(a) We have just 1 plant so this part is not dealing with sample means.
)10,90(~ 2NX
)100( XPWe want
84130)1()1( ZP
110
90100
zStandardising,
10
Z
The Central Limit Theorem
121 0
Z
121
With a sample size of 5,
)5
10,90(~
2
NX
nNX
2
,~
)121()85( ZPXP
)85( XPWe want
Standardising:
20
9085z
)20,90(~ NX
121
)12.1(1 868601 13140
e.g.2. The heights of plants grown from a particular variety of seeds are claimed to have a Normal distribution with mean 90 cm. and standard deviation of 10 cm.(a) Find the probability that a randomly selected plant is less than 100 cm.(b) A random sample of 5 plants are selected. Find the probability that the sample mean is less than 85 cm.Solution: (b)