Status of Coal-Fired Power Plants in Poland · Status of Coal-Fired Power Plants in Poland 2013...
13
Status of Coal-Fired Power Plants in Poland 2013 U.S.-Poland Energy Roundtable
Transcript of Status of Coal-Fired Power Plants in Poland · Status of Coal-Fired Power Plants in Poland 2013...

Status of Coal-Fired Power Plants in Poland
2013 U.S.-Poland Energy Roundtable

Territory: 322 575 km2 Population: 38.5 mln Capital city: Warsaw
Polish Power System
key figures 2012

Installed capacity: 38 GW
Available capacity: 37.7 GW
Reliable capacity of domestic power stations: 28.5 GW
Maximum demand: 25.8 GW
Gross electricity generation : 162 TWh
Gross consumption: 159 TWh
Length of transmission electric lines (750kV and 220 kV): 13 500 km
Length of distribution electric lines (110 kV and low lines): 774 200 km
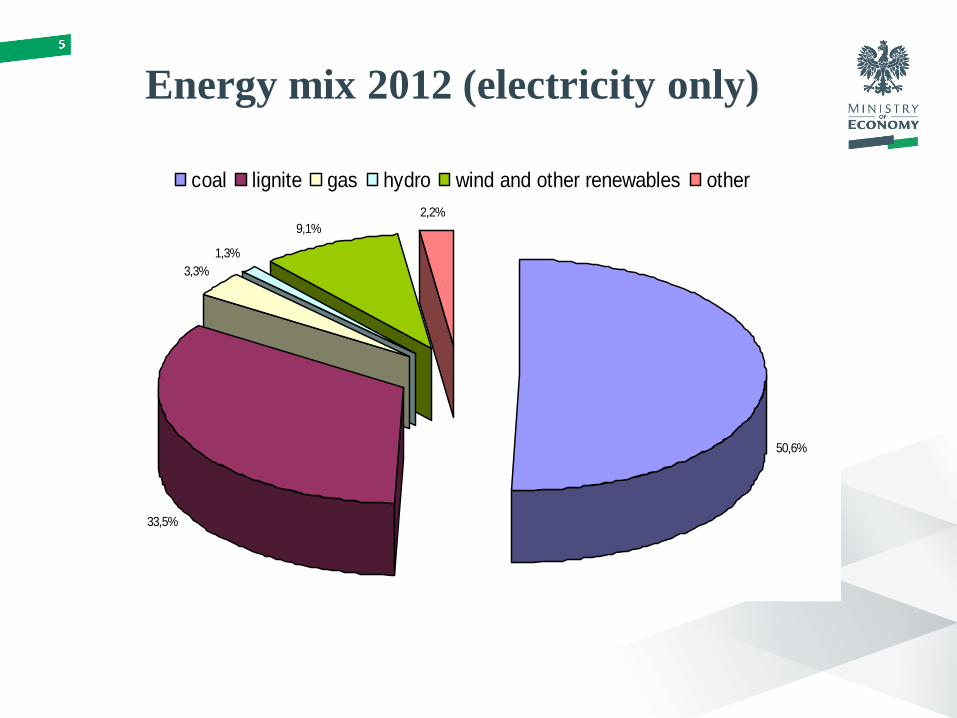
Energy mix 2012 (electricity only)
50,6%
33,5%
3,3%
1,3%
9,1%
2,2%
coal lignite gas hydro wind and other renewables other
6
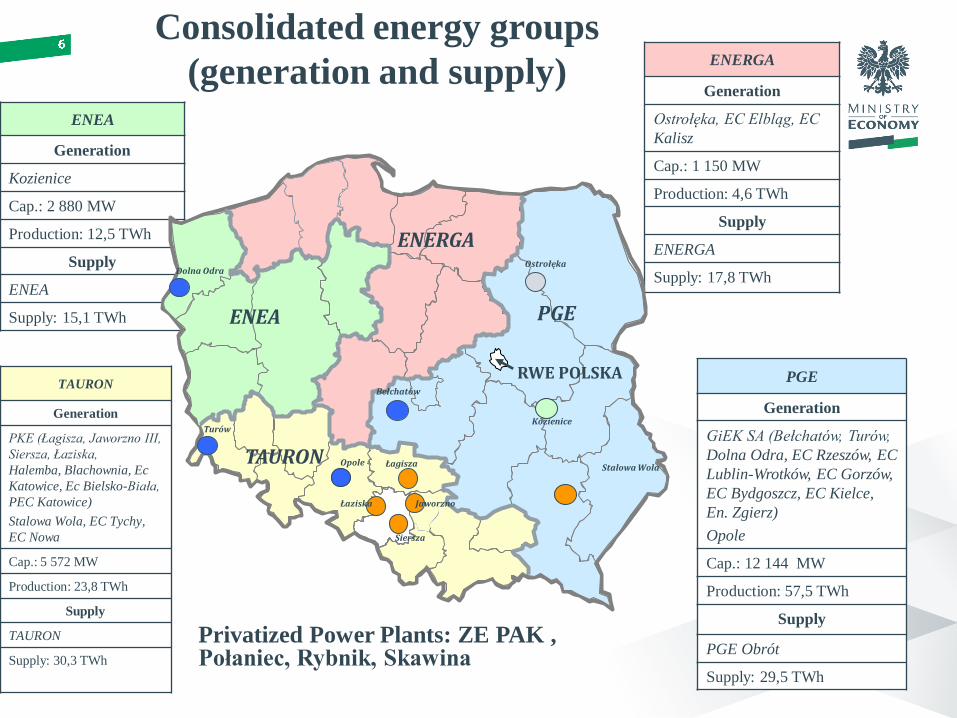
ENEA
Generation
Kozienice
Cap.: 2 880 MW
Production: 12,5 TWh
Supply
ENEA
Supply: 15,1 TWh
ENERGA
Generation
Ostrołęka, EC Elbląg, EC
Kalisz
Cap.: 1 150 MW
Production: 4,6 TWh
Supply
ENERGA
Supply: 17,8 TWh
TAURON
Generation
PKE (Łagisza, Jaworzno III,
Siersza, Łaziska,
Halemba, Blachownia, Ec
Katowice, Ec Bielsko-Biała,
PEC Katowice)
Stalowa Wola, EC Tychy,
EC Nowa
Cap.: 5 572 MW
Production: 23,8 TWh
Supply
TAURON
Supply: 30,3 TWh
PGE
Generation
GiEK SA (Bełchatów, Turów,
Dolna Odra, EC Rzeszów, EC
Lublin-Wrotków, EC Gorzów,
EC Bydgoszcz, EC Kielce,
En. Zgierz)
Opole
Cap.: 12 144 MW
Production: 57,5 TWh
Supply
PGE Obrót
Supply: 29,5 TWh
Privatized Power Plants: ZE PAK , Połaniec, Rybnik, Skawina
PKE
PGE
(BOT)
Enion
Energia Pro
Ł - 2
ŁZE
Łódź Teren L - 5
(WGE)
RZE
Energetyka
Podkarpacka
ENEA
El. Kozienice
ENERGA
PAK (50%)
Brunatnego
Z. El. Ostrołęka
TAURON
PGE ENEA
Dolna Odra
ENERGA Ostrołęka
Turów
Opole
Bełchatów
Łaziska Jaworzno
Łagisza
RWE POLSKA
Kozienice
Siersza
Stalowa Wola
Consolidated energy groups
(generation and supply)

Major power plants in Poland
Bełchatów
12x370 MW
1x858 MW
(new)
Kozienice
2x500+8x225 MW
Stalowa Wola
2x125 MW
Połaniec
8x225 MW
Dolna Odra
8x220 MW
Rybnik
8x225 MW
Pątnów
6x200 MW
Adamów
5x120 MW
Konin
2x120 MW
Łaziska
2x125+4x225 MW
Ostrołęka
3x220 MW
Jaworzno
6x225 MW
Łagisza
7x120 MW
Siersza
2x160+4x120 MW
Skawina
4x110 MW
Turów
3x260 + 3x235 + 3x200 MW
Porąbka-Żar
4x135 MW
Żarnowiec
4x180 MW
water pump
storage
plant
Opole
4x380 MW
lignite
hard coal

Generation of
electricity

Electricity generation [TWh]
lata
Years 2007 2008 2009 2010 2011 2012
0 1 2 3 4 5 6
Total generation 159.3 155.3 151.7 157.7 163.5 162
Hard coal 92.8 85.6 83.2 87.9 87.3 82
Lignite 51.0 53.2 50.2 48.7 52.5 54.2
Hard coal+lignite 143.8 138.8 133.4 136.6 139.8 136.2
Electricity generation from
hard coal and lignite

Age structure of electricity generation
devices
4,95 4,667,02 7,91
3,11 4,156,71 6,81
13,37 14,0417,33 17,96
47,5344,47
0
10
20
30
40
50
boilers turbosets
[%]
under 5 years 5-10 years 10-15years 15-20 years 20-25 years 25-30 years over 30 years
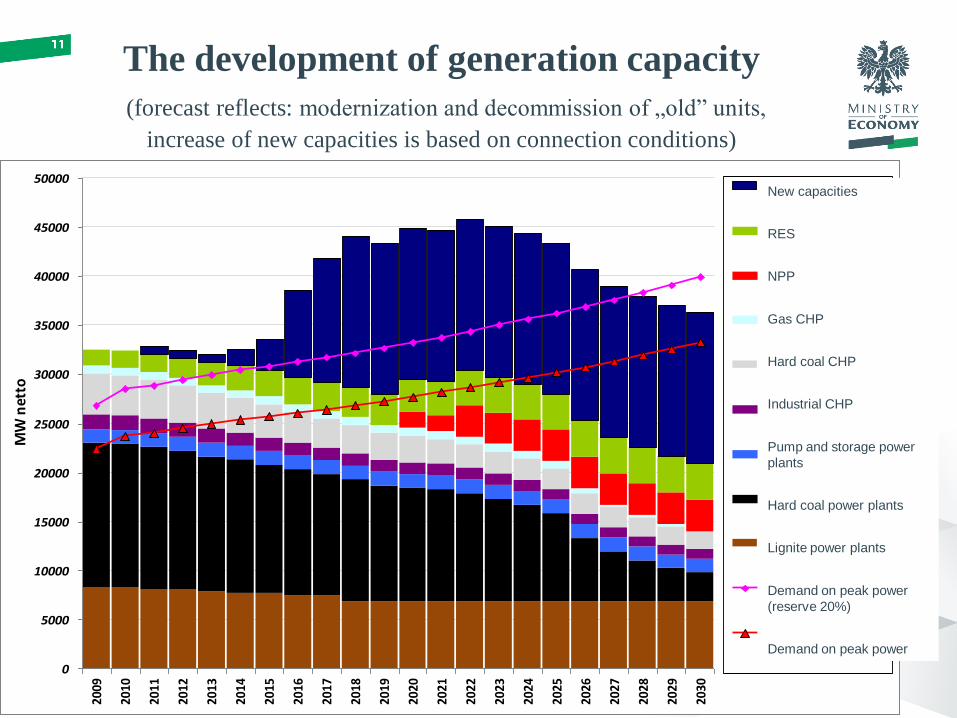
The development of generation capacity
(forecast reflects: modernization and decommission of „old” units,
increase of new capacities is based on connection conditions)
0
5000
10000
15000
20000
25000
30000
35000
40000
45000
50000
2009
2010
2011
2012
2013
2014
2015
2016
2017
2018
2019
2020
2021
2022
2023
2024
2025
2026
2027
2028
2029
2030
MW
net
to
Nowe moce (warunkiprzyłączeniowe)
OZE (mocdyspozycyjna)
EL_Jądrowe
EC_Gaz
EC_WK
EC_Przemysłowe
EL_Pompowe
EL_WK_Stare
EL_WB_Stare
Zapotrzebowanie namoc szczytową imargines mocy (+20%)Zapotrzebowanie namoc szczytową netto
New capacities
RES
NPP
Gas CHP
Hard coal CHP
Industrial CHP
Pump and storage power
plants
Hard coal power plants
Lignite power plants
Demand on peak power
(reserve 20%)
Demand on peak power

Losses and increase in power generation from coal
based on estimates of energy producers
The installed capacity will decrease by 2015 by about 1100 MW.
By 2025 total decrease will reach a level of 2500 MW
At the same time it is planned to install 10 600 MW of new capacities till 2025
It is planned that total increase in installed capacity till 2025
will reach a level of 8100 MW

Thank you for your attention
Energy Department