STATISTICAL SUMMARY PIPELINE TRANSPORTATION …
21
STATISTICAL SUMMARY PIPELINE TRANSPORTATION OCCURRENCES IN 2018
Transcript of STATISTICAL SUMMARY PIPELINE TRANSPORTATION …
STATISTICAL SUMMARY PIPELINE TRANSPORTATION OCCURRENCES IN 2018
Transportation Safety Board of Canada Place du Centre 200 Promenade du Portage, 4th floor Gatineau QC K1A 1K8 819-994-3741 1-800-387-3557 www.tsb.gc.ca [email protected]
© Her Majesty the Queen in Right of Canada, as represented by the Transportation Safety Board of Canada, 2019
Statistical summary: mode transportation occurrences in 2018
Cat. No. TU1-19E-PDF ISSN 2562-671X
This document is available on the website of the Transportation Safety Board of Canada at www.tsb.gc.ca
Le présent rapport est également disponible en français.

Table of contents
The pipeline system ........................................................................................................... 2
Pipeline transportation occurrences ............................................................................ 3
Release of product ..................................................................................................................................... 3 Event type ...................................................................................................................................................... 4 Geography ..................................................................................................................................................... 4 Facilities .......................................................................................................................................................... 5 Pipeline occurrence rate .......................................................................................................................... 6
Data tables ............................................................................................................................ 8
Definitions .......................................................................................................................... 15
Before 1 July 2014 ....................................................................................................................................15 As of 1 July 2014 .......................................................................................................................................16


Statistical Summary: Pipeline Transportation Occurrences in 2018 1
Statistical Summary Pipeline Transportation Occurrences in 2018
This document is a summary of selected 2018 pipeline transportation safety data. It covers federally regulated pipelines only. Any non-federally regulated pipeline data reported to the Transportation Safety Board of Canada (TSB) are not included in this report.
The TSB gathers and uses this data during the course of its investigations to analyze safety deficiencies and identify risks in the Canadian transportation system.
It should be noted that certain characteristics of the data constrain statistical analysis and identification of emerging trends. These include the small totals of accidents and incidents, the large variability in the data from year to year, and changes to regulations and definitions. The reader is cautioned to keep these limitations in mind when viewing this summary to avoid drawing conclusions that cannot be supported by statistical analysis.
The 2018 data were collected according to the reporting requirements described in the TSB Regulations in force during that calendar year. 1
The statistics presented here reflect the TSB PODS database at 13 March 2019. Since the occurrence data are constantly being updated in the live database as additional information becomes available, the statistics may change slightly over time.
Also, as many occurrences are not formally investigated, information regarding some of the reported occurrences recorded in the database may not have been verified by the TSB.
1 On 12 December 2018, amendments to the Transportation Safety Board of Canada (TSB) Regulations were
published in Part II of the Canada Gazette. The amendments were made to reorganize and update some of the pipeline occurrence reporting provisions to ensure consistency and clarity. In addition, minor discrepancies between the English and French texts were addressed.

2 Statistical Summary: Pipeline Transportation Occurrences in 2018
The pipeline system In 2018, in the federally-regulated pipeline system, 40 companies transported 220 million cubic metres2 of oil through approximately 17 500 km of oil pipelines (including 19 companies that transported both oil and gas). Also in 2018, 83 companies transported over 185 billion cubic metres of gas through approximately 51 900 km of gas pipelines (including 19 companies that transported both oil and gas). A further 1110 km of pipelines carried other commodities and substances. Altogether, this represents approximately 17.4 exajoules (EJ) of energy content transported.3
2 One cubic metre (m3) is equivalent to 1000 litres. 3 The size of the federally regulated pipeline system, the number of companies, and the volumes of product
transported were provided by the National Energy Board (NEB).
Statistical Summary: Pipeline Transportation Occurrences in 2018 3
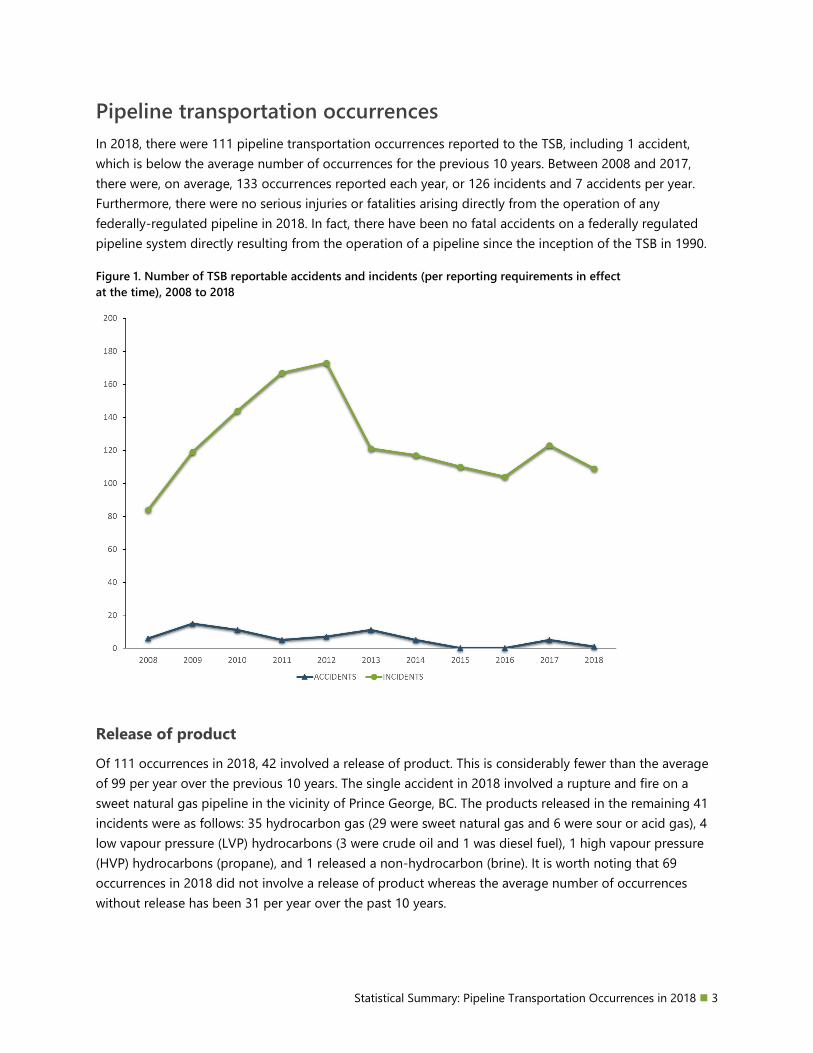
Pipeline transportation occurrences In 2018, there were 111 pipeline transportation occurrences reported to the TSB, including 1 accident, which is below the average number of occurrences for the previous 10 years. Between 2008 and 2017, there were, on average, 133 occurrences reported each year, or 126 incidents and 7 accidents per year. Furthermore, there were no serious injuries or fatalities arising directly from the operation of any federally-regulated pipeline in 2018. In fact, there have been no fatal accidents on a federally regulated pipeline system directly resulting from the operation of a pipeline since the inception of the TSB in 1990.
Figure 1. Number of TSB reportable accidents and incidents (per reporting requirements in effect at the time), 2008 to 2018
Release of product
Of 111 occurrences in 2018, 42 involved a release of product. This is considerably fewer than the average of 99 per year over the previous 10 years. The single accident in 2018 involved a rupture and fire on a sweet natural gas pipeline in the vicinity of Prince George, BC. The products released in the remaining 41 incidents were as follows: 35 hydrocarbon gas (29 were sweet natural gas and 6 were sour or acid gas), 4 low vapour pressure (LVP) hydrocarbons (3 were crude oil and 1 was diesel fuel), 1 high vapour pressure (HVP) hydrocarbons (propane), and 1 released a non-hydrocarbon (brine). It is worth noting that 69 occurrences in 2018 did not involve a release of product whereas the average number of occurrences without release has been 31 per year over the past 10 years.

4 Statistical Summary: Pipeline Transportation Occurrences in 2018
Figure 2. Occurrences with and without release of product, by type of product released, 2018
Event type
In 2018, 44 incidents (40% of 110 total incidents) involved “geotechnical, hydrotechnical or other environmental activity”, for example, slope movements or river erosion that exposed a length of pipe. This is a significant increase from 16 reports of this type in 2017 and well above the average of 3 such events per year over the previous 10 years. These may be related to increased company enforcement, combined with increased company inspections and reporting, as well as changes to weather patterns. Thirteen of the 110 incidents involved “operation of the pipeline beyond specified limits”, which is on par with the average of 14 incidents of this type over the previous 10 years. There were 9 reports of pipelines being “contacted by other objects” in 2018, an increase over 4 such reports in 2017 and above the average of 5 reports per year during the previous 10 years. “Fire” was an event in 5 occurrences (4 incidents and 1 accident) during 2018, compared to 8 occurrences in 2017, and the average of 9 such occurrences during the previous 10 years.
Geography
The largest number of occurrences in 2018 (48 of 111) took place in British Columbia. Alberta had 31 occurrences and Ontario had 20. The remaining 12 occurrences were distributed across five provinces:

Statistical Summary: Pipeline Transportation Occurrences in 2018 5
Nova Scotia (2), New Brunswick (2), Quebec (1), Manitoba (3), and Saskatchewan (4). Looking closely at occurrences where product was released, the mix of products released varied geographically in Canada.
During the 11 years from 2008 to 2018, there have been 1060 occurrences across the country with releases of product. Half of those releases (527) were of hydrocarbon gas. Almost all product releases in New Brunswick (96%) and Nova Scotia (95%) involved hydrocarbon gases. Ontario (69%), Alberta (55%), and British Columbia (54%) had a broader mix of products released, but still a majority of releases were of gas. LVP hydrocarbons such as crude oil, condensate, or refined products were the next most commonly released substances, accounting for 35% of the 1060 total occurrences. LVP products accounted for 70% of occurrences with release in Saskatchewan, 66% in the Northwest Territories, 60% in Quebec, and 58% in Manitoba. HVP hydrocarbons accounted for less than 5% of all product releases over the 11-year period, and other (non-hydrocarbon) products such as sulphur or other products were involved in about 10% of all occurrences with releases during the period.
Figure 3. Occurrences with release of product, by province and type of product released, 2008 to 2018
Facilities
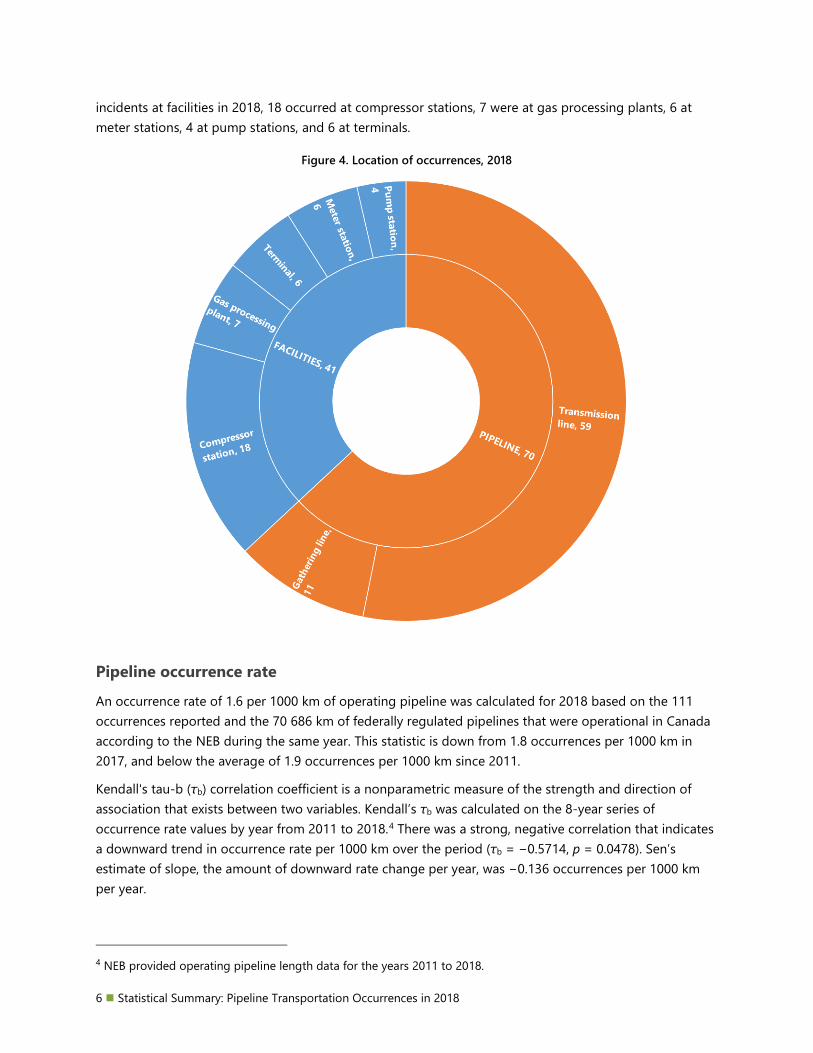
During the 10-year period from 2008 to 2017, there were 937 occurrences (71%) at facilities and 389 (29%) at locations along pipeline. However, in 2018 more than half (62%) of the occurrences (69 of 110) occurred at locations along pipeline. This is due in part to the high number of reports of geotechnical, hydrotechnical or other environmental activity that affected sections of pipeline during the year. Of the 41
6 Statistical Summary: Pipeline Transportation Occurrences in 2018
incidents at facilities in 2018, 18 occurred at compressor stations, 7 were at gas processing plants, 6 at meter stations, 4 at pump stations, and 6 at terminals.
Figure 4. Location of occurrences, 2018
Pipeline occurrence rate
An occurrence rate of 1.6 per 1000 km of operating pipeline was calculated for 2018 based on the 111 occurrences reported and the 70 686 km of federally regulated pipelines that were operational in Canada according to the NEB during the same year. This statistic is down from 1.8 occurrences per 1000 km in 2017, and below the average of 1.9 occurrences per 1000 km since 2011.
Kendall's tau-b (τb) correlation coefficient is a nonparametric measure of the strength and direction of association that exists between two variables. Kendall’s τb was calculated on the 8-year series of occurrence rate values by year from 2011 to 2018.4 There was a strong, negative correlation that indicates a downward trend in occurrence rate per 1000 km over the period (τb = −0.5714, p = 0.0478). Sen’s estimate of slope, the amount of downward rate change per year, was −0.136 occurrences per 1000 km per year.
4 NEB provided operating pipeline length data for the years 2011 to 2018.

Statistical Summary: Pipeline Transportation Occurrences in 2018 7
An alternative occurrence rate can be calculated using exajoules (EJ) of energy as a denominator. In 2018, the equivalent of 17.4 EJ of energy was transported in federally regulated pipelines. This translates to a rate of 6.4 occurrences per EJ in 2018, a figure which is below the 2017 rate of 7.5, and 33% below the prior 10-year average of 9.6 occurrences per EJ.
Figure 6. Number of TSB reportable occurrences (per reporting requirements in effect at the time) and occurrence rates, 2008 to 2018
Figure 5. Occurrence rate by year, with Sen’s estimate of slope, 2011 to 2018

8 Statistical Summary: Pipeline Transportation Occurrences in 2018
Data tables
Table 1
Pipeline occurrences by event type 2008-2018 2008 2009 2010 2011 2012 2013 2014 2015 2016 2017 2018
Total number of occurrences 90 134 155 172 180 132 122 110 104 127 111 Total number of occurrences with product release 72 103 135 149 156 107 94 60 41 75 42 Total number of fatalities 0 0 0 0 0 0 0 0 0 0 0 Total number of serious injuries 0 1 0 0 2 0 0 0 0 1 0
Accidents 6 15 11 5 7 11 5 0 0 5 1
Product released 3 9 8 4 3 7 2 0 0 4 1 Release of hydrocarbon gas 0 6 3 2 3 5 2 0 0 0 1 Release of HVP hydrocarbons1 1 0 0 0 0 0 0 0 0 1 0 Release of LVP hydrocarbons2, 3 1 2 4 2 0 2 0 0 0 2 0 Release of other product 1 1 1 0 0 0 0 0 0 1 0
Release from line pipe body 0 6 0 2 1 2 2 0 0 1 1 Fire 4 11 6 3 6 8 4 0 0 1 1 Explosion 0 2 0 1 1 1 1 0 0 0 1 Rupture 0 4 0 1 1 2 2 0 0 0 1 Pipeline contacted by an object 0 1 1 1 1 1 0 0 0 2 0 Operation beyond limits 0 0 0 0 0 0 0 0 0 0 0 Geotechnical/Hydrotechnical/Environmental
activity 0 0 0 0 0 0 0 0 0 0 0
Incidents 84 119 144 167 173 121 117 110 104 122 110
Product released 69 94 127 145 153 100 92 60 41 71 41 Release of hydrocarbon gas 28 42 56 59 67 47 31 31 35 47 35 Release of HVP hydrocarbons1 1 1 2 5 2 5 7 8 4 10 1 Release of LVP hydrocarbons2, 3 30 35 60 72 78 35 36 4 1 3 4 Release of other product 10 16 9 9 6 13 18 17 1 11 1
Release from line pipe body 3 3 5 8 2 8 3 6 5 2 8 Fire 5 0 2 10 6 1 2 6 5 7 4 Explosion 0 1 1 0 0 0 0 1 0 1 1 Pipeline contacted by an object 6 10 2 1 4 3 6 7 7 4 9 Operation beyond limits 4 5 13 5 6 15 7 27 34 20 13 Geotechnical/Hydrotechnical/Environmental
activity 0 2 0 0 1 2 1 0 3 16 44 Unauthorized third-party activity affects
pipeline structural integrity 1 2 0 0 0 0 0 4 4 0 0
Data extracted 13 March 2019 Notes: 1 HVP means high vapour pressure as defined in Canadian Standards Association Standard Z662. 2 LVP means low vapour pressure as defined in Canadian Standards Association Standard Z662. 3 As of July 2014, the minimum reporting threshold for releases of low vapour pressure hydrocarbons was established at 1.5 m3. Transportation Safety Board of Canada

Statistical Summary: Pipeline Transportation Occurrences in 2018 9
Table 2
Pipeline occurrences by province or territory
2008-2018
2008 2009 2010 2011 2012 2013 2014 2015 2016 2017 2018
Accidents 6 15 11 5 7 11 5 0 0 5 1 Newfoundland and
Labrador 0 0 0 0 0 0 0 0 0 0 0 Prince Edward Island 0 0 0 0 0 0 0 0 0 0 0 Nova Scotia 0 0 0 0 0 0 0 0 0 0 0 New Brunswick 0 0 0 0 0 0 0 0 0 0 0 Quebec 0 0 0 0 0 0 0 0 0 0 0 Ontario 1 5 2 2 2 2 0 0 0 1 0 Manitoba 1 0 1 0 0 0 1 0 0 0 0 Saskatchewan 0 2 1 1 1 1 0 0 0 1 0 Alberta 0 4 4 1 2 6 2 0 0 2 0 British Columbia 4 4 3 0 2 2 1 0 0 1 1 Yukon 0 0 0 0 0 0 0 0 0 0 0 Northwest Territories 0 0 0 1 0 0 1 0 0 0 0 Nunavut 0 0 0 0 0 0 0 0 0 0 0
Incidents 84 119 144 167 173 121 117 110 104 122 110 Newfoundland and
Labrador 0 0 0 0 0 0 0 0 0 0 0 Prince Edward Island 0 0 0 0 0 0 0 0 0 0 0 Nova Scotia 1 0 1 5 2 3 2 3 3 0 2 New Brunswick 0 5 6 14 19 16 9 3 6 4 2 Quebec 2 4 2 2 1 3 1 8 7 4 1 Ontario 17 21 19 22 22 11 18 19 18 14 20 Manitoba 10 9 14 11 10 12 8 9 2 3 3 Saskatchewan 17 13 38 35 45 18 17 6 6 11 4 Alberta 16 36 50 55 45 35 35 30 37 36 31 British Columbia 19 26 13 11 18 17 27 30 24 50 47 Yukon 0 0 0 0 0 0 0 0 0 0 0 Northwest Territories 2 5 1 12 11 6 0 2 1 0 0 Nunavut 0 0 0 0 0 0 0 0 0 0 0
Total Occurrences 90 134 155 172 180 132 122 110 104 127 111
Data extracted 13 March 2019 Transportation Safety Board of Canada
10 Statistical Summary: Pipeline Transportation Occurrences in 2018
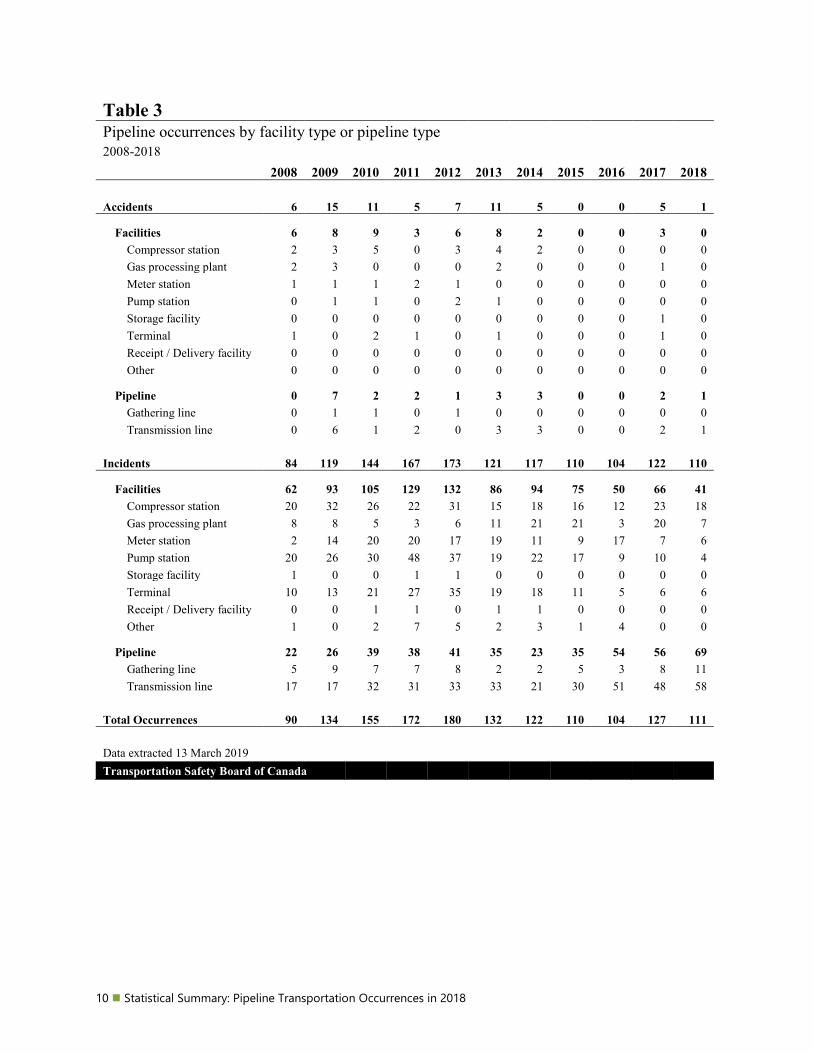
Table 3
Pipeline occurrences by facility type or pipeline type
2008-2018
2008 2009 2010 2011 2012 2013 2014 2015 2016 2017 2018
Accidents 6 15 11 5 7 11 5 0 0 5 1
Facilities 6 8 9 3 6 8 2 0 0 3 0 Compressor station 2 3 5 0 3 4 2 0 0 0 0 Gas processing plant 2 3 0 0 0 2 0 0 0 1 0 Meter station 1 1 1 2 1 0 0 0 0 0 0 Pump station 0 1 1 0 2 1 0 0 0 0 0 Storage facility 0 0 0 0 0 0 0 0 0 1 0 Terminal 1 0 2 1 0 1 0 0 0 1 0 Receipt / Delivery facility 0 0 0 0 0 0 0 0 0 0 0 Other 0 0 0 0 0 0 0 0 0 0 0
Pipeline 0 7 2 2 1 3 3 0 0 2 1 Gathering line 0 1 1 0 1 0 0 0 0 0 0 Transmission line 0 6 1 2 0 3 3 0 0 2 1
Incidents 84 119 144 167 173 121 117 110 104 122 110
Facilities 62 93 105 129 132 86 94 75 50 66 41 Compressor station 20 32 26 22 31 15 18 16 12 23 18 Gas processing plant 8 8 5 3 6 11 21 21 3 20 7 Meter station 2 14 20 20 17 19 11 9 17 7 6 Pump station 20 26 30 48 37 19 22 17 9 10 4 Storage facility 1 0 0 1 1 0 0 0 0 0 0 Terminal 10 13 21 27 35 19 18 11 5 6 6 Receipt / Delivery facility 0 0 1 1 0 1 1 0 0 0 0 Other 1 0 2 7 5 2 3 1 4 0 0
Pipeline 22 26 39 38 41 35 23 35 54 56 69 Gathering line 5 9 7 7 8 2 2 5 3 8 11 Transmission line 17 17 32 31 33 33 21 30 51 48 58
Total Occurrences 90 134 155 172 180 132 122 110 104 127 111
Data extracted 13 March 2019 Transportation Safety Board of Canada

Statistical Summary: Pipeline Transportation Occurrences in 2018 11
Table 4
Pipeline occurrence rates
2008-2018
2008 2009 2010 2011 2012 2013 2014 2015 2016 2017 2018
Accidents 6 15 11 5 7 11 5 0 0 5 1 Incidents 84 119 144 167 173 121 117 110 104 122 110 Total number of occurrences 90 134 155 172 180 132 122 110 104 127 111
Total length of operating pipelines1 (x1000 km) 68.7 69.7 70.8 70.7 70.8 71.0 70.7 70.6 Accidents per 1000 km of operating pipelines 0.1 0.1 0.2 0.1 0.0 0.0 0.1 0.0 Incidents per 1000 km of operating pipelines 2.4 2.5 1.7 1.7 1.6 1.5 1.7 1.6 Occurrences per 1000 km of operating pipelines 2.5 2.6 1.9 1.7 1.6 1.5 1.8 1.6 Total exajoules of energy transported1 (EJ) 12.5 12.4 12.4 13.1 13.4 14.0 15.0 15.6 16.1 16.8 17.4 Accidents per EJ 0.5 1.2 0.9 0.4 0.5 0.8 0.3 0.0 0.0 0.3 0.1 Incidents per EJ 6.7 9.6 11.6 12.8 12.9 8.6 7.8 7.0 6.5 7.2 6.3 Occurrences per EJ 7.2 10.8 12.5 13.2 13.4 9.4 8.1 7.0 6.5 7.5 6.4
Data extracted 13 March 2019 Notes: 1 Source: National Energy Board (NEB) Transportation Safety Board of Canada

12 Statistical Summary: Pipeline Transportation Occurrences in 2018
Table 5
Pipeline occurrences with product release by type of product
2008-2018
2008
2009
2010
2011
2012
2013
2014
2015
2016
2017
2018
Hydrocarbon gas 28 48 59 61 70 52 33 31 35 47 36 Gas - sour or acid 2 8 2 3 5 3 3 10 2 7 6 Natural gas 26 40 57 58 65 49 30 21 33 40 30
HVP hydrocarbons 2 1 2 5 2 5 7 8 4 11 1 Natural gas liquids / Liquefied
petroleum gas 2 1 2 5 2 5 7 8 4 11 1
LVP hydrocarbons1 31 37 64 74 78 37 36 4 1 5 4 Condensate 1 1 2 0 0 3 4 0 0 1 0 Condensate - sour 0 0 0 0 0 0 0 0 0 0 0 Crude oil 29 33 58 74 77 33 32 3 1 4 3 Crude oil - sour 0 0 0 0 0 1 0 1 0 0 0 Refined products 1 3 4 0 1 0 0 0 0 0 1
Other products2 11 17 10 9 6 13 18 17 1 12 1 Other - unspecified 11 17 10 9 6 13 18 16 1 0 0 Other - gas 0 0 0 0 0 0 0 1 0 1 0 Other - liquid 0 0 0 0 0 0 0 0 0 11 1
Total Occurrences 72 103 135 149 156 107 94 60 41 75 42
Data extracted 13 March 2019 Notes: 1 As of July 2014, the minimum reporting threshold for releases of low vapour pressure hydrocarbons was established at 1.5 m3. 2 As of January 2017, "other products" are specified to be either liquid or gas. Transportation Safety Board of Canada

Statistical Summary: Pipeline Transportation Occurrences in 2018 13
Table 6
Pipeline occurrences with product release by quantity released
2008-2018
2008 2009 2010 2011 2012 2013 2014 2015 2016 2017 2018
Hydrocarbon gas 28 48 59 61 70 52 33 31 35 47 36 100 m3 or less 27 45 59 54 69 48 26 20 24 21 20 101 to 30,000 m3 1 0 0 5 0 3 5 7 10 24 14 30,001 to 100,000 m3 0 1 0 0 0 0 0 3 1 1 0 100,001 to 1,000,000 m3 0 0 0 1 1 0 1 0 0 1 2 1,000,001 to 10,000,000
m3 0 2 0 1 0 0 1 1 0 0 0 Greater than 10,000,000
m3 0 0 0 0 0 1 0 0 0 0 0
HVP hydrocarbons 2 1 2 5 2 5 7 8 4 11 1 8 m3 or less 2 1 2 4 2 5 7 8 4 10 1 9 to 25 m3 0 0 0 0 0 0 0 0 0 1 0 26 to 100 m3 0 0 0 1 0 0 0 0 0 0 0 101 to 1000 m3 0 0 0 0 0 0 0 0 0 0 0 1001 to 10,000 m3 0 0 0 0 0 0 0 0 0 0 0 Greater than 10,000 m3 0 0 0 0 0 0 0 0 0 0 0
LVP hydrocarbons1 31 37 64 74 78 37 36 4 1 5 4 1.5 m3 or less 23 30 60 67 76 34 29 0 0 0 2 1.6 to 8 m3 5 5 0 6 1 2 4 2 1 1 2 9 to 25 m3 2 0 2 0 0 1 2 1 0 2 0 26 to 100 m3 1 0 1 0 1 0 0 1 0 1 0 101 to 1000 m3 0 2 1 1 0 0 1 0 0 0 0 1001 to 10,000 m3 0 0 0 0 0 0 0 0 0 1 0 Greater than 10,000 m3 0 0 0 0 0 0 0 0 0 0 0
Other products 11 17 10 9 6 13 18 17 1 12 1 8 m3 or less 10 17 9 9 6 13 15 14 0 12 0 9 to 25 m3 1 0 0 0 0 0 2 2 0 0 0 26 to 100 m3 0 0 1 0 0 0 1 0 0 0 0 101 to 1000 m3 0 0 0 0 0 0 0 1 1 0 1 1001 to 10,000 m3 0 0 0 0 0 0 0 0 0 0 0 Greater than 10,000 m3 0 0 0 0 0 0 0 0 0 0 0
Total Occurrences 72 103 135 149 156 107 94 60 41 75 42
Data extracted 13 March 2019 Notes: 1 As of July 2014, the minimum reporting threshold for releases of low vapour pressure hydrocarbons was established at 1.5 m3. Transportation Safety Board of Canada

14 Statistical Summary: Pipeline Transportation Occurrences in 2018
Table 7
Pipeline occurrences by province or territory and type of product released
2008-2018
No release of
product
Release of hydrocarbon
gas Release of HVP hydrocarbons
Release of LVP hydrocarbons1
Release of other product
Province or territory
2008-2017
average 2018
2008-2017
average 2018
2008-2017
average 2018
2008-2017
average 2018
2008-2017
average 2018 Newfoundland and
Labrador 0.0 0 0.0 0 0.0 0 0.0 0 0.0 0 Prince Edward
Island 0.0 0 0.0 0 0.0 0
0.0 0 0.0 0
Nova Scotia 0.1 1 1.5 1 0.0 0
0.0 0 0.1 0
New Brunswick 0.0 0 7.6 2 0.0 0 0.0 0 0.3 0
Quebec 2.4 1 0.4 0 0.0 0 0.6 0 0.0 0
Ontario 6.5 14 8.0 5 0.4 0 3.1 0 0.7 1
Manitoba 1.4 1 2.2 1 0.5 1 4.6 0 0.4 0
Saskatchewan 2.2 2 3.2 0 2.0 0 13.3 2 0.5 0
Alberta 12.1 18 13.7 12 0.8 0 11.8 1 0.3 0
British Columbia 5.6 32 9.7 15 0.6 0 0.8 1 8.3 0
Yukon 0.0 0 0.0 0 0.0 0 0.0 0 0.0 0
Northwest Territories 0.4 0 0.1 0 0.4 0 2.5 0 0.8 0
Nunavut 0.0 0 0.0 0 0.0 0 0.0 0 0.0 0
Total Occurrences 30.7 69 46.4 36 4.7 1 36.7 4 11.4 1
Data extracted 13 March 2019
Notes: 1 As of July 2014, the minimum reporting threshold for releases of low vapour pressure hydrocarbons was established at 1.5 m3.
Transportation Safety Board of Canada

Statistical Summary: Pipeline Transportation Occurrences in 2018 15
Definitions
Before 1 July 2014
Before 1 July 2014 (under the previous TSB Regulations), pipeline transportation accidents and incidents were defined as follows:
Pipeline accidents
Reportable commodity pipeline accident means an accident resulting directly from the operation of a commodity pipeline, where
1. a person sustains a serious injury or is killed as a result of being exposed to
i. a fire, ignition or explosion, or
ii. a commodity released from the commodity pipeline, or
2. the commodity pipeline
i. sustains damage affecting the safe operation of the commodity pipeline as a
result of being contacted by another object or as a result of a disturbance of its
supporting environment,
ii. causes or sustains an explosion, or a fire or ignition that is not associated with
normal operationg circumstances, or
iii. sustains damage resulting in the release of any commodity.
Pipeline incidents
Reportable commodity pipeline incident means an incident resulting directly from the operation of a commodity pipeline, where
a) an uncontained and uncontrolled release of a commodity occurs,
b) the commodity pipeline is operated beyond design limits,
c) the commodity pipeline causes an obstruction to a ship or to a surface vehicle owing
to a disturbance of its supporting environment,
d) any abnormality reduces the structural integrity of the commodity pipeline below
design limits,
e) any activity in the immediate vicinity of the commodity pipeline poses a threat to the
structural integrity of the commodity pipeline, or

16 Statistical Summary: Pipeline Transportation Occurrences in 2018
f) the commodity pipeline, or a portion thereof, sustains a precautionary or emergency
shut-down for reasons that relate to or create a hazard to the safe transportation of a
commodity;
As of 1 July 2014
On 1 July 2014, new reporting provisions of the TSB Regulations came into effect. According to section 4(1) of the TSB Regulations, the operator of a pipeline must report the following pipeline occurrences to the Board if they result directly from the operation of the pipeline:
4 (1) The operator of a pipeline must report the following pipeline occurrences to the Board if they result directly from the operation of the pipeline:
a) a person is killed or sustains a serious injury;
b) the safe operation of the pipeline is affected by
i) damage sustained when another object came into contact with it, or
ii) a fire or explosion or an ignition that is not associated with normal pipeline
operations;
c) an event or an operational malfunction results in
i) an unintended or uncontrolled release of gas,
ii) an unintended or uncontrolled release of HVP hydrocarbons,
iii) an unintended or uncontained release of LVP hydrocarbons in excess of
1.5 m3, or
iv) an unintended or uncontrolled release of a commodity other than gas, HVP
hydrocarbons or LVP hydrocarbons;
d) there is a release of a commodity from the line pipe body;
e) the pipeline is operated beyond design limits or any operating restrictions
imposed by the National Energy Board;
f) the pipeline restricts the safe operation of any mode of transportation;
g) an unauthorized third party activity within the safety zone poses a threat to the
safe operation of the pipeline;
h) a geotechnical, hydraulic or environmental activity poses a threat to the safe
operation of the pipeline;
i) the operation of a portion of the pipeline is interrupted as a result of a situation
or condition that poses a threat to any person, property or the environment; or

Statistical Summary: Pipeline Transportation Occurrences in 2018 17
j) an unintended fire or explosion has occurred that poses a threat to any person,
property or the environment.
Pipeline accidents
As of 1 July 2014, pipeline accidents consist of reportable pipeline occurrences that resulted in
a) loss of human life;
b) a serious injury;5
c) a fire or explosion that causes a pipeline or facility to be inoperative;
d) a low vapour pressure hydrocarbon release in excess of 1.5 m³ that leaves company property or the right-of-way;
e) a rupture;6 or
f) a toxic plume.7
Pipeline incidents
As of 1 July 2014, pipeline incidents consist of all reportable pipeline occurrences other than pipeline accidents.
5 As of December 12, 2018, the definition of “serious injury” sustained as a result of a pipeline
occurrence is harmonized with the National Energy Board’s Onshore Pipeline Regulations. 6 An instantaneous release that immediately impairs the operation of a pipeline such that
pressure cannot be maintained. 7 As defined in Canadian Standards Association Standard Z662.


![Cost of pipeline transportation [autosaved]](https://static.fdocuments.net/doc/165x107/54677733af79599b108b551f/cost-of-pipeline-transportation-autosaved.jpg)