Statistical Brief
8
Statistical Brief Supply, Distribution, and Demographic Characteristics of Psychiatrists in Nebraska 2010-2016 Shinobu Watanabe-Galloway, Zaeema Naveed, Caleb Adejoh, Marlene Deras, and Ellana Haakenstad October 2017 Statistical Brief — Psychiatrists
Transcript of Statistical Brief

Statistical Brief Supply, Distribution, and Demographic
Characteristics of Psychiatrists in Nebraska 2010-2016
Shinobu Watanabe-Galloway, Zaeema Naveed, Caleb Adejoh, Marlene Deras, and Ellana Haakenstad
October 2017
Statistical Brief — Psychiatrists

Statistical Brief — Psychiatrists
Aim:To examine the geographic distribution and demographic characteristics of psychiatrists actively practicing in Nebraska between 2010 and 2016.
Definitions:Psychiatrists included in this report are those individuals board-certified by the American Osteopathic Board of Neurology and Psychiatry, by the American Osteopathic Board of Neurology and Psychiatry and board-eligible (i.e., have successfully completed an accredited program of graduate medical or osteopathic education in psychiatry or child psychiatry), or are an allopathic or osteopathic physician specialized in psychiatry. Residents and house officers were excluded from the analysis. An “actively participating” provider is one who is currently (at the time of data collection) practicing in and providing behavioral health services to the people of Nebraska.
Data Source:This study used the University of Nebraska Medical Center, College of Public Health, and Health Professions Tracking Service (HPTS) database for the span of 2010-2016.
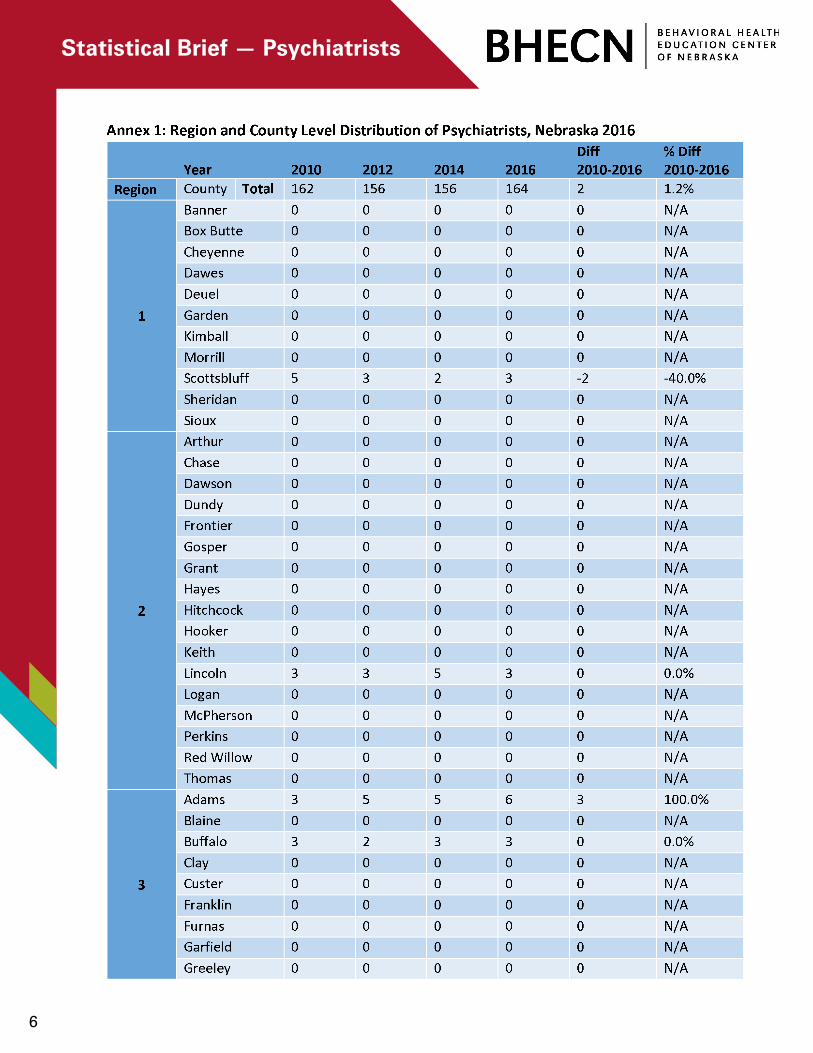
Supply Trend by Region:As shown in Table 1, during the period between 2010 and 2016, the total number of psychiatrists actively practicing in Nebraska increased from 162 to 164 (1.2% increase). During this time period, the number of psychiatrists increased in Region 6, Regions 2 and 5 had nochange, and the number of psychiatrists decreased in Regions 1, 3, and 4.
2
Table 1. Supply of Psychiatrists Actively Practicing in Nebraska: 2010-2016

Statistical Brief — Psychiatrists
Figure 1.Supply of Psychiatrists by Geographic Location per 100,000 Population, Nebraska 2000-2016
Figure 2. Age Distribution of Psychiatrists, Nebraska 2014 vs. 2016
Figure 3. Gender Distribution of Psychiatrists, Nebraska 2014 vs. 2016
3
The Number of Providers per 100,000 Residents (Figure 1):
According to the 2016 Health Resources and Services Administration report, there were 14.8 psychiatrists per 100,000 residents in the US in 2013. In Nebraska’s urban counties, during the period 2010-2016, the number of psychiatrists increased from 12.3 to 12.7 per 100,000 residents. In rural counties, the number of psychiatrists decreased from 4.0 to 2.9 per 100,000 residents.
Age Distribution (Figure 2):
The aging behavioral health workforce is an issue in Nebraska and in the US overall. In 2016, 70% of the psychiatrists in Nebraska were older than 45 years of age, with the highest percentage (28%) of psychiatrists being in the age group 46-55. This is a slight decrease from 2014, when about 76% of psychiatrists were older than 45 years of age.
Gender Distribution (Figure 3):
In 2016, of the 164 actively practicing psychiatrists, nearly two-thirds (60%) were male. In 2014, 62% of psychiatrists were male.

Statistical Brief — Psychiatrists
Figure 4. Race and Ethnicity Distribution of Psychiatrists, Nebraska 2014 vs. 2016
Figure 5. Age Distribution of Patients Seen by Psychiatrists, Nebraska 2014 vs. 2016
Figure 6. Psychiatrist Language Service Use, Nebraska 2016
4
Race and Ethnicity Distribution (Figure 4):
In 2016, the majority of psychiatrists identified themselves as white (58%) or or Asian (19%). This is similar to 2014 (63% white, 16% Asian).
Patient Age (Figure 5):
The HPTS survey asked providers to indicate the age group(s) of patients they see. Eighty-one psychiatrists reported that they see young adults (19-25) and 74 reported that they see adults aged 26-64. Forty-two psychiatrists reported they saw adolescents (13-18). The distribution was similar in 2014. Note that providers can choose more than one age category.
Language Services (Figure 6):
In 2016, 28% of psychiatrists reported serving patients who spoke languages other than English. Of these, 51% served Spanish speaking clients. The HPTS survey also asks whether the provider speaks the language (“self-interpreter”) or uses phone or in-person interpreters. The majority of these providers only speak English so in-person and phone translators are used the most frequently.
Providers can indicate more than one age category
Providers can indicate more than one mode

Statistical Brief — Psychiatrists
5
Primary and Satellite Locations of Psychiatrists:
Statistical Brief — Psychiatrists
6

Statistical Brief — Psychiatrists
7

Statistical Brief — Psychiatrists
8