State Route 710 Study - California Department of ... · 1/14/2013 · State Route 710 Study...
26
State Route 710 Study Alternatives Analysis Report December 2012
Transcript of State Route 710 Study - California Department of ... · 1/14/2013 · State Route 710 Study...

State Route 710 Study
Alternatives Analysis Report
December 2012

Alternatives Analysis Report Executive Summary
ES.1.0 Need and Purpose
ES.1.1 Background and History
The SR 710 Study is the culmination of a long history of efforts to address north-south mobility in the western San Gabriel Valley and east and northeast Los Angeles. The history of the planning efforts dates back to 1933 when Legislative Route 167, later renamed SR 7, was defined to run from San Pedro east to Long Beach and north to the vicinity of Monterey Park. The majority of this route has been constructed and incorporated into the Interstate Highway System as Interstate 710 (I-710). In 1959, the proposed northern limits of SR 7 were extended to the planned Foothill Freeway (now I-210). Over the years, planning efforts continued to address community and agency concerns, eventually leading to the issuance of a Record of Decision (ROD) in 1998 by the Federal Highway Administration (FHWA) for a surface freeway. After litigation initiated by some of the affected communities, FHWA rescinded the ROD in 2003, citing changes in project circumstances such as funding uncertainty and the opening of the Metro Gold line to Pasadena, and requiring a more thorough evaluation of the feasibility of a bored tunnel.
In 2006, Metro and Caltrans conducted two tunnel feasibility assessments, the Route 710 Tunnel Technical Feasibility Assessment Report and the SR-710 Tunnel Technical Study, to evaluate the feasibility of constructing a tunnel to complete the planned SR 710 freeway route that would lessen the potential impacts associated with a surface route. The studies found that a tunnel would be a viable solution and would warrant more detailed evaluation. In November 2008, Measure R (a half-cent sales tax dedicated to transportation projects in Los Angeles County) was approved by a two-thirds majority of County voters. Included in the Measure R plan is the commitment of $780 million to improve the connection between the SR 710 and I-210 freeways.
In March 2011, Caltrans published a Notice of Intent (NOI) under the National Environmental Policy Act (NEPA) and a Notice of Preparation (NOP) under the California Environmental Quality Act (CEQA) to initiate the environmental review process for the “Interstate 710 North Gap Closure” project. The environmental review process began with the “SR-710 Conversations” outreach effort, led by Metro, including 21 pre-scoping and scoping meetings throughout the study area in March and April of 2011. Metro also initiated the “State Route 710 Gap Closure Transit Profile Study” to gather transit service and patronage data and to assess current and future transit travel markets within the study area.
ES.1.2 Study Area
The study area is approximately 100 square miles and is generally bounded by the I-210 freeway on the north, the I-605 freeway on the east, the I-10 freeway on the south, and the I-5 and SR 2 freeways on the west. The study area is illustrated in Figure ES-1. According to data from the Southern California Association of Governments (SCAG), the study area had a population of 1.18 million people in 2008, and 450,000 jobs were located in the study area. By 2035, the study area is forecast to have a population of 1.33 million people and an employment base of 507,000 jobs.
ES.1.3 Need
The study area is centrally located within the extended urbanized area of Southern California. With few exceptions, the area from Santa Clarita in the north to San Clemente in the south, a distance of approximately 90 miles, is continuously urbanized. Physical features such as the San Gabriel Mountains and Angeles National Forest on the north, and the Puente Hills and Cleveland National
SR 710 Study December 2012 Page ES-1

Alternatives Analysis Report Executive Summary
Figure ES-1. Study Area
SR 710 Study December 2012 Page ES-2

Alternatives Analysis Report Executive Summary
Forest on the south, have concentrated urban activity between the Pacific Ocean and these physical constraints. This urbanized area functions as a single social and economic region, identified by the Census Bureau as the Los Angeles-Long Beach-Santa Ana metropolitan statistical area (MSA).
There are seven major east-west freeway routes (SR 118, US-101/SR 134/I-210, I-10, SR 60, I-105, SR 91, SR 22) and seven major north-south freeway routes (I-405, US-101/US-170, I-5, I-110/SR 110, I-710, I-605, and SR 57) in the central portion of the Los Angeles-Long Beach-Santa Ana MSA. Of the seven north-south routes, four of them are located partially within the study area (I-5, I-110/SR 110, I710, and I-605), and two of these (I-110/SR 110 and I-710) terminate within the study area without connecting to another freeway. As a result, a very large amount of north-south regional travel demand is concentrated on a few freeways, or diverted to local streets within the study area. This effect is exacerbated by the overall southwest-to-northeast orientation of I-605, which makes it an unappealing route for traffic between the southern part of the region and the urbanized areas to the northwest in the San Fernando Valley, the Santa Clarita Valley, and the Arroyo-Verdugo region.
The lack of continuous north-south transportation facilities in the study area has the following consequences, which have been identified as the elements of need for the project:
• It degrades the overall efficiency of the larger regional transportation system. • It causes congestion on freeways in the study area. • It contributes to congestion on the local streets in the study area. • It results in poor transit operations within the study area.
ES.1.4 Purpose
Based on the needs discussed above related to the regional transportation system, congestion on freeways in the study area, cut-through traffic that affects local streets in the study area, and poor transit operations within the study area, the following project purpose has been established:
The purpose of the proposed action is to effectively and efficiently accommodate regional and local north-south travel demands in the study area of the western San Gabriel Valley and east/northeast Los Angeles, including the following considerations:
• Improve efficiency of the existing regional freeway and transit networks; • Reduce congestion on local arterials adversely affected due to accommodating regional traffic
volumes; • Minimize environmental impacts related to mobile sources.
ES.1.5 Objectives
To address the four elements of need for the project, five objectives related to the performance of the transportation system were developed as shown in Table ES-1.
Table ES-1. Transportation System Objectives
Element of Need Objective Regional transportation system 1. Minimize travel time
2. Improve connectivity and mobility Congestion on study area freeways 3. Reduce congestion on freeway system Congestion on local streets 4. Reduce congestion on local street system Transit operations in study area 5. Increase transit ridership
SR 710 Study December 2012 Page ES-3
Alternatives Analysis Report Executive Summary
Three additional objectives were developed to address environmental impacts, planning considerations, and cost efficiency as shown in Table ES-2.
Table ES-2. Environmental and Other Project Objectives
Value or Concern Objective Environment and communities 6. Minimize environmental and community impacts
related to transportation Consistency with plans 7. Assure consistency with regional plans and
strategies Provide financially feasible transportation solutions
8. Maximize the cost-efficiency of public investments
ES.2.0 Alternatives Considered
A wide range of possible transportation alternatives was identified based on past studies and comments received during the “SR-710 Conversations” from stakeholders including elected officials, city and agency staff, and the community. The resulting options were evaluated and refined through a sequential screening process to identify the alternatives that best meet the Need and Purpose of the study. The following sections describe the screening process, selection criteria, and the alternatives selected for evaluation via conceptual engineering and initial environmental analysis in this Alternatives Analysis (AA).
ES.2.1 Screening Criteria and Selection Process
The screening of alternatives followed a sequential process summarized below and illustrated in Figure ES-2:
Figure ES-2: Screening Process
• Preliminary Screening – An unscreened set of alternatives was identified during project initiation through a process that included a review of prior studies and public input received during the “710 Conversations” scoping process conducted by Metro and Caltrans in 2011. From this large set of alternatives, the preliminary screening step led to the identification of the preliminary set of alternatives, consisting of 42 alternatives representing a reasonable range of modes and alignments. Criteria used for the preliminary screening included the potential to accommodate regional north-south travel, reduce local street congestion, minimize community impacts, minimize the potential to encounter contaminated soil and groundwater, and accommodate ridership potential (for relevant modes). Within each travel mode, alternatives were evaluated against each other, and the most promising alternatives from each mode were selected to be included in the preliminary set of alternatives.
• Initial Screening – The initial screening evaluated the preliminary set of alternatives based on the eight project objectives described in Section 1.5. In general, the initial screening relied on available data and schematic representations of each alternative. To find the best performing alternatives
SR 710 Study December 2012 Page ES-4

Alternatives Analysis Report Executive Summary
within each mode in the initial screening, the performance of each alternative was compared only to that of other alternatives of the same mode. This evaluation step resulted in the identification of the initial set of alternatives, consisting of 12 alternatives and representing each mode from the preliminary set of alternatives.
• Secondary Screening – In the secondary screening step of the AA phase, the initial set of alternatives was studied and evaluated using detailed performance measures reflecting the eight project objectives. Additional engineering and environmental evaluation of each alternative was conducted, based on travel demand and ridership forecasting specific to each alternative and the conceptual-level engineering plans. The alternatives performing best on the secondary screening will be further developed and enhanced for evaluation during the Project Approval and Environmental Documentation (PA/ED) phase, along with possible hybrid or combination alternatives.
ES.2.2 Initial Set of Alternatives
The initial set of alternatives was screened from the preliminary set of alternatives and represents a range of modes and alignments. The No Build Alternative, the TSM/TDM Alternative, and the 10 “build” alternatives (as well as three design variations) are described below.
ES.2.2.1 No Build Alternative
The No Build Alternative includes all of the projects that are identified in the financially constrained project list of SCAG’s 2008 Regional Transportation Plan (RTP): Making the Connections. The No Build Alternative also includes currently planned projects in Los Angeles County that are identified in Measure R, as well as those in the “Constrained Plan” of Metro’s 2009 Long Range Transportation Plan (through the year 2035). The No Build Alternative does not include any project in the SR 710 corridor in the study area.
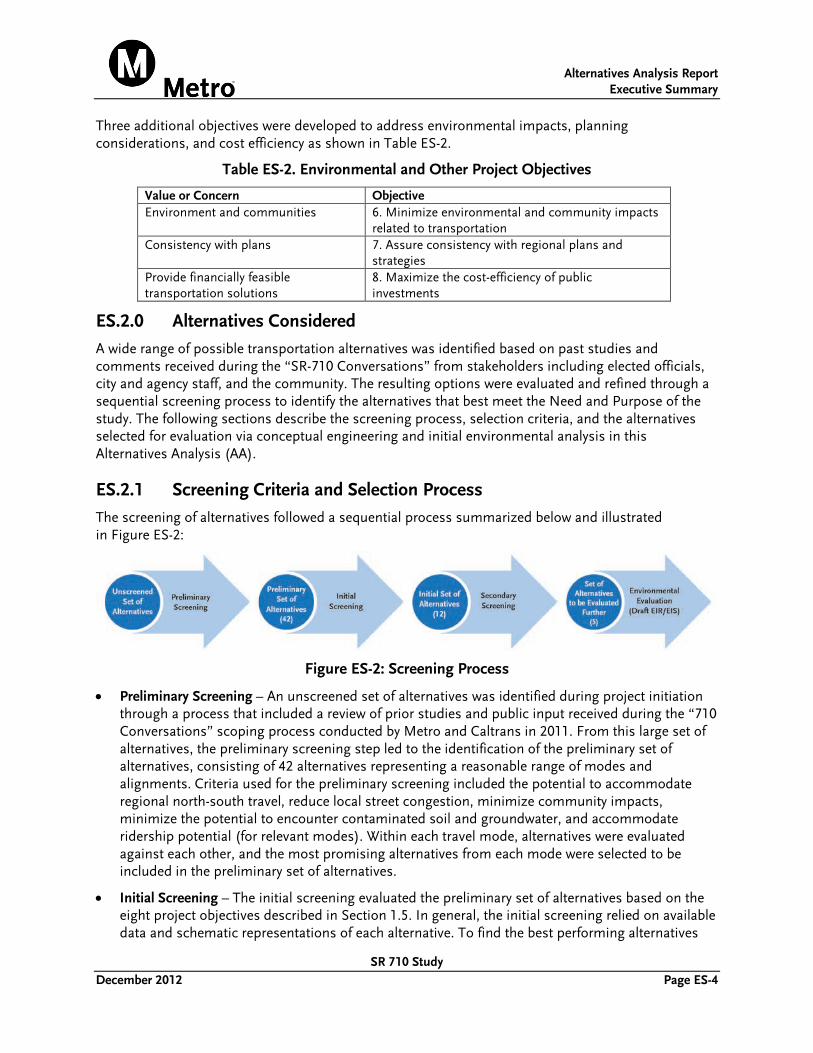
ES.2.2.2 Transportation System Management/Transportation Demand Management (TSM/TDM) Alternative
The TSM/TDM Alternative consists of strategies and improvements to increase efficiency and capacity for all modes in the transportation system with lower capital cost investments and/or lower potential impacts such as substantially increased bus service in the study area, active transportation (pedestrian and bicycle) facilities, intersection spot improvements, local street improvements, and Intelligent Transportation Systems (ITS) elements. The transit service improvements included in the TSM/TDM Alternative are illustrated in Figure ES-3. These transit improvements are also included in the BRT and LRT alternatives, but are not included in the freeway and highway alternatives.
ES.2.2.3 Bus Rapid Transit (BRT) Alternatives
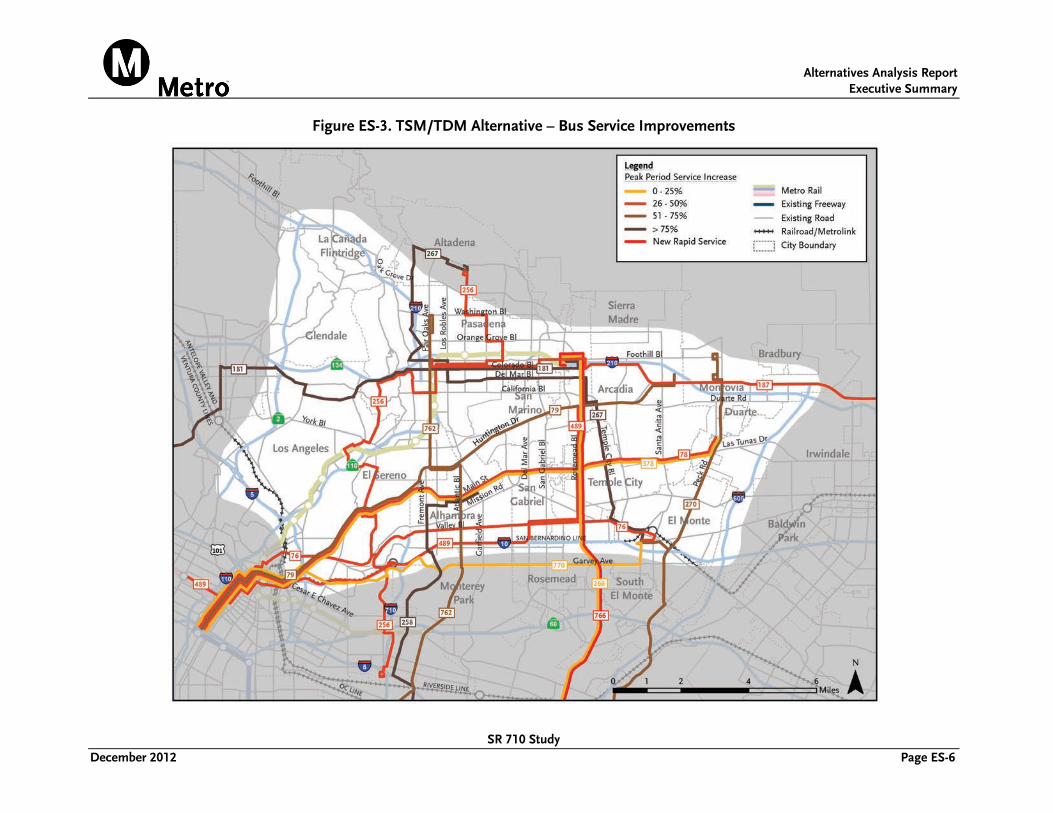
The BRT alternatives would provide higher speed, high frequency bus service operating in a combination of new, dedicated bus lanes and existing, mixed-flow traffic lanes. Bus priority methods such as synchronized traffic signal timing and preferential treatment of bus arrivals at signalized intersections would also be incorporated into the BRT system. The BRT alternatives also include all of the additional transit service provided in the TSM/TDM alternative, except where those services overlap with the BRT service itself. The BRT alternatives are illustrated in Figure ES-4.
BRT-1. Alternative BRT-1 would provide BRT service between Los Angeles Union Station and the Jet Propulsion Laboratory (JPL) in La Cañada Flintridge.
SR 710 Study December 2012 Page ES-5
Alternatives Analysis Report Executive Summary
Figure ES-3. TSM/TDM Alternative – Bus Service Improvements
SR 710 Study December 2012 Page ES-6
Alternatives Analysis Report Executive Summary
Figure ES-4: BRT Alternatives
SR 710 Study December 2012 Page ES-7

Alternatives Analysis Report Executive Summary
BRT-6. Alternative BRT-6 would provide BRT service between Whittier Boulevard, just south of the Gold Line Atlantic Station, and Pasadena City College (PCC) and the California Institute of Technology (Caltech) in Pasadena.
BRT-6A. Alternative BRT-6A is a design variation of Alternative BRT-6 but with a different terminal loop than Alternative BRT-6. Instead of traveling both eastbound and westbound on Colorado Boulevard, Alternative BRT-6A would travel only eastbound on Colorado Boulevard and then return westbound on California Boulevard after stopping at PCC and Caltech.
ES.2.2.4 Light Rail Transit (LRT) Alternatives
The LRT alternatives would be similar to the Metro Gold Line and Metro Blue Line currently operated by Metro in Los Angeles County. LRT systems typically operate along dedicated rights-of-way at-grade, but can be built in aerial or underground configurations where necessary. They are electrically powered through an overhead catenary system. In dedicated right-of-way, Metro LRT vehicles can operate at speeds of up to 65 mph. The LRT alternatives include all of the additional transit service provided in the TSM/TDM alternative, except where those services overlap with the LRT service itself. The LRT alternatives are illustrated in Figure ES-5.
LRT-4A. Alternative LRT-4A would begin at an aerial station on Mednik Avenue adjacent to the existing East LA Civic Center Station on the Metro Gold Line. It would remain elevated as it travels north to a station adjacent to Cal State LA, then descend into a tunnel north of Valley Boulevard and end at an underground station beneath the existing Fillmore Station on the Metro Gold Line.
LRT-4B. Alternative LRT-4B was developed as a design variation of Alternative LRT-4A to reduce the length of tunneling required. Alternative LRT-4B would follow the same path as Alternative LRT-4A to the Cal State LA Station. Instead of immediately entering a tunnel, Alternative LRT-4B would continue on an elevated structure above Mission Road, turning north on Palm Avenue where it would descend to grade on Palm Avenue. Alternative LRT-4B would then enter a bored tunnel before Main Street and continue along an alignment similar to that of Alternative LRT-4A.
LRT-4D. Alternative LRT-4D was developed as a design variation of Alternative LRT-4A to eliminate the bored tunnel section and use only cut-and-cover tunnel techniques. Alternative LRT-4D would originate at an underground station beneath Beverly Boulevard, near the existing Atlantic Station on the Metro Gold Line and end at an underground station beneath the existing Fillmore Station on the Metro Gold Line.
LRT-6. Alternative LRT-6 would connect the existing Atlantic and Fillmore stations on the Metro Gold Line. Alternative LRT-6 would begin at an aerial station on Atlantic Boulevard near Pomona Boulevard and terminate with a new, elevated station above the existing Fillmore Station on the Metro Gold Line. The alternative would consist of at-grade and aerial segments.
ES.2.2.5 Freeway Alternatives
The four freeway alternatives would extend SR 710 as an access-controlled freeway with a total of four travel lanes in each direction. Three of the freeway alternatives (F-2, F-5, and F-7) would be constructed in tunnels, using primarily bored tunnels with short segments of cut-and-cover tunnels to access the bored tunnel. The fourth freeway alternative (F-6) consists primarily of a combination of surface and depressed segments, with one short cut-and-cover tunnel segment. The freeways would be open to all vehicles without restrictions, except for a prohibition on hazardous materials in tunnels. Figure ES-6 illustrates the alignment of the freeway alternatives.
SR 710 Study December 2012 Page ES-8

Alternatives Analysis Report Executive Summary
Figure ES-5: LRT Alternatives
SR 710 Study December 2012 Page ES-9

Alternatives Analysis Report Executive Summary
Figure ES-6: Freeway Alternatives
SR 710 Study December 2012 Page ES-10

Alternatives Analysis Report Executive Summary
F-2. Alternative F-2 would originate at the existing SR 710 stub north of the I-10 freeway and connect to SR 2 between the Verdugo Road and SR 134 interchanges. The alternative would be an eight-lane freeway primarily constructed in two bored tunnels. Each tunnel would be dedicated to either northbound or southbound travel, with two lanes on each of two levels in each tunnel.
F-5. Alternative F-5 would also originate at the existing SR 710 stub north of I-10, similar to Alternative F-2, and connect to the SR 134 freeway near the Colorado Boulevard interchange. This alternative would also be an eight-lane freeway with two bored tunnels for directional travel similar to Alternative F-2. Alternative F-2 would provide interchange access to the SR 134/SR 710 interchange both to and from SR 134 for both eastbound and westbound travel and interchange access to Valley.
F-6. Alternative F-6 would also originate at the existing SR 710 stub north of I-10, but would consist of a combination of surface and depressed freeway segments, ultimately connecting to the existing SR 710 stub south of the I-210/SR 134 interchanges in Pasadena. Generally, Alternative F-6 would follow a very similar alignment to the “Meridian Variation” approved in the Record of Decision in 1998. Ramps would provide access to the freeway from Valley Boulevard, Mission Road/Alhambra Avenue, Huntington Drive, and Del Mar Boulevard.
F-7. Alternative F-7 would also originate at the existing SR 710 stub north of I-10. It would connect via a bored tunnel to the existing SR 710 stub south of the I-210/SR 134 interchanges in Pasadena. This alternative would also be an eight-lane freeway with two bored tunnels for directional travel similar to Alternative F-2.
ES.2.2.6 Highway Alternatives
The highway/arterial alternatives would extend SR 710 by providing major roadway improvements to existing arterials in the study area. Each of these alternatives would provide three lanes in each direction along the length of the alignments. Where possible, the roadway widening associated with each alternative is limited to one side of the existing roadway to reduce the number of property acquisitions. Properties would be maintained on the other side of the roadway and in many areas have a frontage road for access. Figure ES-7 illustrates the alignment of the highway alternatives.
H-2. Alternative H-2 would begin at the existing SR 710 stub north of I-10 and connect the SR 710 freeway directly to Concord Avenue. The SR 710 freeway would come to an end at Valley Boulevard and transition to a major arterial that would travel over Valley Boulevard, the Union Pacific Railroad (UPRR) tracks, and Mission Road/Alhambra Avenue to Concord Avenue. The alignment would ultimately end near the intersection of San Rafael Avenue and Linda Vista Avenue.
H-6. Alternative H-6 would also begin at the existing SR 710 stub north of I-10 and connect the SR 710 freeway directly to Sheffield Avenue. The SR 710 freeway would come to an end at Valley Boulevard and transition to a major arterial that would travel over Valley Boulevard, the UPRR tracks, and Mission Road/Alhambra Avenue to Sheffield Avenue. The alignment would then continue to Huntington Drive, to Fair Oaks Avenue, to Columbia Street, and then to Pasadena Avenue. Just north of the intersection of Pasadena Avenue and Bellefontaine Street, the roadway would split into a northbound segment along Pasadena Avenue and a southbound segment along Saint John Avenue. The improvements in both directions would end near Del Mar Boulevard.
SR 710 Study December 2012 Page ES-11

Alternatives Analysis Report Executive Summary
Figure ES-7: Highway Alternatives
SR 710 Study December 2012 Page ES-12

Alternatives Analysis Report Executive Summary
ES.3.0 Transportation System Performance
The initial set of alternatives was evaluated against the five project objectives that were developed to address the project need. For each of these objectives, 20 detailed performance measures were developed as shown in Table ES-3.
Table ES-3: Transportation System Performance Measures
Objective Performance Measures 1. Minimize travel time Point-to-point travel time - vehicular
Point-to-point travel time - transit Reduction in vehicle hours traveled (VHT) Percentage of travel on managed facilities
2. Improve connectivity and mobility New interchanges/transit connections Jobs reachable within fixed time Transit boardings Arterial volumes Freeway throughput
3. Reduce congestion on freeway system Facility miles operating at LOS F1 or worse Facility miles operating at LOS E or F0 Vehicle miles traveled (VMT) on congested freeway segments
4. Reduce congestion on local street system
Percent of intersections with congested approaches Average v/c on arterials VMT on arterials Arterial cut-through percentage North-south travel on arterials
5. Increase transit ridership Increase in transit ridership Percent of population within 1/4 mile of transit Transit mode share
Based on each alternative’s performance on the component performance measures that contribute to the evaluation of each objective, a score from 1 to 7 was calculated for each objective, with 1 indicating least favorable performance on that objective and 7 indicating the most favorable performance. Table ES-4 summarizes the performance of each of the alternatives. The detailed evaluation of each of the alternatives on each of the performance measures is presented in Chapter 3, and the calculation of the 1 to 7 score on each objective is described in Chapter 7.
Table ES-4: Summary of Transportation System Performance Measures
Element of Need Objective
Local Street system in study area
4: Reduce congestion on local street system
Transit system in study area
5: Increase transit ridership
Freeway system in study area
3: Reduce congestion on freeway system
Regional Transportation
System
1: Minimize travel time
2: Improve connectivity and mobility
No
Build
1 1 1 1
1 4 6 6
1 2 1 1
1 2 3 2 1 1 1 2
TSM
/TDM
BRT-
1
BRT-
6
BRT-
6A
LRT-
4A
7 7 7 7 1
1
6
1 1 1 1 6 1 1 1 1 4
1 2 2 2 2 32
2 3 3 3 3 4
LRT-
4B
LRT-
4D
LRT-
6
F-2
F-5
F-6
1 1 1 11
4 35 1 25 6 6
5 4 7 5
2 24 3 4 5 1 2
F-7
H-2
H-6
SR 710 Study December 2012 Page ES-13

Figure ES-8: Regional Vehicular Travel Time Performance Figure ES-9: Regional Transit Travel Time Performance
Alternatives Analysis Report Executive Summary
ES.3.1 Minimizing Travel Time
The project objective of minimizing travel times in the Southern California region was evaluated using several different measures including average point-to-point travel times for trips made by private vehicles, average point-to-point travel times for trips made by transit, total vehicle hours traveled (VHT), and others discussed in more
Figure ES-8: Regional Vehicular Travel detail in Chapter 3. Time Performance
For travel time savings for automobile trips, Alternatives F-2, F-6, and F-7 provide the greatest savings, as shown in Figure ES-8. Alternative F-5 provides somewhat less travel time savings. None of the transit or highway alternatives provides substantial travel times savings for automobile trips.
For reducing point-to-point travel times for transit trips in the study area, Alternatives BRT-1, LRT-4A, LRT-4B, LRT-4D, and LRT-6 are most effective, and Alternatives BRT-6 and BRT-6A are about half as effective, as shown in Figure ES-9. None of the freeway or highway alternatives are effective at reducing point-to-point travel times for transit trips.
The reduction in VHT includes all vehicular (automobile and truck) trips made during the a.m. and p.m. peak periods in the six-county SCAG region. The TSM/TDM Alternative and the transit alternatives are more effective at this measure than the freeway and
Nor
mal
ized
Red
ucti
on in
Tra
vel T
ime
Nor
mal
ized
Red
ucti
on in
Tra
vel T
ime
100 90 80 70 60 50 40 30 20 10
0
Figure ES-9: Regional Transit Travel Time Performance
100 90 80 70 60 50 40 30 20 10
0
highway alternatives, primarily because they remove some vehicular trips. The TSM/TDM Alternative, BRT alternatives, and LRT alternatives reduce total VHT during the a.m. and p.m. peak periods by 89,000 to 102,000 hours. Alternatives F-2, F-5, F-6, F-7, H-2, and H-6 each reduce total VHT by a total of 7,000 to 14,000 miles, since they do not include the transit improvements from the TSM/TDM Alternative.
ES.3.2 Improving Connectivity and Mobility
The project objective of improving connectivity and mobility in the region was evaluated using several different measures including: jobs reachable within a fixed time, increase in transit boardings, reduction in arterial volumes, increase in north-south freeway throughput, and others discussed in more detail in Chapter 3.
SR 710 Study December 2012 Page ES-14

Figure ES-10: Recovery of Lost Job Accessibility
Figure ES-11: North-South Freeway Throughput (1000s)
Alternatives Analysis Report Executive Summary
The No Build Alternative would not Figure ES-10: Recovery of Lost Job Accessibility enhance connectivity or mobility in the region and travel conditions would worsen due to growth in population and employment in the area.
Because of increasing congestion and delay on the regional transportation network, the number of jobs accessible to residents of the study area within 25.3 minutes (the average commute time in the United States) will decrease by 2035. Each of the alternatives was evaluated based on the percentage of this decrease in job accessibility that
% o
f Los
t Job
Acc
essi
bilit
y R
esto
red
200
0
50
100
150
the alternative would restore. As shown in Figure ES-10, Alternative F-6 performs best on this measure, compensating for the entire decrease in job accessibility due to freeway congestion and making additional jobs accessible. The highway alternatives only restore about half of the decrease in job accessibility. The TSM/TDM Alternative, the BRT alternatives, and the LRT alternatives only minimally compensate for the lost job accessibility.
Regional travel on transit routes through the study area is depressed because transit speeds in the study area are slow. The increase in the number of transit boardings on north-south routes through the study area reflects the performance of each alternative in attracting regional trips to transit. The TSM/TDM Alternative and Alternative BRT-1 would result in an increase of approximately 25,000 total daily boardings on north-south transit routes through the study area compared to the No Build Alternative. Alternatives BRT-6, BRT-6A, LRT-4A, LRT-4B, LRT-4D perform slightly better, generating an increase of approximately 30,000 total daily boardings. None of the freeway or highway alternatives increase transit boardings.
As shown in Figures ES-11 and ES-12, Figure ES-11: North-South Freeway Alternatives F-5 and F-7 perform the best at increasing north-south throughput on the freeways in the study area and reducing traffic volumes on local north-south streets. These two alternatives increase north-south freeway throughput by 140,000 vehicles per day, while removing 80,000 or more daily vehicle trips from local north-south streets. Alternatives F-2 and F-6 perform slightly less well on these measures. None of the BRT or LRT alternatives increase freeway throughput or reduce traffic volumes on local streets. The TSM/TDM
Ch
ang
e in
Dai
ly A
rter
ial
Vo
lum
e (i
n 1
000
s) Throughput (1000s)
1,200
800
900
1,000
1,100
SR 710 Study December 2012 Page ES-15
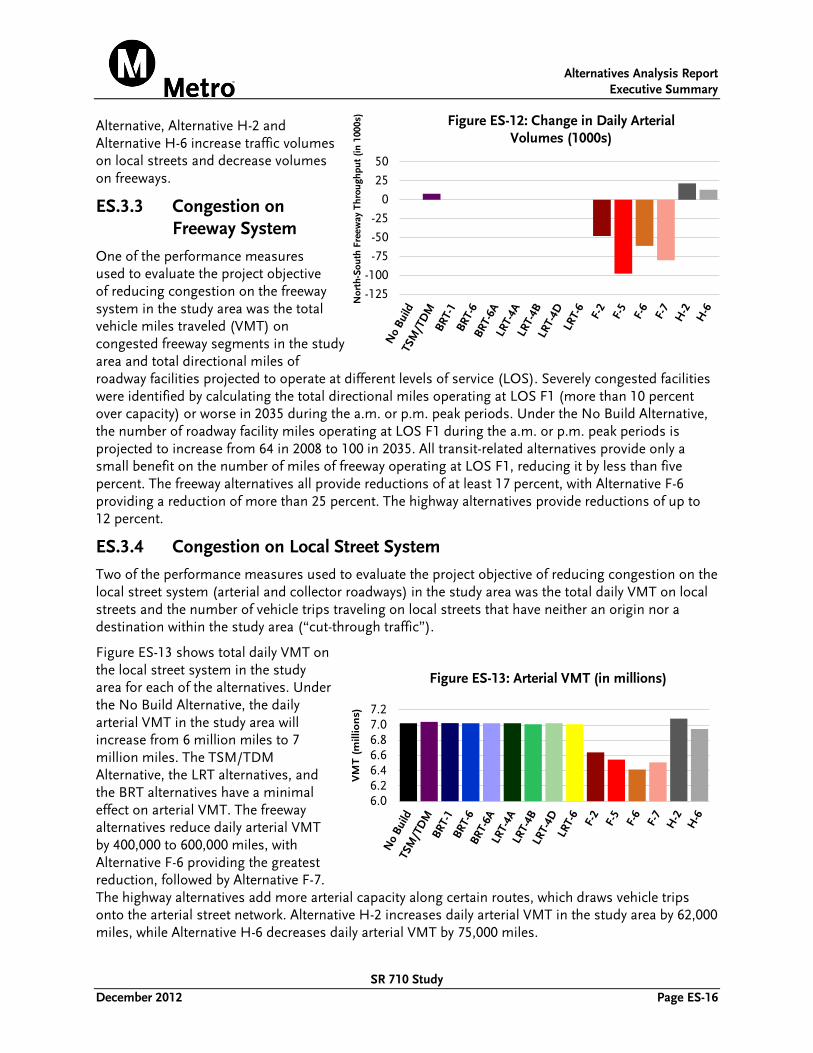
Figure ES-12: Change in Daily Arterial Volumes (1000s)
Figure ES-13: Arterial VMT (in millions)
Alternatives Analysis Report Executive Summary
Figure ES-12: Change in Daily Arterial Alternative, Alternative H-2 and Volumes (1000s)
Nor
th-S
outh
Fre
eway
Thr
ough
put (
in 1
000s
)
Alternative H-6 increase traffic volumes on local streets and decrease volumes on freeways.
ES.3.3 Congestion on Freeway System
One of the performance measures used to evaluate the project objective of reducing congestion on the freeway
50
25
0
-25
-50
-75
-100
-125 system in the study area was the total vehicle miles traveled (VMT) on congested freeway segments in the study area and total directional miles of roadway facilities projected to operate at different levels of service (LOS). Severely congested facilities were identified by calculating the total directional miles operating at LOS F1 (more than 10 percent over capacity) or worse in 2035 during the a.m. or p.m. peak periods. Under the No Build Alternative, the number of roadway facility miles operating at LOS F1 during the a.m. or p.m. peak periods is projected to increase from 64 in 2008 to 100 in 2035. All transit-related alternatives provide only a small benefit on the number of miles of freeway operating at LOS F1, reducing it by less than five percent. The freeway alternatives all provide reductions of at least 17 percent, with Alternative F-6 providing a reduction of more than 25 percent. The highway alternatives provide reductions of up to 12 percent.
ES.3.4 Congestion on Local Street System
Two of the performance measures used to evaluate the project objective of reducing congestion on the local street system (arterial and collector roadways) in the study area was the total daily VMT on local streets and the number of vehicle trips traveling on local streets that have neither an origin nor a destination within the study area (“cut-through traffic”).
Figure ES-13 shows total daily VMT on the local street system in the study Figure ES-13: Arterial VMT (in millions) area for each of the alternatives. Under the No Build Alternative, the daily arterial VMT in the study area will increase from 6 million miles to 7 million miles. The TSM/TDM Alternative, the LRT alternatives, and the BRT alternatives have a minimal effect on arterial VMT. The freeway alternatives reduce daily arterial VMT by 400,000 to 600,000 miles, with Alternative F-6 providing the greatest reduction, followed by Alternative F-7.
VM
T (
mill
ion
s) 7.2
6.0 6.2 6.4 6.6 6.8 7.0
The highway alternatives add more arterial capacity along certain routes, which draws vehicle trips onto the arterial street network. Alternative H-2 increases daily arterial VMT in the study area by 62,000 miles, while Alternative H-6 decreases daily arterial VMT by 75,000 miles.
SR 710 Study December 2012 Page ES-16

Figure ES-14: Arterial Cut-Through Percentage Figure ES-15: New Transit Riders
Alternatives Analysis Report Executive Summary
Under the No Build Alternative by 2035, the percentage of cut-through ag
e Figure ES-14: Arterial Cut-Through Percentage
traffic will increase from 19 percent to 30% ent
25 percent. As shown in Figure ES-14, 25%
Per
c
the TSM/TDM Alternative, the LRT 20% alternatives, and the BRT alternatives 15%
gh
o
u
result in no change in the percentage 10% Th
r-
of cut-through traffic. All of the freeway 5%Cu
t
alternatives reduce cut-through traffic by 30 to 60 percent, with Alternative F
0%
Art
eria
l
7 being the most effective on this measure. The highway alternatives also result in no change in the percentage of cut-through traffic.
ES.3.5 Transit Ridership Figure ES-15: New Transit Riders
One of the performance measures 25,000
der
s
used to evaluate the project objective of increasing transit ridership was the ability to attract new transit riders. As 15,000
20,000
Tra
nsi
t R
i
shown in Figure ES-15, the TSM/TDM 10,000
New
Alternative is forecast to attract over 16,000 new transit riders daily by 2035.
5,000
The BRT and LRT alternatives are forecast to attract approximately 19,000 to 20,000 new riders. None of the freeway or highway alternatives attract new transit riders.
ES.4.0 Environmental and Other Performance Measures
This section describes the performance of each alternative in the initial set of alternatives on the performance measures related to the three project objectives pertaining to environmental impacts, planning considerations, and cost efficiency. For each of these objectives, 22 detailed performance measures were developed as shown in Table ES-5. This section describes the performance of the initial set of alternatives on select performance measures related to these three project objectives shown in Table ES-5.
Table ES-6 summarizes the performance of each of the alternatives on the three project objectives pertaining to environmental and other concerns, with each alternative’s performance on the component performance measures assigned a score from 1 to 7 as was done for the transportation system. The detailed evaluation of each of the alternatives on each of the performance measures is presented in Chapter 4, and the calculation of the 1 to 7 score on each objective is described in Chapter 7.
0
Riders generated by TSM/TDM service improvements
SR 710 Study December 2012 Page ES-17

Alternatives Analysis Report Executive Summary
Table ES-5: Environmental and Other Performance Measures
Objective Performance Measures 6. Minimize environmental and community impacts related to transportation
Right-of-Way Full or partial residential or business acquisitions
Human Environment Recreational/community sites impacted Archeological sites impacted Properties over 45 years old impacted Significant historic resources impacted Increase in noise exposure Increase in mobile-source air toxics (MSATs) Increase in regional criteria pollutants Increase in greenhouse gas (GHG) emissions Hazardous waste sites impacted Visual intrusion in communities Scenic corridors impacts
Natural Environment Areas of high paleontological sensitivity impacted Exposure to adverse geotechnical conditions Sensitive habitats impacted Drainages impacted
7. Assure consistency with regional plans and strategies
Consistency with RTP/SCS goals Consistency with Measure R goals Consistency with Metro LRTP goals
8. Maximize the cost-efficiency of public investments
Construction and right-of-way costs Available funding Technical feasibility
The environmental and community impacts discussed below have been identified based on conceptual engineering of each of the alternatives. For alternatives that are evaluated further in the Project Approval/Environmental Document (PA/ED) phase, designs will be refined to avoid or minimize impacts to the extent possible. In addition, where feasible, mitigation measures will be identified to reduce impacts that cannot be avoided.
Table ES-6: Summary of Environmental and Other Performance Measures
Value or Concern Objective
No
Build
TSM
/TDM
BRT-
1
BRT-
6
BRT-
6A
LRT-
4A
LRT-
4B
LRT-
4D
LRT-
6
F-2
F-5
F-6
F-7
H-2
H-6
6A: Right of way 7 7 7 7 7 7 7 6 5 3 4 1 7 1 5 Communities
Environmental & 6B: Human environment 6 6 7 6 6 6 6 6 5 4 4 3 5 4 5 6C: Natural environment 7 7 6 7 7 5 5 5 7 5 4 5 5 6 7
Consistency with Plans
7: Consistency with regional plans and
strategies 1 6 6 6 6 6 6 6 6 6 6 6 6 3 3 Feasible Transportation
Solutions
Provide Financially 8: Maximize cost-efficiency
of public investments 7 7 7 7 7 4 4 4 5 5 5 6 6 7 7 SR 710 Study
December 2012 Page ES-18
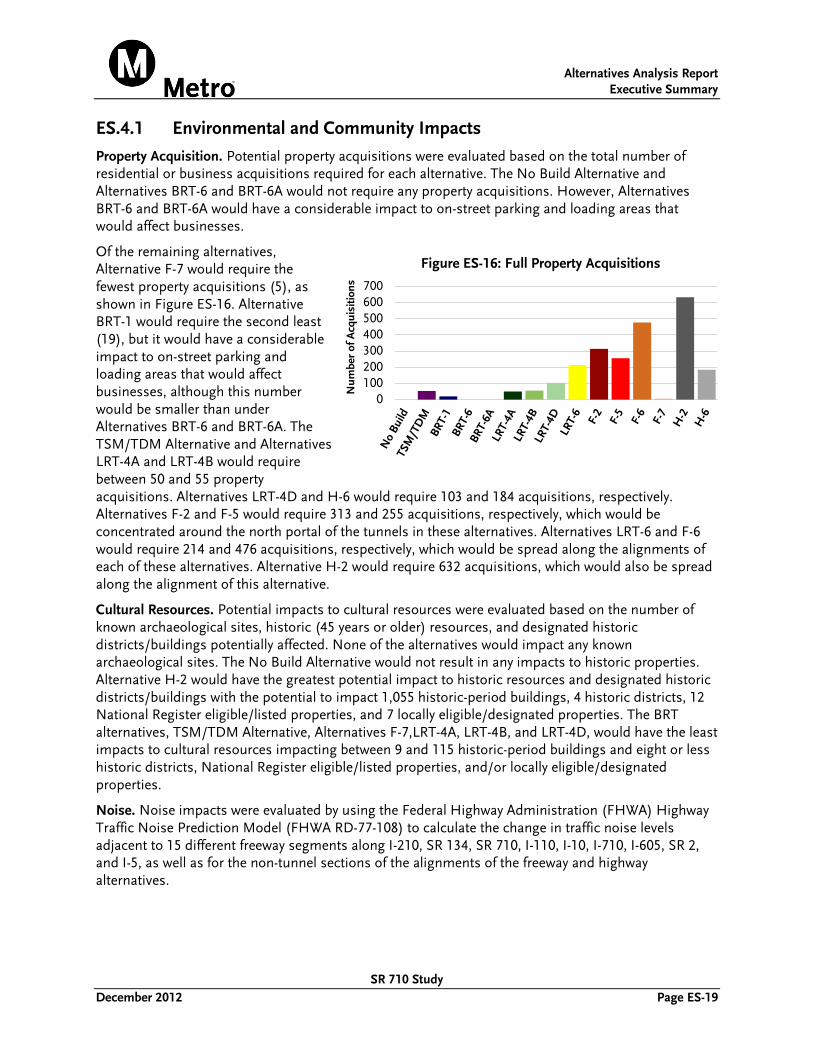
Figure ES-16: Full Property Acquisitions
Alternatives Analysis Report Executive Summary
ES.4.1 Environmental and Community Impacts
Property Acquisition. Potential property acquisitions were evaluated based on the total number of residential or business acquisitions required for each alternative. The No Build Alternative and Alternatives BRT-6 and BRT-6A would not require any property acquisitions. However, Alternatives BRT-6 and BRT-6A would have a considerable impact to on-street parking and loading areas that would affect businesses.
Of the remaining alternatives, Figure ES-16: Full Property Acquisitions Alternative F-7 would require the
fewest property acquisitions (5), as shown in Figure ES-16. Alternative BRT-1 would require the second least (19), but it would have a considerable impact to on-street parking and loading areas that would affect businesses, although this number N
umbe
r of
Acq
uisi
tions
700
0 100 200 300 400 500 600
would be smaller than under Alternatives BRT-6 and BRT-6A. The TSM/TDM Alternative and Alternatives LRT-4A and LRT-4B would require between 50 and 55 property acquisitions. Alternatives LRT-4D and H-6 would require 103 and 184 acquisitions, respectively. Alternatives F-2 and F-5 would require 313 and 255 acquisitions, respectively, which would be concentrated around the north portal of the tunnels in these alternatives. Alternatives LRT-6 and F-6 would require 214 and 476 acquisitions, respectively, which would be spread along the alignments of each of these alternatives. Alternative H-2 would require 632 acquisitions, which would also be spread along the alignment of this alternative.
Cultural Resources. Potential impacts to cultural resources were evaluated based on the number of known archaeological sites, historic (45 years or older) resources, and designated historic districts/buildings potentially affected. None of the alternatives would impact any known archaeological sites. The No Build Alternative would not result in any impacts to historic properties. Alternative H-2 would have the greatest potential impact to historic resources and designated historic districts/buildings with the potential to impact 1,055 historic-period buildings, 4 historic districts, 12 National Register eligible/listed properties, and 7 locally eligible/designated properties. The BRT alternatives, TSM/TDM Alternative, Alternatives F-7,LRT-4A, LRT-4B, and LRT-4D, would have the least impacts to cultural resources impacting between 9 and 115 historic-period buildings and eight or less historic districts, National Register eligible/listed properties, and/or locally eligible/designated properties.
Noise. Noise impacts were evaluated by using the Federal Highway Administration (FHWA) Highway Traffic Noise Prediction Model (FHWA RD-77-108) to calculate the change in traffic noise levels adjacent to 15 different freeway segments along I-210, SR 134, SR 710, I-110, I-10, I-710, I-605, SR 2, and I-5, as well as for the non-tunnel sections of the alignments of the freeway and highway alternatives.
SR 710 Study December 2012 Page ES-19
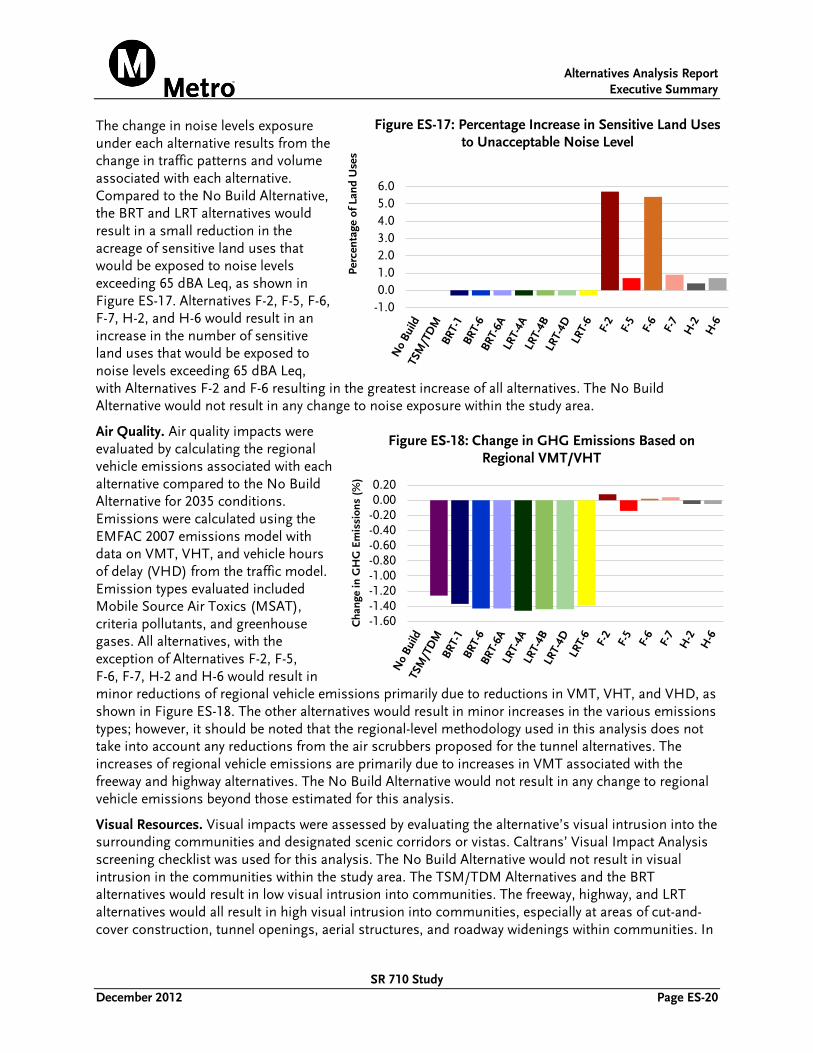
Figure ES-17: Percentage Increase in Sensitive Land Uses to Unacceptable Noise Level
Figure ES-18: Change in GHG Emissions Based on Regional VMT/VHT
Alternatives Analysis Report Executive Summary
The change in noise levels exposure Figure ES-17: Percentage Increase in Sensitive Land Uses under each alternative results from the to Unacceptable Noise Level change in traffic patterns and volume associated with each alternative. Compared to the No Build Alternative,
Per
cen
tage
of L
and
Use
s
6.0
the BRT and LRT alternatives would
exceeding 65 dBA Leq, as shown in 0.0 Figure ES-17. Alternatives F-2, F-5, F-6, -1.0 F-7, H-2, and H-6 would result in an increase in the number of sensitive land uses that would be exposed to noise levels exceeding 65 dBA Leq, with Alternatives F-2 and F-6 resulting in the greatest increase of all alternatives. The No Build Alternative would not result in any change to noise exposure within the study area.
Air Quality. Air quality impacts were Figure ES-18: Change in GHG Emissions Based on
evaluated by calculating the regional Regional VMT/VHT
vehicle emissions associated with each
5.0 4.0
result in a small reduction in the 3.0 acreage of sensitive land uses that 2.0 would be exposed to noise levels 1.0
alternative compared to the No Build Alternative for 2035 conditions. Emissions were calculated using the EMFAC 2007 emissions model with data on VMT, VHT, and vehicle hours of delay (VHD) from the traffic model. Emission types evaluated included Mobile Source Air Toxics (MSAT), criteria pollutants, and greenhouse gases. All alternatives, with the exception of Alternatives F-2, F-5, F-6, F-7, H-2 and H-6 would result in
Cha
nge
in G
HG
Em
issi
ons
(%) 0.20
0.00 -0.20 -0.40 -0.60 -0.80 -1.00 -1.20 -1.40 -1.60
minor reductions of regional vehicle emissions primarily due to reductions in VMT, VHT, and VHD, as shown in Figure ES-18. The other alternatives would result in minor increases in the various emissions types; however, it should be noted that the regional-level methodology used in this analysis does not take into account any reductions from the air scrubbers proposed for the tunnel alternatives. The increases of regional vehicle emissions are primarily due to increases in VMT associated with the freeway and highway alternatives. The No Build Alternative would not result in any change to regional vehicle emissions beyond those estimated for this analysis.
Visual Resources. Visual impacts were assessed by evaluating the alternative’s visual intrusion into the surrounding communities and designated scenic corridors or vistas. Caltrans’ Visual Impact Analysis screening checklist was used for this analysis. The No Build Alternative would not result in visual intrusion in the communities within the study area. The TSM/TDM Alternatives and the BRT alternatives would result in low visual intrusion into communities. The freeway, highway, and LRT alternatives would all result in high visual intrusion into communities, especially at areas of cut-andcover construction, tunnel openings, aerial structures, and roadway widenings within communities. In
SR 710 Study December 2012 Page ES-20

Alternatives Analysis Report Executive Summary
addition, Alternatives F-2, F-5, and H-2 would impact a portion of the Arroyo Parkway, a designated scenic parkway.
Geological Conditions. Geological conditions were evaluated based on the percentage of the alignment of each alternative within potentially liquefiable zones, subsurface material variability, or formational materials known to contain natural gas that could be impacted by an alternative. In addition, the number of active and potentially active faults crossing the alignment of an alternative were considered. The No Build Alternative would not result in any changes to geological conditions in the study area; however, the existing conditions do pose some risk to existing facilities within the study area. Alternatives LRT-4A, LRT-4B, LRT-4D, F-2, F-5, and F-7 would have the greatest potential to encounter adverse geotechnical conditions of concern, while the TSM/TDM Alternative would have the least potential.
ES.4.2 Consistency with Regional Plans and Strategies
The alternatives were evaluated for consistency with the goals and objectives of the Southern California Associated Government’s (SCAG) 2012-2035 Regional Transportation Plan/Sustainable Communities Strategy (RTP/SCS), Measure R, and Metro’s Long Range Transportation Plan (LRTP). The No Build Alternatives is not consistent with any of the goals/objectives in these three planning documents. The goals and objectives of SCAG’s RTP/SCS focus on maximizing mobility and accessibility and ensuring safety, reliability, sustainability, and productivity of the regional transportation system; therefore, the BRT, LRT, and freeway alternatives have the greatest consistency with goals/objectives in SCAG’s RTP/SCS, while the highway alternatives have the least consistency. The goals/objectives of Measure R focus on reducing congestion, improving traffic flow, improving mobility, and increasing public transportation; therefore, the BRT and freeway alternatives have consistency with the most goals/objectives of Measure R, followed by the LRT alternatives, while the TSM/TDM and highway alternatives are the least consistent. Of all alternatives, the TSM/TDM Alternative is consistent with the most goals/objectives in Metro’s LRTP through implementation of signal synchronizations, ITS technologies, bicycle and pedestrian improvements, and bus signal prioritization.
ES.4.3 Maximizing Cost-Efficiency
The project objective of maximizing the cost-efficiency of public investments was evaluated using three measures: estimated construction and right-of-way costs, the availability of funding, and technical feasibility. The TSM/TDM Alternative and the BRT alternatives have the lowest capital and right-of-way costs, other than the No Build Alternative. Alternative LRT-6 is expected to have the lowest total capital and right-of-way cost of the LRT alternatives. Among the freeway alternatives, Alternative F-6 is expected to have the lowest capital cost, because it has no bored tunnel segments and only a short cut-and-cover tunnel segment. In addition, it makes use of existing infrastructure at the SR 710/SR 134/I-210 interchange and existing Caltrans right-of-way along the alignment. Among the freeway tunnel alternatives, Alternative F-7 is expected to have the lowest capital and right-of-way costs because it has the most direct tunnel and it also makes use of existing infrastructure at the SR 710/SR 134/I-210 interchange and existing Caltrans right-of-way at either end of the alignment.
The No Build Alternative, the TSM/TDM Alternative, the BRT alternatives, and the highway alternatives were rated the highest among the alternatives on the measure of the availability of funding because they could all be constructed within the Measure R budget for the project. The freeway alternatives were rated slightly lower on the measure of the availability of funding because, while they would exceed the Measure R budget, it is expected that potential toll revenues could be used to fund construction of
SR 710 Study December 2012 Page ES-21

Alternatives Analysis Report Executive Summary
these alternatives based on an independent study conducted by Metro that concludes that freeway tunnel alternatives could be funded by future toll revenues. The LRT alternatives were rated lower than the freeway alternatives on the measure of the availability of funding because they exceed the Measure R budget, and transit fares would not be sufficient to fund their construction.
All of the alternatives were determined to be technically feasible, as similar facilities have been or are being constructed in North America.
ES.5.0 Outreach Activities
ES.5.1 Project Scoping
The SR 710 project public outreach began in February 2011 with the “SR 710 Conversations,” a series of scoping meetings that began with 21 pre-scoping and scoping meetings throughout the study area. The formal scoping period extended from March 3, 2011, through April 14, 2011, during which time Caltrans and Metro accepted comments on the proposed project. All scoping comments were documented in the 710 North Gap Closure, Scoping Summary Report, Volumes I and II, dated September 2011. The scoping comments were reviewed and analyzed to develop the project’s updated purpose and need, evaluation criteria, performance measures, and preliminary alternatives. This set the foundation for the start of the Alternatives Analysis.
ES.5.2 Community/Stakeholder Outreach
Building on the SR 710 Conversations, after the start of the SR 710 Study, community outreach efforts began with two All Communities Convening (ACC) meetings held in March 2012 with the purpose of gathering communities together in an open house format to discuss the project, share information about the process, and gather comments. At these meetings, the Community Liaison Councils (CLCs) were introduced as an option for community members to participate in the councils to generate interest and participation within the various communities of the study area and to invite the public to the next series of informational meetings. CLC meetings were held throughout the month of April to notify the community of the upcoming Open House meetings scheduled for the fall.
The Technical Advisory Committee (TAC) was created with the purpose of providing technical input to Metro, Caltrans, and the project team. Representatives of each jurisdiction in the study area, as well as representatives of other stakeholder agencies, were invited to participate in the TAC. The TAC reviewed technical analyses and methodologies and provided feedback on technical materials and project information. TAC members were also responsible for sharing information with their agencies. The TAC met eight times during the AA process, in January, February, March, April, May, July, August, and November, 2012.
The Stakeholder Outreach Advisory Committee (SOAC) was created at the direction of the Metro Board and consisted of members of planning commissions, transportation commissions, and elected officials. The SOAC met in May, July, August, and November, 2012, to be briefed on the progress of the SR 710 Study. SOAC members were responsible for providing updates to their respective jurisdictions on the progress of the study and in turn recommend items to the project team to place on the agenda for subsequent SOAC meetings.
Open House Meetings. A series of seven Open House meetings was held in May 2012 at locations throughout the study area to share the project progress and to gather input from community members and other stakeholders on the Initial Set of Alternatives and on the screening process. At the Open Houses, seven stations were set up covering the following topics: welcome and introduction,
SR 710 Study December 2012 Page ES-22

Alternatives Analysis Report Executive Summary
study overview, environmental study review process, scoping process review, alternative concepts overview, feedback, and next steps in the study.
Each station presented information in English and Spanish on large presentation boards, allowing members of the community to proceed at their own pace. Each station was also staffed by members of the project team, who were available to answer questions and provide clarifications. Attendees were encouraged to provide their feedback on “Post-It®” notes that could be affixed to the boards. All feedback was documented and shared with the project team.
ES.6.0 Evaluation Process and Summary
In the secondary screening, the performance of the 12 alternatives in the initial set of alternatives on the eight project objectives was evaluated using 42 performance measures. Table ES-4 presented earlier summarizes the performance of each of the alternatives on the five objectives related to the project need. Table ES-6 presented earlier summarizes the performance of each of the alternatives on the three objectives related to environmental, planning, and cost concerns.
The No Build Alternative and the TSM/TDM Alternative are required to be evaluated in the PA/ED phase. Therefore, they should be evaluated further.
Among the BRT alternatives, the measures for the objectives related to transportation system performance were similar to one another, with Alternative BRT-1 performing slightly better at reducing transit travel times, but Alternatives BRT-6 and BRT-6A performing slightly better at increasing access to high-frequency transit service and increasing north-south transit patronage. Therefore, performance on the transportation objectives does not clearly favor one alternative over the others. However, Alternatives BRT-6 and BRT-6A could be implemented with no right-of-way acquisition and would also have a smaller potential impact on sensitive habitat. Therefore, Alternatives BRT-6, along with the design variation Alternative BRT-6A, should be evaluated further in the PA/ED phase.
Among the LRT alternatives, the measures for the objectives related to transportation system performance were similar to one another. However, on the measures for the objectives related to environmental and other concerns, Alternative LRT-6 was clearly inferior to Alternatives LRT-4A, LRT-4B, and LRT-4D. Alternative LRT-6 would require the acquisition of hundreds of properties, impact more historic period properties, and impact more community facilities. Similarly, compared to Alternatives LRT-4A and LRT-4B, Alternative LRT-4D would have greater property impacts. Therefore, Alternatives LRT-4A and LRT-4B should be evaluated further in the PA/ED phase.
Among the freeway alternatives, Alternatives F-6 and F-7 are superior to Alternatives F-2 and F-5 on the measures for the objectives related to the transportation system performance. Alternatives F-6 and F-7 each performed best on either minimizing travel times or improving connectivity and mobility, and they both performed best on the objective of reducing congestion on local streets. The performance on the objectives related to environmental and other concerns distinguished Alternatives F-6 and F-7 from one another. Alternative F-7 would require only a small number of property acquisitions (fewer than 10), compared to the over 400 required for Alternative F-6 in addition to properties that Caltrans already owns. Alternative F-7 would also impact fewer historic period properties and community facilities. Therefore, Alternative F-7 should be evaluated further in the PA/ED phase.
None of the highway alternatives perform well on the measures for objectives related to transportation system performance. They also performed poorly on the measures for objectives related to environmental and other concerns, especially Alternative H-2. Therefore, neither of the highway alternatives should be evaluated further in the PA/ED phase.
SR 710 Study December 2012 Page ES-23
Alternatives Analysis Report Executive Summary
Thus, the alternatives recommended for further evaluation in the PA/ED phase are as follows:
• The No Build Alternative
• The TSM/TDM Alternative
• Alternative BRT-6, with possible refinements as described below
• Alternative LRT-4A/B, with possible refinements as described below
• Alternative F-7, with possible refinements, as described below
Recommended Refinements of Alternatives
No single alternative performs most favorably on all eight project objectives. Therefore, as the alternatives are further evaluated in the PA/ED phase, refinements of these alternatives that improve their performance and reduce their impacts should be developed and considered, as well as alternatives that combine elements of alternatives whose performance complements each other.
Recommended Refinements of Alternatives
In the PA/ED phase, alternatives will be refined first to avoid and then to minimize potential impacts to the extent possible. Where impacts cannot be avoided or minimized, feasible mitigation measures will be identified to reduce impacts. Additional refinements of alternatives that should be investigated in the PA/ED phase include the following:
• The No Build Alternative should be updated to reflect the financially constrained project list in the 2012 Regional Transportation Plan/Sustainable Communities Strategy (RTP/SCS). This plan was adopted by SCAG after the initiation of the AA, but it would be appropriate to update the No Build Alternative in the PA/ED phase to be consistent with the newly adopted plan. The ridership and travel demand forecasting in the PA/ED phase will be based on the 2012 RTP/SCS.
• The TSM/TDM Alternative was found to have potential right-of-way impacts, primarily resulting from the spot intersection and roadway segment improvements included in the alternative. These spot improvements should be refined in coordination with the local jurisdictions to maximize the alternative’s benefits and to minimize its impacts. In addition, these improvements should be refined to identify opportunities to create “complete streets” that enhance the pedestrian and bicycle environment and to ensure that they do not detract from it. The other components of the TSM/TDM Alternative should also be reviewed and refined to look for additional opportunities to improve the performance of the alternative.
• Alternative BRT-6, like all of the BRT alternatives, would displace a large amount of on-street parking. Therefore, refinements should be considered to its design, alignment, and/or operational characteristics to minimize their impact to on-street parking. Refinements should also be considered to maximize ridership and productivity (passengers per bus).
• Alternative LRT-4A/B station locations should be refined to maximize ridership, minimize property impacts, and to facilitate transfers to the Metro Gold line at its northern and southern termini.
Alternative LRT-4A/B could be combined with enhanced bus service, including feeder routes to its stations. By making Alternative LRT-4A/B the spine of a transit network that serves
SR 710 Study December 2012 Page ES-24
Alternatives Analysis Report Executive Summary
destinations to its east and west, and not solely along its alignment, it may be possible to attract additional transit ridership and improve the performance of this alternative.
• Alternative F-7 should incorporate refinements to its design and alignment to minimize its impact. Potential tolled operations to improve its financial feasibility should also be evaluated. Restriction on use by trucks should be evaluated to determine if they are effective at reducing impacts.
Alternative F-7 could be combined with a BRT or other enhanced bus service to improve the performance of this alternative on the performance measures related to the transit system. Alternative F-7 was found to not increase transit ridership or transit mode share. By introducing a well-designed BRT or other enhanced bus service into Alternative F-7, it may be possible to diminish north-south transit travel times through the study area and attract additional transit ridership.
SR 710 Study December 2012 Page ES-25