STATE OF THE WORKFORCEWorkfor orkforce 2014 3 The Workforce Development Council of Seattle-King...
29
STATE OF THE WORKFORCE August 2014
Transcript of STATE OF THE WORKFORCEWorkfor orkforce 2014 3 The Workforce Development Council of Seattle-King...

STATE OF THEWORKFORCE
August 2014
Workforce Development Council State of the Workforce
August 2014 2
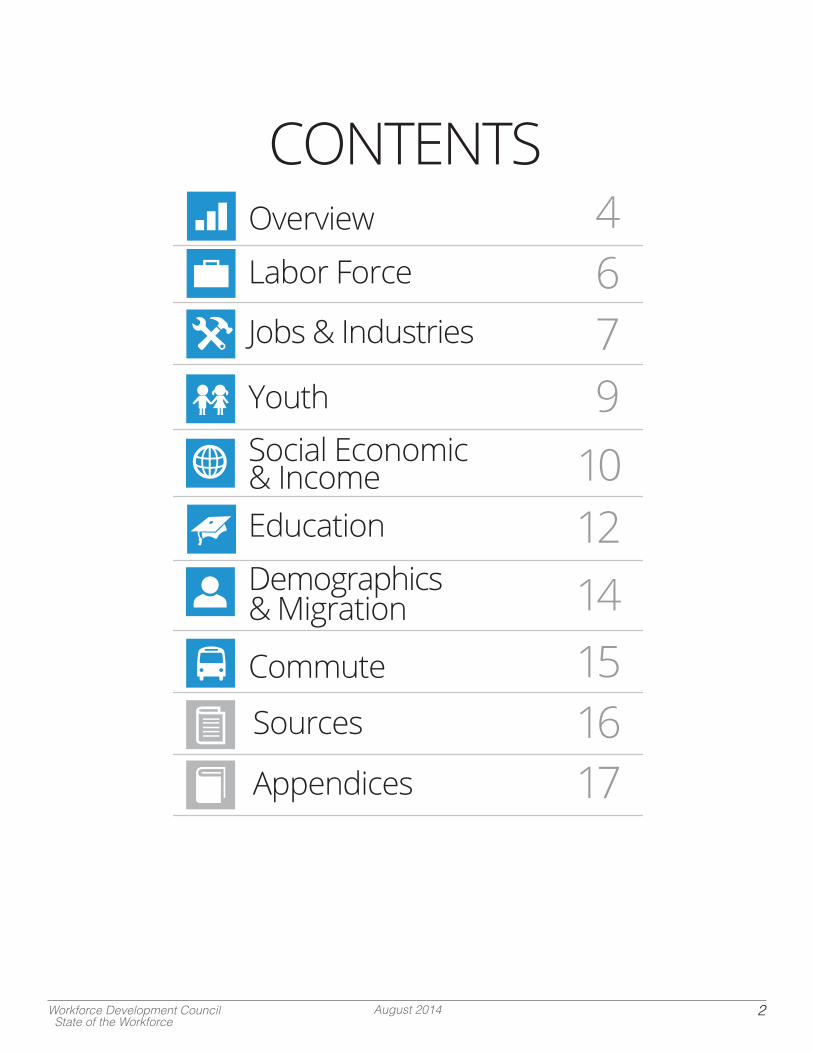
Demographics& Migration
CONTENTSOverview
Social Economic& Income
Commute
Jobs & Industries
Labor Force
Education
Youth
4679
10
15Sources
1412
16Appendices 17

Workforce Development Council State of the Workforce
August 2014 3
The Workforce Development Council of Seattle-King County’s mission requires an understanding of current metrics and trends that shape King County’s economy and work-force. This State of the Workforce Report reflects the WDC’s on-going leadership and innovation in understanding local workforce needs. The report profiles eight facets of community and economic data, designed to ground workforce leaders and job seekers with a common understanding of local needs and opportunities.
206-448-0474
Workforce Development Councilof Seattle-King County2003 Western Ave., Suite 250Seattle, WA 98121
http://seakingwdc.org/StateoftheWorkforce.htmlVisitfor the online interactive version of the report.
Workforce Development Councilof Seattle-King County
Site & Design Credits
206-523-6683
1411 Fourth Ave. Suite 1401Seattle, WA 98101
Community Attributes, Inc

Workforce Development Council State of the Workforce
August 2014 4
Population (2013)
King County
WA State
National
Labor Force (2013)
Unemployment
Avg. days openfor vacancies
GDP (2013)
GDP of U.S. (2012)
Washington GDP (2012 - 14th in U.S.)
Avg. Commute (2012)
Avg. Commute Time
Jobs & Industry (2013 Q1)
124,000Health & Social Assist.109,300Retail
95,800Manufacturing94,600Prof./Sci./Tech. Srvcs.84,200Information84,000Education Srvcs.75,300Food/Hotel Srvcs.57,700Wholesale45,200Trans./Warehouse40,000Finance/Insurance
238,500All Others
Total Jobs
Educational Attainment (2012)
10 Universities29 Colleges & Trade
134 High Schools
Race & Ethnicity (2012)70% White
15% Asian
6% Black
5% Two or More
3% Other
<1% Native American
<1% Pacific Islander
9% Hispanic/Latino
2003 2008 2013
17%
29%
8%
21%
17%
4%
4%
Masters+
Bach.
Assoc.
Some College
H.S.
Some H.S.
< 9th Grade
[32]
[1]
[26]
[25]
[25]
[8, 25]
[7]
[3]
This section provides an overview of the scope and focus of the data in this report, which profiles eight facets of community and economic data. Subjects range from labor, jobs and industries, to youth, education, and migration. These topics are explored further through the rest of the report.
Education Attainment based onpopulation ages 25 and older
OVERVIEW

Workforce Development Council State of the Workforce
August 2014 5
Age (2012)
Household Income (2012)
Poverty & Social Assistance (2012)
PovertyRate
SNAP PublicAssistance
People BelowPoverty Level
12% 12%
15% 15%16%14%
9%7%
Age<10 10-19 20-29 30-39 40-49 50-59 60-69 70+
12% 11% 11%
17%13%
26%
9%
Number of Households by Income Range
<$20k $20-34k $35-49k $50-74k $75-99k $100k $200k+
Foreign-BornPopulation
Foreign Born (2012)
[1]
[25]
[25]
[25]
[25]
OVERVIEW (Cont.)
Workforce Development Council State of the Workforce
August 2014 6
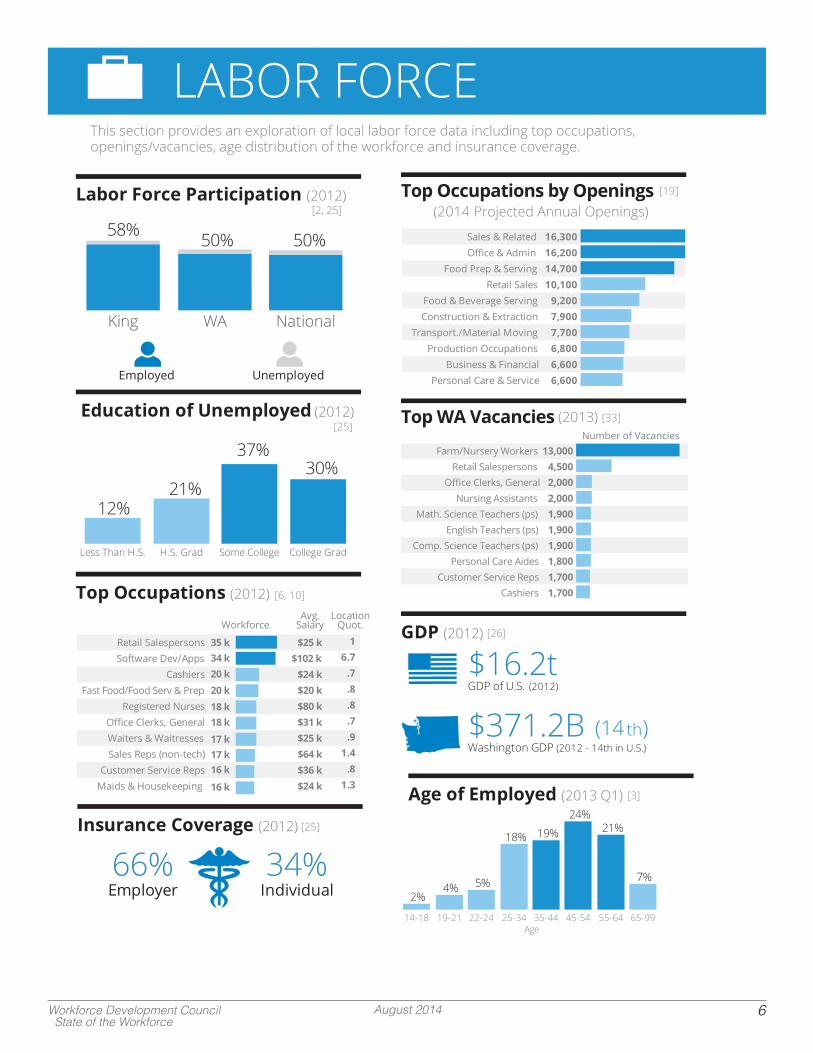
Labor Force Participation (2012)(2014 Projected Annual Openings)
Employed Unemployed
Education of Unemployed (2013)
Top Occupations by Openings
Sales & Related 16,300Office & Admin 16,200
Food Prep & Serving 14,700Retail Sales 10,100
Food & Beverage Serving 9,200Construction & Extraction 7,900
Transport./Material Moving 7,700Production Occupations 6,800
Business & Financial 6,600Personal Care & Service 6,600
GDP (2012)
GDP of U.S. (2012)
Washington GDP (2012 - 14th in U.S.)
Insurance Coverage (2012)
Employer Individual
Top Occupations (2012)
WorkforceAvg.
SalaryLocation
Quot.
Retail Salespersons $25 k35 k34 k20 k20 k18 k18 k17 k17 k16 k
16 k
Software Dev/Apps $102 kCashiers $24 k
Fast Food/Food Serv & Prep $20 kRegistered Nurses $80 k
Office Clerks, General $31 kWaiters & Waitresses $25 kSales Reps (non-tech) $64 k
Customer Service Reps $36 kMaids & Housekeeping $24 k
16.7
.7
.8
.8
.7
.91.4
.81.3 Age of Employed (2013 Q1)
King WA National
12%21%
37%30%
50%50%58%
Less Than H.S. H.S. Grad Some College College Grad
2%4% 5%
18% 19%
24%21%
7%
Age14-18 19-21 22-24 25-34 35-44 45-54 55-64 65-99
[25]
[19]
Top WA Vacancies [33]
[2, 25]
[6, 10]
[25]
[26]
[3]
This section provides an exploration of local labor force data including top occupations, openings/vacancies, age distribution of the workforce and insurance coverage.
Number of VacanciesFarm/Nursery Workers 13,000
Retail Salespersons 4,500Office Clerks, General 2,000
Nursing Assistants 2,000Math. Science Teachers (ps) 1,900
English Teachers (ps) 1,900Comp. Science Teachers (ps) 1,900
Personal Care Aides 1,800Customer Service Reps 1,700
Cashiers 1,700
(2012)
LABOR FORCE

Workforce Development Council State of the Workforce
August 2014 7
[1, 32]
[15]
[3]
[3]
[3]
[4]
By the Numbers (2012-2013)
Unemployment Rate
Population
Per Capita Income
Largest Employers (2012)
Total Employees in Puget Sound85,000Boeing56,000JBLM43,000Navy Region41,664Microsoft29,800UW20,240Prov. Health18,000Walmart14,590Fred Meyer12,993King Co. Govt.
Age of Employed (2013 Q1)
Jobs by County (2012)
1.16m257k-264k79k-199k<46k
Wages By Industry (2013)
Information $133 kFinance/Insurance $120 k
Prof./Sci./Tech. Srvcs. $93 kManagement Srvcs. $85 k
Ag. & Ntrl. Rsrcs. $84 kManufacturing $83 k
Wholesale $80 kUtilities $75 k
Public Admin. $64 kTrans./Warehouse $63 k
Change & Forecasts
2010-2020CAGR
2000-2010CAGR
Manufacturing -3.0% 2.9%Retail 3.6% 1.9%
Finance,Insurance -1.1% 3.0%Govt. 0.5% 1.0%
Education 1.3% 0.2%Construction -2.8% 3.5%
2%4% 5%
18% 19%24%
21%
7%
Age14-18 19-21 22-24 25-34 35-44 45-54 55-64 65-99
Change represented with Compound Annual Growth Rates (CAGR).
This section provides an exploration of local jobs and industries data including distribution and concentration of jobs, wages by industry, largest employers, age of employed and location quotients.
JOBS & INDUSTRIES
Workforce Development Council State of the Workforce
August 2014 8
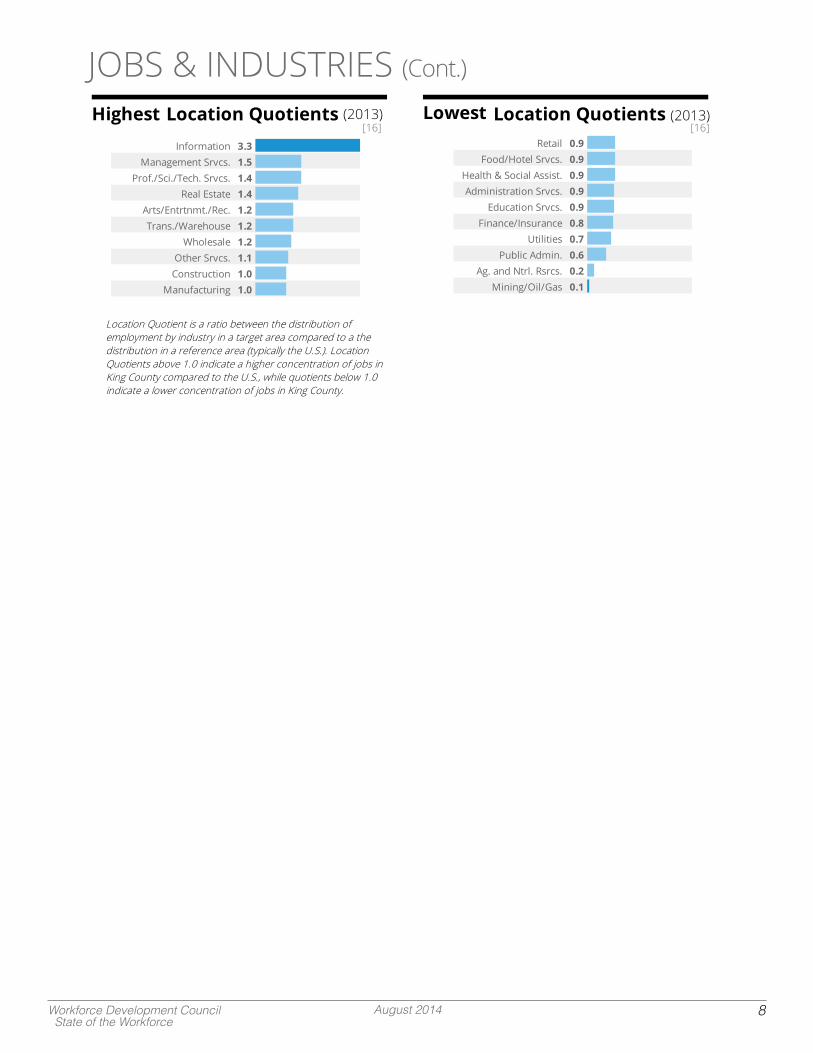
Information 3.3Management Srvcs. 1.5
Prof./Sci./Tech. Srvcs. 1.4Real Estate 1.4
Arts/Entrtnmt./Rec. 1.2Trans./Warehouse 1.2
Wholesale 1.2Other Srvcs. 1.1
Construction 1.0Manufacturing 1.0
Lowest Location Quotients (2013)
Retail 0.9Food/Hotel Srvcs. 0.9
Health & Social Assist. 0.9Administration Srvcs. 0.9
Education Srvcs. 0.9Finance/Insurance 0.8
Utilities 0.7Public Admin. 0.6
Ag. and Ntrl. Rsrcs. 0.2Mining/Oil/Gas 0.1
Highest Location Quotients (2013)
Location Quotient is a ratio between the distribution ofemployment by industry in a target area compared to a thedistribution in a reference area (typically the U.S.). LocationQuotients above 1.0 indicate a higher concentration of jobs inKing County compared to the U.S., while quotients below 1.0indicate a lower concentration of jobs in King County.
[16] [16]
JOBS & INDUSTRIES (Cont.)

Workforce Development Council State of the Workforce
August 2014 9
Youth Population (2012)
K-12 SchoolPop.
College &University Pop.
Youth Unemployment (2013)
King Co. WA National
Language Spoken at Home (2012)
Speak only English 73%
Spanish 7%
Chinese 3%
African languages 2%
Tagalog 2%
Disconnected Youth (2012)
Individuals
English(ELL)
Language Learner (2012)
Students
Low Income Children (2012)
Households
Students of Color (2012)
Individuals
19.8% 22.9% 22.8%
4.8%6.1% 6.2%
King WA U.S.
10% 9% 10%
King WA U.S.
16% 19%23%
King WA U.S.
50%41%
50%
King WA U.S.
Avg. College Costs (2012)
Per Year Supplies Per Year
SAT Score Average (2012)
WA National
8th/10th Grade Test Results (2012-13)
King County Results Breakdown
62%Math (8th)
71%Science (8th)
86%Reading (10th)
87%Writing (10th)
76% 71%
King WA
[25]
[7, 9]
[14, 25]
[25]
[25]
[29]
[24]
[25]
[21, 32]
[12,17]
Households with children under the federal poverty level.
Disconnected youth is a measure of all people age 16 to 21 that live in housing units (not group quarters), are not enrolled in school, and are not in the labor force.
This section provides youth-relevant data including unemployment rate, disconnected youth, English Language Learner (ELL), youth below the poverty level, and education scores, diversity and average college costs.
Based on employment status for ages 16 - 21.
YOUTH

Workforce Development Council State of the Workforce
August 2014 10
Poverty Rate (2012)
King Co. WA National
People Below PovertyLevel in King County
Population
King Co. Pop. Increasedfrom 2000 to 2013
Income By Race & Ethnicity (2012)
King WA U.S.Asian $76K $70K $72KBlack $40K $41K $36K
Nat Amer $43K $42K $37KPac Isl $60K $58K $55KWhite $75K $61K $56KOther $45K $39K $40K
2 or More $60K $51K $47K
Hispanic $49K $42K $42K
Med. Household Income (2012)
King Co.
WA
National
Per Capita Income (2012)
King Co.
WA
National
Avg. Minimum Wage (2014)
King Co. National
[25]
[27]
[32]
[25] [25]
[25]Median Annual Household Income
This section presents local social and economic data including poverty rate, household income, population and public assistance.
SOCIAL ECON & INCOME

Workforce Development Council State of the Workforce
August 2014 11
SNAP (Food Stamps) (2012)
Households
Supplemental Security Income(SSI) (2012)
Households
Public Assistance (2012)
Households
Women, Infant, Child (WIC) (2012)
Individuals
9%12% 11%
King WA U.S.
3% 4% 5%
King WA U.S.
3%4%
3%
King WA U.S.
35%50% 53%
King WA U.S.
[25]
[25]
[25]
[23, 5]
Households receiving Food Stamp / Supple-mental Nutrition Assistance (SNAP) in the last 12 months.
Households receiving public assistance (TANF, GA, or AFDC) in the last 12 months.
SOCIAL ECON & INCOME (Cont.)
Workforce Development Council State of the Workforce
August 2014 12
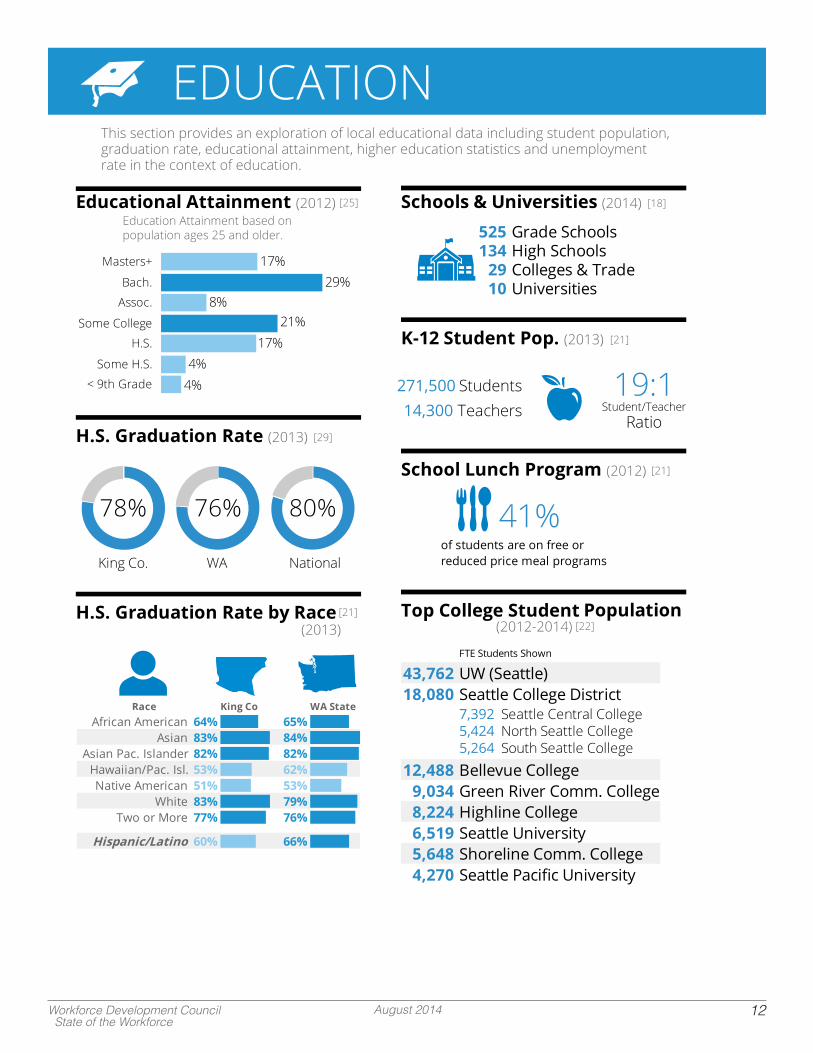
Educational Attainment (2012)
H.S. Graduation Rate (2013)
King Co. WA National
H.S. Graduation Rate by Race (2013)
King Co WA StateRaceAfrican American 64% 65%
Asian 83% 84%Asian Pac. Islander 82% 82%
Hawaiian/Pac. Isl. 53% 62%Native American 51% 53%
White 83% 79%Two or More 77% 76%
Hispanic/Latino 60% 66%
Schools & Universities (2014)
525 Grade Schools134 High Schools
29 Colleges & Trade10 Universities
K-12 Student Pop. (2013)
271,500 Students14,300 Teachers Student/Teacher
Ratio
School Lunch Program (2012)
of students are on free orreduced price meal programs
Top College Student Population (2012-2014)
FTE Students Shown
43,762 UW (Seattle)18,080 Seattle College District
7,392 Seattle Central College5,424 North Seattle College5,264 South Seattle College
12,488 Bellevue College9,034 Green River Comm. College8,224 Highline College6,519 Seattle University5,648 Shoreline Comm. College4,270 Seattle Pacific University
17%29%
8%21%
17%4%
4%
Masters+
Bach.
Assoc.
Some College
H.S.
Some H.S.
< 9th Grade
[21]
[21]
[18]
[22][21]
[29]
[25]
This section provides an exploration of local educational data including student population, graduation rate, educational attainment, higher education statistics and unemployment rate in the context of education.
Education Attainment based on population ages 25 and older.
EDUCATION

Workforce Development Council State of the Workforce
August 2014 13
Top Majors (2012)
L. Arts & Sciences/Liberal Studies 4,652Business Admin/Management 1,987
Registered Nursing 1,267Medical/Clinical Assistant 977
Psychology 794Education 753
Accounting & Bookkeeping 720Cosmetology/Cosmetologist 668
Business/Commerce 657Speech Comm. & Rhetoric 649
Unemployment by Education (2012)
King Co NationalNo High School 12% 14%
High School 8% 9%Bachelors Degree 4% 4%
Student vs. Retired Population (2012)
Persons Persons<18 yrs old 65+ yrs old
[11][25]
[25]
EDUCATION (Cont.)
Workforce Development Council State of the Workforce
August 2014 14
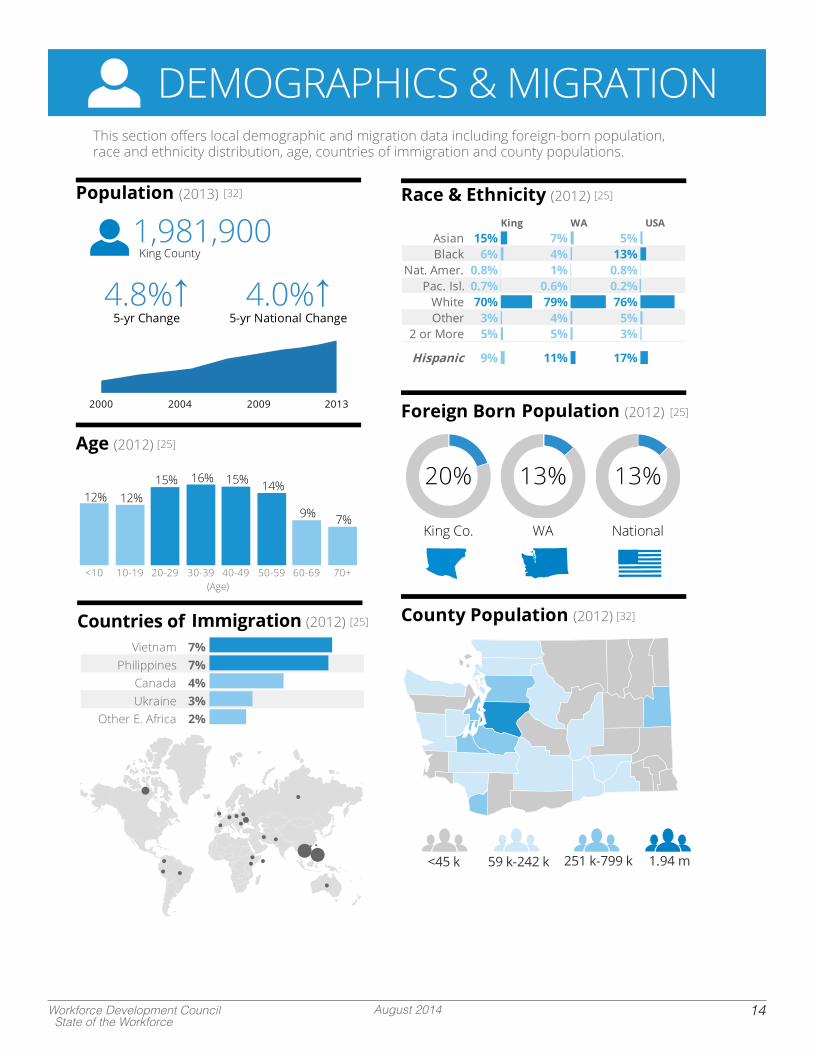
Population (2013)
King County
5-yr Change 5-yr National Change
Age (2012)
Race & Ethnicity (2012)
King WA USAAsian 15% 7% 5%Black 6% 4% 13%
Nat. Amer. 0.8% 1% 0.8%Pac. Isl. 0.7% 0.6% 0.2%
White 70% 79% 76%Other 3% 4% 5%
2 or More 5% 5% 3%
Hispanic 9% 11% 17%
Foreign Born Population (2012)2000 2004 2009 2013
12% 12%15% 16% 15% 14%
9% 7%
(Age)<10 10-19 20-29 30-39 40-49 50-59 60-69 70+
King Co. WA National
County Population (2012)
1.94 m251 k-799 k59 k-242 k<45 k
7%Vietnam7%Philippines4%Canada3%Ukraine2%Other E. Africa
Countries of Immigration (2012)
[32]
[25]
[25]
[25]
[25]
[32]
This section offers local demographic and migration data including foreign-born population, race and ethnicity distribution, age, countries of immigration and county populations.
DEMOGRAPHICS & MIGRATION

Workforce Development Council State of the Workforce
August 2014 15
King County Population (2013)
Fares Compared (2014)
$2.50Per Ride
$20Vehicle
$2.50Per Ride
$7Passenger
$2.75 - $5.25Sounder FaresVary by Distance
King County Metro (2013)
Daily Ridership (Weekday)
Annual Ridership
WA Ferry System (2012)
Daily Ridership (Weekday)
Annual Ridership (Passengers & Vehicles)
Means of Transportation (2012)
Car orTruck
Bus orTrolley
Rail Subway Ferry Street Car
Sound Transit Light Rail (2014)
Daily Ridership (Weekday)
Annual Ridership
Sounder Commuter Rail (2014)
Daily Ridership (Weekday)
Annual Ridership
Avg. Commute Time (2012)
King Co.
National
87%
12%.3% .2% .1% <.1%
Largest passenger &automobile ferry fleet in the U.S.
Largest ferry system in theworld by fleet size (WA System)
Largest transit agency in theU.S.
Busiest airport in the U.S. isSEA-TAC
By the Numbers (2014)
[30]
[13]
[25]
[8]
[32] [25]
[13, 28]
[20]
[20]
Means of transportation to work refers to the principal mode of travel that the worker usually used to get from home to work.
This section presents local commute and transportation data including commute time, ridership by mode of transportation, means of transportation to work and transit system statistics.
COMMUTE

Workforce Development Council State of the Workforce
August 2014 16
2003-2013 Local Area Unemployment Statistics from U.S. Department of Labor: Bureau of Labor Statistics, 2014.
2013 Local Area Unemployment Statistics (LAUS) from the U.S. Department of Labor: Bureau of Labor Statistics, 2014.
2013 Q1 Longitudinal Employer-Household Dynamics Quarterly Workforce Indicators from the Center for Economic Studies at the U.S. Census Bureau, 2014.
2020 forecasts from Puget Sound Regional Council Land Use Baseline Small Area Forecasts, 2013.
About WIC-WIC at a Glance from U.S. Dept. of Agriculture: Food and Nutrition Service, 2014.
Employment by Detailed Occupation and Occupational Employment Statistics from U.S. Department of Labor: Bureau of Labor Statistics, 2014.
English Language Learners from State of Washington Office of Superintendent of Public Instruction, 2014.
Fares figures gathered from agency websites.
Fast Facts English Language Learners from National Center for Education Statistics, 2014.
Industry Occupation Matrix from Washington State Economic Security Department, 2014.
Integrated Postsecondary Education Data Systems from National Center For Education Statistics, 2013.
K-12 Data and Reports from Washington State Office of Superintendent of Public Instruction, 2014.
King County Metro Online Accountability Center, 2014.
October Enrollment Report from Washington State Office of Superintendent of Public Instruction, 2014.
Puget Sound Business Journal, 2014.
Quarterly Census of Employment and Wages from U.S. Department of Labor: Bureau of Labor Statistics, 2014.
Racial/Ethnic Enrollment in Public Schools from National Center for Education Statistics, 2014.
School listings at washington.schooltree.org and other online research.
Short-term Occupational Projections from Washington State Economic Security Dept., 2014.
Sound Transit Operations February 2014 Service Performance Report, 2014.
State of Washington Office of Superintendent of Public Instruction, 2014.
Student counts collected from individual college websites.
Supplemental Nutrition Program for Women, Infants and Children (WIC) from Washington State Department of Health, 2014.
Trends in Higher Education from http://collegeboard.org, 2014.
American Community Survey, 5Yr Dataset from U.S. Census Bureau, 2008-2012.
U.S. Department of Commerce: Bureau of Economic Analysis, 2014.
Wage and Hour Division from U.S. Department of Labor, 2014.
Washington State Dept. of Transportation, 2014. King County Metro, 2014. Port of Seattle, 2014.
Washington State Report Card from State of Washington Office of Superintendent of Public Instruction, 2014.
WSF Traffic Statistics from Washington State Department of Transportation, 2014.
http://sat.collegeboard.org.
Yearly April 1 population estimates from Washington State Office of Financial Management, 2014.
1
2
3
4
5
6
7
89
10
11
12
13
14
15
16
1718
1920
2122
23
24
25
26
27
28
29
30
31
32
SOURCES
Workforce Development Council State of the Workforce
August 2014 17
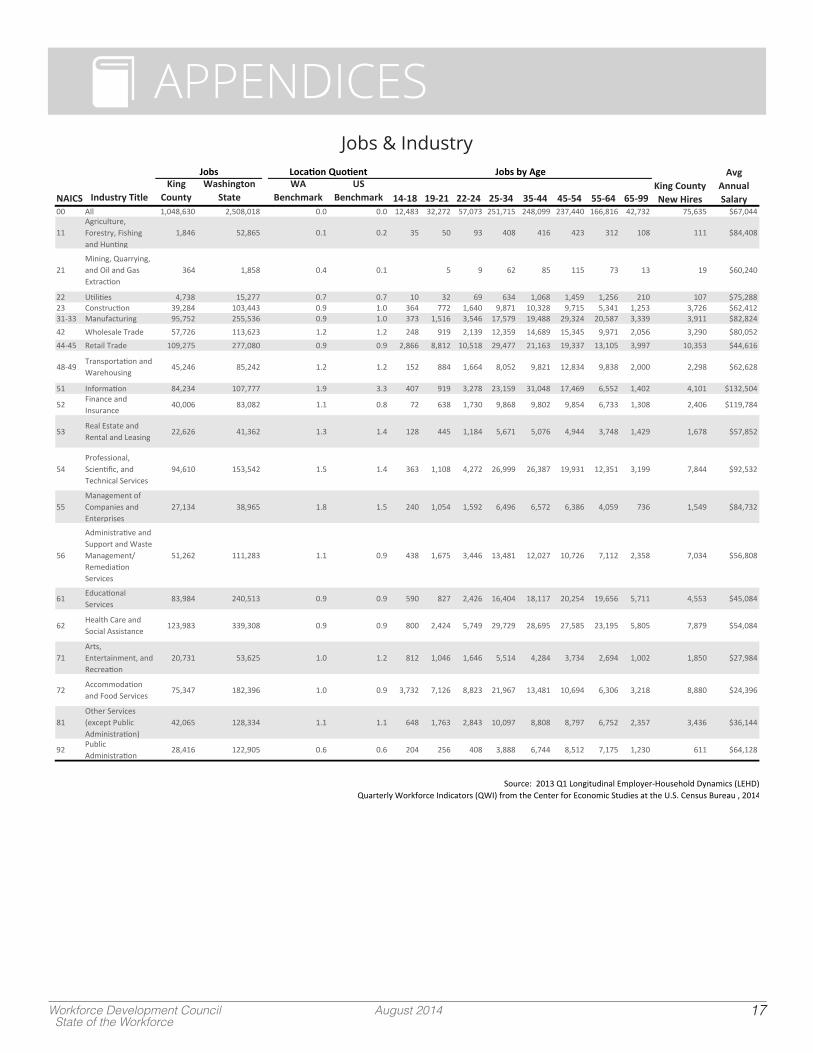
APPENDICES
NAICS Industry TitleKing
CountyWashington
StateWA
BenchmarkUS
Benchmark 14-18 19-21 22-24 25-34 35-44 45-54 55-64 65-9900 All 1,048,630 2,508,018 0.0 0.0 12,483 32,272 57,073 251,715 248,099 237,440 166,816 42,732 75,635 $67,044
11Agriculture, Forestry, Fishing and Hunting
1,846 52,865 0.1 0.2 35 50 93 408 416 423 312 108 111 $84,408
21Mining, Quarrying, and Oil and Gas Extraction
364 1,858 0.4 0.1 5 9 62 85 115 73 13 19 $60,240
22 Utilities 4,738 15,277 0.7 0.7 10 32 69 634 1,068 1,459 1,256 210 107 $75,28823 Construction 39,284 103,443 0.9 1.0 364 772 1,640 9,871 10,328 9,715 5,341 1,253 3,726 $62,41231-33 Manufacturing 95,752 255,536 0.9 1.0 373 1,516 3,546 17,579 19,488 29,324 20,587 3,339 3,911 $82,82442 Wholesale Trade 57,726 113,623 1.2 1.2 248 919 2,139 12,359 14,689 15,345 9,971 2,056 3,290 $80,05244-45 Retail Trade 109,275 277,080 0.9 0.9 2,866 8,812 10,518 29,477 21,163 19,337 13,105 3,997 10,353 $44,616
48-49Transportation and Warehousing
45,246 85,242 1.2 1.2 152 884 1,664 8,052 9,821 12,834 9,838 2,000 2,298 $62,628
51 Information 84,234 107,777 1.9 3.3 407 919 3,278 23,159 31,048 17,469 6,552 1,402 4,101 $132,504
52Finance and Insurance
40,006 83,082 1.1 0.8 72 638 1,730 9,868 9,802 9,854 6,733 1,308 2,406 $119,784
53Real Estate and Rental and Leasing
22,626 41,362 1.3 1.4 128 445 1,184 5,671 5,076 4,944 3,748 1,429 1,678 $57,852
54Professional, Scientific, and Technical Services
94,610 153,542 1.5 1.4 363 1,108 4,272 26,999 26,387 19,931 12,351 3,199 7,844 $92,532
55Management of Companies and Enterprises
27,134 38,965 1.8 1.5 240 1,054 1,592 6,496 6,572 6,386 4,059 736 1,549 $84,732
56
Administrative and Support and Waste Management/ Remediation Services
51,262 111,283 1.1 0.9 438 1,675 3,446 13,481 12,027 10,726 7,112 2,358 7,034 $56,808
61Educational Services
83,984 240,513 0.9 0.9 590 827 2,426 16,404 18,117 20,254 19,656 5,711 4,553 $45,084
62Health Care and Social Assistance
123,983 339,308 0.9 0.9 800 2,424 5,749 29,729 28,695 27,585 23,195 5,805 7,879 $54,084
71Arts, Entertainment, and Recreation
20,731 53,625 1.0 1.2 812 1,046 1,646 5,514 4,284 3,734 2,694 1,002 1,850 $27,984
72Accommodation and Food Services
75,347 182,396 1.0 0.9 3,732 7,126 8,823 21,967 13,481 10,694 6,306 3,218 8,880 $24,396
81Other Services (except Public Administration)
42,065 128,334 1.1 1.1 648 1,763 2,843 10,097 8,808 8,797 6,752 2,357 3,436 $36,144
92Public Administration
28,416 122,905 0.6 0.6 204 256 408 3,888 6,744 8,512 7,175 1,230 611 $64,128
Jobs by AgeJobs Location QuotientKing County New Hires
Avg Annual Salary
Source: 2013 Q1 Longitudinal Employer-Household Dynamics (LEHD)Quarterly Workforce Indicators (QWI) from the Center for Economic Studies at the U.S. Census Bureau , 2014
Jobs & Industry

Workforce Development Council State of the Workforce
August 2014 18
Occupations, Projected Openings Vacancies
SOC Occupation gniKeltiT CountyWashington
StateWA
BenchmarkUS
BenchmarkProjected Openings
WA State Vacancies
11-0000 Management A/N904,30.13.1745,931927,17snoitapuccO11- poT0001 A/N6358.01.1736,23497,41sevitucexE
11-1011 Chief Executives 1,578 3,293 1.2 0.6 91 N/A11- lareneG1201 and Operations Managers 13,087 28,473 1.2 0.8 442 N/A11-1031 Legislators 129 871 0.4 0.3 3 N/A
11-2000 Advertising, Marketing, Promotions, Public Relations, and Sales Managers 11,430 17,884 1.6 2.2 611 N/A11- gnisitrevdA1102 and Promotions Managers 434 586 1.9 1.5 26 N/A11- gnitekraM1202 Managers 4,624 5,925 2.0 3.1 271 N/A11-2022 Sales Managers 4,895 8,221 1.5 1.6 252 N/A11- cilbuP1302 Relations and Fundraising Managers 1,477 3,152 1.2 2.9 62 N/A
11- snoitarepO0003 Specialties A/N4296.14.1297,83203,22sreganaM11- evitartsinimdA1103 Services Managers 2,857 5,500 1.3 1.2 106 N/A11- retupmoC1203 and Information Systems Managers 7,350 10,155 1.8 2.7 315 N/A11- laicnaniF1303 Managers 5,896 11,137 1.3 1.3 225 N/A11- lairtsudnI1503 Production Managers 1,146 3,018 1.0 0.8 46 N/A11- gnisahcruP1603 Managers 1,003 1,801 1.4 1.7 50 N/A11- ,noitatropsnarT1703 Storage, and Distribution Managers 1,671 3,071 1.4 1.9 65 N/A11- noitasnepmoC1113 and Benefits Managers 221 360 1.5 1.3 11 N/A11- namuH1213 Resources Managers 1,743 3,113 1.4 2.1 85 N/A11- gniniarT1313 and Development Managers 415 637 1.6 1.8 21 N/A
11-9000 Other Management A/N833,17.02.1432,05302,32snoitapuccO11- ,sremraF3109 Ranchers, and Other Agricultural Managers 25 750 0.1 0.0 2 N/A11- noitcurtsnoC1209 Managers 2,315 4,573 1.3 0.6 175 N/A11- noitacudE1309 Administrators, Preschool and Childcare Center/Program 361 783 1.2 0.7 16 N/A11- noitacudE2309 Administrators, Elementary and Secondary School 1,198 4,585 0.7 0.6 42 N/A11- noitacudE3309 Administrators, Postsecondary 1,156 2,327 1.2 0.9 46 N/A11- noitacudE9309 Administrators, All Other 431 762 1.4 1.5 18 N/A11- larutcetihcrA1409 and Engineering Managers 2,907 5,997 1.2 1.8 110 N/A11- dooF1509 Service Managers 2,111 3,728 1.4 0.8 132 N/A11- larenuF1609 Service Managers 44 86 1.3 0.6 1 N/A11-9071 Gaming Managers 51 205 0.6 1.3 1 N/A11-9081 Lodging Managers 166 447 0.9 0.4 9 N/A11- lacideM1119 and Health Services Managers 4,191 8,063 1.3 1.6 174 N/A11- larutaN1219 Sciences Managers 784 1,866 1.1 1.8 42 N/A11- sretsamtsoP1319 and Mail Superintendents 29 399 0.2 0.2 0 N/A11- ,ytreporP1419 Real Estate, and Community Association Managers 2,314 4,322 1.3 0.9 169 N/A11- laicoS1519 and Community Service Managers 1,012 3,351 0.8 0.9 46 N/A11- ycnegremE1619 Management Directors 54 170 0.8 0.7 2 N/A11- ,sreganaM9919 All Other 4,054 7,820 1.3 0.5 353 N/A
13-0000 Business and Financial Operations A/N507,35.13.1209,461657,78snoitapuccO13- ssenisuB0001 Operations A/N945,27.13.1692,311836,06stsilaicepS
13- stnegA1101 and Business Managers of Artists, Performers, and Athletes 30 61 1.2 0.2 1 N/A13- sreyuB1201 and Purchasing Agents, Farm Products 116 277 1.1 1.0 5 N/A13- elaselohW2201 and Retail Buyers, Except Farm Products 2,109 3,675 1.4 2.0 97 N/A13- gnisahcruP3201 Agents, Except Wholesale, Retail, and Farm Products 3,756 9,220 1.0 1.5 162 N/A13- smialC1301 Adjusters, Examiners, and Investigators 3,415 6,592 1.3 1.4 99 N/A13- ecnarusnI2301 Appraisers, Auto Damage 16 51 0.8 0.1 0 N/A13- ecnailpmoC1401 Officers 2,661 7,246 0.9 1.3 59 N/A13-1051 Cost Estimators 1,977 5,122 1.0 1.2 118 N/A13- namuH1701 Resources Specialists 5,396 10,470 1.3 1.6 231 N/A13- mraF4701 Labor Contractors 0 261 0.0 0.0 N/A N/A13- robaL5701 Relations Specialists 1,035 1,896 1.4 1.6 27 N/A13-1081 Logisticians 3,391 6,837 1.2 3.3 105 N/A13- tnemeganaM1111 Analysts 8,249 12,210 1.7 1.4 410 N/A13- ,gniteeM1211 Convention, and Event Planners 970 1,927 1.3 1.2 56 N/A13-1131 Fundraisers 1,217 2,503 1.2 2.2 56 N/A13- ,noitasnepmoC1411 Benefits, and Job Analysis Specialists 995 1,706 1.5 1.3 36 N/A13- gniniarT1511 and Development Specialists 2,173 4,009 1.4 1.2 75 N/A13- tekraM1611 Research Analysts and Marketing Specialists 9,123 12,877 1.8 2.7 515 N/A13- ssenisuB9911 Operations Specialists, All Other 14,009 26,356 1.3 1.7 497 N/A
13- laicnaniF0002 A/N651,12.13.1606,15811,72stsilaicepS13- stnatnuoccA1102 and Auditors 12,659 24,689 1.3 1.2 554 N/A13- sresiarppA1202 and Assessors of Real Estate 373 1,112 0.8 0.5 18 N/A13-2031 Budget Analysts 1,316 2,291 1.4 2.6 37 N/A13-2041 Credit Analysts 527 1,123 1.2 1.0 21 N/A13-2051 Financial Analysts 2,850 3,971 1.8 1.4 145 N/A13- lanosreP2502 Financial Advisors 2,316 3,576 1.6 1.3 85 N/A13- ecnarusnI3502 Underwriters 1,626 2,597 1.6 1.9 68 N/A13- laicnaniF1602 Examiners 223 388 1.4 0.9 6 N/A13-2071 Credit Counselors 256 630 1.0 1.0 14 N/A13-2072 Loan Officers 2,527 5,770 1.1 1.0 131 N/A13- xaT1802 Examiners and Collectors, and Revenue Agents 432 1,308 0.8 0.8 9 N/A13-2082 Tax Preparers 610 1,473 1.0 0.8 25 N/A13- laicnaniF9902 Specialists, All Other 1,403 2,678 1.3 1.1 43 N/A
15-0000 Computer and Mathematical A/N044,41.38.1846,431887,89snoitapuccO15- retupmoC0001 A/N923,42.39.1786,031075,69stsilaicepS
15- retupmoC1111 and Information Research Scientists 311 762 1.0 1.4 15 N/A15- retupmoC1211 Systems Analysts 9,703 13,755 1.8 2.3 470 N/A15- noitamrofnI2211 Security Analysts 1,797 2,490 1.8 2.9 71 N/A15- retupmoC1311 Programmers 10,600 12,708 2.1 3.7 566 N/A
Occupations Location Quotient
&Occupations, Projected Openings & Vacancies
Source: Industry Occupation Matrix, Job Vacancy Survey Report, and Short Term Occupational Projectections from WA Employment Security Dept. (ESD), 2014Employment by Occupation from U.S. Dept of Labor Bureau of Labor Statistics (BLS), 2012

Workforce Development Council State of the Workforce
August 2014 19
SOC Occupation gniKeltiT CountyWashington
StateWA
BenchmarkUS
BenchmarkProjected Openings
WA State Vacancies
15- erawtfoS2311 Developers, Applications 34,148 40,483 2.1 6.7 1,380 N/A15- erawtfoS3311 Developers, Systems Software 12,435 14,607 2.1 3.7 430 78215-1134 Web Developers 3,210 4,571 1.8 2.7 180 N/A15- esabataD1411 Administrators 1,692 2,721 1.6 1.7 67 N/A15- krowteN2411 and Computer Systems Administrators 4,566 9,193 1.2 1.5 193 N/A15- retupmoC3411 Network Architects 3,084 4,276 1.8 2.6 115 N/A15- retupmoC1511 User Support Specialists 8,766 14,398 1.5 1.9 523 N/A15- retupmoC2511 Network Support Specialists 2,347 4,868 1.2 1.6 125 N/A15- retupmoC9911 Occupations, All Other 3,911 5,855 1.7 2.3 194 N/A
15- lacitamehtaM0002 A/N1110.24.1169,3812,2stsitneicS15-2011 Actuaries 333 524 1.6 1.7 20 N/A15-2021 Mathematicians 98 160 1.5 3.4 3 N/A15- snoitarepO1302 Research Analysts 1,121 2,019 1.4 1.9 56 N/A15-2041 Statisticians 652 1,221 1.3 2.9 32 N/A15- lacitamehtaM1902 Technicians 9 21 1.1 0.6 N/A N/A15- lacitamehtaM9902 Science Occupations, All Other 5 16 0.8 0.3 N/A N/A
17-0000 Architecture and Engineering A/N615,16.10.1254,87126,23snoitapuccO17- ,stcetihcrA0001 Surveyors, and A/N9324.26.1524,5235,3srehpargotraC
17- ,stcetihcrA1101 Except Landscape and Naval 2,482 3,464 1.8 2.8 173 N/A17- epacsdnaL2101 Architects 559 677 2.1 3.4 37 N/A17- srehpargotraC1201 and Photogrammetrists 158 421 0.9 1.6 9 N/A17-1022 Surveyors 333 863 1.0 1.0 20 N/A
17- A/N120,17.11.1963,35993,22sreenignE000217- ecapsoreA1102 Engineers 2,764 8,188 0.8 4.0 56 N/A17- larutlucirgA1202 Engineers 4 52 0.2 0.2 N/A N/A17- lacidemoiB1302 Engineers 216 280 1.9 1.3 13 N/A17- lacimehC1402 Engineers 105 465 0.6 0.4 6 N/A17-2051 Civil Engineers 5,702 12,782 1.1 2.5 272 N/A17- retupmoC1602 Hardware Engineers 1,006 1,717 1.5 1.5 46 N/A17- lacirtcelE1702 Engineers 2,221 5,474 1.0 1.6 107 N/A17- scinortcelE2702 Engineers, Except Computer 1,840 3,555 1.3 1.6 73 N/A17- latnemnorivnE1802 Engineers 844 1,722 1.2 1.9 43 N/A17-2111 Health and Safety Engineers, Except Mining Safety Engineers and Inspectors 110 572 0.5 0.6 6 N/A17- lairtsudnI2112 Engineers 2,317 5,891 1.0 1.3 97 N/A17- eniraM1212 Engineers and Naval Architects 309 668 1.2 5.1 15 N/A17- slairetaM1312 Engineers 588 1,188 1.2 3.1 37 N/A17- lacinahceM1412 Engineers 2,564 5,795 1.1 1.2 161 N/A17- gniniM1512 and Geological Engineers, Including Mining Safety Engineers 27 144 0.5 0.4 2 N/A17-2161 Nuclear Engineers 4 1,095 0.0 0.0 N/A N/A17- muelorteP1712 Engineers 8 159 0.1 0.0 N/A N/A17- ,sreenignE9912 All Other 1,770 3,622 1.2 1.6 87 N/A
17- ,sretfarD0003 Engineering, and Mapping A/N6522.19.0856,91096,6snaicinhceT17- larutcetihcrA1103 and Civil Drafters 800 1,671 1.2 1.1 38 N/A17- lacirtcelE2103 and Electronics Drafters 337 1,122 0.8 1.4 12 N/A17- lacinahceM3103 Drafters 932 2,761 0.8 1.7 33 N/A17-3019 Drafters, All Other 313 718 1.1 2.4 18 N/A17- ecapsoreA1203 Engineering and Operations Technicians 430 757 1.4 5.3 5 N/A17- liviC2203 Engineering Technicians 541 2,311 0.6 0.9 18 N/A17- lacirtcelE3203 and Electronics Engineering Technicians 829 2,344 0.9 0.7 30 N/A17- ortcelE4203 -Mechanical Technicians 78 166 1.2 0.5 2 N/A17- latnemnorivnE5203 Engineering Technicians 229 497 1.2 1.5 13 N/A17- lairtsudnI6203 Engineering Technicians 849 2,634 0.8 1.5 27 N/A17- lacinahceM7203 Engineering Technicians 349 1,100 0.8 0.9 16 N/A17- gnireenignE9203 Technicians, Except Drafters, All Other 657 2,476 0.7 1.2 25 N/A17- gniyevruS1303 and Mapping Technicians 346 1,101 0.8 0.8 19 N/A
19-0000 Life, Physical, and Social Science A/N6096.11.1248,63928,61snoitapuccO19- efiL0001 A/N1037.24.1584,11484,6stsitneicS
19-1011 Animal Scientists 7 22 0.8 0.3 N/A N/A19- dooF2101 Scientists and Technologists 62 253 0.6 0.4 4 N/A19- lioS3101 and Plant Scientists 15 466 0.1 0.1 1 N/A19- stsimehcoiB1201 and Biophysicists 197 284 1.7 0.8 15 N/A19-1022 Microbiologists 306 505 1.5 1.8 15 N/A19- stsigolooZ3201 and Wildlife Biologists 836 1,939 1.1 5.0 37 N/A19- lacigoloiB9201 Scientists, All Other 803 1,371 1.5 2.8 32 N/A19- noitavresnoC1301 Scientists 98 721 0.3 0.5 1 N/A19-1032 Foresters 108 747 0.4 1.1 2 N/A19-1041 Epidemiologists 189 280 1.7 4.5 6 N/A19- lacideM2401 Scientists, Except Epidemiologists 3,613 4,498 2.0 4.2 180 N/A19- efiL9901 Scientists, All Other 250 399 1.6 3.1 7 N/A
19- lacisyhP0002 A/N3427.12.1611,9912,4stsitneicS19-2011 Astronomers 34 33 2.6 1.5 1 N/A19-2012 Physicists 388 766 1.3 2.3 27 N/A19- cirehpsomtA1202 and Space Scientists 178 235 1.9 1.9 6 N/A19-2031 Chemists 653 2,136 0.8 0.9 39 N/A19- slairetaM2302 Scientists 210 459 1.2 3.1 9 N/A19- latnemnorivnE1402 Scientists and Specialists, Including Health 1,796 3,708 1.2 2.4 107 N/A19- ,stsitneicsoeG2402 Except Hydrologists and Geographers 605 978 1.6 1.9 37 N/A19-2043 Hydrologists 149 380 1.0 2.4 9 N/A19- lacisyhP9902 Scientists, All Other 206 421 1.2 0.8 8 N/A
19- laicoS0003 Scientists and Related A/N9411.10.1318,6837,2srekroW19-3011 Economists 121 273 1.1 0.9 7 N/A
Occupations, Projected Openings Vacancies&Location QuotientOccupations
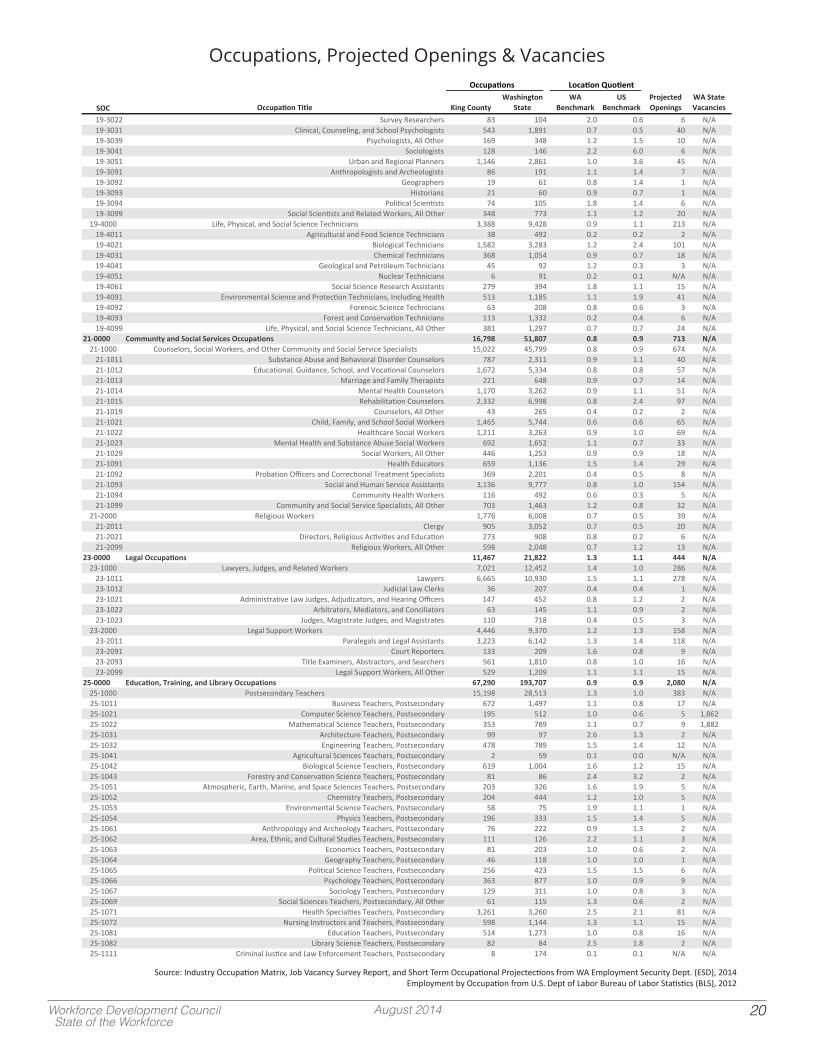
Occupations, Projected Openings & Vacancies
Source: Industry Occupation Matrix, Job Vacancy Survey Report, and Short Term Occupational Projectections from WA Employment Security Dept. (ESD), 2014Employment by Occupation from U.S. Dept of Labor Bureau of Labor Statistics (BLS), 2012
Workforce Development Council State of the Workforce
August 2014 20
SOC Occupation gniKeltiT CountyWashington
StateWA
BenchmarkUS
BenchmarkProjected Openings
WA State Vacancies
19- yevruS2203 Researchers 83 104 2.0 0.6 6 N/A19- ,lacinilC1303 Counseling, and School Psychologists 543 1,891 0.7 0.5 40 N/A19- ,stsigolohcysP9303 All Other 169 348 1.2 1.5 10 N/A19-3041 Sociologists 128 146 2.2 6.0 6 N/A19- nabrU1503 and Regional Planners 1,146 2,861 1.0 3.6 45 N/A19- stsigoloporhtnA1903 and Archeologists 86 191 1.1 1.4 7 N/A19-3092 Geographers 19 61 0.8 1.4 1 N/A19-3093 Historians 21 60 0.9 0.7 1 N/A19-3094 Political Scientists 74 105 1.8 1.4 6 N/A19- laicoS9903 Scientists and Related Workers, All Other 348 773 1.1 1.2 20 N/A
19- ,efiL0004 Physical, and Social Science A/N3121.19.0824,9883,3snaicinhceT19- larutlucirgA1104 and Food Science Technicians 38 492 0.2 0.2 2 N/A19- lacigoloiB1204 Technicians 1,582 3,283 1.2 2.4 101 N/A19- lacimehC1304 Technicians 368 1,054 0.9 0.7 18 N/A19- lacigoloeG1404 and Petroleum Technicians 45 92 1.2 0.3 3 N/A19- raelcuN1504 Technicians 6 91 0.2 0.1 N/A N/A19- laicoS1604 Science Research Assistants 279 394 1.8 1.1 15 N/A19- latnemnorivnE1904 Science and Protection Technicians, Including Health 513 1,185 1.1 1.9 41 N/A19- cisneroF2904 Science Technicians 63 208 0.8 0.6 3 N/A19- tseroF3904 and Conservation Technicians 113 1,332 0.2 0.4 6 N/A19- ,efiL9904 Physical, and Social Science Technicians, All Other 381 1,297 0.7 0.7 24 N/A
21-0000 Community and Social Services A/N3179.08.0708,15897,61snoitapuccO21-1000 Counselors, Social Workers, and Other Community and Social Service Specialists 15,022 45,799 0.8 0.9 674 N/A
21- ecnatsbuS1101 Abuse and Behavioral Disorder Counselors 787 2,311 0.9 1.1 40 N/A21- ,lanoitacudE2101 Guidance, School, and Vocational Counselors 1,672 5,334 0.8 0.8 57 N/A21- egairraM3101 and Family Therapists 221 648 0.9 0.7 14 N/A21- latneM4101 Health Counselors 1,170 3,262 0.9 1.1 51 N/A21- noitatilibaheR5101 Counselors 2,332 6,998 0.8 2.4 97 N/A21- ,srolesnuoC9101 All Other 43 265 0.4 0.2 2 N/A21- ,dlihC1201 Family, and School Social Workers 1,465 5,744 0.6 0.6 65 N/A21- erachtlaeH2201 Social Workers 1,211 3,263 0.9 1.0 69 N/A21- latneM3201 Health and Substance Abuse Social Workers 692 1,652 1.1 0.7 33 N/A21- laicoS9201 Workers, All Other 446 1,253 0.9 0.9 18 N/A21-1091 Health Educators 659 1,136 1.5 1.4 29 N/A21- noitaborP2901 Officers and Correctional Treatment Specialists 369 2,201 0.4 0.5 8 N/A21- laicoS3901 and Human Service Assistants 3,136 9,777 0.8 1.0 154 N/A21- ytinummoC4901 Health Workers 116 492 0.6 0.3 5 N/A21- ytinummoC9901 and Social Service Specialists, All Other 703 1,463 1.2 0.8 32 N/A
21- suoigileR0002 A/N935.07.0800,6677,1srekroW21-2011 Clergy 905 3,052 0.7 0.5 20 N/A21- ,srotceriD1202 Religious Activities and Education 273 908 0.8 0.2 6 N/A21- suoigileR9902 Workers, All Other 598 2,048 0.7 1.2 13 N/A
23-0000 Legal Occupations 11,467 21,822 1.3 1.1 444 N/A23- ,sreywaL0001 Judges, and Related A/N6820.14.1254,21120,7srekroW
23-1011 Lawyers 6,665 10,930 1.5 1.1 278 N/A23-1012 Judicial Law Clerks 36 207 0.4 0.4 1 N/A23- evitartsinimdA1201 Law Judges, Adjudicators, and Hearing Officers 147 452 0.8 1.2 2 N/A23- ,srotartibrA2201 Mediators, and Conciliators 63 145 1.1 0.9 2 N/A23- ,segduJ3201 Magistrate Judges, and Magistrates 110 718 0.4 0.5 3 N/A
23- lageL0002 Support A/N8513.12.1073,9644,4srekroW23- slagelaraP1102 and Legal Assistants 3,223 6,142 1.3 1.4 118 N/A23-2091 Court Reporters 133 209 1.6 0.8 9 N/A23- eltiT3902 Examiners, Abstractors, and Searchers 561 1,810 0.8 1.0 16 N/A23- lageL9902 Support Workers, All Other 529 1,209 1.1 1.1 15 N/A
25-0000 Education, Training, and Library A/N080,29.09.0707,391092,76snoitapuccO25- yradnocestsoP0001 A/N3830.13.1315,82891,51srehcaeT25- ssenisuB1101 Teachers, Postsecondary 672 1,497 1.1 0.8 17 N/A25- retupmoC1201 Science Teachers, Postsecondary 195 512 1.0 0.6 5 1,86225- lacitamehtaM2201 Science Teachers, Postsecondary 353 789 1.1 0.7 9 1,88225- erutcetihcrA1301 Teachers, Postsecondary 99 97 2.6 1.3 2 N/A25- gnireenignE2301 Teachers, Postsecondary 478 789 1.5 1.4 12 N/A25- larutlucirgA1401 Sciences Teachers, Postsecondary 2 59 0.1 0.0 N/A N/A25- lacigoloiB2401 Science Teachers, Postsecondary 619 1,004 1.6 1.2 15 N/A25- yrtseroF3401 and Conservation Science Teachers, Postsecondary 81 86 2.4 3.2 2 N/A25- ,cirehpsomtA1501 Earth, Marine, and Space Sciences Teachers, Postsecondary 203 326 1.6 1.9 5 N/A25- yrtsimehC2501 Teachers, Postsecondary 204 444 1.2 1.0 5 N/A25- latnemnorivnE3501 Science Teachers, Postsecondary 58 75 1.9 1.1 1 N/A25- scisyhP4501 Teachers, Postsecondary 196 333 1.5 1.4 5 N/A25- ygoloporhtnA1601 and Archeology Teachers, Postsecondary 76 222 0.9 1.3 2 N/A25- ,aerA2601 Ethnic, and Cultural Studies Teachers, Postsecondary 111 126 2.2 1.1 3 N/A25- scimonocE3601 Teachers, Postsecondary 81 203 1.0 0.6 2 N/A25- yhpargoeG4601 Teachers, Postsecondary 46 118 1.0 1.0 1 N/A25- lacitiloP5601 Science Teachers, Postsecondary 256 423 1.5 1.5 6 N/A25- ygolohcysP6601 Teachers, Postsecondary 363 877 1.0 0.9 9 N/A25- ygoloicoS7601 Teachers, Postsecondary 129 311 1.0 0.8 3 N/A25- laicoS9601 Sciences Teachers, Postsecondary, All Other 61 115 1.3 0.6 2 N/A25- htlaeH1701 Specialties Teachers, Postsecondary 3,261 3,260 2.5 2.1 81 N/A25- gnisruN2701 Instructors and Teachers, Postsecondary 598 1,144 1.3 1.1 15 N/A25- noitacudE1801 Teachers, Postsecondary 514 1,273 1.0 0.8 16 N/A25- yrarbiL2801 Science Teachers, Postsecondary 82 84 2.5 1.8 2 N/A25- lanimirC1111 Justice and Law Enforcement Teachers, Postsecondary 8 174 0.1 0.1 N/A N/A
Location QuotientOccupations
Occupations, Projected Openings & Vacancies
Source: Industry Occupation Matrix, Job Vacancy Survey Report, and Short Term Occupational Projectections from WA Employment Security Dept. (ESD), 2014Employment by Occupation from U.S. Dept of Labor Bureau of Labor Statistics (BLS), 2012

Workforce Development Council State of the Workforce
August 2014 21
SOC Occupation gniKeltiT CountyWashington
StateWA
BenchmarkUS
BenchmarkProjected Openings
WA State Vacancies
25- waL2111 Teachers, Postsecondary 180 230 2.0 1.1 4 N/A25- laicoS3111 Work Teachers, Postsecondary 150 152 2.5 1.5 4 N/A25- ,trA1211 Drama, and Music Teachers, Postsecondary 785 1,747 1.1 0.8 19 N/A25- snoitacinummoC2211 Teachers, Postsecondary 243 507 1.2 0.8 6 N/A25- hsilgnE3211 Language and Literature Teachers, Postsecondary 562 1,401 1.0 0.8 14 1,87725- ngieroF4211 Language and Literature Teachers, Postsecondary 300 727 1.0 1.0 7 N/A25- yrotsiH5211 Teachers, Postsecondary 168 408 1.0 0.7 4 N/A25- yhposolihP6211 and Religion Teachers, Postsecondary 331 660 1.3 1.3 12 N/A25- etaudarG1911 Teaching Assistants 654 712 2.3 0.5 16 N/A25- emoH2911 Economics Teachers, Postsecondary 28 115 0.6 0.6 1 N/A25- noitaerceR3911 and Fitness Studies Teachers, Postsecondary 97 559 0.4 0.5 3 N/A25- lanoitacoV4911 Education Teachers, Postsecondary 2,337 5,859 1.0 2.1 58 N/A25- yradnocestsoP9911 Teachers, All Other 617 1,095 1.4 0.3 15 N/A25-2000 Primary, Secondary, and Special Education School A/N1677.07.0877,87390,32srehcaeT
25- loohcserP1102 Teachers, Except Special Education 3,104 7,282 1.1 0.9 123 N/A25- netragredniK2102 Teachers, Except Special Education 1,263 3,898 0.8 1.0 46 N/A25- yratnemelE1202 School Teachers, Except Special Education 8,407 29,850 0.7 0.7 259 N/A25- elddiM2202 School Teachers, Except Special and Career/Technical Education 3,259 11,126 0.7 0.6 100 N/A25- lacinhceT/reeraC3202 Education Teachers, Middle School 16 134 0.3 0.1 0 N/A25-2031 Secondary School Teachers, Except Special and Career/Technical Education 4,459 16,212 0.7 0.6 139 N/A25- lacinhceT/reeraC2302 Education Teachers, Secondary School 545 2,681 0.5 0.8 13 N/A25- laicepS1502 Education Teachers, Preschool 127 554 0.6 0.7 6 N/A25- laicepS2502 Education Teachers, Kindergarten and Elementary School 889 3,348 0.7 0.6 35 N/A25- laicepS3502 Education Teachers, Middle School 379 1,400 0.7 0.5 15 N/A25- laicepS4502 Education Teachers, Secondary School 593 2,134 0.7 0.5 23 N/A25- laicepS9502 Education Teachers, All Other 52 159 0.8 0.2 2 N/A
25- rehtO0003 Teachers and A/N6730.19.0674,43068,11srotcurtsnI25-3011 Adult Basic and Secondary Education and Literacy Teachers and Instructors 1,276 3,249 1.0 2.0 39 N/A25- fleS1203 -Enrichment Education Teachers 2,683 6,056 1.1 1.0 95 N/A25- srehcaeT9903 and Instructors, All Other 7,901 25,171 0.8 1.0 242 N/A
25- ,snairarbiL0004 Curators, and A/N9113.10.1623,7600,3stsivihcrA25-4011 Archivists 166 248 1.7 3.1 11 N/A25-4012 Curators 96 248 1.0 1.0 5 N/A25- muesuM3104 Technicians and Conservators 159 237 1.7 1.7 8 N/A25-4021 Librarians 1,419 3,503 1.0 1.2 40 N/A25- yrarbiL1304 Technicians 1,166 3,090 0.9 1.3 55 N/A
25- rehtO0009 Education, Training, and Library A/N1441.18.0416,44331,41snoitapuccO25- oiduA1109 -Visual and Multimedia Collections Specialists 40 174 0.6 0.5 1 N/A25- mraF1209 and Home Management Advisors 45 424 0.3 0.4 1 N/A25- lanoitcurtsnI1309 Coordinators 939 2,240 1.1 0.8 32 N/A25- rehcaeT1409 Assistants 10,540 37,808 0.7 1.0 325 68225- ,noitacudE9909 Training, and Library Workers, All Other 2,569 3,968 1.6 2.7 82 N/A
27-0000 Arts, Design, Entertainment, Sports, and Media A/N458,12.14.1983,54239,52snoitapuccO27- trA0001 and Design A/N8385.17.1627,31033,9srekroW
27-1011 Art Directors 600 723 2.1 1.0 70 N/A27-1012 Craft Artists 153 180 2.1 1.7 16 N/A27- eniF3101 Artists, Including Painters, Sculptors, and Illustrators 544 595 2.3 2.3 47 N/A27- aidemitluM4101 Artists and Animators 2,220 2,563 2.2 3.9 295 N/A27- stsitrA9101 and Related Workers, All Other 28 86 0.8 0.3 2 N/A27- laicremmoC1201 and Industrial Designers 259 513 1.3 0.8 21 N/A27-1022 Fashion Designers 200 225 2.2 1.1 14 N/A27-1023 Floral Designers 389 1,036 0.9 0.8 25 N/A27-1024 Graphic Designers 2,734 4,472 1.5 1.3 206 N/A27-1025 Interior Designers 957 1,213 2.0 2.1 71 N/A27- esidnahcreM6201 Displayers and Window Trimmers 1,132 1,953 1.5 1.4 63 N/A27- teS7201 and Exhibit Designers 34 44 1.9 0.4 2 N/A27- ,srengiseD9201 All Other 80 123 1.6 0.9 6 N/A
27-2000 Entertainers and Performers, Sports and Related A/N8739.01.1494,31738,5srekroW27-2011 Actors 240 299 2.0 0.4 10 N/A27- srecudorP2102 and Directors 1,265 1,753 1.8 1.5 89 N/A27- setelhtA1202 and Sports Competitors 194 421 1.2 1.6 11 N/A27- sehcaoC2202 and Scouts 3,152 8,708 0.9 1.6 217 N/A27- ,seripmU3202 Referees, and Other Sports Officials 68 181 0.9 0.5 4 N/A27-2031 Dancers 46 299 0.4 0.4 3 N/A27-2032 Choreographers 22 60 0.9 0.3 1 N/A27- cisuM1402 Directors and Composers 144 389 0.9 0.2 6 N/A27- snaicisuM2402 and Singers 616 1,155 1.3 0.4 31 N/A27- sreniatretnE9902 and Performers, Sports and Related Workers, All Other 90 229 1.0 0.3 6 N/A
27- aideM0003 and Communication A/N5844.15.1161,41422,8srekroW27- oidaR1103 and Television Announcers 203 514 1.0 0.6 11 N/A27- cilbuP2103 Address System and Other Announcers 58 129 1.1 0.7 3 N/A27- tsacdaorB1203 News Analysts 3 5 1.5 0.1 N/A N/A27- sretropeR2203 and Correspondents 274 712 1.0 0.6 10 N/A27- cilbuP1303 Relations Specialists 3,096 5,681 1.4 1.6 157 N/A27-3041 Editors 1,850 2,821 1.6 1.9 103 N/A27-3042 Technical Writers 1,159 1,638 1.8 2.8 52 N/A27- sretirW3403 and Authors 715 935 1.9 0.7 94 N/A27- sreterpretnI1903 and Translators 556 1,207 1.2 1.1 39 N/A27- aideM9903 and Communication Workers, All Other 310 519 1.5 1.2 16 N/A
27- aideM0004 and Communication Equipment A/N3510.16.1800,4145,2srekroW27- oiduA1104 and Video Equipment Technicians 589 904 1.6 1.1 24 N/A
Location QuotientOccupations
Occupations, Projected Openings & Vacancies
Source: Industry Occupation Matrix, Job Vacancy Survey Report, and Short Term Occupational Projectections from WA Employment Security Dept. (ESD), 2014Employment by Occupation from U.S. Dept of Labor Bureau of Labor Statistics (BLS), 2012

Workforce Development Council State of the Workforce
August 2014 22
SOC Occupation gniKeltiT CountyWashington
StateWA
BenchmarkUS
BenchmarkProjected Openings
WA State Vacancies
27- tsacdaorB2104 Technicians 347 558 1.6 1.1 14 N/A27- dnuoS4104 Engineering Technicians 195 240 2.0 1.4 9 N/A27-4021 Photographers 731 1,242 1.5 0.6 77 N/A27- aremaC1304 Operators, Television, Video, and Motion Picture 370 507 1.8 2.1 17 N/A27- mliF2304 and Video Editors 215 377 1.4 0.9 10 N/A27- aideM9904 and Communication Equipment Workers, All Other 94 180 1.3 0.8 2 N/A
29-0000 Healthcare Practitioners and Technical A/N811,28.09.0796,251128,55snoitapuccO29- htlaeH0001 Diagnosing and Treating A/N582,18.09.0155,29057,33srenoititcarP
29-1011 Chiropractors 399 861 1.2 1.1 45 N/A29-1021 Dentists, General 624 1,954 0.8 0.6 44 N/A29- larO2201 and Maxillofacial Surgeons 80 114 1.8 1.4 6 N/A29-1023 Orthodontists 69 136 1.3 1.1 5 N/A29- ,stsitneD9201 All Other Specialists 32 112 0.7 0.6 2 N/A29- snaititeiD1301 and Nutritionists 665 1,389 1.2 1.2 38 N/A29-1041 Optometrists 138 394 0.9 0.5 11 N/A29-1051 Pharmacists 2,198 5,822 0.9 0.9 91 N/A29-1061 Anesthesiologists 104 405 0.6 0.4 6 N/A29- ylimaF2601 and General Practitioners 436 1,848 0.6 0.4 15 N/A29-1063 Internists, General 234 720 0.8 0.6 9 N/A29- snaicirtetsbO4601 and Gynecologists 249 542 1.2 1.3 9 N/A29- ,snaicirtaideP5601 General 334 563 1.5 1.2 18 N/A29-1066 Psychiatrists 163 386 1.1 0.7 5 N/A29-1067 Surgeons 424 1,042 1.0 1.1 17 N/A29- snaicisyhP9601 and Surgeons, All Other 2,085 4,774 1.1 0.7 77 N/A29- naicisyhP1701 Assistants 885 2,290 1.0 1.2 37 N/A29-1081 Podiatrists 56 120 1.2 0.6 3 N/A29- lanoitapuccO2211 Therapists 945 2,178 1.1 1.0 45 N/A29- lacisyhP3211 Therapists 1,761 4,316 1.0 1.0 72 N/A29- noitaidaR4211 Therapists 136 302 1.1 0.9 4 N/A29- lanoitaerceR5211 Therapists 99 380 0.7 0.6 5 N/A29- yrotaripseR6211 Therapists 503 1,733 0.7 0.5 20 N/A29- hceepS7211 -Language Pathologists 1,022 2,505 1.0 0.9 45 N/A29- esicrexE8211 Physiologists 19 76 0.6 0.4 2 N/A29- ,stsiparehT9211 All Other 45 79 1.4 0.2 5 N/A29-1131 Veterinarians 433 1,382 0.8 0.7 24 N/A29-1141 Registered Nurses 17,970 51,973 0.9 0.8 559 1,56729- esruN1511 Anesthetists 60 308 0.5 0.2 2 N/A29-1161 Nurse Midwives 89 124 1.8 1.8 4 N/A29- esruN1711 Practitioners 947 2,565 0.9 1.0 32 N/A29-1181 Audiologists 74 310 0.6 0.7 2 N/A29- htlaeH9911 Diagnosing and Treating Practitioners, All Other 472 848 1.4 1.2 26 N/A
29- htlaeH0002 Technologists and A/N5679.09.0453,65017,02snaicinhceT29- lacideM1102 and Clinical Laboratory Technologists 1,672 4,065 1.0 1.2 57 N/A29- lacideM2102 and Clinical Laboratory Technicians 1,121 2,667 1.1 0.8 35 N/A29-2021 Dental Hygienists 2,274 6,139 0.9 1.4 79 N/A29- ralucsavoidraC1302 Technologists and Technicians 483 1,118 1.1 1.1 14 N/A29- citsongaiD2302 Medical Sonographers 445 1,345 0.8 0.9 20 N/A29- raelcuN3302 Medicine Technologists 157 435 0.9 0.9 4 N/A29- cigoloidaR4302 Technologists 1,395 3,754 0.9 0.8 39 N/A29- citengaM5302 Resonance Imaging Technologists 394 841 1.2 1.6 11 N/A29- ycnegremE1402 Medical Technicians and Paramedics 1,470 3,824 1.0 0.7 73 N/A29- citeteiD1502 Technicians 282 595 1.2 1.4 6 N/A29- ycamrahP2502 Technicians 2,614 7,128 0.9 0.9 88 N/A29- cirtaihcysP3502 Technicians 132 555 0.6 0.2 4 N/A29- yrotaripseR4502 Therapy Technicians 108 203 1.3 1.0 2 N/A29- lacigruS5502 Technologists 837 2,195 1.0 1.0 27 N/A29- yranireteV6502 Technologists and Technicians 689 1,799 1.0 1.0 48 N/A29- cimlahthpO7502 Medical Technicians 203 747 0.7 0.8 7 N/A29- desneciL1602 Practical and Licensed Vocational Nurses 2,263 8,792 0.6 0.4 97 N/A29- lacideM1702 Records and Health Information Technicians 2,021 5,392 0.9 1.3 74 N/A29- ,snaicitpO1802 Dispensing 522 1,399 0.9 0.9 26 N/A29- stsitohtrO1902 and Prosthetists 52 115 1.1 0.7 2 N/A29- gniraeH2902 Aid Specialists 34 240 0.4 0.8 2 N/A29- htlaeH9902 Technologists and Technicians, All Other 1,542 3,006 1.3 2.1 50 N/A
29-9000 Other Healthcare Practitioners and Technical A/N861.19.0297,3163,1snoitapuccO29- lanoitapuccO1109 Health and Safety Specialists 766 2,176 0.9 1.5 38 N/A29- lanoitapuccO2109 Health and Safety Technicians 59 422 0.4 0.6 3 N/A29-9091 Athletic Trainers 184 299 1.5 1.0 10 N/A29- citeneG2909 Counselors 25 36 1.7 1.4 1 N/A29- erachtlaeH9909 Practitioners and Technical Workers, All Other 327 859 1.0 0.8 16 N/A
31-0000 Healthcare Support A/N301,18.08.0651,08929,62snoitapuccO31- ,gnisruN0001 Psychiatric, and Home Health A/N5646.08.0545,63396,11sediA
31- emoH1101 Health Aides 3,361 10,300 0.8 0.5 185 N/A31-1013 Psychiatric Aides 128 446 0.7 0.2 6 N/A31-1014 Nursing Assistants 8,080 25,150 0.8 0.7 271 1,97031-1015 Orderlies 124 649 0.5 0.3 3 N/A
31-2000 Occupational and Physical Therapist Assistants and A/N936.08.0357,2748sediA31- lanoitapuccO1102 Therapy Assistants 149 398 0.9 0.6 7 N/A31- lanoitapuccO2102 Therapy Aides 25 97 0.6 0.4 1 N/A31- lacisyhP1202 Therapist Assistants 490 1,294 1.0 0.8 24 N/A31- lacisyhP2202 Therapist Aides 183 964 0.5 0.4 7 N/A
Location QuotientOccupations
Occupations, Projected Openings & Vacancies
Source: Industry Occupation Matrix, Job Vacancy Survey Report, and Short Term Occupational Projectections from WA Employment Security Dept. (ESD), 2014Employment by Occupation from U.S. Dept of Labor Bureau of Labor Statistics (BLS), 2012

Workforce Development Council State of the Workforce
August 2014 23
SOC Occupation gniKeltiT CountyWashington
StateWA
BenchmarkUS
BenchmarkProjected Openings
WA State Vacancies
31- rehtO0009 Healthcare Support A/N9952.19.0858,04983,41snoitapuccO31- egassaM1109 Therapists 1,523 3,800 1.0 1.4 147 N/A31-9091 Dental Assistants 3,236 9,518 0.9 1.3 113 N/A31-9092 Medical Assistants 5,274 14,062 0.9 1.1 175 N/A31- lacideM3909 Equipment Preparers 662 1,717 1.0 1.6 20 N/A31- lacideM4909 Transcriptionists 809 2,308 0.9 1.2 39 N/A31-9095 Pharmacy Aides 203 1,032 0.5 0.6 5 N/A31- yranireteV6909 Assistants and Laboratory Animal Caretakers 616 1,929 0.8 1.0 31 N/A31-9097 Phlebotomists 628 1,956 0.8 0.8 22 N/A31- erachtlaeH9909 Support Workers, All Other 1,438 4,536 0.8 1.6 47 N/A
33-0000 Protective Service A/N0877.08.0580,65985,81snoitapuccO33-1000 First-Line Supervisors/Managers, Protective Service A/N899.08.0037,6230,2srekroW
33- tsriF1101 -Line Supervisors of Correctional Officers 35 1,030 0.1 0.1 1 N/A33- tsriF2101 -Line Supervisors of Police and Detectives 549 2,145 0.6 0.6 19 N/A33- tsriF1201 -Line Supervisors of Fire Fighting and Prevention Workers 604 1,942 0.8 1.2 29 N/A33- tsriF9901 -Line Supervisors of Protective Service Workers, All Other 844 1,613 1.3 1.5 49 N/A
33- eriF0002 Fighting and Prevention A/N758.07.0516,7231,2srekroW33-2011 Firefighters 2,066 7,360 0.7 0.8 55 N/A33- eriF1202 Inspectors and Investigators 66 252 0.7 0.7 2 N/A33- tseroF2202 Fire Inspectors and Prevention Specialists 0 3 0.0 0.0 N/A N/A
33- waL0003 Enforcement A/N393.05.0379,61655,3srekroW33-3011 Bailiffs 29 133 0.5 0.2 0 N/A33- lanoitcerroC2103 Officers and Jailers 417 5,910 0.2 0.1 11 N/A33- sevitceteD1203 and Criminal Investigators 535 1,761 0.8 0.6 9 N/A33- hsiF1303 and Game Wardens 13 117 0.3 0.2 0 N/A33- gnikraP1403 Enforcement Workers 134 243 1.4 1.7 3 N/A33- eciloP1503 and Sheriffs Patrol Officers 2,409 8,734 0.7 0.4 69 N/A33- tisnarT2503 and Railroad Police 19 75 0.6 0.5 1 N/A
33- rehtO0009 Protective Service A/N2359.01.1767,42968,01srekroW33- laminA1109 Control Workers 38 260 0.4 0.3 1 N/A33- etavirP1209 Detectives and Investigators 159 319 1.3 0.6 5 N/A33- gnimaG1309 Surveillance Officers and Gaming Investigators 136 532 0.6 1.8 2 N/A33-9032 Security Guards 7,789 16,683 1.2 0.9 309 N/A33-9091 Crossing Guards 279 1,124 0.6 0.5 20 N/A33- ,sdraugefiL2909 Ski Patrol, and Other Recreational Protective Service Workers 1,174 2,394 1.2 1.1 146 N/A33- noitatropsnarT3909 Security Screeners 874 1,178 1.9 2.1 1 N/A33- evitcetorP9909 Service Workers, All Other 420 2,277 0.5 0.6 48 N/A
35-0000 Food Preparation and Serving Related A/N985,50.19.0125,542014,29snoitapuccO35- ,srosivrepuS0001 Food Preparation and Serving A/N0328.09.0611,71701,6srekroW
35- sfehC1101 and Head Cooks 1,226 2,593 1.2 1.3 43 N/A35- tsriF2101 -Line Supervisors of Food Preparation and Serving Workers 4,881 14,523 0.8 0.7 187 N/A
35- skooC0002 and Food Preparation A/N3999.00.1434,85729,22srekroW35-2011 Cooks, Fast Food 1,302 5,395 0.6 0.3 52 1,59035- ,skooC2102 Institution and Cafeteria 2,851 9,243 0.8 0.8 100 N/A35- ,skooC3102 Private Household 55 156 0.9 1.0 2 N/A35-2014 Cooks, Restaurant 10,759 24,061 1.1 1.3 418 N/A35- ,skooC5102 Short Order 769 2,028 1.0 0.6 30 N/A35-2019 Cooks, All Other 669 1,475 1.1 3.2 25 N/A35- dooF1202 Preparation Workers 6,522 16,076 1.0 1.0 366 1,356
35- dooF0003 and Beverage Serving A/N104,30.19.0600,341366,15srekroW35-3011 Bartenders 6,615 14,184 1.2 1.5 331 N/A35- denibmoC1203 Food Preparation and Serving Workers, Including Fast Food 19,262 65,648 0.7 0.8 947 N/A35- retnuoC2203 Attendants, Cafeteria, Food Concession, and Coffee Shop 5,975 14,606 1.0 1.6 792 65835- sretiaW1303 and Waitresses 17,482 42,703 1.0 0.9 1,202 1,04835- dooF1403 Servers, Nonrestaurant 2,329 5,865 1.0 1.2 129 N/A
35-9000 Other Food Preparation and Serving Related A/N5691.11.1569,62317,11srekroW35- gniniD1109 Room and Cafeteria Attendants and Bartender Helpers 4,436 8,670 1.3 1.3 292 N/A35-9021 Dishwashers 4,271 11,003 1.0 1.0 336 N/A35- stsoH1309 and Hostesses, Restaurant, Lounge, and Coffee Shop 2,246 5,708 1.0 0.8 269 N/A35- dooF9909 Preparation and Serving Related Workers, All Other 760 1,584 1.2 2.4 68 N/A
37-0000 Building and Grounds Cleaning and Maintenance A/N455,18.08.0708,411046,83snoitapuccO37-1000 Supervisors, Building and Grounds Cleaning and Maintenance Workers 1,707 4,841 0.9 0.5 70 N/A
37- tsriF1101 -Line Supervisors of Housekeeping and Janitorial Workers 1,047 2,799 0.9 0.5 36 N/A37-1012 First-Line Supervisors of Landscaping, Lawn Service, and Groundskeeping Workers 660 2,042 0.8 0.4 34 N/A
37- gnidliuB0002 Cleaning and Pest Control A/N970,19.08.0668,78006,92srekroW37- srotinaJ1102 and Cleaners, Except Maids and Housekeeping Cleaners 13,493 43,349 0.8 0.7 485 80637- sdiaM2102 and Housekeeping Cleaners 15,815 43,703 0.9 1.3 574 N/A37- gnidliuB9102 Cleaning Workers, All Other 54 133 1.0 0.5 2 N/A37- tseP1202 Control Workers 238 681 0.9 0.4 18 N/A
37- sdnuorG0003 Maintenance A/N5047.08.0001,22333,7srekroW37- gnipacsdnaL1103 and Groundskeeping Workers 6,866 20,256 0.9 0.7 382 N/A37- edicitseP2103 Handlers, Sprayers, and Applicators, Vegetation 154 900 0.4 0.6 9 N/A37- eerT3103 Trimmers and Pruners 252 784 0.8 0.6 12 N/A37- sdnuorG9103 Maintenance Workers, All Other 61 160 1.0 0.4 2 N/A
39-0000 Personal Care and Service A/N936,20.10.1385,011034,44snoitapuccO39- ,srosivrepuS0001 Personal Care and Service A/N798.00.1499,4739,1srekroW
39- gnimaG1101 Supervisors 277 1,110 0.6 0.9 7 N/A39-1012 Slot Supervisor 25 138 0.5 0.3 1 N/A39- tsriF1201 -Line Supervisors of Personal Service Workers 1,635 3,746 1.1 0.8 89 N/A
39- laminA0002 Care and Service A/N3119.00.1304,4647,1srekroW39-2011 Animal Trainers 91 356 0.6 0.3 5 N/A
Location QuotientOccupations
Occupations, Projected Openings & Vacancies
Source: Industry Occupation Matrix, Job Vacancy Survey Report, and Short Term Occupational Projectections from WA Employment Security Dept. (ESD), 2014Employment by Occupation from U.S. Dept of Labor Bureau of Labor Statistics (BLS), 2012

Workforce Development Council State of the Workforce
August 2014 24
SOC Occupation gniKeltiT CountyWashington
StateWA
BenchmarkUS
BenchmarkProjected Openings
WA State Vacancies
39- mrafnoN1202 Animal Caretakers 1,655 4,047 1.0 1.1 108 N/A39- tnemniatretnE0003 Attendants and Related A/N7154.19.0344,71933,6srekroW
39-3011 Gaming Dealers 2,247 6,451 0.9 2.7 146 N/A39- gnimaG2103 and Sports Book Writers and Runners 352 852 1.0 2.9 24 N/A39- gnimaG9103 Service Workers, All Other 9 112 0.2 0.1 1 N/A39- noitoM1203 Picture Projectionists 23 120 0.5 0.3 2 N/A39- ,srehsU1303 Lobby Attendants, and Ticket Takers 1,210 2,283 1.3 1.3 116 N/A39- tnemesumA1903 and Recreation Attendants 2,208 7,028 0.8 1.0 201 N/A39- emutsoC2903 Attendants 29 39 1.9 0.6 2 N/A39- rekcoL3903 Room, Coatroom, and Dressing Room Attendants 129 311 1.0 0.8 12 N/A39- tnemniatretnE9903 Attendants and Related Workers, All Other 132 247 1.3 1.4 13 N/A
39- larenuF0004 Service A/N74.00.1455312srekroW39-4011 Embalmers 9 32 0.7 0.2 N/A N/A39- larenuF1204 Attendants 8 91 0.2 0.0 N/A N/A39- ,snaicitroM1304 Undertakers, and Funeral Directors 196 431 1.1 1.0 7 N/A
39- lanosreP0005 Appearance A/N5249.02.1903,31833,6srekroW39-5011 Barbers 158 396 1.0 0.4 N/A N/A39- ,sresserdriaH2105 Hairstylists, and Cosmetologists 4,517 9,899 1.1 0.9 295 N/A39- puekaM1905 Artists, Theatrical and Performance 3 9 0.8 0.1 N/A N/A39- stsirucinaM2905 and Pedicurists 1,150 2,069 1.4 1.6 76 N/A39-5093 Shampooers 44 54 2.0 0.3 4 N/A39- eracnikS4905 Specialists 466 882 1.3 1.3 23 N/A
39- ,noitatropsnarT0006 Tourism, and Lodging A/N851.29.1915,1571,1stnadnettA39- egaggaB1106 Porters and Bellhops 971 1,220 2.0 2.9 51 N/A39-6012 Concierges 204 299 1.7 0.9 7 N/A
39- ruoT0007 and Travel A/N629.03.1586563sediuG39- ruoT1107 Guides and Escorts 213 428 1.3 0.6 16 N/A39-7012 Travel Guides 152 257 1.5 3.2 10 N/A
39- rehtO0009 Personal Care and Service A/N693,10.10.1676,76713,62srekroW39-9011 Childcare Workers 9,887 27,376 0.9 0.9 721 N/A39- lanosreP1209 Care Aides 9,787 25,478 1.0 1.0 387 1,82039- ssentiF1309 Trainers and Aerobics Instructors 3,360 7,212 1.2 1.5 166 N/A39- noitaerceR2309 Workers 2,348 5,632 1.0 0.8 66 N/A39- laitnediseR1409 Advisors 214 637 0.8 0.3 11 N/A39- lanosreP9909 Care and Service Workers, All Other 721 1,341 1.4 0.9 45 N/A
41-0000 Sales and Related A/N182,60.10.1510,503699,221snoitapuccO41- ,srosivrepuS0001 Sales A/N3747.00.1042,92870,11srekroW
41- tsriF1101 -Line Supervisors of Retail Sales Workers 7,934 23,166 0.9 0.6 293 N/A41- tsriF2101 -Line Supervisors of Non-Retail Sales Workers 3,144 6,074 1.3 1.0 180 N/A
41- liateR0002 Sales A/N253,39.09.0212,281043,36srekroW41-2011 Cashiers 19,900 64,380 0.8 0.7 1,417 1,68841- gnimaG2102 Change Persons and Booth Cashiers 59 833 0.2 0.3 4 N/A41- retnuoC1202 and Rental Clerks 6,246 15,347 1.0 1.7 256 N/A41- straP2202 Salespersons 1,588 5,821 0.7 0.9 78 N/A41- liateR1302 Salespersons 35,547 95,831 0.9 1.0 1,597 4,482
41- selaS0003 Representatives, A/N421,14.14.1893,63166,91secivreS41- gnisitrevdA1103 Sales Agents 1,645 3,010 1.4 1.3 87 N/A41- ecnarusnI1203 Sales Agents 2,675 6,799 1.0 0.7 122 N/A41- ,seitiruceS1303 Commodities, and Financial Services Sales Agents 2,687 4,917 1.4 0.9 113 N/A41-3041 Travel Agents 943 1,445 1.6 1.6 40 N/A41- selaS9903 Representatives, Services, All Other 11,711 20,227 1.5 2.0 762 N/A
41-4000 Sales Representatives, Wholesale and A/N4284.13.1823,04614,12gnirutcafunaM
41-4011 Sales Representatives, Wholesale and Manufacturing, Technical and Scientific Products 4,588 6,911 1.7 1.5 187 N/A
41-4012 Sales Representatives, Wholesale and Manufacturing, Except Technical and Scientific Products 16,828 33,417 1.3 1.4 637 N/A41- rehtO0009 Sales and Related A/N8059.01.1738,61105,7srekroW
41- srotartsnomeD1109 and Product Promoters 2,142 3,189 1.7 3.3 146 N/A41-9012 Models 37 36 2.6 0.9 2 N/A41- laeR1209 Estate Brokers 282 587 1.2 0.4 26 N/A41- laeR2209 Estate Sales Agents 1,906 2,999 1.6 0.7 157 N/A41-9031 Sales Engineers 725 1,218 1.5 1.3 42 N/A41-9041 Telemarketers 1,287 6,139 0.5 0.6 72 N/A41-9091 Door-to-Door Sales Workers, News and Street Vendors, and Related Workers 0 175 0.0 0.0 N/A N/A41- selaS9909 and Related Workers, All Other 1,122 2,494 1.1 1.0 63 N/A
43-0000 Office and Administrative Support A/N644,69.00.1016,324204,661snoitapuccO43-1000 Supervisors, Office and Administrative Support A/N4248.00.1917,52788,9srekroW
43- tsriF1101 -Line Supervisors of Office and Administrative Support Workers 9,887 25,719 1.0 0.8 424 N/A43- snoitacinummoC0002 Equipment A/N86.09.0400,2286srotarepO
43- draobhctiwS1102 Operators, Including Answering Service 646 1,906 0.9 0.6 6 N/A43- enohpeleT1202 Operators 11 58 0.5 0.1 1 N/A43- snoitacinummoC9902 Equipment Operators, All Other 25 40 1.6 1.0 1 N/A
43- laicnaniF0003 A/N770,10.19.0139,77890,82skrelC43- lliB1103 and Account Collectors 2,119 4,953 1.1 0.6 99 N/A43- gnilliB1203 and Posting Clerks 4,586 11,623 1.0 1.1 177 N/A43- ,gnipeekkooB1303 Accounting, and Auditing Clerks 15,503 42,879 0.9 1.0 514 N/A43- gnimaG1403 Cage Workers 239 1,109 0.5 1.6 5 N/A43- lloryaP1503 and Timekeeping Clerks 1,411 3,955 0.9 1.0 66 N/A43- tnemerucorP1603 Clerks 398 1,330 0.8 0.7 14 N/A43-3071 Tellers 3,389 11,187 0.8 0.8 183 N/A43- laicnaniF9903 Clerks, All Other 453 895 1.3 1.3 19 N/A
Location QuotientOccupations
Occupations, Projected Openings & Vacancies
Source: Industry Occupation Matrix, Job Vacancy Survey Report, and Short Term Occupational Projectections from WA Employment Security Dept. (ESD), 2014Employment by Occupation from U.S. Dept of Labor Bureau of Labor Statistics (BLS), 2012
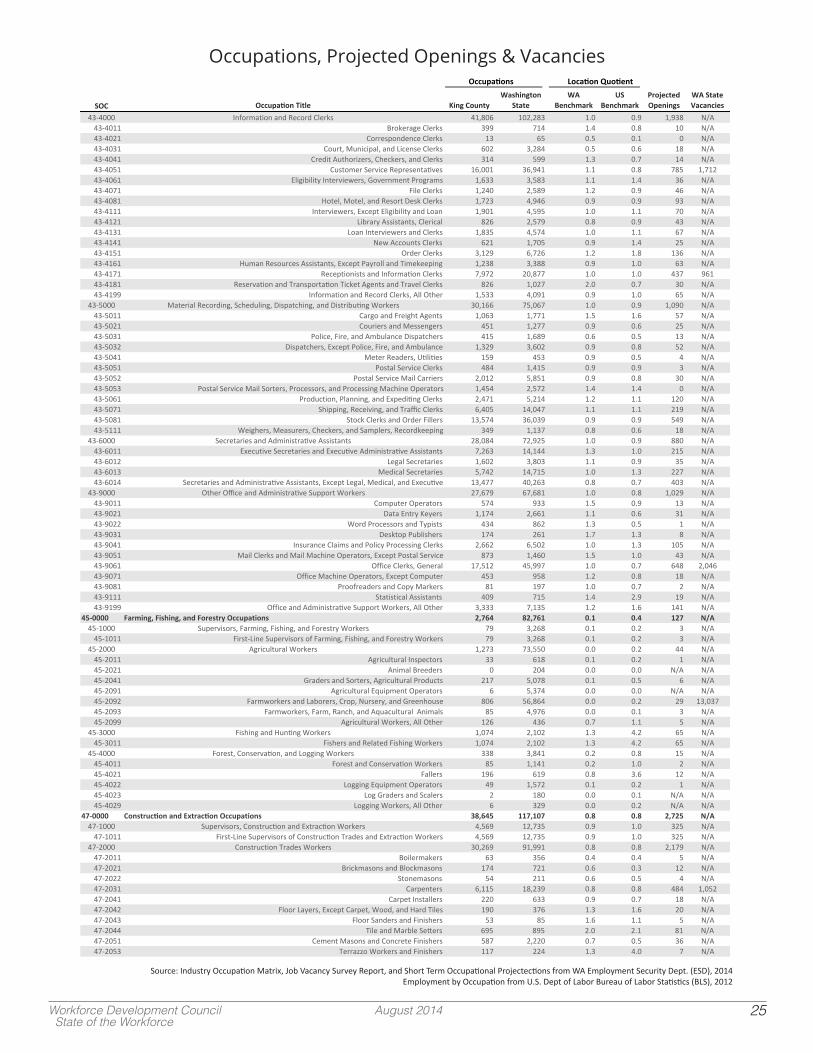
Workforce Development Council State of the Workforce
August 2014 25
SOC Occupation gniKeltiT CountyWashington
StateWA
BenchmarkUS
BenchmarkProjected Openings
WA State Vacancies
43- noitamrofnI0004 and Record A/N839,19.00.1382,201608,14skrelC43-4011 Brokerage Clerks 399 714 1.4 0.8 10 N/A43- ecnednopserroC1204 Clerks 13 65 0.5 0.1 0 N/A43- ,truoC1304 Municipal, and License Clerks 602 3,284 0.5 0.6 18 N/A43- tiderC1404 Authorizers, Checkers, and Clerks 314 599 1.3 0.7 14 N/A43- remotsuC1504 Service Representatives 16,001 36,941 1.1 0.8 785 1,71243- ytilibigilE1604 Interviewers, Government Programs 1,633 3,583 1.1 1.4 36 N/A43-4071 File Clerks 1,240 2,589 1.2 0.9 46 N/A43- ,letoH1804 Motel, and Resort Desk Clerks 1,723 4,946 0.9 0.9 93 N/A43- ,sreweivretnI1114 Except Eligibility and Loan 1,901 4,595 1.0 1.1 70 N/A43- yrarbiL1214 Assistants, Clerical 826 2,579 0.8 0.9 43 N/A43- naoL1314 Interviewers and Clerks 1,835 4,574 1.0 1.1 67 N/A43- weN1414 Accounts Clerks 621 1,705 0.9 1.4 25 N/A43-4151 Order Clerks 3,129 6,726 1.2 1.8 136 N/A43- namuH1614 Resources Assistants, Except Payroll and Timekeeping 1,238 3,388 0.9 1.0 63 N/A43- stsinoitpeceR1714 and Information Clerks 7,972 20,877 1.0 1.0 437 96143- noitavreseR1814 and Transportation Ticket Agents and Travel Clerks 826 1,027 2.0 0.7 30 N/A43- noitamrofnI9914 and Record Clerks, All Other 1,533 4,091 0.9 1.0 65 N/A
43-5000 Material Recording, Scheduling, Dispatching, and Distributing Workers 30,166 75,067 1.0 0.9 1,090 N/A43- ograC1105 and Freight Agents 1,063 1,771 1.5 1.6 57 N/A43- sreiruoC1205 and Messengers 451 1,277 0.9 0.6 25 N/A43- ,eciloP1305 Fire, and Ambulance Dispatchers 415 1,689 0.6 0.5 13 N/A43- ,srehctapsiD2305 Except Police, Fire, and Ambulance 1,329 3,602 0.9 0.8 52 N/A43- reteM1405 Readers, Utilities 159 453 0.9 0.5 4 N/A43- latsoP1505 Service Clerks 484 1,415 0.9 0.9 3 N/A43- latsoP2505 Service Mail Carriers 2,012 5,851 0.9 0.8 30 N/A43-5053 Postal Service Mail Sorters, Processors, and Processing Machine Operators 1,454 2,572 1.4 1.4 0 N/A43- ,noitcudorP1605 Planning, and Expediting Clerks 2,471 5,214 1.2 1.1 120 N/A43- ,gnippihS1705 Receiving, and Traffic Clerks 6,405 14,047 1.1 1.1 219 N/A43- kcotS1805 Clerks and Order Fillers 13,574 36,039 0.9 0.9 549 N/A43- ,srehgieW1115 Measurers, Checkers, and Samplers, Recordkeeping 349 1,137 0.8 0.6 18 N/A
43- seiraterceS0006 and Administrative A/N0889.00.1529,27480,82stnatsissA43- evitucexE1106 Secretaries and Executive Administrative Assistants 7,263 14,144 1.3 1.0 215 N/A43-6012 Legal Secretaries 1,602 3,803 1.1 0.9 35 N/A43- lacideM3106 Secretaries 5,742 14,715 1.0 1.3 227 N/A43-6014 Secretaries and Administrative Assistants, Except Legal, Medical, and Executive 13,477 40,263 0.8 0.7 403 N/A
43- rehtO0009 Office and Administrative Support A/N920,18.00.1186,76976,72srekroW43- retupmoC1109 Operators 574 933 1.5 0.9 13 N/A43-9021 Data Entry Keyers 1,174 2,661 1.1 0.6 31 N/A43- droW2209 Processors and Typists 434 862 1.3 0.5 1 N/A43- potkseD1309 Publishers 174 261 1.7 1.3 8 N/A43- ecnarusnI1409 Claims and Policy Processing Clerks 2,662 6,502 1.0 1.3 105 N/A43- liaM1509 Clerks and Mail Machine Operators, Except Postal Service 873 1,460 1.5 1.0 43 N/A43- eciffO1609 Clerks, General 17,512 45,997 1.0 0.7 648 2,04643- eciffO1709 Machine Operators, Except Computer 453 958 1.2 0.8 18 N/A43- sredaerfoorP1809 and Copy Markers 81 197 1.0 0.7 2 N/A43- lacitsitatS1119 Assistants 409 715 1.4 2.9 19 N/A43- eciffO9919 and Administrative Support Workers, All Other 3,333 7,135 1.2 1.6 141 N/A
45-0000 Farming, Fishing, and Forestry A/N7214.01.0167,28467,2snoitapuccO45- ,srosivrepuS0001 Farming, Fishing, and Forestry A/N32.01.0862,397srekroW
45- tsriF1101 -Line Supervisors of Farming, Fishing, and Forestry Workers 79 3,268 0.1 0.2 3 N/A45- larutlucirgA0002 A/N442.00.0055,37372,1srekroW
45- larutlucirgA1102 Inspectors 33 618 0.1 0.2 1 N/A45-2021 Animal Breeders 0 204 0.0 0.0 N/A N/A45- sredarG1402 and Sorters, Agricultural Products 217 5,078 0.1 0.5 6 N/A45- larutlucirgA1902 Equipment Operators 6 5,374 0.0 0.0 N/A N/A45- srekrowmraF2902 and Laborers, Crop, Nursery, and Greenhouse 806 56,864 0.0 0.2 29 13,03745- ,srekrowmraF3902 Farm, Ranch, and Aquacultural Animals 85 4,976 0.0 0.1 3 N/A45- larutlucirgA9902 Workers, All Other 126 436 0.7 1.1 5 N/A
45- gnihsiF0003 and Hunting A/N562.43.1201,2470,1srekroW45- srehsiF1103 and Related Fishing Workers 1,074 2,102 1.3 4.2 65 N/A
45- ,tseroF0004 Conservation, and Logging A/N518.02.0148,3833srekroW45- tseroF1104 and Conservation Workers 85 1,141 0.2 1.0 2 N/A45-4021 Fallers 196 619 0.8 3.6 12 N/A45- gniggoL2204 Equipment Operators 49 1,572 0.1 0.2 1 N/A45- goL3204 Graders and Scalers 2 180 0.0 0.1 N/A N/A45- gniggoL9204 Workers, All Other 6 329 0.0 0.2 N/A N/A
47-0000 Construction and Extraction A/N527,28.08.0701,711546,83snoitapuccO47- ,srosivrepuS0001 Construction and Extraction A/N5230.19.0537,21965,4srekroW
47- tsriF1101 -Line Supervisors of Construction Trades and Extraction Workers 4,569 12,735 0.9 1.0 325 N/A47- noitcurtsnoC0002 Trades A/N971,28.08.0199,19962,03srekroW
47-2011 Boilermakers 63 356 0.4 0.4 5 N/A47- snosamkcirB1202 and Blockmasons 174 721 0.6 0.3 12 N/A47-2022 Stonemasons 54 211 0.6 0.5 4 N/A47-2031 Carpenters 6,115 18,239 0.8 0.8 484 1,05247-2041 Carpet Installers 220 633 0.9 0.7 18 N/A47- roolF2402 Layers, Except Carpet, Wood, and Hard Tiles 190 376 1.3 1.6 20 N/A47- roolF3402 Sanders and Finishers 53 85 1.6 1.1 5 N/A47- eliT4402 and Marble Setters 695 895 2.0 2.1 81 N/A47- tnemeC1502 Masons and Concrete Finishers 587 2,220 0.7 0.5 36 N/A47- ozzarreT3502 Workers and Finishers 117 224 1.3 4.0 7 N/A
Location QuotientOccupations
Occupations, Projected Openings & Vacancies
Source: Industry Occupation Matrix, Job Vacancy Survey Report, and Short Term Occupational Projectections from WA Employment Security Dept. (ESD), 2014Employment by Occupation from U.S. Dept of Labor Bureau of Labor Statistics (BLS), 2012

Workforce Development Council State of the Workforce
August 2014 26
SOC Occupation gniKeltiT CountyWashington
StateWA
BenchmarkUS
BenchmarkProjected Openings
WA State Vacancies
47- noitcurtsnoC1602 Laborers 5,157 15,250 0.9 0.6 267 65047- ,gnivaP1702 Surfacing, and Tamping Equipment Operators 352 801 1.1 0.8 21 N/A47- eliP2702 -Driver Operators 80 200 1.0 2.5 5 N/A47- gnitarepO3702 Engineers and Other Construction Equipment Operators 1,524 6,474 0.6 0.5 91 N/A47- llawyrD1802 and Ceiling Tile Installers 913 2,662 0.9 1.2 76 N/A47-2082 Tapers 597 1,636 0.9 3.8 48 N/A47-2111 Electricians 3,909 12,394 0.8 0.8 273 N/A47-2121 Glaziers 865 1,808 1.2 2.2 72 N/A47- noitalusnI1312 Workers, Floor, Ceiling, and Wall 207 597 0.9 1.1 17 N/A47- noitalusnI2312 Workers, Mechanical 520 886 1.5 2.2 44 N/A47- ,sretniaP1412 Construction and Maintenance 2,784 7,487 0.9 1.1 273 N/A47-2142 Paperhangers 19 42 1.1 0.7 2 N/A47-2151 Pipelayers 516 1,535 0.8 1.3 24 N/A47- ,srebmulP2512 Pipefitters, and Steamfitters 1,850 7,126 0.7 0.6 131 N/A47- sreretsalP1612 and Stucco Masons 47 324 0.4 0.2 2 N/A47- gnicrofnieR1712 Iron and Rebar Workers 192 435 1.1 1.5 12 N/A47-2181 Roofers 917 3,562 0.6 0.8 70 N/A47- teehS1122 Metal Workers 1,112 3,723 0.8 0.9 53 N/A47- larutcurtS1222 Iron and Steel Workers 440 1,078 1.0 0.9 26 N/A47- raloS1322 Photovoltaic Installers 0 11 0.0 0.0 N/A N/A
47- ,srepleH0003 Construction A/N465.00.1244,2329sedarT47-3011 Helpers--Brickmasons, Blockmasons, Stonemasons, and Tile and Marble Setters 115 365 0.8 0.6 8 N/A47- srepleH2103 --Carpenters 73 387 0.5 0.2 5 N/A47- srepleH3103 --Electricians 153 407 0.9 0.3 11 N/A47- srepleH4103 --Painters, Paperhangers, Plasterers, and Stucco Masons 138 159 2.2 1.5 9 N/A47- srepleH5103 --Pipelayers, Plumbers, Pipefitters, and Steamfitters 216 520 1.0 0.6 16 N/A47-3016 Helpers--Roofers 56 135 1.0 0.6 3 N/A47- ,srepleH9103 Construction Trades, All Other 172 469 0.9 1.0 12 N/A
47- rehtO0004 Construction and Related A/N4518.08.0100,9497,2srekroW47- noitcurtsnoC1104 and Building Inspectors 901 2,351 1.0 1.1 46 N/A47- rotavelE1204 Installers and Repairers 122 203 1.5 0.8 9 N/A47-4031 Fence Erectors 166 842 0.5 0.8 16 N/A47- suodrazaH1404 Materials Removal Workers 409 1,288 0.8 1.3 28 N/A47- yawhgiH1504 Maintenance Workers 617 2,700 0.6 0.5 15 N/A47- liaR1604 -Track Laying and Maintenance Equipment Operators 44 216 0.5 0.3 2 N/A47- citpeS1704 Tank Servicers and Sewer Pipe Cleaners 122 625 0.5 0.6 6 N/A47-4091 Segmental Pavers 179 169 2.7 12.0 14 N/A47- noitcurtsnoC9904 and Related Workers, All Other 234 607 1.0 0.8 18 N/A
47- noitcartxE0005 A/N31.02.083909srekroW47- kcirreD1105 Operators, Oil and Gas 0 2 0.0 0.0 N/A N/A47- yratoR2105 Drill Operators, Oil and Gas 9 18 1.3 0.0 N/A N/A47- htraE1205 Drillers, Except Oil and Gas 12 405 0.1 0.1 1 N/A47- sevisolpxE1305 Workers, Ordnance Handling Experts, and Blasters 4 94 0.1 0.1 N/A N/A47- suounitnoC1405 Mining Machine Operators 32 145 0.6 0.3 1 N/A47- eniM2405 Cutting and Channeling Machine Operators 0 42 0.0 0.0 N/A N/A47- gniniM9405 Machine Operators, All Other 0 45 0.0 0.0 N/A N/A47- kcoR1505 Splitters, Quarry 0 44 0.0 0.0 N/A N/A47- ,stuobatsuoR1705 Oil and Gas 0 4 0.0 0.0 N/A N/A47- srepleH1805 --Extraction Workers 0 45 0.0 0.0 N/A N/A47- noitcartxE9905 Workers, All Other 33 94 0.9 0.4 1 N/A
49-0000 Installation, Maintenance, and Repair A/N025,19.09.0347,511625,93snoitapuccO49-1000 Supervisors of Installation, Maintenance, and Repair A/N7219.09.0165,9342,3srekroW
49- tsriF1101 -Line Supervisors of Mechanics, Installers, and Repairers 3,243 9,561 0.9 0.9 127 N/A49-2000 Electrical and Electronic Equipment Mechanics, Installers, and Repairers 5,162 13,106 1.0 1.0 197 N/A
49- ,retupmoC1102 Automated Teller, and Office Machine Repairers 922 2,359 1.0 0.8 41 N/A49- ,oidaR1202 Cellular, and Tower Equipment, Installers and Repairers 236 500 1.2 1.7 7 N/A49-2022 Telecommunications Equipment Installers and Repairers, Except Line Installers 1,387 4,048 0.9 0.8 52 N/A49- scinoivA1902 Technicians 872 1,300 1.7 6.2 31 N/A49- cirtcelE2902 Motor, Power Tool, and Related Repairers 63 228 0.7 0.4 1 N/A49-2093 Electrical and Electronics Installers and Repairers, Transportation Equipment 191 470 1.0 1.5 4 N/A49-2094 Electrical and Electronics Repairers, Commercial and Industrial Equipment 488 1,637 0.7 0.9 16 N/A49- lacirtcelE5902 and Electronics Repairers, Powerhouse, Substation, and Relay 131 279 1.2 0.6 3 N/A49- cinortcelE6902 Equipment Installers and Repairers, Motor Vehicles 198 438 1.1 1.6 5 N/A49- cinortcelE7902 Home Entertainment Equipment Installers and Repairers 277 533 1.3 1.1 9 N/A49- ytiruceS8902 and Fire Alarm Systems Installers 397 1,314 0.8 0.8 28 N/A
49- elciheV0003 and Mobile Equipment Mechanics, A/N1149.08.0466,53486,11srellatsnI49- tfarcriA1103 Mechanics and Service Technicians 3,276 5,748 1.4 3.3 142 N/A49- evitomotuA1203 Body and Related Repairers 691 2,452 0.7 0.5 17 N/A49- evitomotuA2203 Glass Installers and Repairers 411 820 1.3 2.8 11 N/A49- evitomotuA3203 Service Technicians and Mechanics 3,188 11,374 0.7 0.6 104 80649- suB1303 and Truck Mechanics and Diesel Engine Specialists 2,120 6,017 0.9 1.0 56 N/A49- mraF1403 Equipment Mechanics and Service Technicians 26 1,205 0.1 0.1 1 N/A49- eliboM2403 Heavy Equipment Mechanics, Except Engines 881 3,069 0.7 0.9 36 N/A49-3043 Rail Car Repairers 102 443 0.6 0.6 7 N/A49- taobrotoM1503 Mechanics and Service Technicians 128 433 0.7 0.7 5 N/A49- elcycrotoM2503 Mechanics 75 342 0.6 0.5 3 N/A49- roodtuO3503 Power Equipment and Other Small Engine Mechanics 75 510 0.4 0.3 3 N/A49-3091 Bicycle Repairers 14 225 0.2 0.2 1 N/A49- lanoitaerceR2903 Vehicle Service Technicians 64 417 0.4 0.7 2 N/A49- eriT3903 Repairers and Changers 633 2,609 0.6 0.8 23 N/A
49-9000 Other Installation, Maintenance, and Repair A/N5878.09.0214,75734,91snoitapuccO
Location QuotientOccupations
Occupations, Projected Openings & Vacancies
Source: Industry Occupation Matrix, Job Vacancy Survey Report, and Short Term Occupational Projectections from WA Employment Security Dept. (ESD), 2014Employment by Occupation from U.S. Dept of Labor Bureau of Labor Statistics (BLS), 2012

Workforce Development Council State of the Workforce
August 2014 27
SOC Occupation gniKeltiT CountyWashington
StateWA
BenchmarkUS
BenchmarkProjected Openings
WA State Vacancies
49- lacinahceM1109 Door Repairers 149 356 1.1 1.1 9 N/A49- lortnoC2109 and Valve Installers and Repairers, Except Mechanical Door 187 957 0.5 0.6 4 N/A49- ,gnitaeH1209 Air Conditioning, and Refrigeration Mechanics and Installers 1,334 3,842 0.9 0.6 91 N/A49- emoH1309 Appliance Repairers 430 825 1.3 1.2 15 N/A49- lairtsudnI1409 Machinery Mechanics 2,087 6,702 0.8 0.8 93 N/A49- ecnanetniaM3409 Workers, Machinery 354 1,525 0.6 0.5 10 N/A49-9044 Millwrights 597 1,482 1.0 1.8 33 N/A49- yrotcarfeR5409 Materials Repairers, Except Brickmasons 0 89 0.0 0.0 N/A N/A49- lacirtcelE1509 Power-Line Installers and Repairers 445 2,472 0.5 0.5 19 N/A49- snoitacinummoceleT2509 Line Installers and Repairers 500 1,954 0.6 0.4 20 N/A49- aremaC1609 and Photographic Equipment Repairers 17 25 1.7 0.7 1 N/A49- lacideM2609 Equipment Repairers 443 1,050 1.1 1.3 24 N/A49- lacisuM3609 Instrument Repairers and Tuners 45 191 0.6 0.7 1 N/A49-9064 Watch Repairers 9 25 0.9 0.3 0 N/A49- noisicerP9609 Instrument and Equipment Repairers, All Other 104 362 0.7 0.9 4 N/A49- ecnanetniaM1709 and Repair Workers, General 10,365 27,501 0.9 0.9 352 N/A49- dniW1809 Turbine Service Technicians 5 34 0.4 0.2 N/A N/A49- ,nioC1909 Vending, and Amusement Machine Servicers and Repairers 269 733 0.9 0.8 9 N/A49- laicremmoC2909 Divers 112 194 1.5 3.8 7 N/A49- cirbaF3909 Menders, Except Garment 2 2 2.5 0.2 N/A N/A49- shtimskcoL4909 and Safe Repairers 106 361 0.7 0.6 5 N/A49- derutcafunaM5909 Building and Mobile Home Installers 0 127 0.0 0.0 N/A N/A49-9096 Riggers 75 725 0.3 0.6 4 N/A49- langiS7909 and Track Switch Repairers 70 199 0.9 1.0 2 N/A49- srepleH8909 --Installation, Maintenance, and Repair Workers 735 2,227 0.8 0.7 48 N/A49- ,noitallatsnI9909 Maintenance, and Repair Workers, All Other 997 3,452 0.7 0.8 34 N/A
51-0000 Production Occupations 54,356 163,374 0.8 0.7 2,244 N/A51- ,srosivrepuS0001 Production A/N9017.08.0115,11105,3srekroW
51- tsriF1101 -Line Supervisors of Production and Operating Workers 3,501 11,511 0.8 0.7 109 N/A51- srelbmessA0002 and A/N1358.09.0142,53871,21srotacirbaF
51- tfarcriA1102 Structure, Surfaces, Rigging, and Systems Assemblers 3,473 13,243 0.7 10.1 151 N/A51- lioC1202 Winders, Tapers, and Finishers 16 232 0.2 0.1 1 N/A51- lacirtcelE2202 and Electronic Equipment Assemblers 2,058 4,736 1.1 1.3 89 N/A51- lacinahcemortcelE3202 Equipment Assemblers 80 282 0.7 0.2 4 N/A51- enignE1302 and Other Machine Assemblers 711 1,211 1.5 2.1 36 N/A51- larutcurtS1402 Metal Fabricators and Fitters 520 1,232 1.1 0.8 31 N/A51- ssalgrebiF1902 Laminators and Fabricators 417 1,126 0.9 2.8 6 N/A51-2092 Team Assemblers 1,917 5,702 0.8 0.2 74 N/A51- srelbmessA9902 and Fabricators, All Other 2,986 7,477 1.0 1.3 139 N/A
51- dooF0003 Processing A/N4131.10.1483,71760,7srekroW51-3011 Bakers 1,643 4,140 1.0 1.2 66 N/A51- srehctuB1203 and Meat Cutters 897 2,853 0.8 0.8 42 N/A51- ,taeM2203 Poultry, and Fish Cutters and Trimmers 2,842 5,569 1.3 2.1 132 N/A51- srerethgualS3203 and Meat Packers 206 985 0.5 0.3 8 N/A51-3091 Food and Tobacco Roasting, Baking, and Drying Machine Operators and Tenders 158 428 0.9 1.0 7 N/A51-3092 Food Batchmakers 902 2,233 1.0 1.0 40 N/A51- dooF3903 Cooking Machine Operators and Tenders 84 446 0.5 0.3 4 N/A51- dooF9903 Processing Workers, All Other 335 730 1.2 1.0 15 N/A
51- lateM0004 Workers and Plastic A/N1257.09.0619,92020,11srekroW51- retupmoC1104 -Controlled Machine Tool Operators, Metal and Plastic 844 3,087 0.7 0.7 36 N/A51-4012 Computer Numerically Controlled Machine Tool Programmers, Metal and Plastic 520 954 1.4 2.6 16 N/A51-4021 Extruding and Drawing Machine Setters, Operators, and Tenders, Metal and Plastic 163 781 0.5 0.3 6 N/A51- gnigroF2204 Machine Setters, Operators, and Tenders, Metal and Plastic 47 144 0.8 0.3 1 N/A51- gnilloR3204 Machine Setters, Operators, and Tenders, Metal and Plastic 310 513 1.5 1.0 12 N/A51-4031 Cutting, Punching, and Press Machine Setters, Operators, and Tenders, Metal and Plastic 1,243 2,345 1.3 0.8 51 N/A51-4032 Drilling and Boring Machine Tool Setters, Operators, and Tenders, Metal and Plastic 47 175 0.7 0.3 2 N/A
51-4033Grinding, Lapping, Polishing, and Buffing Machine Tool Setters, Operators, and Tenders, Metal
and Plastic 447 1,061 1.1 0.8 25 N/A51-4034 Lathe and Turning Machine Tool Setters, Operators, and Tenders, Metal and Plastic 154 373 1.0 0.5 9 N/A51-4035 Milling and Planing Machine Setters, Operators, and Tenders, Metal and Plastic 165 535 0.8 0.9 4 N/A51-4041 Machinists 2,506 5,767 1.1 0.8 143 N/A51- lateM1504 -Refining Furnace Operators and Tenders 38 764 0.1 0.2 1 N/A51- sreruoP2504 and Casters, Metal 15 127 0.3 0.2 0 N/A51- ledoM1604 Makers, Metal and Plastic 21 54 1.0 0.4 0 N/A51- ,srekamnrettaP2604 Metal and Plastic 54 109 1.2 1.5 3 N/A51- yrdnuoF1704 Mold and Coremakers 52 316 0.4 0.5 1 N/A51-4072 Molding, Coremaking, and Casting Machine Setters, Operators, and Tenders, Metal and Plastic 524 1,452 0.9 0.5 15 N/A51-4081 Multiple Machine Tool Setters, Operators, and Tenders, Metal and Plastic 424 781 1.4 0.6 13 N/A51- looT1114 and Die Makers 664 1,512 1.1 1.0 11 N/A51- ,sredleW1214 Cutters, Solderers, and Brazers 1,808 5,946 0.8 0.6 117 N/A51-4122 Welding, Soldering, and Brazing Machine Setters, Operators, and Tenders 175 546 0.8 0.4 9 N/A51-4191 Heat Treating Equipment Setters, Operators, and Tenders, Metal and Plastic 226 518 1.1 1.2 23 N/A51- tuoyaL2914 Workers, Metal and Plastic 168 730 0.6 1.6 6 N/A51-4193 Plating and Coating Machine Setters, Operators, and Tenders, Metal and Plastic 118 251 1.2 0.4 8 N/A51- looT4914 Grinders, Filers, and Sharpeners 119 484 0.6 1.1 3 N/A51- lateM9914 Workers and Plastic Workers, All Other 168 591 0.7 0.8 6 N/A
51- gnitnirP0005 A/N549.03.1930,4220,2srekroW51- sserperP1115 Technicians and Workers 480 765 1.6 1.4 16 N/A51- gnitnirP2115 Press Operators 1,239 2,673 1.2 0.8 21 N/A51- tnirP3115 Binding and Finishing Workers 303 601 1.3 0.7 8 N/A51- ,elitxeT0006 Apparel, and Furnishings Workers 3,500 8,825 1.0 0.6 81 N/A
Location QuotientOccupations
Occupations, Projected Openings & Vacancies
Source: Industry Occupation Matrix, Job Vacancy Survey Report, and Short Term Occupational Projectections from WA Employment Security Dept. (ESD), 2014Employment by Occupation from U.S. Dept of Labor Bureau of Labor Statistics (BLS), 2012
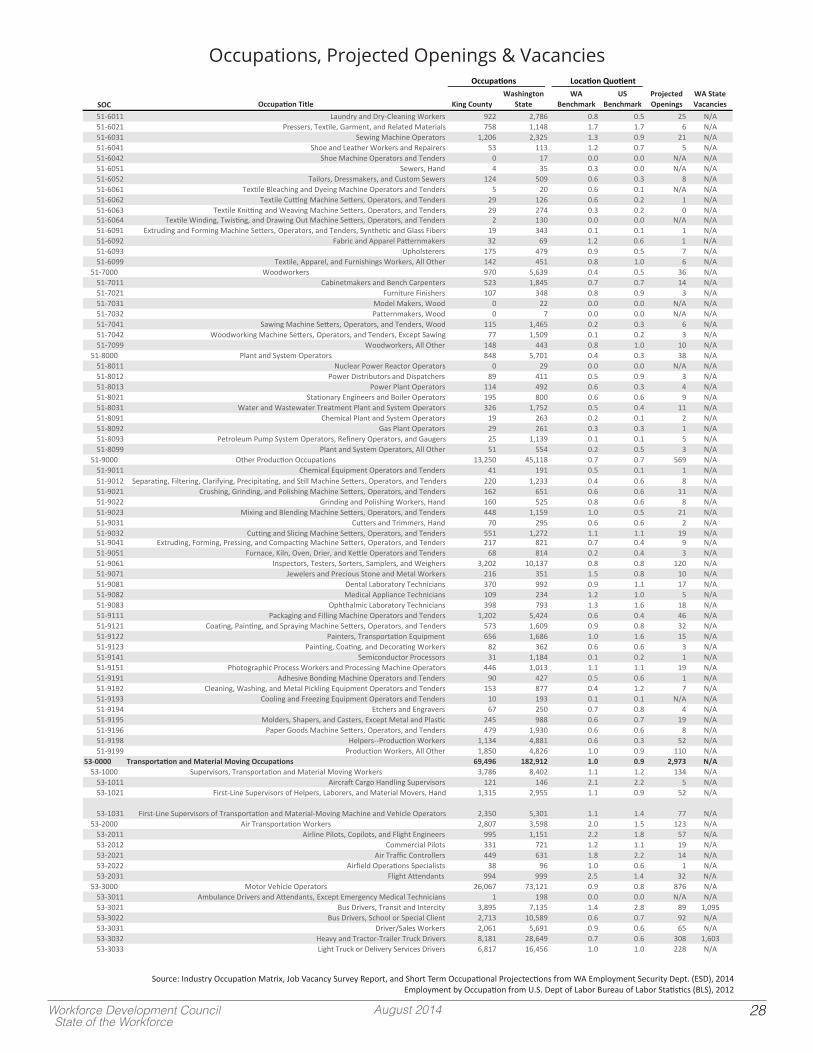
Workforce Development Council State of the Workforce
August 2014 28
SOC Occupation gniKeltiT CountyWashington
StateWA
BenchmarkUS
BenchmarkProjected Openings
WA State Vacancies
51- yrdnuaL1106 and Dry-Cleaning Workers 922 2,786 0.8 0.5 25 N/A51- ,sresserP1206 Textile, Garment, and Related Materials 758 1,148 1.7 1.7 6 N/A51- gniweS1306 Machine Operators 1,206 2,325 1.3 0.9 21 N/A51- eohS1406 and Leather Workers and Repairers 53 113 1.2 0.7 5 N/A51- eohS2406 Machine Operators and Tenders 0 17 0.0 0.0 N/A N/A51-6051 Sewers, Hand 4 35 0.3 0.0 N/A N/A51- ,sroliaT2506 Dressmakers, and Custom Sewers 124 509 0.6 0.3 8 N/A51- elitxeT1606 Bleaching and Dyeing Machine Operators and Tenders 5 20 0.6 0.1 N/A N/A51- elitxeT2606 Cutting Machine Setters, Operators, and Tenders 29 126 0.6 0.2 1 N/A51- elitxeT3606 Knitting and Weaving Machine Setters, Operators, and Tenders 29 274 0.3 0.2 0 N/A51-6064 Textile Winding, Twisting, and Drawing Out Machine Setters, Operators, and Tenders 2 130 0.0 0.0 N/A N/A51-6091 Extruding and Forming Machine Setters, Operators, and Tenders, Synthetic and Glass Fibers 19 343 0.1 0.1 1 N/A51- cirbaF2906 and Apparel Patternmakers 32 69 1.2 0.6 1 N/A51-6093 Upholsterers 175 479 0.9 0.5 7 N/A51- ,elitxeT9906 Apparel, and Furnishings Workers, All Other 142 451 0.8 1.0 6 N/A
51- A/N635.04.0936,5079srekrowdooW000751- srekamtenibaC1107 and Bench Carpenters 523 1,845 0.7 0.7 14 N/A51- erutinruF1207 Finishers 107 348 0.8 0.9 3 N/A51- ledoM1307 Makers, Wood 0 22 0.0 0.0 N/A N/A51- ,srekamnrettaP2307 Wood 0 7 0.0 0.0 N/A N/A51- gniwaS1407 Machine Setters, Operators, and Tenders, Wood 115 1,465 0.2 0.3 6 N/A51- gnikrowdooW2407 Machine Setters, Operators, and Tenders, Except Sawing 77 1,509 0.1 0.2 3 N/A51- ,srekrowdooW9907 All Other 148 443 0.8 1.0 10 N/A
51- tnalP0008 and System A/N833.04.0107,5848srotarepO51- raelcuN1108 Power Reactor Operators 0 29 0.0 0.0 N/A N/A51- rewoP2108 Distributors and Dispatchers 89 411 0.5 0.9 3 N/A51- rewoP3108 Plant Operators 114 492 0.6 0.3 4 N/A51- yranoitatS1208 Engineers and Boiler Operators 195 800 0.6 0.6 9 N/A51- retaW1308 and Wastewater Treatment Plant and System Operators 326 1,752 0.5 0.4 11 N/A51- lacimehC1908 Plant and System Operators 19 263 0.2 0.1 2 N/A51- saG2908 Plant Operators 29 261 0.3 0.3 1 N/A51- muelorteP3908 Pump System Operators, Refinery Operators, and Gaugers 25 1,139 0.1 0.1 5 N/A51- tnalP9908 and System Operators, All Other 51 554 0.2 0.5 3 N/A
51- rehtO0009 Production A/N9657.07.0811,54052,31snoitapuccO51- lacimehC1109 Equipment Operators and Tenders 41 191 0.5 0.1 1 N/A51-9012 Separating, Filtering, Clarifying, Precipitating, and Still Machine Setters, Operators, and Tenders 220 1,233 0.4 0.6 8 N/A51-9021 Crushing, Grinding, and Polishing Machine Setters, Operators, and Tenders 162 651 0.6 0.6 11 N/A51- gnidnirG2209 and Polishing Workers, Hand 160 525 0.8 0.6 8 N/A51- gnixiM3209 and Blending Machine Setters, Operators, and Tenders 448 1,159 1.0 0.5 21 N/A51- srettuC1309 and Trimmers, Hand 70 295 0.6 0.6 2 N/A51- gnittuC2309 and Slicing Machine Setters, Operators, and Tenders 551 1,272 1.1 1.1 19 N/A51-9041 Extruding, Forming, Pressing, and Compacting Machine Setters, Operators, and Tenders 217 821 0.7 0.4 9 N/A51- ,ecanruF1509 Kiln, Oven, Drier, and Kettle Operators and Tenders 68 814 0.2 0.4 3 N/A51- ,srotcepsnI1609 Testers, Sorters, Samplers, and Weighers 3,202 10,137 0.8 0.8 120 N/A51- sreleweJ1709 and Precious Stone and Metal Workers 216 351 1.5 0.8 10 N/A51- latneD1809 Laboratory Technicians 370 992 0.9 1.1 17 N/A51- lacideM2809 Appliance Technicians 109 234 1.2 1.0 5 N/A51- cimlahthpO3809 Laboratory Technicians 398 793 1.3 1.6 18 N/A51- gnigakcaP1119 and Filling Machine Operators and Tenders 1,202 5,424 0.6 0.4 46 N/A51- ,gnitaoC1219 Painting, and Spraying Machine Setters, Operators, and Tenders 573 1,609 0.9 0.8 32 N/A51- ,sretniaP2219 Transportation Equipment 656 1,686 1.0 1.6 15 N/A51- ,gnitniaP3219 Coating, and Decorating Workers 82 362 0.6 0.6 3 N/A51- rotcudnocimeS1419 Processors 31 1,184 0.1 0.2 1 N/A51- cihpargotohP1519 Process Workers and Processing Machine Operators 446 1,013 1.1 1.1 19 N/A51- evisehdA1919 Bonding Machine Operators and Tenders 90 427 0.5 0.6 1 N/A51-9192 Cleaning, Washing, and Metal Pickling Equipment Operators and Tenders 153 877 0.4 1.2 7 N/A51- gnilooC3919 and Freezing Equipment Operators and Tenders 10 193 0.1 0.1 N/A N/A51- srehctE4919 and Engravers 67 250 0.7 0.8 4 N/A51- ,sredloM5919 Shapers, and Casters, Except Metal and Plastic 245 988 0.6 0.7 19 N/A51- repaP6919 Goods Machine Setters, Operators, and Tenders 479 1,930 0.6 0.6 8 N/A51- srepleH8919 --Production Workers 1,134 4,881 0.6 0.3 52 N/A51- noitcudorP9919 Workers, All Other 1,850 4,826 1.0 0.9 110 N/A
53-0000 Transportation and Material Moving A/N379,29.00.1219,281694,96snoitapuccO53-1000 Supervisors, Transportation and Material Moving A/N4312.11.1204,8687,3srekroW
53- tfarcriA1101 Cargo Handling Supervisors 121 146 2.1 2.2 5 N/A53- tsriF1201 -Line Supervisors of Helpers, Laborers, and Material Movers, Hand 1,315 2,955 1.1 0.9 52 N/A
53-1031 First-Line Supervisors of Transportation and Material-Moving Machine and Vehicle Operators 2,350 5,301 1.1 1.4 77 N/A53- riA0002 Transportation A/N3215.10.2895,3708,2srekroW
53- enilriA1102 Pilots, Copilots, and Flight Engineers 995 1,151 2.2 1.8 57 N/A53-2012 Commercial Pilots 331 721 1.2 1.1 19 N/A53- riA1202 Traffic Controllers 449 631 1.8 2.2 14 N/A53- dleifriA2202 Operations Specialists 38 96 1.0 0.6 1 N/A53-2031 Flight Attendants 994 999 2.5 1.4 32 N/A
53- rotoM0003 Vehicle A/N6788.09.0121,37760,62srotarepO53-3011 Ambulance Drivers and Attendants, Except Emergency Medical Technicians 1 198 0.0 0.0 N/A N/A53- suB1203 Drivers, Transit and Intercity 3,895 7,135 1.4 2.8 89 1,09553- suB2203 Drivers, School or Special Client 2,713 10,589 0.6 0.7 92 N/A53- selaS/revirD1303 Workers 2,061 5,691 0.9 0.6 65 N/A53- yvaeH2303 and Tractor-Trailer Truck Drivers 8,181 28,649 0.7 0.6 308 1,60353- thgiL3303 Truck or Delivery Services Drivers 6,817 16,456 1.0 1.0 228 N/A
Location QuotientOccupations
Occupations, Projected Openings & Vacancies
Source: Industry Occupation Matrix, Job Vacancy Survey Report, and Short Term Occupational Projectections from WA Employment Security Dept. (ESD), 2014Employment by Occupation from U.S. Dept of Labor Bureau of Labor Statistics (BLS), 2012

Workforce Development Council State of the Workforce
August 2014 29
SOC Occupation gniKeltiT CountyWashington
StateWA
BenchmarkUS
BenchmarkProjected Openings
WA State Vacancies
53- ixaT1403 Drivers and Chauffeurs 2,026 3,718 1.4 1.1 81 N/A53- rotoM9903 Vehicle Operators, All Other 373 685 1.4 0.7 13 N/A
53- liaR0004 Transportation A/N035.05.0406,2655srekroW53- evitomocoL1104 Engineers 158 881 0.5 0.5 10 N/A53-4012 Locomotive Firers 0 1 0.0 0.0 N/A N/A53- liaR3104 Yard Engineers, Dinkey Operators, and Hostlers 3 12 0.6 0.1 N/A N/A53- daorliaR1204 Brake, Signal, and Switch Operators 44 235 0.5 0.2 2 N/A53- daorliaR1304 Conductors and Yardmasters 245 1,325 0.5 0.7 13 N/A53- yawbuS1404 and Streetcar Operators 100 113 2.2 1.3 5 N/A53- liaR9904 Transportation Workers, All Other 6 37 0.4 0.2 N/A N/A
53- retaW0005 Transportation A/N8322.61.2439,4161,4srekroW53- sroliaS1105 and Marine Oilers 1,983 2,352 2.1 7.5 103 N/A53- ,sniatpaC1205 Mates, and Pilots of Water Vessels 1,390 1,658 2.1 4.8 90 N/A53- taobrotoM2205 Operators 16 59 0.7 0.6 1 N/A53-5031 Ship Engineers 772 865 2.2 8.7 44 N/A
53- rehtO0006 Transportation A/N9615.12.1131,8710,4srekroW53- egdirB1106 and Lock Tenders 60 67 2.3 2.0 2 N/A53- gnikraP1206 Lot Attendants 2,465 3,373 1.8 2.3 97 N/A53- evitomotuA1306 and Watercraft Service Attendants 568 2,438 0.6 0.6 31 N/A53-6041 Traffic Technicians 57 138 1.0 1.0 2 N/A53- noitatropsnarT1506 Inspectors 295 993 0.7 1.4 7 N/A53- noitatropsnarT1606 Attendants, Except Flight Attendants 166 217 1.9 0.9 6 N/A53- noitatropsnarT9906 Workers, All Other 406 905 1.1 1.3 24 N/A
53- lairetaM0007 Moving A/N304,18.09.0221,28201,82srekroW53- royevnoC1107 Operators and Tenders 263 934 0.7 0.8 11 N/A53- enarC1207 and Tower Operators 434 1,488 0.7 1.2 22 N/A53-7031 Dredge Operators 1 17 0.1 0.1 N/A N/A53- gnitavacxE2307 and Loading Machine and Dragline Operators 262 676 1.0 0.6 13 N/A53- tsioH1407 and Winch Operators 12 144 0.2 0.5 1 N/A53- lairtsudnI1507 Truck and Tractor Operators 3,614 11,256 0.8 0.9 153 N/A53- srenaelC1607 of Vehicles and Equipment 2,243 6,554 0.9 0.8 99 N/A53- srerobaL2607 and Freight, Stock, and Material Movers, Hand 15,288 38,143 1.0 0.8 852 90853- enihcaM3607 Feeders and Offbearers 359 2,423 0.4 0.4 14 N/A53- srekcaP4607 and Packagers, Hand 4,820 17,133 0.7 0.9 202 N/A53- saG1707 Compressor and Gas Pumping Station Operators 26 40 1.6 0.7 1 N/A53- pmuP2707 Operators, Except Wellhead Pumpers 46 90 1.3 0.4 3 N/A53- esufeR1807 and Recyclable Material Collectors 327 1,901 0.4 0.3 20 N/A53- knaT1217 Car, Truck, and Ship Loaders 166 466 0.9 1.6 5 N/A53-7199 Material Moving Workers, All Other 241 857 0.7 1.0 7 N/A
Location QuotientOccupations
Occupations, Projected Openings & Vacancies
Source: Industry Occupation Matrix, Job Vacancy Survey Report, and Short Term Occupational Projectections from WA Employment Security Dept. (ESD), 2014Employment by Occupation from U.S. Dept of Labor Bureau of Labor Statistics (BLS), 2012