State Excise Taxation: Cart-and-Buggy Obsolescence in …mason.gmu.edu/~rwagner/Excise Taxes, Tax...
50
State Excise Taxation: Cart-and-Buggy Obsolescence in an Electronic Age Richard E. Wagner George Mason University One famous old saying asserts that “an old tax is a good tax.” If so, selective excise taxes must be particularly good taxes, as they have been around at least since the 16 th century. 1 An accumulating body of evidence, however, shows this old saying sometimes to be wrong. Excise taxation originated when people walked or rode on horseback, when rides in a stagecoach were luxuries, when people sent letters by post, and when the typical economic transaction involved the transfer of some material and often bulky item. In the face of instant communication, rapid transportation, and expanding importance of services and non-material capital, excise taxes increasingly are becoming obsolete, and with the persistence of excise taxes coming increasingly to present problems of compliance and enforcement. While excise taxes raise a modest amount of revenue, they also cause kidnappings and even murders, encourage organized crime, and divert law enforcement away from more productive activities. The modern age of fast travel and instant communication has made this 16 th century tax practice increasingly obsolete. Unfortunately, governments are generally slow to adapt to changing circumstances, as the persistence of our obsolete social security programs illustrates strikingly. Since the development of broad-based taxes on income and sales in the first third of the 20 th century, excise taxes have receded in overall fiscal 1 For splendid examinations of tax history, see Charles Adams (1993) and Carolyn Webber and Aaron Wildavsky (1986).
Transcript of State Excise Taxation: Cart-and-Buggy Obsolescence in …mason.gmu.edu/~rwagner/Excise Taxes, Tax...
State Excise Taxation: Cart-and-Buggy Obsolescence in an Electronic Age
Richard E. Wagner George Mason University
One famous old saying asserts that “an old tax is a good tax.” If so,
selective excise taxes must be particularly good taxes, as they have been around
at least since the 16th century.1 An accumulating body of evidence, however,
shows this old saying sometimes to be wrong. Excise taxation originated when
people walked or rode on horseback, when rides in a stagecoach were luxuries,
when people sent letters by post, and when the typical economic transaction
involved the transfer of some material and often bulky item. In the face of instant
communication, rapid transportation, and expanding importance of services and
non-material capital, excise taxes increasingly are becoming obsolete, and with
the persistence of excise taxes coming increasingly to present problems of
compliance and enforcement. While excise taxes raise a modest amount of
revenue, they also cause kidnappings and even murders, encourage organized
crime, and divert law enforcement away from more productive activities. The
modern age of fast travel and instant communication has made this 16th century
tax practice increasingly obsolete. Unfortunately, governments are generally
slow to adapt to changing circumstances, as the persistence of our obsolete
social security programs illustrates strikingly.
Since the development of broad-based taxes on income and sales in the
first third of the 20th century, excise taxes have receded in overall fiscal
1 For splendid examinations of tax history, see Charles Adams (1993) and Carolyn Webber and Aaron Wildavsky (1986).

significance. They simply cannot generate the huge volume of revenue that is
required to fuel the machinery of today’s large governments. On a nationwide
basis, states now derive about two-thirds of their tax revenue from their taxation
of individual incomes and retail sales. As Table 1 shows, all but seven states
impose a tax on individual income while all but five states impose a tax on retail
sales, and only Alaska, with its huge revenues from severance fees on mineral
deposits, taxes neither. In contrast, selective excise taxes provide less than one-
sixth of state tax revenue nationwide. In only nine states do selective excise
taxes provide 25 percent or more of state tax revenue; three of those are states
without an income tax (Nevada, South Dakota, and Tennessee) and two are
states without a retail sales tax (Montana and New Hampshire). Toa be sure, for
large governments even small percentages can represent significant totals. For
fiscal 2002, all states combined raised over $82 billion from selective excise
taxes. Texas led the states, collecting just over $9 billion through selective
excise taxes. Even Wyoming, which collected the least, still collected over $98
million.2
The taxation of gasoline is far and away the largest source of excise tax
revenue. Nationwide, it generates nearly 40 percent of all state excise tax
revenue, which in turn is six percent of total state tax revenue. As Table 2
shows, there were four states where the gasoline tax raised more than ten
percent of state tax revenue, while there was only one state where it raised less
than two percent. The next two most significant excise taxes, those on tobacco
2 These magnitudes are presented in Table E29 of the Tax Foundation’s Facts and Figures on Government Finance, 38th edition.
2

and on alcohol, are fiscally anemic in comparison. The combined revenues
collected by these two taxes were but 2.5 percent of total state tax collections
nationwide. There were but nine states were tobacco taxes provided at least two
percent of state tax revenue. There were only four states where alcohol taxes
did this.
A look inside the category of “other excises” in Table 2 illustrates the
narrow, penny-ante character of most excise taxes. This category is a
hodgepodge of numerous excise taxes on all kinds of commercial transactions.
It shows that the imposition of a large number of small taxes can eventually
collect a large amount of revenue. Among the larger items in this category are
taxes on insurance, utilities, and pari-mutuel betting. An examination of state tax
codes, however, shows a huge number of such excise taxes, each of which
typically generates a small amount of revenue. Some examples of such excise
taxes include those on the sale of tires, on the disposal of tires, on amusement
machines, on the rental of personal property, on cell phones, on billboard
advertising, on egg containers, on fish feed, on solid waste disposal, on bingo
games, on coin-operated Laundromats, on car rentals, on boat rentals, on syrup
for carbonated beverages, on trading stamps, on mobile homes, and on hotel
and motel rooms, to give just a few illustrations.
This essay starts by offering a short primer on selective excise taxation.
This primer is followed by an examination of the schizophrenic-like quality that
excise taxes possess. In some cases excise taxes are reasonable ways of
charging the users of governmental services for their usage; in other cases they
3
are instruments of tax discrimination, in that they enable those who are politically
influential to shift some of what would otherwise be their tax burdens onto those
who lack their political influence. The gas tax, for instance, appears to be a
generally reasonable way of charging road users for their usage. In contrast,
many of the other excise taxes, led by those on tobacco products, are means of
tax discrimination, whereby those who have the votes shift some of their taxes
onto those who don’t. While it is an understandable part of human nature to seek
to shift some of your taxes onto someone else, it is equally understandable to
seek to avoid being victimized by such tax discrimination. The desire to gain
through tax discrimination collides with the desire to avoid being victimized by tax
discrimination, and this collision generates many of the socially destructive
consequences of selective excise taxation that have been intensifying in our
time.
The growth of these destructive consequences brings us to a fork in the
road. One branch of that fork points in a traditional direction dominated by
increased effort to shore up the obsolete forms through ever intensifying efforts
at law enforcement of what must be an invasive, snooping, and threatening form.
The innovative branch of that fork points toward a genuine reinvention of
government, where service-oriented governments are evaluated by citizens
according to their willingness to support the services that government offers. By
following this innovative branch, governments and their means of finance would
move into the 21st century world of instantaneous communication, a service-
oriented economy, largely open borders, and a hugely shrunken world. The
4

exploration of these forks proceeds by examining the political economy of
selective excise taxation, giving particular reference to the taxation of tobacco
products, though the principles that are put in play there apply to excise taxation
in general.
A Primer on Selective Excise Taxation
Excise taxes are imposed on particular transactions as they occur. The
general tax on retail sales, which is used in all but five states, is an excise tax,
just as are selective excise taxes on tires or cell phones. The distinction between
the two forms of excise tax lies in the breadth of the transactions that are taxed.
A retail sales tax will tax most if not all of the items that someone buys in such a
retail outlet as a hardware store or a department store. A retail sales tax is often
described as a broad-based tax, to indicate that tax liability accrues broadly in
non-discriminatory fashion across some wide range of transactions. To be sure,
in no state is a retail sales tax truly general and non-discriminatory. There are
many categories of transaction that states exclude from their retail sales taxes,
and with the details of those exclusions differing among states. Some of the
major types of excluded transactions include the purchase of such personal
services as legal counsel and lawn care, the purchase of prescription drugs, and
the purchase of groceries. While these exclusions obviously discriminate among
transactions in the assignment of tax liability, the retail sales tax nonetheless
applies uniformly across what is still a relatively broad range of transactions.3
3 See the treatment of uniformity and discrimination in James Buchanan and Roger Congleton (1998).
5

In contrast, a selective excise tax picks out particular transactions to tax.
Tax discrimination and not tax uniformity is the key feature of selective excise
taxation, for only precisely targeted transactions are taxed. Furthermore, states
typically impose their retail sales taxes on top of their selective excise taxes.
Hence, an excise tax will first be imposed on a tire or a bottle of wine, on top of
which a sales tax is imposed when that tire or wine is bought.
With rare exception, any tax on something will induce people to reduce the
amount they buy. That reduction can occur in different ways, some of which
impose high costs on the rest of society. That reduction can occur passively, as
when people replace wine with grape juice or sparking water. Often, that
reduction will occur in a more active manner, as when people seek to buy the
same products while escaping the tax. There are several ways people can do
this. They can travel to another state to buy where the tax is lower. They can
use the internet to accomplish the same end. They can buy smuggled and
counterfeit products within the underground economy. The higher the excise tax,
the more strongly does it drive commercial activity underground and promote
smuggling and organized crime. Within this underground economy, moreover,
commercial disputes can be resolved only through violence that often snares
innocent by-standers in the crossfire.
The effect of tax discrimination on taxpayer psyche cannot be ignored in
thinking about different forms of taxation. Most taxpayers surely recognize the
essential truth in Justice Holmes’ famous dictum that taxes are the prices we pay
6
for civilization.4 We choose to tax ourselves because we secure valued public
services in return. A selective excise tax is generally something different. With
rare exceptions, people on whom excise taxes are imposed are not receiving
public services in return. A broad-based tax treats taxpayers in a uniform
manner. A retail sales tax asks people to make the same contribution to the
support of government regardless of the particular items they choose to buy. In
sharp contrast, a selective excise tax discriminates among taxpayers according
to what they choose to buy. The victims of excise tax discrimination are forced to
finance lower tax payments for those taxpayers who choose to buy things that
aren’t taxed. People may well recognize that a retail sales tax is a reasonable
way of supporting the general activities of a state, while at the same time
recognizing that a tax on wine is just a way that they are being victimized for the
benefit of people who don’t drink wine. There are many people who will think it is
wrong to escape a broad-based tax that everyone pays, and yet see nothing
wrong in escaping a discriminatory tax that only they are asked to pay. Tax
administration and collection becomes particularly troublesome in a setting where
the fiscal psyches of many people tell them that escaping a selective excise tax
is not wrong but smart.5
Excise Taxes for Charging Users: Gasoline Taxation
There are cases where an excise tax can resemble a market price, in that
it represents a way of charging consumers for the services they receive from
4 For an extended commentary on this dictum, see Richard Wagner (1998). 5 See the fascinating and valuable treatment of these kinds of themes in Wilson and Herrnstein (1985).
7

government. The contract between the tenants of a shopping mall and the owner
might express the rent as a percentage of sales. A rent that is expressed as,
say, two percent of sales, looks a lot like a sales tax of two percent. Yet the rent
is not a tax but rather is a particular form of market price. The mall owner
provides a variety of services that make the mall a more attractive place for
tenants to locate and customers to shop, and for which sales volume by
individual merchants seems to be a reasonable indicator of individual tenant
shares in the value created by the owner’s provision of service. Those services
might include such things as parking, maintenance, special exhibitions, and child-
care for customers. Furthermore, tenants can choose whether to locate in any
particular mall, and the pricing arrangements offered by an owner must be
sufficiently competitive to attract tenants who can always locate elsewhere.
While the gasoline tax is classified as just one selective excise tax among
many, it can reasonably be placed in a category of its own as a form of user
charge. To the extent revenues from gasoline taxes are earmarked for the
construction and maintenance of roads, the gasoline tax is an indirect method of
charging road users for their usage. A driver whose car gets 20 miles per gallon
is effectively paying one cent per mile for road usage, provided gas is taxed at 20
cents per gallon. A program that earmarked gasoline tax revenues for roads
would thus be an indirect way of charging people for their use of roads. A gas
tax is thus a close substitute to tolls as a method of charging road users for their
usage.
8

While these two methods of finance would be equivalent as a first
approximation, a closer examination reveals some significant differences
between indirect pricing through a gasoline tax and direct pricing through tolls.6
For one thing, roads are not financed exclusively by gasoline taxes, nor are
gasoline taxes used exclusively for roads. Furthermore, cars that make the
same usage of roads can pay different prices because of differences in fuel
consumption. A car that gets 40 miles per gallon will pay half the tax for the
same road usage as a car that gets 20 miles per gallon. Moreover, a gasoline
tax cannot deal with peak-load congestion. When peak-load congestion is
present, drivers impose congestion costs on each other that are in addition to the
gasoline taxes they pay. Direct pricing through tolls can charge higher prices
during periods of peak-congestion, which, in turn, will reduce congestion by
inducing some people to shift their road usage to off-peak periods.
While the gasoline tax does not allow for its indirect road charges to vary
by time of day and congestion, the relatively close connection it creates between
paying tax and receiving service still distinguishes it from most of the other
selective excise taxes. The gasoline tax is not genuinely an instrument of fiscal
discrimination, for someone who only walked or traveled by subway would pay
no gasoline tax to build and maintain roads that only other people used. To be
sure, the gasoline tax may well have become a relatively inefficient instrument in
the presence of recent technological advancement, and thereby offer further
testimony about the relatively weak operation of creativity within government.
6 For a collection of essays that examine the often large divergence between principle and practice in the earmarking of selective excise taxes, see Richard Wagner (ed.) (1991).
9
Recent technological developments have made it relatively inexpensive to install
systems that would allow for road usage by individual vehicles to be measured
just as individual usage of electricity is now measured.7 But governments almost
invariably lag and don’t lead in adopting new technologies.
Excise Taxes for Fiscal Discrimination: Tobacco Taxation
Most selective excise taxes are not about charging the users of
governmentally-provided services directly for their usage, but are methods of
discriminating against some taxpayers in favor of others. The dedication of
excise tax revenues for specific purposes is a growing fiscal practice. This
practice gives the appearance not simply of raising taxes but of charging users
for particular services, similar to the connection between gasoline taxes and road
usage. In most cases, however, this analogy between a dedicated excise tax
and a user charge fails because there is no connection between tax paid and
service received.
For example, Louisiana increased its cigarette tax from 24 cents a pack in
2002 to 36 cents in 2003. It also proposed, according to HB157, to dedicate this
12 cent increase to a variety of specific uses. Three cents was dedicated to the
Louisiana Cancer Research Center for general purposes, with another 2.04 cents
dedicated to it for a smoking prevention program. That program was to be
focused on mass media, and came with a requirement that part of the program
operate through Southern University. Another 1.96 cents was dedicated to the
Health Science Center at the Shreveport branch of Louisiana State University. 7 See, for instance, Gabriel Roth (1996).
10

Two cents per pack was dedicated to the Louisiana Department of Public Safety.
The remaining three cents was divided equally among a Drug Abuse Resistance
Program, the Louisiana Office of Addictive Disorders, and the Southern
University Agricultural Research and Extension Center (in conjunction with the
Louisiana State University Agricultural Center).
The dedication of cigarette tax revenues to these specific purposes has
nothing to do with providing programs for smokers. Programs that otherwise
would have to be financed through the general budget are financed instead by a
12 cents per pack increase in the cigarette tax. The dedication of cigarette tax
revenues in this instance has nothing to do with charging people for their use of
governmental services, and everything to do with creating a successful coalition
of supporters who would gain from enactment of the measure.
It is, of course, sometimes claimed that tobacco taxes are methods of
charging smokers for costs that they impose on nonsmokers. If this claim were
true, a tax on cigarettes might operate like the gasoline tax in charging the users
of services for their usage. This claim, however, is false. It is true that smokers
have lower life expectancy on average than nonsmokers. One observation that
is consistent with this finding is that smokers of the same age will incur higher
medical case costs than nonsmokers, on average. Another equally consistent
observation is that smokers will receive lower claims under social security and
Medicare than nonsmokers, on average, because of their lesser life expectancy.
When the two considerations are joined, it becomes clear that smokers do more
than pay their own way, for they also support nonsmokers. This finding has been
11
reported in such sources Robert Tollison and Richard Wagner (1988) (1992),
Willard Manning et al. (1989), Kip Viscusi (1992), and Jane Gravelle and Dennis
Zimmerman (1994). There is no way that the taxation of tobacco can be treated
as a variation on the gasoline tax principle of charging users for their usage of
publicly provided services.
Tobacco taxes, like many of the other selective excise taxes, are
instruments of tax discrimination. That discrimination, moreover, has intensified
as smokers have become more of a minority group within our society. Table 3
shows that nationwide 42.4 percent of adult Americans were smokers in 1965.
By 2003, that percentage had declined nearly in half, to 22.5 percent. Table 3
also shows that this decline, while continual, has slowed in recent years. There
is also a considerable variation among states in the percentage of adults who
smoke which is not shown in Table 3 but which is available from the same source
as Table 3. The state with the highest percentage of adult smoking is Kentucky,
where 32.4 percent of adults were estimated to be smokers. The lowest state
was Utah, where only 12.7 percent of adults were estimated to be smokers.
There were five states where smoking was more than 2.5 percentage points
below the nationwide average: these were California, Connecticut,
Massachusetts, New Jersey, and Utah. There were 13 states where smoking
was more than 2.5 percentage points above the nationwide average: these were
Alaska, Arkansas, Indiana, Kentucky, Mississippi, Missouri, Nevada, North
Carolina, Ohio, Oklahoma, South Carolina, Tennessee, and West Virginia.
12

As the prevalence of smoking among the adult population has declined
continually over the past half-century, this shift into an ever increasing minority
status been accompanied by ever increasing statutory tax rates, as Table 4
shows. In 1970, the highest tax was Pennsylvania’s tax of 18 cents per pack. By
1980, nine states had cigarette taxes of at least 18 cents per pack, with the
highest taxes belonging to Florida and Massachusetts at 21 cents per pack.
In 1990, Connecticut had the highest cigarette tax at 40 cents per pack. In 2003,
33 states had taxes that exceeded 40 cents per pack, and this is without taking
into account the implicit tax liability entailed by the master settlement.8 While
Connecticut and Massachusetts tied for the highest tax at $1.51 per pack, New
Jersey and New York were close behind at $1.50. New York City, moreover,
imposes its own cigarette tax of $1.50 per pack.
Tobacco taxation is a severe form of tax discrimination whose victims
reside primarily among the working classes and not professional people. It is tax
discrimination against people of modest means for the benefit of the well-to-do.
People who work in various blue collar occupations smoke much more heavily
than people who work in white collar and professional occupations. Among
predominately male occupations, Sterling and Weinkam (1976) reported that
54.6 percent of auto mechanics smoked while only 30.3 percent of lawyers
smoked (at a time when nationwide smoking prevalence was about 37 percent).
Among predominately female occupations, Sterling and Weinkam reported that
38.4 percent of nurses smoked while only 16.4 percent of librarians smoked. At
a more aggregate level of data, the National Center for Chronic Disease 8 For a wealth of information on tobacco taxation, see Orzechowski and Walker (2004).
13
Prevention and Health Promotion (www.cde.gov/tobacco/) reports that in 1985,
when 30.1 percent of adults were estimated to smoke, 39.7 percent of blue collar
workers smoked while only 27.5 percent of white collar workers smoked.
Tobacco taxes obviously hit blue collar workers more severely than they
hit white collar and professional workers. If tobacco taxes were expressed as a
share of the income earned by taxpayers, the rate of tax would rise as income
declined. A summary provided by the Tax Foundation for 2002
(www.taxfoundation.org/excisesbyincomefed.html), for instance, showed that the
federal tobacco tax (which is low relative to the tax imposed by many states)
struck ten times as heavily on someone who earns less than $20,000 annually
than it struck at someone who earns over $75,000. For an intensely
discriminatory tax that lowers taxes for the well-to-do, one would expect the
victims of that discrimination to be open to avenues of escape.
The Tobacco Settlement: Tax Farming Resurrected
A practice called tax farming has been traced back at least 4000 years to
ancient Mesopotamia. Real farmers raised food from their lands. Tax farmers
raised revenue from the people who inhabited those lands. The central idea of
tax farming was the same everywhere despite considerable local variation. A
ruler wants to extract revenue from his subjects, and hires someone to do this.
Typically a tax farmer would be awarded a monopoly to harvest taxes from a
particular area, and would retain part of what he was able to extract. Tax farming
has long been thought to be a tool of autocracy, for subjects were liable for
14

whatever the tax farmer was able to take from them. A tax farmer was not
concerned about notions of fairness or rules of law, and was concerned only to
satisfy himself and his ruler. Within a democracy, however, tax liability must be
assigned by the legislature, which renders tax farming unsuitable. At the same
time, however, the tobacco settlement reached in 1998 is surely a modern form
of tax farming. That settlement was equivalent to a rough doubling of state tax
rates. For instance, state tobacco tax collections at the time were about $8
billion annually, while the settlement was estimated to bring in around $10 billion.
What makes the analogy with tax farming complete is that the lawyer-tax farmers
were able to keep many billions of dollars for themselves.
In 1998 the Big Four tobacco companies (Philip Morris (now Altria), RJ
Reynolds, Lorillard, and Brown & Williamson) settled suits with 46 states. When
this settlement is added to the suits that had previously been settled with Florida,
Minnesota, Mississippi, and Texas, the aggregate value across all 50 states was
estimated at the time to be worth $246 billion over the following 25 years. Strictly
speaking, the settlement was not a tax increase but the settlement of a set of
suits that called for the tobacco companies to make payments to the states.
Despite differences in language, the settlement operated as a tax all the same.9
The tobacco settlement represents the intrusion of this ancient autocratic practice
into contemporary America. While the tobacco settlement is the largest
resurrection of tax farming that has appeared to date, other targets of extortion
through tax farming are in the offing, as Robert Levy (2002) explains in his
careful examination of using litigation as an alternative form of taxation. 9 An economic analysis of the settlement is provided in Richard Wagner (1999).
15

In the first year that the states received settlement revenues, 2000, those
revenues were nearly 50 percent higher than revenues that states collected
directly from their cigarette taxes. Table 5 shows that aggregate settlement
payments to the states exceeded $12 billion in 2000. In contrast, aggregate
state collections tobacco taxes that year were about $8.5 billion. Over the
following three years, settlement revenues have declined while tax revenues
have increased. Table 5 shows that settlement revenues totaled barely $8 billion
in 2003, while aggregate cigarette tax revenues for the states exceeded $11
billion. The rise in tax revenues is due to the continuing increase in state excise
taxes on tobacco products, as is portrayed in Table 4.
The continuing fall in revenues collected under the master settlement
illustrates a failure of the original revenue projections to hold up. Where
originally the settlement was projected to yield some $246 billion over 25 years,
that projection has now been revised downward to around $200 billion, and could
well be rejected downward again at some future date. Both the actions of states
in response to the settlement and their subsequent reactions in response to the
downward revisions in projections of future revenues cast illumination on the
political economy of excise taxation. Settlement revenues are declining due to
declining cigarette sales from the time of settlement. Revenues from tobacco
taxes are increasing because the sharp tax increases of recent years has so far
more than offset the decline in sales that those tax increases bring about. The
increasing rates of tax, however, are making less reliable the estimation of the
16

revenues to be expected from tax increases, which in turn renders such taxes
increasingly unreliable instruments of state finance.
Revenue Consequences of Excise Tax Increases
Table 6 shows both the projected and the actual revenues that were
attributed to increases in cigarette taxes in 21 states in 2002. In only two states
did actual revenues turn out to be larger than projected revenues. Almost
universally, actual revenues turned out to be less than what were projected to
result from the tax increase. Moreover, the gap between actual and projected
was often large, indicating that the projections were quite inaccurate. For 12 of
the states, actual revenues were down by more than 10 percent from projected
revenues. For six of the 21 states, actual revenues were down by more than 20
percent from projected revenues. These are substantial gaps between the
projected and the actual magnitudes. The inaccuracy of such projections
obviously creates difficulties for state fiscal planning. That inaccuracy, moreover,
will surely grow as the tax becomes higher, which will make excise taxes
increasingly unreliable instruments for state fiscal planning.
To illustrate the problem of projecting tax revenues, consider a stylized
American state that has a population of 5 million, and where 350 million packs of
cigarettes are sold annually. The price of cigarettes is $3 per pack, and the state
is contemplating a $1 per pack tax increase. If sales remained steady at 350
million packs, the tax would raise $350 million per year. But sales won’t remain
steady. They will fall due to the higher price the tax increase brings about. But
17
by how much will they fall? Economists use the concept of elasticity of demand
to express the extent to which sales will fall as price rises. For cigarettes,
elasticity has generally been placed at about one-third. What this means is that
the 33 percent increase in price that the $1 tax increase would represent would
reduce cigarette sales by 11 percent. In consequence, annual sales will fall from
350 million packs to 312.5 million packs. Hence the $1 per pack tax would raise
$312.5 million and not $350 million.
People who make revenue estimates for state governments know about
elasticities, of course, and take them into account. If elasticities were fixed
numbers, it would be relatively easy to estimate the revenue impact of a tax
increase. But elasticities aren’t fixed, they are variable. Elasticities increases as
taxes increase, which makes old guidelines obsolete. An elasticity of one-third
might be pretty accurate when taxes are a dime per pack. But when taxes are
increased ten-fold to a dollar a pack, those old elasticity estimates become
outdated. The reason for this obsolescence is that people seek out other
channels of commerce that they did not seek out when taxes were lower. They
cross state borders to shop. They use the internet to shop. They come across
vendors who are selling lower-taxed or even untaxed cigarettes, as well as
counterfeit cigarettes. And they do these things with increasing intensity as the
tax rate rises. For these reasons, standard revenue projections become
increasingly unreliable as excise taxes are increased.
18

Public Debt Follies Inspired by the Master Settlement Windfall
The Master Settlement Agreement roughly doubled state cigarette taxes,
even though it came in the guise of the settlement of a legal suit and not a tax
increase. All the same, state tobacco revenues increased sharply without the
states having actually to raise taxes. The original basis for the suit was to allow
states to recover what they claimed were smoking-related Medicare expenses.
The subsequent state use of settlement revenues, however, has had little to do
with Medicaid, or even tobacco use in general. The settlement windfall set in
motion a tobacco spending frenzy where legislatures boosted appropriations on
objects from A to Z. A report on the state use of settlement revenues issued by
the General Accounting Office found that only seven percent of those revenues
went to programs relating to smoking and its cessation and prevention. The
other 93 percent went to support the whole range of governmental activities.
Smith, Wakefield, and Nichter (2003) surveyed press reports of the use of
settlement revenues through the nation. Some of the uses of settlement
revenues they reported were the funding of laptop computers for legislators, the
placement of Asthma equipment in classrooms, programs to discourage the use
of illicit drugs, the construction of university buildings, the purchase of text books
for parochial schools, and pay increases for public officials.
Even the seven percent of settlement revenues that find their way into
tobacco control programs may be used in peculiar ways when the details are
examined closely. The Minneapolis Star Tribune reported on such an episode in
November 18, 2001, in a column by David Phelps and Deborah Caulfield Rybak.
19

The Minnesota Partnership for Action Against Tobacco (MPAAT) was created as
part of the settlement agreement, being given $202 million and a charter that
runs until 2023. Phelps and Rybak report that of the $4.6 million MPAAT
awarded in its first round of grants, 82 percent went to members of its advisory
boards. A good deal of MPAATs money went into the sponsorship and
promotion of no-smoking ordinances throughout Minnesota, with most of those
ordinances failing to pass. A glossy and expensive public relations campaign it
sponsored did win a national award, while a variety of less costly and non-glitzy
programs were rejected by MPAAT. This is not to claim that inferior programs
were supported over superior programs. There is no way to determine this. It is
only to say that even to find that seven percent of settlement revenues go for
tobacco-related programs does not mean that those funds are being used
effectively, as against being used to support the pet causes of those who were
able to gain control of those revenues.
The Master Settlement windfall made it appear initially as though states
could count on receiving an additional $246 billion over the next 25 years without
having to raise taxes. It is well recognized that democratic polities face strong
temptations to expand spending by borrowing rather than by taxing. With a tax,
the costs are borne now, but with borrowing they can be postponed. What
results is a strong tendency for democracies to be in deficit (Buchanan and
Wagner 1977). It is much easier for legislatures to appropriate than to tax.
There is never enough money to go around for all requests for appropriation, but
20
the ability to borrow allows legislatures to support more requests than they could
support if they were limited wholly to appropriating tax revenues.
The Master Settlement opened a new opportunity for deficit finance. To
start, the settlement revenues were not officially a tax but were rather a legally-
generated windfall. Consequently, borrowing against those revenues could
hardly represent a state debt. A good number of states developed ways of doing
just this, which would allow them to spend now settlement revenues that wouldn’t
accrue for a quarter-century or more. They did this by creating special
authorities that would receive the settlement revenues, and which could issue
bonds that were backed by future settlement revenues. For example, California
created a Golden State Tobacco Securitization Corporation, New York created
an Ambac Assurance Corporation, Oregon created a Financial Assurance
Corporation, and Wisconsin created a Badger Tobacco Asset Securitization
Corporation. These special authorities fueled the tobacco spending frenzy that
the Master Settlement Agreement set in motion.
Public debt allows governments to shift some of the cost of present
expenditure onto the future. For people today who want more state spending
now, this is a good deal. For people in the future, it is not so hot of a deal.
Subsequent developments regarding settlement revenues made this tobacco
spending frenzy even a worse deal than it might have appeared initially to be. In
columns issued by Bloomberg.com for November 22, 2004 and January 31,
2005, Joe Mysak reports on the experiences in New York and New Jersey
respectively. The details differ a bit between the two states, but the story line is
21

the same, and is also the same as can be found in a number of other states that
have followed the same path of transferring future settlement revenues into
current spending by borrowing against future settlement revenues by creating a
special authority to receive those revenues. How much this state-created
authority will have to pay to sell those bonds depends on how confident potential
buyers are that they will be paid in the future. Mysak reports that a New Jersey
issue had to promise to pay 6.03 percent when ordinary state bonds would have
to pay only 4.58 percent.
The decline in projected settlement revenues has made the matter worse
for future state taxpayers. Those settlement revenues have now been projected
downward by about 20 percent, from $246 billion to $200 billion. This reduces
sharply the willingness of investors to buy those bonds. In consequence, the
price offered to place such bonds could well rise to 8 or 9 percent, Mysak notes,
further increasing the burden on future taxpayers. To avoid this situation, states
have started to pledge their other tax revenues to support their various tobacco
securitization corporations. For instance, New Jersey has now dedicated 51
cents of its cigarette tax to this purpose. Indeed, an article in the New York
Times reported that Moody’s had rated such an issue from the New Jersey
Economic Development Authority at Baaa2, which is only one notch above the
lowest investment grade rating of Baaa3.10
10www.nytimes.com/2004/10/07/nyregion/07tobacco.html.
22

Misguided Claims about Harmful Tax Competition
When governments in close proximity to one another impose different tax
rates on retail transactions, people have some incentive to shift their purchases
from higher-tax to lower-tax jurisdictions. The greater the difference in tax, the
stronger will be the incentive to make that shift. Whether any particular person
will actually make the shift will also depend on the costs that would be incurred in
doing so. In most cases, more time will be required to shop in lower-tax
jurisdictions, due to the greater distance that must be traveled. The saving in tax
must exceed the various added costs of shopping in the lower-tax jurisdiction, to
make it rational to shift patronage.
The customary image of cross-border shopping is of someone driving in a
car. It is this image that assimilates the cost of shopping to time spent traveling,
along with associated automobile expenses. The growth of internet commerce
presents a different situation. Travel time and automobile expenses are no
longer involved. In their place are delivery charges, which are generally less.
The ability of people to escape high excise taxes tax through cross-border
shopping and internet commerce has provoked numerous charges that tax
competition can become excessive or harmful. There are, of course, two distinct
issues involved here: one concerns the existence or strength of cross-border
shopping, the other concerns an evaluation of the consequences of cross-border
shopping.
The existence of cross-border shopping has been demonstrated in
numerous instances. For instance, William fox (1986) examined cross-border
23

shopping for three areas in Tennessee: Chattanooga which borders Georgia, Tri-
cities which borders Virginia, and Clarksville which borders Kentucky. Austan
Goolsbee (2000) examined internet shopping. In both instances, shopping
patterns were found to be sensitive to differences in tax rates and tax structures.
A state that taxes a product more heavily than a neighboring state will lose sales
to that neighboring state, with the amount of loss varying directly with the
magnitude of the tax differential and inversely with the cost of getting to the out-
of-state vendor (which is miniscule for internet commerce).
Similarly, Patrick Fleenor (1998) examined cross-border cigarette sales,
while in a companion piece Fleenor (1999) examined cross-border sales of beer.
In both cases, significant amounts of cross border shopping in response to tax
differentials were detected, as states with high tax rates lost sales to states with
low tax rates. With respect to those lost sales, moreover, there is no reason to
presume that the only sales that are lost are sales of the high-taxed items. In
Fleenor’s study of cross-border beer sales, he estimated that Alabama lost $9
billion in tax collections from beer sales that residents of Alabama made in one of
its four neighboring states, each of which had a lower tax rate. What is surely
plausible is that other items might have been purchased at the same time that
the beer was purchased, which would multiply the cross-border effect of tax
differentials. Fleenor’s study of cross-border cigarette sales, moreover,
distinguished among four types of cross-border effects: (1) purchases from
regular retail vendors in lower-tax states, (2) purchases from untaxed military
24

bases, (3) purchases from untaxed American Indian Reservations, and (4)
smuggling.
A 1990 study by Price Waterhouse presented a detailed examination of
two pairs of states with respect to cross-border responses to differences in tax
rates on cigarettes, alcoholic beverages, and gasoline; the details presented
there, moreover, were reinforced by the subsequent studies noted above. These
pairs were New Hampshire and Massachusetts and Indiana and Illinois. For both
pairs, the state with the lower tax rates had significantly higher sales than the
state with the higher tax rate. The lower tax state derives added tax revenue, its
merchants earn more, and there is increased employment that results from the
expanded market. Over the 1975-88 period examined by Price Waterhouse,
41.7 percent of cigarette sales in New Hampshire were estimated to have been
made to residents of Massachusetts. This was in response to a price differential
of about $2 per carton in favor of New Hampshire. For wine and distilled spirits, a
price differential of about $11 per gallon led to 29.3 percent of sales in New
Hampshire estimated to have been made to residents of Massachusetts. While
New Hampshire gained retail sales and employment, along with tax revenue,
Massachusetts lost. The number of cigarettes sold per resident is about three
times as high in New Hampshire as it is in Massachusetts. This is not because
people in New Hampshire are smoking fiends, for surveys seem to show similar
patterns of smoking in each state. The difference in sales is a product of
Massachusetts having a tax rate ($1.51 per pack) that nearly triples that in New
Hampshire ($0.52 per pack).
25

It is clear that competition among jurisdictions keeps taxes lower than they
would otherwise be. Monopoly generates higher prices than competition; this
simple observation holds for governments at least as well as it holds for
businesses. It is surely peculiar to argue that competition is good commercially
and harmful politically. Such an argument could be made only by assuming that
governments invariably use power wholly for good and never for bad, and with
the amount of good achieved varying directly with the amount of power held. No
one who remembers the 20th century could ever make that claim.
It should hardly be surprising that open borders and freedom of movement
leads to lower total tax collections than would result in a world with closed
borders and a single government. But this does not render the competitive
situation pathological and in need of correction. The situation would be
pathological only if the residents of the various units were failing to secure
publicly provided services commensurate with the willingness of those residents
to pay for those services. But this situation is not the one we observe.
It is, of course, possible to construct a logically valid argument that is
nonetheless wrong. “John is a baby. All babies cry a lot. Therefore, John cries
a lot.” Logically speaking, this argument is valid. It may, however, be wrong.
John might not cry a lot, even though he is a baby. If the premise “all babies cry
a lot” is granted, the rest follows as a matter of logic. A valid argument derived
from a false premise can lead to nonsense. To say that many babies cry a lot, or
even that most of them do, does not mean that all of them do.
26
Arguments about harmful tax competition are similar in their structure:
“Competition keeps taxes low. Low taxes prevent governments from supplying
vital public needs. Therefore, competition prevents governments from supplying
vital public needs.” The argument follows logically from a false premise. The
false premise is that low taxes prevent governments from supplying vital public
needs.
Think of what it means to claim that competition prevents a government
from supplying vital public needs. This describes a situation where taxpayers
would actually support a proposal to increase taxes to supply those services.
After all, taxes are imposed to provide public services. While no one likes to pay
taxes, if there is widespread agreement that additional public services would be
particularly valuable, there would be little opposition to proposals to increase
taxes to provide those services. There would be a general clamor for higher
taxation.
Such a clamor does not currently exist. Rather what we see are some
people supporting higher taxes and larger government, and mostly because
other people would pay those taxes. For instance, over 90 percent of the federal
income tax is now paid by but 50 percent of the taxpayers, which means that a
majority of taxpayers is nearly free of income tax. It is when taxes get heavy,
when they are used to finance unproductive and even counterproductive
programs, and when they are used simply to redistribute wealth from citizens in
general to the politically favored, that taxes evoke strong opposition. What keeps
27

taxes from becoming even higher than they might otherwise be is the ability of
people and capital to flee to friendlier, lower tax places.
Smuggling, High Taxation, and the Underground Economy
Someone who buys cigarettes in New York City now pays a combined
state and city tax of $3 per pack of cigarettes. It is unlikely that a smoker would
travel all the way to Virginia to buy cigarettes, even though the tax there is only
2.5 cents per pack. To be sure, people who live in Maryland, where the tax is $1
per pack, often travel to Virginia to buy cigarettes. But the potential tax saving
would have vanished well before the distance between New York and Virginia
was closed.
While it isn’t worthwhile for a New York consumer to travel to Virginia to
buy cigarettes, it is highly worthwhile for people to buy cigarettes in Virginia and
take them to New York to sell. The economic arithmetic of such smuggling is
very simple. A truckload of cigarettes will hold about 800 cases. This is 48,000
cases or 480,000 packs. A pack of cigarettes that sells for about $3 in Virginia
will fetch about $7 in New York City, mostly including the higher excise tax but
also including higher sales tax piled on the excise tax, along with some other
costs. An investment of $1.5 million in Virginia will return at least $3 million in
New York City. That is a fine return for a half-day drive by nearly anyone’s
calculation.
To be sure, that return comes with some risk of being detected and
punished. Only this does not appear to be much of a risk. Patrick Fleenor
28
(2003) reports on two pertinent estimates in this respect. One estimate is that
100,000 cartons were smuggled into New York City each day, whereas police
sized 70,000 cartons throughout the year. A later estimate put the smuggling at
110,000 cartons per day and the police seizures at 112,000 cartons per year.
Both of those estimates paint about the same picture, of police apprehending
about one-day’s worth of smuggling per year. This is an efficiency or detection
rating of about one-third of one percent, which is certainly not going to deter
people from seeking the strong returns that smuggling offers. Indeed, cigarette
smuggling would seem to be a more profitable activity than stealing armored
trucks, where armed guards must be confronted and where the payoffs are
perhaps but one-sixth of what driving a truckload of cigarettes from Virginia to
New York would offer. Fleenor reports that the sales of taxed cigarettes in New
York City fell by more than 50 percent following the imposition of the $3 tax. This
fall, of course, does not show that New Yorker’s reduced their smoking. What it
shows is how quickly smuggled cigarettes were able to replace former channels
of commercial distribution.
The press is full of stories these days about cigarette smuggling, for
smuggling is a natural consequence of high excise taxation. We should
remember, though, that what gets reported are only the instances where
smugglers are caught. The evidence noted above suggests that for each case
that is apprehended, another 350 or so are undetected. Hence, the press reports
capture but the very tip of the proverbial iceberg, with the true, deep reality of the
situation well hidden from our view. To be sure, even a glance at that very tip
29

gives great cause for concern. It is well-known that organized crime is heavily
involved in smuggling. The logistics of such high-volume operations in the
underground economy require a good deal of organization. Individuals may be
able to hawk smuggled cigarettes by the trunk load, but to graduate to truck load
size requires organizational sophistication.
Part of that organizational sophistication, it turns out, is supplied by
terrorist networks. For instance, Sari Horwitz in the Washington Post for June 8,
2004 reports on a federal conviction of a smuggling operation connected to the
terrorist group Hezbollah. In this case, cigarettes were bought in North Carolina
and taken to Michigan in rented vans. On August 22, 1997, the then Governor of
Michigan, John Engler, issued a proclamation declaring a “cigarette smuggling
emergency” in Michigan. That governments would call for more severe
enforcement efforts against underground activity is almost second nature. At the
same time, the shift of economic activities underground is a natural response to
high and discriminatory taxation. Governments face two options for dealing with
underground activity. One is to reduce the tax, which will ameliorate the problem
but will also limit the extent of government authority, something that governments
are loathe doing. The other option is to spend more on tax enforcement. That
governments might be generally biased toward enforcement is easy enough to
understand, but it not so clearly desirable.
High taxation is a close cousin to outright prohibition. Cigarettes are not
prohibited in New York City, but the tax rate is surely getting close to the
prohibitive region. Prohibition, after all, is equivalent to a tax that eliminates the
30

demand for the taxed product. The American experience with alcohol prohibition
is thus instructive regarding high taxation and the incentives to smuggle that high
taxation creates. Prohibition, of course, did not eliminate the demand for alcohol,
nor will the high taxation of cigarettes eliminate the demand for cigarettes. What
is eliminated is the desire to buy the high taxed versions of the product. With
respect to alcohol prohibition, the best estimates are that prohibition reduced
consumption by only around 30 percent. What prohibition accomplished was to
drive 70 percent of the market underground, where organized crime and its
distinct methods of resolving commercial disputes prevailed (Miron and Zweibel
1991). .
Ordinary commerce is open and public. Underground commerce must be
concealed and secret. This distinction has numerous implications for civility
within society. With open commerce, trust is easy to secure and contract
disputes can be resolved in the open through litigation or mediation. The ordinary
institutions of justice support the peaceful commercial activities of people. This
peaceful character of ordinary commerce is destroyed when it is forced
underground through high taxation or outright prohibition, because the mediating
and peace keeping institutions of justice are rendered useless. Within the
underground economy, a dispute over contract terms between a retailer and a
distributor could not be resolved in a court. Self help is the only possible remedy.
Often this takes the form of violence or threats of violence. Much of it also takes
the form of bribery of police and public officials. But even here, bribes do not
create contractual obligations that are enforceable in courts of law. Bribes are
31
contractual forms that are resolvable ultimately only through violence within the
underground economy. Due to the natural growth of underground activity in
response to high taxation and or outright prohibition, relatively little reduction in
consumption is achieved. The primary achievement lies in replacing open and
peaceful commercial activity with underground and violent activity, a side effect
of which is a significant deterioration of the quality of life within urban areas, as
Sam Staley (1992) explains with particular cogency.
The prohibition of alcohol created disrespect for the law, it launched
modern organized crime in America, it corrupted law enforcement and the court
system, and it harmed people financially, emotionally, and morally. Among other
things, organized crime has a comparative advantage in the enforcement of
contracts in the underground economy. It makes a large difference whether
underground activity is treated primarily as a problem of insufficient law
enforcement or as a problem of excessive taxation. The emphasis on greater law
enforcement leads to even higher taxes, as well as to greater surveillance,
snooping, informing, and a continuing restriction on civil liberties in an effort to
restrict the extent of underground activity. Yet underground activity arises only
when governments seek to restrict, through high taxation and even prohibition
(which is just a sufficiently high tax that no one would pay it), what would
otherwise be peaceful economic activities. Once the underground economy is
recognized primarily as a problem of high taxation, the focus is logically shifted
onto the need for sensible tax policies and tax levels.
32

Taxes, Entrepreneurship, and Government Finance
The various calls to restrict tax competition and to curb underground
transactions take for granted that present approaches to taxation represent the
best means available to finance government. Whatever transactions escape the
tax collector are thus deviations from this ideal base. But why are selective
excise taxes such perfect instruments of taxation? Once upon a time, they were
convenient taxes for governments to impose. Roads were poor, cars were slow,
and there was no alternative to the nationalized postal service. If you made a
retail purchase, it would be in a local store. A government could tax those sales
and not worry that shoppers would take their business elsewhere.
But times have changed, and in many ways. Roads are better. Cars are
faster. And there are now several ways that people can ship parcels to us. We
don’t even have to visit retail outlets anymore. We can sit at home, browse on
our computers, make our purchases, and soon our merchandise arrives. And
when we look at our invoice, we find most often that we have paid no sales tax.
Furthermore, we are evolving from an economy based on manufacturing to one
based on services, which in turn is accompanied by material images of capital
equipment giving way to such immaterial images as knowledge.
What are we to make of this evolution? Those who think that excise taxes
are the perfect instrument of government finance declare this situation to be an
abomination. Those people yearn for former, slower times. But those times are
not our times. We are all vastly more mobile now than we were then. Is it not
time for our governments to move forward as well? Taxes on mobile objects and
33

transactions are a thing of the past, a relic for a museum of tax history. Such
taxes will doubtless be with us for some time yet. After all, it took a while for
computers to replace typewriters. Even now, one can still see a typewriter every
so often.
One of the notable features of government is that they lag and do not lead
in things creative. In the case of taxation, governments will stick for quite some
time to a pre-electronic, pre-jet mentality, which means that mobility is going to
cause increasing problems when it confronts the voracious tax appetites of
modern governments. Eventually, those appetites will be scaled back, but that
scaling back will be rendered more traumatic, contested, and difficult so long as
governments continue to think of themselves as having an inherent right to tax
whatever they wish to tax, as if current conditions of mobility did not exit.
Think for a moment about your last visit to a hotel. That hotel might have
been quite plain, or it could have been relatively fancy. In either case it surely
had an elevator. What is an elevator but a subway that runs vertically, a form of
public transportation? The hotel provided security services as well as refuse
collection. It probably provided recreational facilities as well, perhaps an
exercise room, maybe a swimming pool, or perhaps even both, and possibly
even more recreational options.
This hotel, in other words, provided most or all of the services that you
commonly associate with the city where you live.11 Yet you didn’t pay anything
that looked like a tax. Your room charge paid not only for your room but also for
11 For an imaginative and constructive comparison of cities and hotels, see Spencer McCallum (1970).
34
various public-like services. A hotel is like a city. People conduct various
personal or private activities there, and at the same time are able to enjoy a
range of publicly available services. A hotel, however, does not try to finance its
activities by taxing highly mobile activities and people. It provides services that
people value, and which makes people willing to pay the room charges, charges
that are sufficient to cover the cost of those public-like services as well as the
cost of the rooms.
A hotel is, of course, operated as a business. This is to say that it seeks
to provide services that people are willing to buy. To the extent it does so,
people support it and the hotel flourishes. A hotel exists in a world of open
mobility and freedom of competition. People can take their meals inside the hotel
or out. They can have their drinks inside the hotel or out. A hotel must attract
residents, it cannot force them to stay and support the hotel. This is a lesson that
governments must come to learn. They must seek increasingly to attract
support. Their ability to demand and compel support will continue to weaken.
A well working government will be attractive to people. This attractiveness
will be reflected in the increased desires of people to locate within the boundaries
of that government, which in turn translated into increased land values. Public
services that make a government more desirable have the potential of paying for
themselves, just as any profitable commercial enterprise pays for itself. Such
considerations point toward a possible framework for injecting the entrepreneurial
and commercial principles of service provision into the conduct of government,
35
provided that competition, openness, and mobility can be maintained.12 While
governments are a following and not a leading edge of society, as our economic
organization and arrangements come increasingly to be based on open and easy
mobility, on services and immaterial capital, and on entrepreneurship, we will
surely find our governments coming along in evolution’s wake. What is uncertain
is not whether this evolution will happen, but only how quickly.13
12 In this regard, see, for instance, Fred Foldvary (2004) and Kenneth Wenzer, ed. (1999). 13 For instance, property owners in the vicinity of the Tysons Corner area of Fairfax County, Virginia, secured the creation of a special taxing district by which landowners agreed to special property assessments to help finance a Metrorail connection. This is a concrete illustration of the theme of entrepreneurial governance noted immediately above.
36

REFERENCES
Adams, Charles. 1993. For Good and Evil: The Impact of Taxes on the Course of Civilization. London: Madison Books. Buchanan, James M. and Wagner, Richard E. 1977. Democracy in Deficit: The Political Legacy of Lord Keynes. New York: Academic Press. Buchanan, James M. and Congleton, Roger D. 1998. Politics by Principle, Not Interest. Cambridge: Cambridge University Press. Fleenor, Patrick. 1998. How Excise Tax Differentials Affect Interstate Smuggling and Cross-Border Sales of Cigarettes in the United States. Washington: Tax Foundation. Fleenor, Patrick. 1999. How Excise Tax Differentials Affect Cross-Border Sales of Beer in the United States. Washington: Tax Foundation. Fleenor, Patrick. 2003. Cigarette Taxes, Black Markets, and Crime: Lessons from New York’s 50-Year Losing Battle. Washington: Cato Institute. Foldvary, Fred E. 2004. “Public Revenue from Land Rent.” In Handbook of Public Finance, ed. by Jürgen G. Backhaus and Richard E. Wagner (Norwell, MA: Kluwer Academic Publishers), pp. 165-94. Fox, William F. 1986. “Tax Structure and the Location of Economic Activity along State Borders.” National Tax Journal 39: 387-402. Goolsbee, Austan. 2000. “In a World without Borders: The Impact of Taxes on Internet Commerce.” Quarterly Journal of Economics 115: 561-76. Gravelle, Jane G. and Zimmerman, Dennis. 1994. Cigarette Taxes to Fund Health Care Reform: An Economic Analysis. Washington, D.C.: Congressional Research Service. Levy, Robert. 2002. “Taxation through Litigation.” In Donald P. Racheter and Richard E. Wagner, eds., Politics, Taxation, and the Rule of Law (Boston: Kluwer Academic Publishers), pp. 145-65. McCallum, Spencer. 1970. The Art of Community. Menlo Park, CA: Institute for Humane Studies. Manning, Willard G., et al. 1989. “The Taxes of Sin: Do Smokers and Drinkers Pay Their Way?” Journal of the American Medical Association 261: 1604-09.
37

Miron, Jeffrey A. and Zweibel, Jeffrey. 1991. "Alcohol Consumption during Prohibition." American Economic Review, Proceedings 81: 242-47. Orzechowski and Walker. 2004. The Tax Burden on Tobacco. Arlington, VA: Orzechowski and Walker. Price Waterhouse. 1990. An Examination of the Tax Incentives and Economic Consequences of Cross-Border Activity. New York: Price Waterhouse. Roth, Gabriel. 1996. Roads in a Market Economy. Brookfield, VT: Ashgate. Smith, K. M., Wakefield, M. A., and Nichter M. 2003. “Press Coverage of Master Settlement Agrrement Funds.” Tobacco Control 12: 257-63. Staley, Sam. 1992. Drug Policy and the Decline of American Cities. New Brunswick, NJ: Transaction Publishers. Sterling, T. and Weinkam, J. 1976. “Smoking Characteristics by Type of Employment.” Journal of Occupational Medicine 18: 743-54. Tax Foundation. 2005. Facts and Figures on Government Finance, 38th edition. Washington: Tax Foundation. Tollison, Robert D. and Wagner, Richard E. 1988. Smoking and the State. Lexinigton, MA: D. C. Heath. Tollison, Robert D. and Wagner, Richard E. 1992. The Economics of Smoking. Boston: Kluwer Academic Publishers. Viscusi, W. Kip Smoking: Making the Risky Decision. New York: Oxford University Press, 1992. Wagner, Richard E., ed. 1991. Charging for Government: User Charges and
Earmarked Taxes in Principle and Practice. London: Routledge. Wagner, Richard E. 1998. Taxation and the Price of Civilization: An Essay on
Federal Tax Reform. Washington: National Legal Center for the Public Interest.
Wagner, Richard E. 1999. “Understanding the Tobacco Settlement: The State
as a Partisan Plaintiff.” Regulation 22: 38-41. Webber, Carolyn and Wildavsky, Aaron. 1986. A History of Taxation and Expenditure in the Western World. New York: Simon and Schuster.
38

Wenzer, Kenneth C., ed. 1999. Land-Value Taxation: The Equitable and Efficient Source of Public Finance. Armonk, NY: M. E. Sharpe. Wilson, James Q. and Herrnstein, Richard J. 1985. Crime and Human Nature. New York: Simon & Schuster.
39

Table 1
Percentage Distribution of State Tax Collections by Source, Fiscal Year 2002 State Total
Taxes Individual Income
Corporation Income
General Retail Sales
Selective Excises (a)
Property Other Taxes
All States 100.0%
34.6% 4.8% 33.6%
15.4% 1.8% 9.8%
Alabama 100.0 31.2 5.0 26.9 25.1 3.0 8.9
Alaska 100.0 --- 24.7 --- 13.0 4.6 57.7
Arizona 100.0 24.7 4.1 50.5 12.6 3.9 4.2
Arkansas 100.0 29.9 3.4 37.3 13.4 9.3 6.7
California 100.0 42.5 6.9 30.6 8.9 2.5 8.7
Colorado 100.0 50.2 3.0 27.5 13.5 --- 5.9
Connecticut 100.0 40.8 1.7 33.7 16.3 --- 7.6
Delaware 100.0 33.0 11.6 --- 14.9 --- 40.6
Florida 100.0 --- 4.9 58.1 18.2 1.8 17.1
Georgia 100.0 47.1 4.1 35.1 8.6 0.4 4.7
Hawaii 100.0 32.5 1.6 47.1 14.8 --- 4.0
Idaho 100.0 37.1 3.4 35.0 14.1 --- 10.4
Illinois 100.0 31.0 9.2 28.6 20.8 0.3 10.3
Indiana 100.0 34.7 7.0 37.2 15.9 0.1 5.1
Iowa 100.0 35.3 1.8 34.9 15.8 --- 12.2
Kansas 100.0 38.6 2.5 37.4 13.2 1.1 7.2
Kentucky 100.0 33.6 3.8 29.0 17.9 5.5 10.2
Louisiana 100.0 24.3 3.6 31.6 25.4 0.5 14.6
Maine 100.0 40.9 2.9 31.8 15.3 1.8
40

7.3 Maryland 100.0 43.5 3.3 24.9 18.6 2.5
7.3 Massachusetts 100.0 53.4 5.5 24.9 10.2 0.0
6.0 Michigan 100.0 28.0 9.4 35.6 10.5 8.7
7.8 Minnesota 100.0 42.1 4.2 28.9 15.7 0.1
9.1 Mississippi 100.0 20.8 4.1 49.5 17.8 0.0
7.7 Missouri 100.0 41.4 3.4 32.7 14.7 0.2
7.5 Montana 100.0 35.9 4.7 --- 25.7 12.6
21.1 Nebraska 100.0 38.5 3.6 35.7 14.6 0.2
7.4 Nevada 100.0 --- --- 52.5 32.1 2.9
12.6 New Hampshire
100.0 3.7 19.9 --- 31.9 26.5 18.0
New Jersey 100.0 37.3 6.0 32.7 15.2 0.0 8.8
New Mexico 100.0 27.1 3.4 36.9 13.4 1.5 17.8
New York 100.0 59.1 5.2 19.9 10.4 --- 5.3
North Carolina 100.0 46.8 4.3 24.1 18.2 --- 6.7
North Dakota 100.0 17.9 4.5 30.1 25.4 0.1 22.0
Ohio 100.0 41.4 3.8 31.8 14.6 0.1 8.4
Oklahoma 100.0 37.8 2.9 25.3 12.3 --- 21.8
Oregon 100.0 71.2 3.8 --- 12.6 0.5 12.0
Pennsylvania 100.0 30.4 5.4 33.1 16.3 0.2 14.5
Rhode Island 100.0 38.7 1.3 34.4 20.2 0.1 5.4
South Carolina 100.0 34.0 3.8 40.6 14.3 0.2 7.1
South Dakota 100.0 --- 4.2 53.5 26.0 --- 16.3
Tennessee 100.0 1.9 6.5 60.0 17.6 ---
41

14.1 Texas 100.0 --- --- 50.8 31.5 ---
17.7 Utah 100.0 40.9 2.8 38.2 13.3 ---
4.7 Vermont 100.0 26.9 2.4 14.2 23.4 25.8
7.4 Virginia 100.0 52.5 2.4 21.9 15.5 0.2
7.5 Washington 100.0 --- --- 62.6 16.2 11.5
9.7 West Virginia 100.0 29.1 6.2 27.1 27.0 0.1
10.5 Wisconsin 100.0 42.1 3.8 31.3 14.7 0.8
7.4 Wyoming 100.0 --- --- 40.7 9.0 13.2
37.2 (a) Includes collections on motor fuels, alcohol, tobacco, insurance, utilities, pari-mutuels, and other sales. Note: Details don’t always add to 100 percent due to rounding across individual percentages. Source: Calculated from Table E29, Tax Foundation, Facts & Figures on Government Finance, 38th edition.
42

Selective Excise Tax Collections by State, as percentage of Total Tax Revenue,
Fiscal Year 2002 State All
Selective Excises
Gasoline Taxes
Alcohol taxes
Tobacco taxes
Other excises
All States 15.4% 6.0% 0.8% 1.7% 6.9% Alabama 25.1 7.9 2.0 1.0 14.3 Alaska 13.0 3.7 1.2 4.2 4.0 Arizona 12.6 7.4 0.6 1.9 2.7 Arkansas 13.4 7.9 0.6 1.8 3.2 California 8.9 4.2 0.4 1.4 2.8 Colorado 13.5 8.2 0.5 1.0 3.9 Connecticut 16.3 4.7 0.5 1.8 9.4 Delaware 14.9 5.0 0.5 1.3 8.1 Florida 18.2 7.3 2.2 1.9 6.8 Georgia 8.6 4.7 1.1 0.7 2.2 Hawaii 14.8 2.3 1.1 1.9 9.4 Idaho 14.1 9.4 0.3 1.3 3.2 Illinois 20.8 6.1 0.6 2.1 12.0 Indiana 15.9 7.3 0.4 1.2 7.1 Iowa 15.8 6.9 0.3 1.9 6.8 Kansas 13.2 7.8 1.7 1.1 2.5 Kentucky 17.9 5.8 0.9 0.2 11.0 Louisiana 25.4 7.6 0.7 1.8 15.3 Maine 15.3 7.3 1.6 3.6 2.8 Maryland 18.6 6.5 0.2 1.9 9.9 Massachusetts 10.2 4.5 0.4 1.9 3.4 Michigan 10.5 5.0 0.6 3.1 1.8 Minnesota 15.7 4.8 0.4 1.3 9.1 Mississippi 17.8 8.7 0.8 1.2 7.1 Missouri 14.7 7.9 0.3 1.2 5.3 Montana 25.7 13.3 1.3 0.9 10.2 Nebraska 14.6 10.3 0.6 1.5 2.2 Nevada 32.1 6.7 0.4 1.6 23.4 New Hampshire 31.9 6.3 0.6 4.4 20.6 New Jersey 15.2 2.9 0.4 2.2 9.7 New Mexico 13.4 5.5 1.0 0.5 6.4 New York 10.4 1.1 0.4 2.3 6.6 North Carolina 18.2 7.8 1.3 0.3 8.8 North Dakota 25.4 9.9 0.5 1.9 13.1 Ohio 14.6 6.8 0.4 1.4 6.0 Oklahoma 12.3 6.8 1.1 1.2 3.3
43
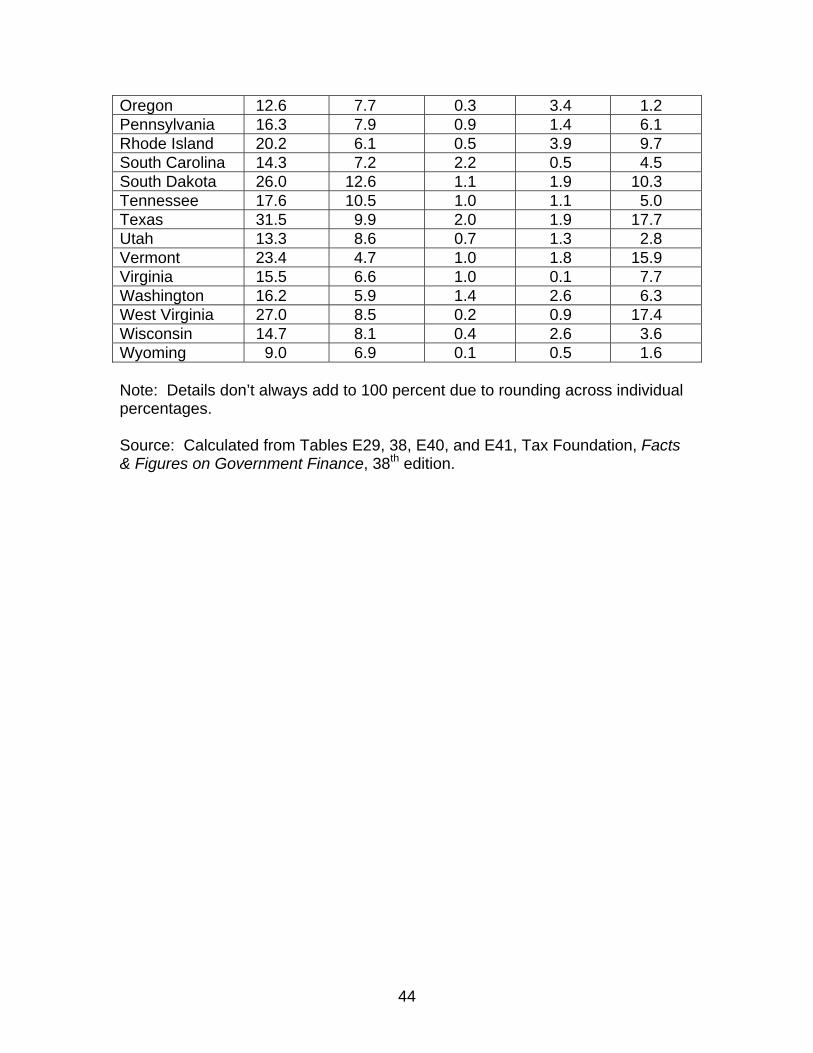
Oregon 12.6 7.7 0.3 3.4 1.2 Pennsylvania 16.3 7.9 0.9 1.4 6.1 Rhode Island 20.2 6.1 0.5 3.9 9.7 South Carolina 14.3 7.2 2.2 0.5 4.5 South Dakota 26.0 12.6 1.1 1.9 10.3 Tennessee 17.6 10.5 1.0 1.1 5.0 Texas 31.5 9.9 2.0 1.9 17.7 Utah 13.3 8.6 0.7 1.3 2.8 Vermont 23.4 4.7 1.0 1.8 15.9 Virginia 15.5 6.6 1.0 0.1 7.7 Washington 16.2 5.9 1.4 2.6 6.3 West Virginia 27.0 8.5 0.2 0.9 17.4 Wisconsin 14.7 8.1 0.4 2.6 3.6 Wyoming 9.0 6.9 0.1 0.5 1.6 Note: Details don’t always add to 100 percent due to rounding across individual percentages. Source: Calculated from Tables E29, 38, E40, and E41, Tax Foundation, Facts & Figures on Government Finance, 38th edition.
44

Table 3
Percentage of Adults who currently Smoke
Year Percentage 1965 42.4% 1970 37.4 1974 (a) 37.1 1980 33.2 1985 30.1 1990 25.5 1995 24.7 2000 23.3 2003 22.5 (a) Data was presented by source for 1974 and not 1975. Source: National Center for Chronic Disease Prevention and Health Promotion.
45

Table 4
State Cigarette Tax Rates per pack, fiscal years ending 30 June
State 1970 1980 1990 1995 2000 2003 Alabama 12¢ 12¢ 16.5¢ 16.5¢ 16.5¢ 16.5¢ Alaska 8 8 16 29 100 100 Arizona 10 13 15 18 58 118 Arkansas 12.25 17.75 21 31.5 31.5 59 California 10 10 35 37 87 87 Colorado 5 10 20 20 20 20 Connecticut 16 21 40 47 50 151 Delaware 11 14 14 24 24 24 District of Columbia 4 13 17 65 65 100 Florida 15 21 24 33.9 33.9 33.9 Georgia 8 12 12 12 12 12 Hawaii 8 14 33 60 100 130 Idaho 7 9.1 18 18 28 57 Illinois 12 12 20 44 58 98 Indiana 6 10.5 15.5 15.5 15.5 55.5 Iowa 10 13 31 36 36 36 Kansas 8 11 24 24 24 79 Kentucky 2.5 3 3 3 3 3 Louisiana 8 11 16 20 20 36 Maine 12 16 28 37 74 100 Maryland 6 10 13 36 66 100 Massachusetts 12 21 26 51 76 151 Michigan 11 11 25 75 75 125 Minnesota 13 18 38 48 48 48 Mississippi 9 11 18 18 18 18 Missouri 9 9 13 17 17 17 Montana 8 12 16 18 18 70 Nebraska 8 13 27 34 34 64 Nevada 10 10 20 35 35 35 New Hampshire 7 12 17 25 52 52 New Jersey 14 19 27 40 80 150 New Mexico 12 12 15 21 21 21 New York 12 15 33 56 111 150 North Carolina 2 2 2 5 5 5 North Dakota 11 12 27 44 44 44 Ohio 10 15 18 24 24 55 Oklahoma 13 18 23 23 23 23 Oregon 4 9 27 38 68 128 Pennsylvania 18 18 18 31 31 100
46

Rhode Island 13 18 27 56 71 132 South Carolina 6 7 7 7 7 7 South Dakota 12 14 23 23 33 53 Tennessee 13 13 13 13 13 20 Texas 15.5 18.5 26 41 41 41 Utah 8 10 23 26.5 51.5 69.5 Vermont 12 12 17 20 44 93 Virginia 2.5 2.5 2.5 2.5 2.5 2.5 Washington 11 16 34 56.5 82.5 142.5 West Virginia 7 17 17 17 17 55 Wisconsin 14 16 30 38 59 77 Wyoming 6 8 8 12 12 12
Source, Orzechowski and Walker, The Tax Burden on Tobacco, vol. 38. Arlington, VA: Orzechowski and Walker, Table 7.
47

Table 5
Tobacco Settlement Payments Received by State, fiscal years ending 30 June (thousands of $s)
State 2000 2001 2002 2003 Total United States $12,062,810 $8,229,612 $9,278,619 $8,030,265 Alabama 131,736 96,961 118,630 109,219 Alaska 27,942 21,176 24,251 23,073 Arizona 120,318 87,670 107,033 99,606 Arkansas 69,407 51,365 58,819 55,961 California 1,031,055 759,226 926,913 862,593 Colorado 112,193 85,026 97,374 92,643 Connecticut 149,965 110,430 134,821 125,465 Delaware 31,945 23,523 28,719 26,726 District of Columbia 34,747 37,998 44,556 44,285 Florida 674,400 731,300 591,300 546,500 Georgia 200,876 152,235 174,344 165,873 Hawaii 48,617 35,800 43,707 40,674 Idaho 29,730 22,531 25,803 24,549 Illinois 380,981 288,675 330,598 314,536 Indiana 166,940 106,516 144,890 137,851 Iowa 71,175 53,940 61,774 58,772 Kansas 68,339 51,708 59,217 56,340 Kentucky 142,261 104,957 127,894 119,020 Louisiana 184,581 139,998 160,201 152,418 Maine 62,965 47,268 54,648 51,993 Maryland 184,998 140,203 160,614 152,762 Massachusetts 326,256 240,246 293,309 272,956 Michigan 351,536 258,852 316,037 294,106 Minnesota 785,511 336,997 368,600 152,905 Mississippi 479,381 211,149 209,029 149,605 Missouri 190,657 142,110 161,568 153,718 Montana 34,763 26,248 30,171 28,705 Nebraska 48,694 36,903 42,262 40,209 Nevada 49,918 37,831 43,325 41,220 New Hampshire 54,501 43,304 47,302 45,004 New Jersey 317,900 239,847 274,678 261,333 New Mexico 48,809 36,990 42,362 40,304 New York 1,030,898 754,340 926,773 862,463 North Carolina 188,394 142,729 169,370 157,617 North Dakota 29,955 22,702 25,999 24,735 Ohio 412,275 312,446 357,822 340,437 Oklahoma 84,799 64,266 73,598 70,023 Oregon 92,704 68,264 83,343 77,559
48

Pennsylvania 322,321 341,835 417,335 388,375 Rhode Island 58,835 44,589 51,066 48,584 South Carolina 96,275 72,961 83,558 79,498 South Dakota 28,558 21,643 24,786 23,582 Tennessee 202,952 151,394 173,380 164,957 Texas 2,236,755 974,221 1,002,821 499,993 Utah 36,410 27,594 31,601 30,066 Vermont 33,214 24,458 29,860 27,788 Virginia 167,348 126,823 145,241 138,185 Washington 168,041 127,351 145,846 138,760 West Virginia 72,549 54,982 62,967 59,907 Wisconsin 167,373 123,249 150,470 140,029 Wyoming 20,060 14,772 18,035 16,783 Source, Orzechowski and Walker, The Tax Burden on Tobacco, vol. 38. Arlington, VA: Orzechowski and Walker, Table 7.
49

Table 6
Actual versus Projected Revenues from Cigarette Tax Increases in 2002 State Projected Gain Actual Gain Actual/Projected Arizona 87, 121,000 66,000,000 75.76% Connecticut 122,000,000 115,800,000 94.92 Hawaii 7,000,000 8,500,000 121.43 Illinois 235,000,000 182,000,000 77.45 Indiana 270,900,000 228,900,000 84.50 Kansas 81,600,000 70,300,000 86.15 Maryland 101,000,000 64,800,000 64.16 Massachusetts 195,000,000 165,000,000 84.62 Michigan 291,000,000 295,000,000 101.37 Nebraska 22,800,000 21,400,000 93.86 New Jersey 275,000,000 216,000,000 78.55 New York 262,000,000 184,000,000 70.20 Ohio 283,200,000 281,500,000 99.40 Oregon 100,000,000 93,852,000 93.85 Pennsylvania 570,500,000 548,000,000 96.06 Rhode Island 23,500,000 19,300,000 82.13 Tennessee 35,800,000 30,000,000 89.35 Utah 13,800,000 10,100,000 73.19 Vermont 21,600,000 19,300,000 89.35 Washington 120,000,000 105,000,000 87.50
50