Starbucks expansion
25
Expansion to Italy, Serbia & Montenegro Presentation by: Kristian, Maja, Arya & Murat 1 Starbucks
-
Upload
kristian-moeller -
Category
Business
-
view
93 -
download
1
Transcript of Starbucks expansion

Expansion to Italy, Serbia & Montenegro
Presentation by: Kristian, Maja, Arya & Murat
1
Starbucks

2Presentation by: Kristian, Maja, Arya & Murat

3Presentation by: Kristian, Maja, Arya & Murat
Starbucks was established in 1971 in Seattle, WA. Starbucks is a premier roaster, marketer and retailer of specialty coffee
around the globe. Starbucks operates more than 21000 stores in over 65 countries and
employ 182,000 employees. The company has four operating segments: Americas, Europe, Middle
East & Africa(EMEA) & China/Asia Pacific. In 2014, Starbucks’ revenue amounted to approximately 16.45 billion
US dollars, up by 10.4% from 14.9 billion dollars the previous year.
Company Profile

Presentation by: Kristian, Maja, Arya & Murat
4
Products Offered CoffeeHandcrafted Beverages FoodMerchandise
Consumer Products Coffee and TeaReady- to- Drink (RTD)
Presentation by: Kristian, Maja, Arya & Murat
5
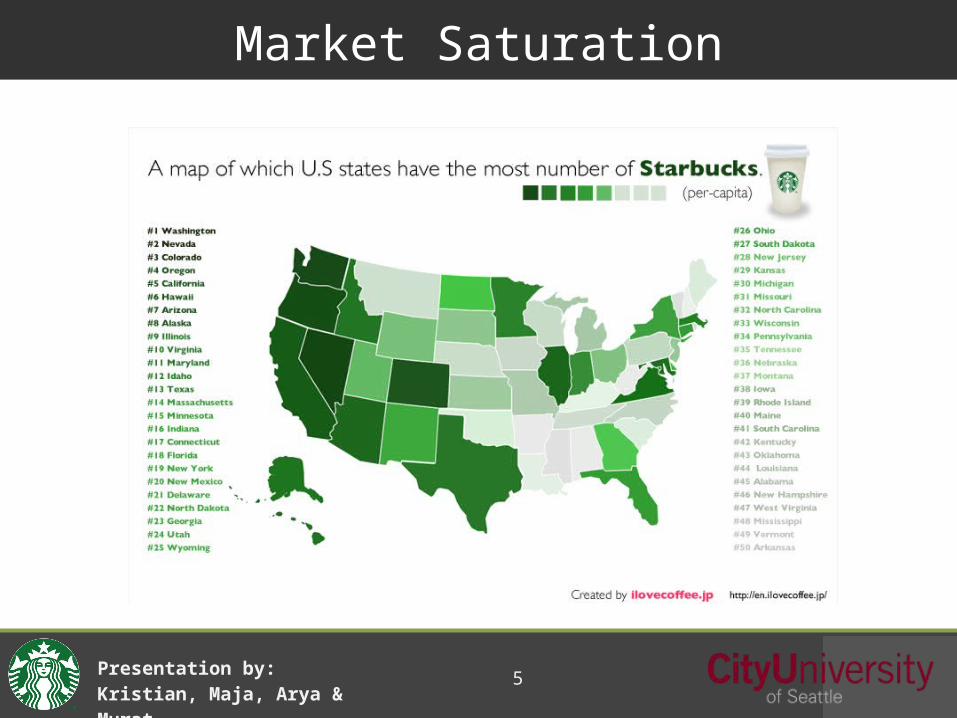
Market Saturation

6
A Global Company
Presentation by: Kristian, Maja, Arya & Murat
7
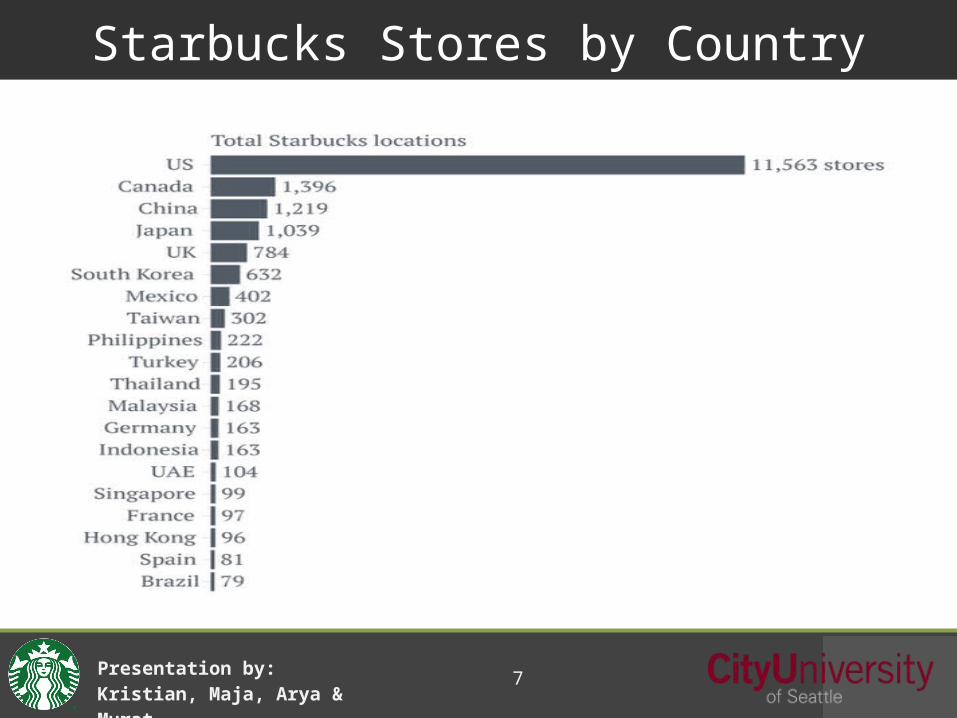
Starbucks Stores by Country
Presentation by: Kristian, Maja, Arya & Murat

Presentation by: Kristian, Maja, Arya & Murat
8
STRENGTHS WEAKNESSES• Global Presence• Strong Financial Position • Building Strong customer connect
through value added services
• Tax Evasion and law suits • Product recalls
OPPORTUNITIES THREATS• Growing presence in foreign
markets• Product Innovation and new growth
platforms• Expansion of retail operations
• Increased competition from local cafes and specialization of other coffeehouse chains
• Slowing US sales

Presentation by: Kristian, Maja, Arya & Murat
9
Risk Analysis
Cultural Challenges High competition with local established coffee shopsPolitical/Legal risksMakes Less money overseas
10Presentation by: Kristian, Maja, Arya & Murat
Perception of Coffee in Italy, Serbia & Montenegro
Consumers in Serbia and Montenegro enjoy leisure away from home and work in ‘’third” places such as restaurants and bars.
For Italians, drinking their coffee is as routine as breathing. Pleasure and leisure play an important role in consumer culture of
drinking coffee. People in Serbia, Montenegro and Italy have big passion for coffee. The coffee should be what people remember
Presentation by: Kristian, Maja, Arya & Murat
11
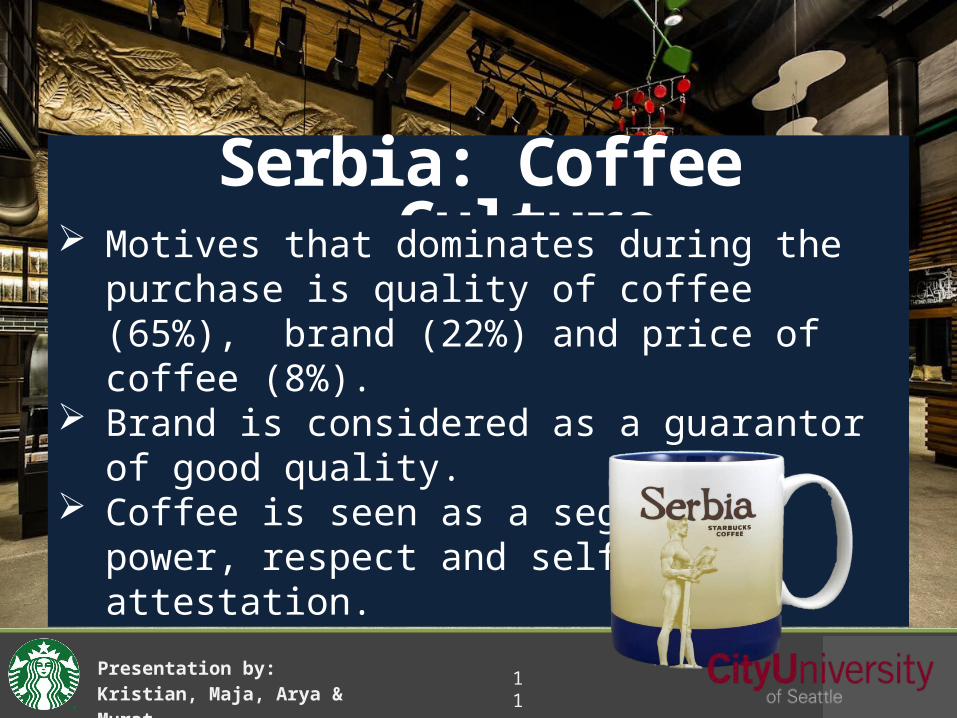
Serbia: Coffee Culture Motives that dominates during the purchase is
quality of coffee (65%), brand (22%) and price of coffee (8%).
Brand is considered as a guarantor of good quality. Coffee is seen as a segment of power, respect and
self-attestation.

[Montenegro: Coffee Culture]
12
Drink a lot of coffee and like their coffee plain.
Most favorite coffee is called Deutsch coffee – same as macchiato.
Drink coffee in restaurants and bars for hours-no to go orders.
Coffee plays important role
Presentation by: Kristian, Maja, Arya & Murat
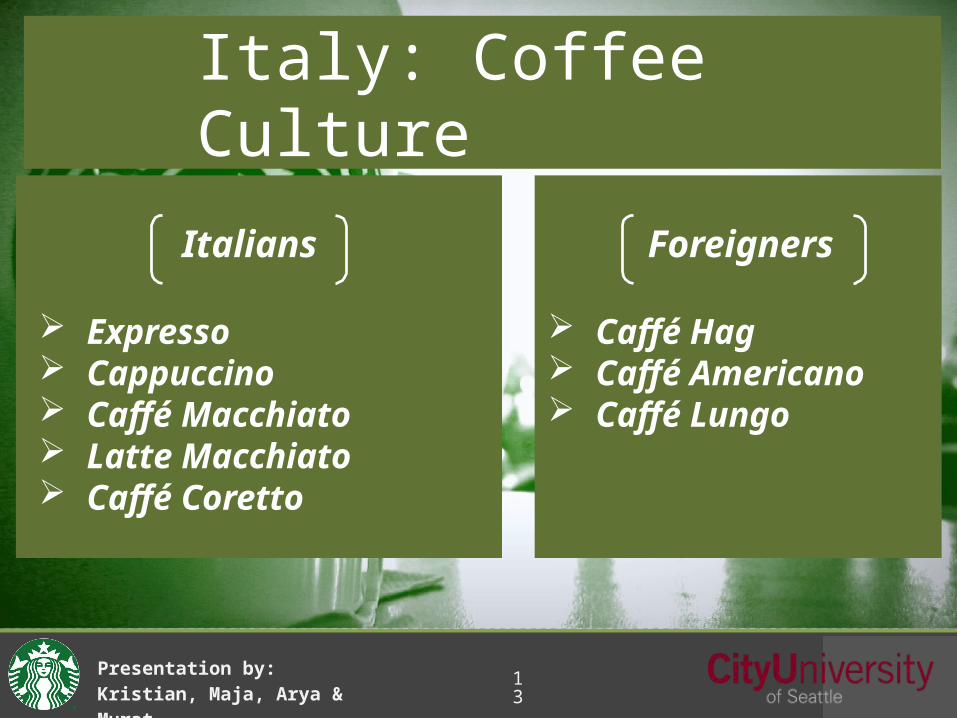
Italy: Coffee Culture
Foreigners
Caffé Hag Caffé Americano Caffé Lungo
13
Italians
Expresso Cappuccino Caffé Macchiato Latte Macchiato Caffé Coretto
Presentation by: Kristian, Maja, Arya & Murat

[Italy: Coffee Culture]
14
70 million cups of espresso are consumed in Italy each year.
600 shot’s per person in 110,000 coffee bars.
Milan has 600 cafes alone. Italian cafes source of pride and joy. Cafes concentrate more on their image
rather than coffee.
Presentation by: Kristian, Maja, Arya & Murat

Starbucks in Serbia,
Montenegro, and Italy
Very well known by its brand and popular in EuropeExotic for just being foreignUnique and sophisticatedCustomization and variety of coffee
Presentation by: Kristian, Maja, Arya & Murat
15

Starbucks Serbia
16Presentation by: Kristian, Maja, Arya & Murat
Input Data
Store opening $325,000 First year sales (in units) 81,000 Tax rate 15.00%Sales price per unit $5.00 WACC 7.92%Variable cost per unit $2.25 Inflation 6.86%Nonvariable costs $141,750
Projected Net Cash Flows (Time line of Annual Cash Flows)Years 0 1 2 3 4
Initial Investment:Starbucks Italy ($325,000)
Project's Cash FlowUnits sold 81,000 93,150 107,123 123,191Sales price $5.00 $5.34 $5.71 $6.10 Variable costs $2.25 $2.40 $2.57 $2.75
Sales revenue $405,000 $497,700 $611,619 $751,613 Variable costs 182,250 223,965 275,229 338,226Nonvariable operating costs 141,750 151,474 161,865 172,969Oper. income before taxes (EBIT) $81,000 $122,261 $174,525 $240,418 Taxes on operating income (15%) 12,150 18,339 26,179 36,063After-tax operating income $68,850 $103,922 $148,347 $204,355
Net cash Flow ($325,000) $68,850 $103,922 $148,347 $204,355
Appraisal of the Proposed Project
Net Present Value (at 7.92%) $96,703.14IRR 18.49%MIRR 15.18%
Profitability index 1.19

Starbucks Serbia: Break-even Analysis
17Presentation by: Kristian, Maja, Arya & Murat

Starbucks Italy
18
Input Data
Store opening $500,000 First year sales (in units) 108,000 Tax rate 31.40%Sales price per unit $7.00 WACC 7.92%Variable cost per unit $3.15 Inflation 1.72%Nonvariable costs $264,600
Projected Net Cash Flows (Time line of Annual Cash Flows)Years 0 1 2 3 4
Initial Investment:Starbucks Italy ($500,000)
Project's Cash FlowUnits sold 108,000 124,200 142,830 164,255Sales price $7.00 $7.12 $7.24 $7.37 Variable costs $3.15 $3.20 $3.26 $3.32
Sales revenue $756,000 $884,354 $1,034,499 $1,210,137 Variable costs 340,200 397,959 465,525 544,561Nonvariable operating costs 264,600 269,151 273,781 278,490Oper. income before taxes (EBIT) $151,200 $217,243 $295,194 $387,086 Taxes on operating income (31.4%) 47,477 68,214 92,691 121,545After-tax operating income $103,723 $149,029 $202,503 $265,541
Net cash Flow ($500,000) $103,723 $149,029 $202,503 $265,541
Appraisal of the Proposed Project
Net Present Value (at 7.92%) $80,940.01IRR 13.96%MIRR 12.04%
Profitability index 1.16
Presentation by: Kristian, Maja, Arya & Murat

Starbucks Italy: Break-even Analysis
19Presentation by: Kristian, Maja, Arya & Murat

Starbucks Montenegro
20
Input Data
Store opening $350,000 First year sales (in units) 81,000 Tax rate 9.00%Sales price per unit $6.00 WACC 7.92%Variable cost per unit $2.70 Inflation 1.96%Nonvariable costs $170,100
Projected Net Cash Flows (Time line of Annual Cash Flows)Years 0 1 2 3 4
Initial Investment:Starbucks Italy ($350,000)
Project's Cash FlowUnits sold 81,000 93,150 107,123 123,191Sales price $6.00 $6.12 $6.24 $6.36 Variable costs $2.70 $2.75 $2.81 $2.86
Sales revenue $486,000 $569,854 $668,177 $783,464 Variable costs 218,700 256,434 300,680 352,559Nonvariable operating costs 170,100 173,434 176,833 180,299Oper. income before taxes (EBIT) $97,200 $139,986 $190,664 $250,606 Taxes on operating income (9%) 8,748 12,599 17,160 22,555After-tax operating income $88,452 $127,387 $173,504 $228,052
Net cash Flow ($350,000) $88,452 $127,387 $173,504 $228,052
Appraisal of the Proposed Project
Net Present Value (at 7.92%) $147,498.99IRR 22.86%MIRR 17.84%
Profitability index 1.29
Presentation by: Kristian, Maja, Arya & Murat

Starbucks Montenegro: Break-even Analysis
21Presentation by: Kristian, Maja, Arya & Murat
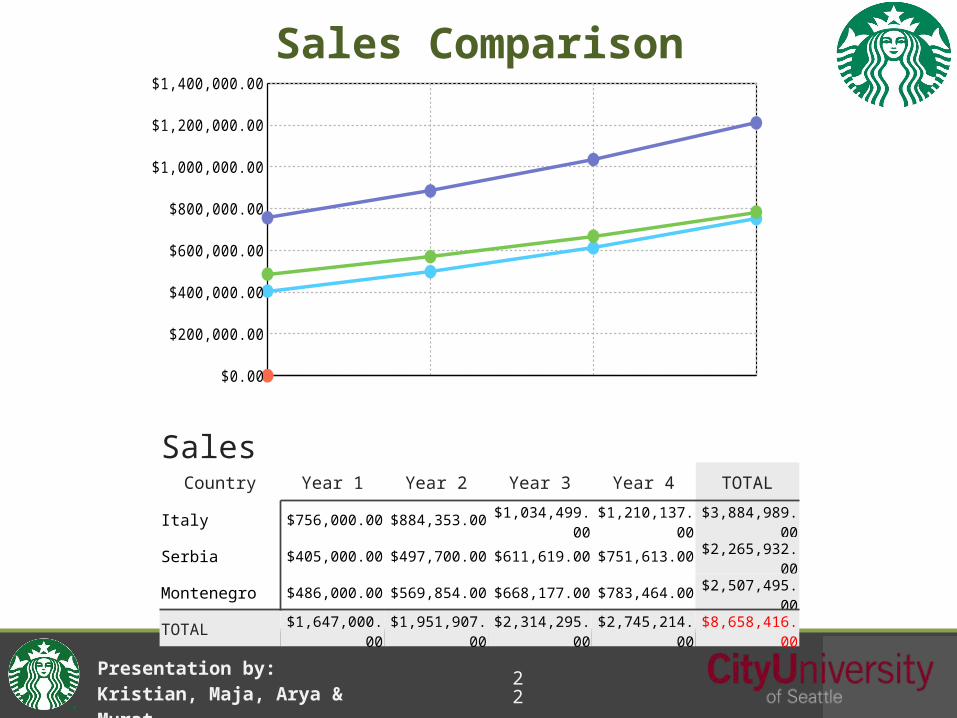
Sales Comparison
22
$0.00
$200,000.00
$400,000.00
$600,000.00
$800,000.00
$1,000,000.00
$1,200,000.00
$1,400,000.00
SalesCountry Year 1 Year 2 Year 3 Year 4 TOTAL
Italy $756,000.00 $884,353.00$1,034,499.0
0$1,210,137.0
0$3,884,989.0
0
Serbia $405,000.00 $497,700.00 $611,619.00 $751,613.00$2,265,932.0
0
Montenegro $486,000.00 $569,854.00 $668,177.00 $783,464.00$2,507,495.0
0
TOTAL $1,647,000.00
$1,951,907.00
$2,314,295.00
$2,745,214.00
$8,658,416.00
Presentation by: Kristian, Maja, Arya & Murat

Cash Flow Comparison
23Presentation by: Kristian, Maja, Arya & Murat
$0.00
$50,000.00
$100,000.00
$150,000.00
$200,000.00
$250,000.00
$300,000.00
Cash FlowCountry Year 1 Year 2 Year 3 Year 4 YEAR
Italy $103,723.00 $149,029.00 $202,503.00 $265,541.00 $720,796.00
Serbia $68,850.00 $103,922.00 $148,347.00 $204,355.00 $525,474.00
Montenegro $88,452.00 $127,387.00 $173,504.00 $228,052.00 $617,395.00
TOTAL $261,025.00 $380,338.00 $524,354.00 $697,948.00$1,863,665.0
0

Benefits vs. Risks A way of testing the market Increasing the intrinsic value
24
Conclusion
Presentation by: Kristian, Maja, Arya & Murat

25
Questions
Presentation by: Kristian, Maja, Arya & Murat