Standard: FCS-FNW-1 Students will discuss basic nutrient requirements and their use in dietary...
21
Standard: FCS-FNW-1 Students will discuss basic nutrient requirements and their use in dietary planning. Element “C” Define a calorie, compare energy sources, compute Basal Metabolic Rate, Body Mass Index, and waist to hip ratio ; apply outcomes to dietary planning and selection of nutrient dense foods. How to Use Growth Charts & Anthropometric Measures: Basal Metabolic Rate, Body Mass Index, Waist-to-Hip Ratio Presentation by Rhonda L. Barlow; source: CDC.gov
-
Upload
alvin-anderson -
Category
Documents
-
view
215 -
download
2
Transcript of Standard: FCS-FNW-1 Students will discuss basic nutrient requirements and their use in dietary...
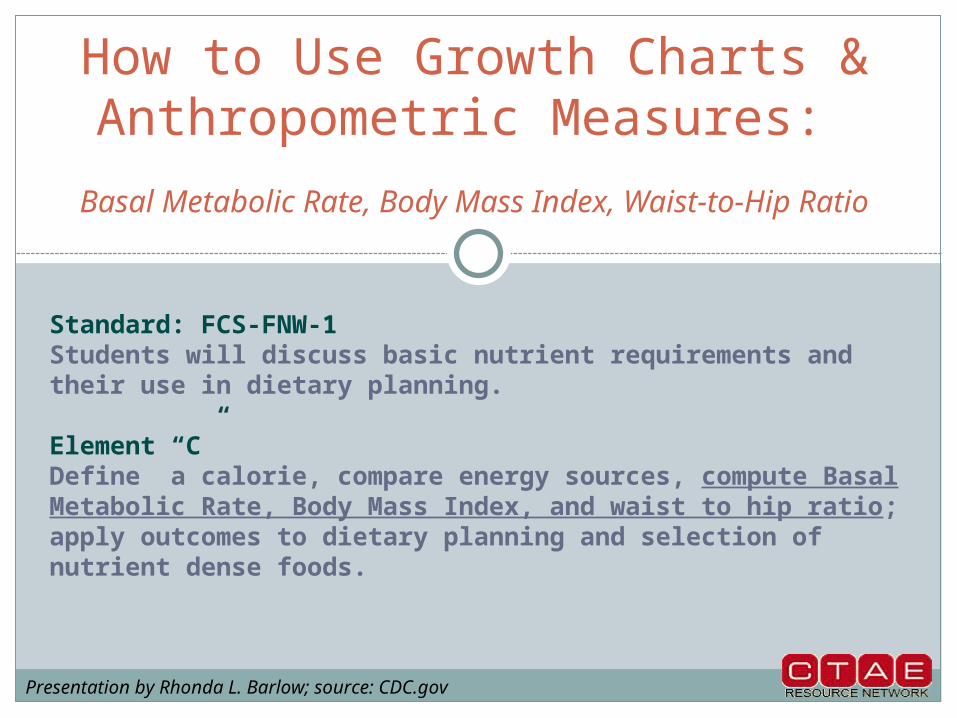
Standard: FCS-FNW-1Students will discuss basic nutrient requirements and their use in dietary planning.
Element “C”Define a calorie, compare energy sources, compute Basal Metabolic Rate, Body Mass Index, and waist to hip ratio; apply outcomes to dietary planning and selection of nutrient dense foods.
How to Use Growth Charts & Anthropometric Measures:
Basal Metabolic Rate, Body Mass Index, Waist-to-Hip Ratio
Presentation by Rhonda L. Barlow; source: CDC.gov

Training Objectives
At the end of this presentation, you will be able to:
1. Discuss the history of the current CDC Growth Charts,
2. Select the appropriate CDC Growth Chart (Grid) needed based on the age and gender of the person,
3. Use the CDC Growth Charts to plot anthropometric measures,
4. Interpret the data plotted to assess physical growth.

History
Released = May 2000Developed by
National Center for Health Statistics (NCHS)Distributed by
Centers for Disease Control and Prevention (CDC)
Used for all children 2 to 20 years of ageScreening Tool
Assess physical growth/nutritional status Assess risk of underweight/overweight

Why Revise 1977 NCHS Charts?
Reference Population
Racially/Ethnically Diverse
Infants: Birth to 36 months
Children and Adolescents: 2 to 20 years
Breast- and formula-fed infants

Use and Interpretation of Charts
Step 1 = Obtain accurate weight and measures.
Step 2 = Select appropriate growth chart.Step 3 = Record anthropometric data.Step 4 = Calculate Body Mass Index (BMI).Step 5 = Plot measurements.Step 6 = Interpret plotted measurements.
As listed in “Use & Interpretation of the CDC Growth Charts,”

Accurate Weight and Measures
Calibrate height and weight equipment. Take off excess clothes and shoesCDC Recommended Protocol
Staturehttp://www.cdc.gov/nccdphp/dnpa/bmi/meas-
height.htm Weighthttp://www.cdc.gov/nccdphp/dnpa/bmi/meas-
weight.htm

Measuring Stature
Stand against stadiometer.
Feet, bottom, shoulders and head against wall.
Head straight.Bring measuring tool
level with head.Read height.
Head
Feet
Wall
Top of stadiometer
Floor
stadio
mete
r

Measuring Weight
“Zero” out scale.Stand on scale.Hands and arms
straight down by side.
Waite for balance to record weight.
Read weight.

Measuring Waist
Use sturdy/un-stretched measuring tape.
Minimal/thin clothingMeasure around
smallest area or near navel.
Read measuring tape.Record data.

Measuring Hip
Use sturdy/un-stretched measuring tape.
Minimal/thin clothingMeasure around
largest area of bottom.Read measuring tape.Record data.

Select Appropriate Growth Chart
CDC growth charts available on Internetwww.cdc.gov/growthchartsClinical vs. individual growth charts

Record Data
Student’s nameRecord number = birth dateMother’s/Father’s Stature = optionalDate = day measurements takenAge = years, months, daysWeight = poundsStature = inchesBMI = manual calculationComments = any notable occurrence/observation

BMI Calculation Formula
Metric SystemBMI = weight (kg)/[stature (cm)]2 x 10,000
{OR}English SystemBMI = weight (lb) ÷ [stature (in)]2 x 703
Calculate as a continuous equation.

Calculation Practice
Sam’s anthropometric measuresweight = 37 pounds, 4 ouncesheight = 41½ inches
Convert ounces and fractions to decimals.
Answer37.25lbs ÷ 41.5 ÷ 41.5 x 703 = 15.2

Calculation Practice
Fraction Ounces Decimal
1/8 2 .125
1/4 4 .25
3/8 6 .375
1/2 8 .5
5/8 10 .625
3/4 12 .75
7/8 14 .875
Complete Your Growth Chart
Fill in name, birth date in “Record #”
Today’s dateAge = pretend you are 18,
19, or 20Record estimated weight
and heightCalculate your BMI based
on above.
Decimal Conversions Table

Plot Measurements
Find your age on horizontal axis.Years = 3 months incrementsFind appropriate measurement on vertical
axis. (Weight, length, stature, head circumference, BMI)
Make a small dot where the two lines intersect.

Visual Example of Plot

Interpret Plotted Measurements
1. Determine the percentile rank. 2. Determine if the percentile rank suggests that
the anthropometric index is indicative of nutritional risk based on the percentile cutoff value.
3. Compare today’s percentile rank with the rank from previous visits to identify any major shifts in the child’s growth pattern and the need for further assessment.
4. Anthropometric Index Percentile Cut-off Value Nutritional Status Indicator

Percentile Rank Indicated Nutrition- Related Health Concern
Anthropometric Index Percentile Cut-off Value
Nutritional Status Indicator
BMI-for-Age ≥ 95th Overweight
Weight-for-Length > 95th Overweight
BMI-for-Age ≥ 85th and < 95th At Risk of Overweight
Weight-for-Length < 5th Underweight
Stature/Length-for-Age < 5th Short Stature
Head Circumference-for-Age < 5th and > 95th Developmental Problems

Growth Charts and BMI Resources
For this presentation, “Use and Interpretation of the CDC Growth Charts.”
Online, http://www.cdc.gov/nccdphp/dnpa/growthcharts/resources/growthchart.pdf
.
For additional training materials related to the growth charts,
For tools related to the growth charts, To download the growth charts, visit
http://www.cdc.gov/growthcharts.

THE END
Thank You for Your Interest