ĐSTANBUL TECHNICAL UNIVERSITY INSTITUTE OF SCIENCE … · Technology, Polymer Science and...
96
Thesis Supervisor: Prof. Dr. Oya G. ATICI ĐSTANBUL TECHNICAL UNIVERSITY INSTITUTE OF SCIENCE AND TECHNOLOGY M.Sc. Thesis by Nurhan KADAK Department : Polymer Science and Technology Programme : Polymer Science and Technology JUNE 2009 POLYMER/CLAY NANOCOMPOSITES FROM SUGAR INDUSTRY BY-PRODUCT
Transcript of ĐSTANBUL TECHNICAL UNIVERSITY INSTITUTE OF SCIENCE … · Technology, Polymer Science and...

Thesis Supervisor: Prof. Dr. Oya G. ATICI
ĐSTANBUL TECHNICAL UNIVERSITY ���� INSTITUTE OF SCIENCE AND TECHNOLOGY
M.Sc. Thesis by Nurhan KADAK
Department : Polymer Science and Technology
Programme : Polymer Science and Technology
JUNE 2009
POLYMER/CLAY NANOCOMPOSITES FROM SUGAR INDUSTRY BY-PRODUCT


ĐSTANBUL TECHNICAL UNIVERSITY ���� INSTITUTE OF SCIENCE AND TECHNOLOGY
M.Sc. Thesis by Nurhan KADAK
(515071016)
Date of submission : 04 May 2009
Date of defence examination: 03 June 2009
Supervisor (Chairman) : Prof. Dr. Oya G. ATICI (ITU) Members of the Examining Committee : Prof. Dr. Ahmet AKAR (ITU)
Prof. Dr. A. Tunçer ERCĐYES (ITU)
JUNE 2009
POLYMER/CLAY NANOCOMPOSITES FROM SUGAR INDUSTRY BY-PRODUCT


HAZĐRAN 2009
ĐSTANBUL TEKNĐK ÜNĐVERSĐTESĐ ���� FEN BĐLĐMLERĐ ENSTĐTÜSÜ
YÜKSEK LĐSANS TEZĐ Nurhan KADAK
(515071016)
Tezin Enstitüye Verildiği Tarih : 04 Mayıs 2009
Tezin Savunulduğu Tarih : 03 Haziran 2009
Tez Danışmanı : Prof. Dr. Oya G. ATICI (ĐTÜ) Diğer Jüri Üyeleri : Prof. Dr. Ahmet AKAR (ĐTÜ)
Prof. Dr. A. Tunçer ERCĐYES (ĐTÜ)
ŞEKER PANCARI YAN ÜRÜNÜNDEN POLĐMER/KĐL NANOKOMPOZĐT ELDESĐ

v
FOREWORD
This study was carried out in Istanbul Technical University, Institute of Science and Technology, Polymer Science and Technology Department.
I would like to express my gratitude to my supervisor Prof. Dr. Oya G. ATICI who shared her knowledge and experience generously, for her encouragement and supports.
I would like to thank Teaching Asistant H. Cüneyt Ünlü, for his help and patience throughout laboratory studies, and all of my colleagues.
I am also grateful to my family for their support and understanding.
June 2009
Nurhan KADAK Chemist

vi

vii
TABLE OF CONTENTS
Page
FOREWORD .............................................................................................................. v
TABLE OF CONTENTS ......................................................................................... vii ABBREVIATIONS ................................................................................................... ix
LIST OF TABLES .................................................................................................... xi LIST OF FIGURES ................................................................................................ xiii SUMMARY .............................................................................................................. xv
ÖZET ....................................................................................................................... xvii 1. INTRODUCTION AND AIM ............................................................................... 1
2. THEORETICAL PART ........................................................................................ 3
2.1 Molasses ............................................................................................................. 3
2.1.1 Sugar beet molasses .................................................................................... 5
2.1.2 Content of sugar beet molasses ................................................................... 6
2.1.3 Industrial application of sugar beet molasses ............................................. 7
2.2 Properties and Usage of Ce(IV) in Redox Polymerization .............................. 11
2.2.1 Oxidations of Ce(IV) ................................................................................ 11
2.2.2 Theory of oxidations involving intermediate complexes .......................... 12
2.2.3 Synthesis of block and graft copolymers by Ce(IV) initiated redox polymerization.................................................................................. 14
2.3 Poly(styrene-co-acrylonitrile) (SAN) Copolymer ............................................ 19
2.3.1 Copolymerization of styrene and acrylonitrile .......................................... 20
2.3.2 Emulsion process of poly(styrene-co-acrylonitrile) (SAN) copolymers .. 22
2.3.3 Suspension process of poly(styrene-co-acrylonitrile) (SAN) copolymers 24
2.3.4 Mass process of poly(styrene-co-acrylonitrile) (SAN) copolymers ......... 26
2.4 Polymer-Clay Nanocomposites ........................................................................ 27
2.4.1 Polymer-clay nanocomposite architectures .............................................. 29
2.4.2 Poly(styrene-co-acrylonitrile)–montmorillonite (SAN-Mt) composites .. 32
3. EXPERIMENTAL PART ................................................................................... 35
3.1 Materials ........................................................................................................... 35
3.1.1 Preparation of stock solutions ................................................................... 35
3.2 Instruments ....................................................................................................... 36
3.3 Synthesis of Monosaccharide-Mediated Poly(styrene-co-acrylonitrile) (MSAN) .................................................................................................................. 37
3.4 Synthesis of Monosaccharide-Mediated Poly(styrene-co-acrylonitrile)-NaMt Nanocomposites (MSAN/NaMt) ............................................................................ 37
4. RESULTS AND DISCUSSION .......................................................................... 39
4.1 Synthesis and Characterization of MSAN ....................................................... 39
4.2 Synthesis and Characterization of MSAN/NaMt ............................................. 50
4.3 Rheologic, Mechanic, Thermal and Other Analysis ........................................ 53
4.3.1 XRD analysis ............................................................................................ 53
4.3.2 Rheology analysis ..................................................................................... 54
4.3.3 DMA analysis ........................................................................................... 60

viii
4.3.4 DSC analysis ............................................................................................. 61
4.3.5 TGA analysis ............................................................................................. 63
4.3.6 Water sorption ........................................................................................... 65
5. CONCLUSION AND RECOMMENDATIONS ............................................... 67
REFERENCES.........................................................................................................69 CURRICULUM VITA ............................................................................................. 75

ix
ABBREVIATIONS
SAN : Poly(styrene-co-acrylonitrile) PCN : Polymer-Clay Nanocomposite Mt : Montmorillonite NaMt : Na-Montmorillonite MSAN : Molasses-mediated poly(styrene-co-acrylonitrile) MSAN/NaMt : Molasses-mediated poly(styrene-co-acrylonitrile)-NaMt
nanocomposite FT-IR : Fourier Transform Infrared Spectroscopy 1H-NMR : Proton Nuclear Magnetic Resonance Spectroscopy XRD : X-Ray Diffraction DSC : Differential Scanning Calorimetry TGA : Thermal Gravimetric Analysis DMA : Dynamic Mechanical Analysis TEM : Transmission Electron Microscopy SEM : Scanning Electron Microscopy MC : Methyl Cellulose MHPC : Methyl Hydroxy Propyl Cellulose AIBN : 2,2'-Azodiisobutyronitrile or Azobisisobutyronitrile KPS : Potassium Persulfate DTAB : Dodecyltrimethylammonium Bromide SDBS : Sodium Dodecylbenzenesulfonate ABS : Acrylonitrile Butadiene Styrene Rubber DMF : Dimethylformamide MSG : Monosodium Glutamate

x

xi
LIST OF TABLES
Page
Table 3.1: Amounts of (NH4)2Ce(NO3)6 and (w/w) 65% HNO3 solution used in stock solutions .......................................................................................... 36
Table 4.1: Reaction conditions of synthesis of MSAN during 1 h at 50oC .............. 42 Table 4.2: Amount of NaMt in (MSAN/NaMt) samples and yield of products ....... 50
Table 4.3: Flow index and hysteresis area values of MSAN78- MSAN/NaMt80- 81 82-83 at 20oC, 25oC and 30oC .................................................................. 56
Table 4.4: Young’s modulus and breaking points of MSAN78 and MSAN/NaMt80- 81-82-83 at 25oC ...................................................................................... 60
Table 4.5: Glass transition, melting and decomposition temperatures of molasses, MSAN78 and MSAN/NaMt80-81-82-83 ................................................ 62
Table 4.6: Residue at 480oC and signal max values of MSAN78 and MSAN/NaMt samples ..................................................................................................... 63
Table 4.7: Temperatures at 40%, 50% and 60% residue remained in MSAN78 and nanocomposites of it (MSAN/NaMt80-81-82-83) ................................... 65

xii

xiii
LIST OF FIGURES
Page
Figure 2.1 : Sugar beet molasses ................................................................................. 3
Figure 2.2 : Copolymer composition curves ............................................................. 21
Figure 2.3 : Schematic representation of a montmorillonite smectite clay stucture . 28
Figure 2.4 : Schematic representation of the various PCN architectures (a)intercalated, (b) exfoliated, and (c) mixed intercalated–exfoliated. TEM images of actual PCN hybrids assigned to these various structures: (d) intercalated polystyrene–fluorohectorite showing 2,9-nm registry, (e) exfoliated nylon montmorillonite, and (f) a mixed intercalated exfoliated epoxy–montmorillonite (10% clay). ................ 29
Figure 2.5 : Methods for creating intercalated polymer–clay architectures via direct polymer contact (usually in solution) and via in situ polymerization of preintercalated monomers. .................................................................... 31
Figure 4.1 : FT-IR spectra of molasses and MSAN78 ............................................. 44 Figure 4.2 : FT-IR spectra of MSAN78 and MSAN74 ............................................ 45
Figure 4.3 : 1H-NMR spectrum of molasses ............................................................ 46
Figure 4.4 : 1H-NMR spectra of glucose (a), raffinose (b), galactose (c) and fructose(d) ............................................................................................. 47
Figure 4.5 : 1H-NMR spectrum MSAN78 ................................................................ 48
Figure 4.6 : 1H-NMR spectra of molasses, MSAN74 and MSAN78 ....................... 49
Figure 4.7 : FT-IR spectra of NaMt, MSAN78 and MSAN/NaMt80 ..................... 51
Figure 4.8 : FT-IR spectra of NaMt, MSAN78, MSAN/NaMt80, MSAN/NaMt81, MSAN/NaMt82 and MSAN/NaMt83 ................................................... 52
Figure 4.9 : 1H-NMR spectra of MSAN78 and MSAN/NaMt80-81-82-83 ............. 53
Figure 4.10: XRD patterns of NaMt and nanocomposite including 2% NaMt (MSAN/NaMt83) .................................................................................. 54
Figure 4.12: Log shear stress- log shear rate plot of MSAN78 at 25oC and 30oC. ... 56
Figure 4.13: Flow index versus NaMt percent plots at 20oC, 25oC and 30oC ........... 57
Figure 4.14: Shear stress-shear rate plots of MSAN/NaMt81 at 20oC, 25oC and 30oC ............................................................................................................ 58
Figure 4.15: (a) Hysteresis area versus NaMt percent plots at 20oC, 25oC and 30oC. (b) Yield value versus NaMt percent plots at 20oC, 25oC and 30oC .... 58
Figure 4.16: Apparent viscosity versus shear rate plots of MSAN78 and MSAN/NaMt samples ........................................................................... 59
Figure 4.17: Strain versus stress plots of MSAN78, MSAN/NaMt81 and MSAN/NaMt83 at 25oC ........................................................................ 61
Figure 4.18: DSC thermograms of MSAN78 and NaMt-nanocomposite of it including 1% NaMt (MSAN/NaMt81) ................................................. 63
Figure 4.19: TGA thermograms of MSAN78 and (MSAN/NaMt80, 81, 82,83) ...... 64
Figure 4.20: Water sorption of MSAN78 and nanocomposites of it with increasing NaMt percentage ................................................................................... 66

xiv

xv
POLYMER/CLAY NANOCOMPOSITES FROM SUGAR INDUSTRY
BY-PRODUCT
SUMMARY
Sugar beet molasses is primarily a by-product of sugar production. Beside water, reducing monosaccharides (raffinose, glucose, fructose and unseperated sucrose etc.), and the materials except monosaccharides constitute the composition of molasses. The sugar content accepted for sugar beet molasses is 46-48%. Molasses is used in a number of industries generally as a major component in compound feeds, livestock feeds and silage additives.
Poly(styrene-co-acrylonitrile) (SAN) is the copolymer of styrene and acrylonitrile monomers. Due to their rigidity, transparency, and thermal stability, SAN resins have found applications for dials, knobs, and covers for domestic appliances, electrical equipment, car equipment, dishwasher safe housewares, such as refrigerator meat and vegetable drawers, blender bowls, vacuum cleaner parts, humidifier parts, plus other industrial and domestic applications with requirements more stringent than can be met by polystyrene. SAN resins are also reinforced with glass to make dashboard components and battery cases.
In this study; molasses, containing monosaccharides such as glucose, fructose, raffinose, unseperated sucrose etc., was utilized in the polymerization of styrene and acrylonitrile. Monosaccharides are the molecules which include alcohol groups. Monosaccharide molecule and Ce(IV) produce a complex and decompose to generate free radical (1). Molasses acted as reducing agent to reduce Ce(IV) to Ce(III).
CH2OH +k
Complex Ce (III) + H+ +-CHOH
and/orCe (IV)
RCH2O (1)
In this way, free radicals were generated on monosaccharides to initiate polymerization (2). Monosaccharide-mediated poly(styrene-co-acrylonitrile) (MSAN) was synthesized by emulsion polymerization. Experiments were performed to obtain optimum reaction conditions (MSAN78). Optimum reaction condition was performed to synthesize polymer-clay nanocomposites.

xvi
+
CHOH
CH2Oand/or
....
Molasses
Molasses
CHOH
CH
Molasses
CH CH2 CH
C N
n m
CH2O
CH
Molasses
CH CH2 CH
C N
n m
C
CHH2C
N
n H2C CHm
and/or
(2)
Interest in hybridizing clays into polymers at the nanoscale level is intense due to the pronounced improvements in properties at surprisingly low clay contents. Layered smectite-type montmorillonite (Mt) is a hydrous alumina silicate mineral which adsorbs cations such as K+, Na+, Ca+2 and Mg+2. NaMt was used in the synthesis of clay nanocomposites of monosaccharide-mediated poly(styrene-co-acrylonitrile) (MSAN/NaMt) in this study. 0,5% (MSAN/NaMt80); 1% (MSAN/NaMt81); 1,5% (MSAN/NaMt82) and 2% (MSAN/NaMt83) NaMt containing composite samples were synthesized by in situ polymerization.
Structure of products were identified by FT-IR and 1H-NMR analysis. Results of these analysis demonstrated the formation of desired products. XRD analysis was performed to determine interactions between NaMt and MSAN. In the results of XRD analysis, no diffraction peak (d001) was observed in composite samples. It is decided it may be caused by the totally dispersion of NaMt layers or the covering of NaMt with polymer. Rheology measurements were performed to determine flow behaviours of products. According to the rheology measurements, MSAN78 and MSAN/NaMt samples displayed rheopectic behaviour. MSAN78 displayed Bingham plastic model while MSAN/NaMt samples displayed pseudoplastic behaviour. After addition of NaMt, some changes in rheological properties were observed. Appearent viscosity increased with shear rate due to the increase of number of NaMt particles in the dispersion. Thermal behaviour and enhancement in thermal stability of MSAN78 and MSAN/NaMt samples were observed by DSC and TGA analysis. According to the DSC analysis, MSAN78 and MSAN/NaMt samples, displayed two glass transitions. Melting and decomposition temperatures were determined from DSC thermograms and an obvious increase was observed in melting and decomposition temperatures by increase amount of NaMt. According to the TGA analysis, decomposition temperatures of MSAN/NaMt samples, demonstrated an increase by increasing of NaMt percent compared to MSAN78. Thermal analysis demonstrated the enhancement in thermal stability which NaMt provided in nanocomposites. DMA analysis was performed to determine mechanical resistance of MSAN78 and MSAN/NaMt samples. According to the Young’s modulus values, elasticity of MSAN/NaMt samples increased by the increase of NaMt percent. When the breaking points were observed, it has seen that the rupture of MSAN78 film occurs in the lowest stress and strain values. DMA analysis demonstrated the enhanced mechanical resistance of MSAN/NaMt samples compared to MSAN78. Water sorption test was performed to determine water sorption of MSAN78 and MSAN/NaMt samples and the enhancement in water resistance by the increase of NaMt percent. MSAN78 had the most water sorption while water sorption of MSAN/NaMt samples decreased by increasing amount of NaMt. It is obvious that NaMt provided a good water resistance to MSAN78.

xvii
ŞEKER PANCARI YAN ÜRÜNÜNDEN POLĐMER/KĐL NANOKOMPOZĐT ELDESĐ
ÖZET
Şeker pancarı melası, şeker üretiminin başlıca yan ürünüdür. Melas, suyun yanı sıra rafinoz, glukoz, fruktoz ve ayrıştırılmamış sakkaroz gibi indirgen şekerler ve monosakkaritler dışındaki bazı maddeleri içerir. Melasın şeker içeriği %46-48 olarak kabul edilmektedir. Melas en fazla çiftlik hayvanlarının beslenmesinde katkı maddesi olarak kullanılır.
Poli(stiren-ko-akrilonitril) (SAN), stiren ve akrilonitril monomerlerinin kopolimeridir. Sertlik, saydamlık ve termal kararlılık gibi özelliklerinden dolayı SAN kopolimerleri endüstride yaygın olarak kullanılmaktadır. Çoğunlukla ev aletleri, elektrikli aletler, otomobil ekipmanları, bulaşık makinaları, buzdolapları, elektrikli süpürgeler, nemlendirici cihazlar gibi endüstriyel ve ev gereçlerinde yada bunların bazı parçalarında kullanılmaktadır. SAN ayrıca cam elyafı ile güçlendirilerek gösterge panellerinde ve akü kaplarında kullanılmaktadır.
Bu çalışmada; rafinoz, glukoz, fruktoz ve ayrıştırılmamış sakkaroz gibi monosakkaritler içeren melas, stiren ve akrilonitrilin polimerleşmesinde kullanılarak değerlendirilmiştir. Monosakkaritler, alkol grupları içeren bileşiklerdir. Monosakkarit molekülü ile Ce(IV) kompleks oluşturarak serbest radikal meydana getirirler (1). Melas, Ce(IV)’ü Ce(III)’e indirgeyen indirgen ajan görevi görür.
CH2OH +k
Kompleks Ce (III) + H+ +-CHOH
ve/veyaCe (IV)
RCH2O (1)
Bu şekilde, polimerizasyonu başlatmak üzere, monosakkaritler üzerinde serbest radikaller oluşturulmuştur (2). Monosakkarit temelli poli(stiren-ko-akrilonitril) (MSAN), emülsiyon polimerizasyonuyla sentezlenmiştir. En uygun reaksiyon koşullarını belirlemek üzere deneyler yapılmıştır. Bulunan uygun reaksiyon koşulları (MSAN78), polimer-kil nanokompozitlerinin sentezlenmesinde de uygulanmıştır.
+
CHOH
CH2Ove/veya
....
Melas
Melas
CHOH
CH
Melas
CH CH2 CH
C N
n m
CH2O
CH
Melas
CH CH2 CH
C N
n m
C
CHH2C
N
n H2C CHm
ve/veya
(2)
xviii
Çok düşük kil miktarlarıyla bile polimerlerin özelliklerine belirgin gelişmeler kazandırması nedeniyle, nano düzeyde polimer-kil etkileşimleri yoğun ilgi çekmektedir. Katmanlı smektit tipi olan montmorillonit (Mt), K+, Na+, Ca+2 and Mg+2 gibi katyonları yüzeyinde adsorplayabilen, bir su tutan alümina silikat mineralidir. Bu çalışmada, monosakkarit temelli poli(stiren-ko-akrilonitril) kil nanokompozitlerinin (MSAN/NaMt) sentezlenmesinde NaMt kullanılmıştır. 0,5% (MSAN/NaMt80); 1% (MSAN/NaMt81); 1,5% (MSAN/NaMt82) ve 2% (MSAN/NaMt83) NaMt içeren kompozit örnekleri in situ polimerizasyon metoduyla sentezlenmiştir.
Elde edilen ürünlerin yapıları FT-IR ve 1H-NMR analizleriyle aydınlatılmıştır. Bu analizlerin sonuçları istenen yapıların oluştuğunu göstermiştir. NaMt ile MSAN arasında oluşan etkileşimleri belirlemek için XRD analizleri yapılmıştır. XRD analizi sonuçlarına göre, kompozit örneklerinin analizlerinde difraksiyon piki (d001) gözlenmemiştir. Bunun nedeninin kilin çok iyi dağılmış olması yada kilin polimer tarafından kaplanmış olması olduğu düşünülmüştür. Elde edilen ürünlerin akış davranışlarının belirlenmesi amacıyla Reoloji analizi yapılmıştır. Reoloji sonuçlarına göre, MSAN78 ve MSAN/NaMt örnekleri reopektik davranış göstermiştir. MSAN/NaMt örnekleri psödoplastik davranış gösterirken, MSAN78 Bingham plastik davranış göstermiştir. NaMt eklenmesiyle beraber, reolojik özelliklerde bazı değişimler gözlenmiştir. Kayma hızı artışıyla beraber görünür viskozite, NaMt partiküllerinin yüzdesinin artmasıyla artış göstermiştir. MSAN78 ve MSAN/NaMt örneklerinin termal davranış ve termal dayanımlarının incelenmesi DSC ve TGA analizleriyle gerçekleştirilmiştir. DSC analizi sonuçlarına göre, MSAN78 ve MSAN/NaMt örnekleri iki camsı geçiş gerçekleştirmiştir. DSC termogramlarında gözlenen erime ve bozunma sıcaklıkları, artan NaMt miktarıyla, artış göstermiştir. TGA analizi sonuçlarına göre ise, MSAN/NaMt örneklerinin bozunma sıcaklıkları, MSAN78’e kıyasla, artan NaMt miktarıyla beraber artış göstermiştir. Termal analiz sonuçları, NaMt’nin termal kararlılıkta gelişme sağladığını göstermiştir. MSAN78 ve MSAN/NaMt örneklerinin mekanik dayanımlarının incelenmesi için DMA analizleri gerçekleştirilmiştir. Elastikiyet katsayısı değerlerine göre, MSAN/NaMt örneklerinin elastikliğinin NaMt yüzdesi arttıkça arttığı gözlenmiştir. Kopma noktaları incelendiğinde ise MSAN78 filminin en önce koptuğu görülmüştür. DMA analizi MSAN/NaMt örneklerinin MSAN78’e kıyasla mekanik özelliklerinin geliştirilmiş olduğunu göstermektedir. MSAN78 ve MSAN/NaMt örneklerinin su tutma özelliklerinin incelenmesi ve suya karşı dayanımdaki gelişmeyi gözlemlemek için, su tutma testi gerçekleştirilmiştir. MSAN/NaMt örneklerinin su tutması içerdikleri kil yüzdeleri arttıkça azalma gösterirken, en fazla suyu MSAN78 tutmuştur. Burdan da NaMt’nin polimere suya karşı iyi bir dayanım kazandırdığı görülmüştür.

1
1. INTRODUCTION AND AIM
In recent years, polymer-clay nanocomposite systems carry on their importance and
popularity due to the enhancement that they provide to the polymeric materials. They
provide improvement such as in mechanical strength, modulus, thermal stability, gas
barrier properties, fire-retardant properties, corrosion resistance, ionic conductivity
and decreased absorption in organic liquids.
Poly(styrene-co-acrylonitrile) SAN is a copolymer of acrylonitrile and styrene
monomers. It has more advantages than polystyrene or polyacrylonitrile
homopolymers due to its better chemical and physical properties [1]. It has many
application area such as dials, knobs, and covers for domestic appliances, electrical
equipment, car equipment, dishwasher safe housewares, such as refrigerator meat
and vegetable drawers, blender bowls, vacuum cleaner parts, humidifier parts, plus
other industrial and domestic applications with requirements more stringent than can
be met by polystyrene.
In this study, synthesis of SAN and NaMt nanocomposites of SAN was performed
because of its appropriate chemical/physical properties and wide application area.
During the synthesis of SAN and SAN-NaMt nanocomposites, sugar beet molasses
was used as reducing agent because of its content of reducing monosaccharides
(raffinose, glucose, fructose and unseperated sucrose etc.) in various amounts. Sugar
beet molasses is a by-product of sugar production. It has a number of application area
generally as a component in compound feeds, livestock feeds and silage additives.
Utilization of molasses as a reducing agent in radicalic redox polymerization is
thought to be an alternative application area.
This study has two main goals. One of them is to investigate preparation of
monosaccharide-mediated SAN (MSAN) by radicalic redox polymerization and
preparation of its nanocomposites by in situ methods and finally to characterize and
compare polymers and nanocomposites in terms of their thermal, mechanic,
rheological and water sorption properties. The other aim is to utilize sugar beet
molasses which is a by-product.

2
3
2. THEORETICAL PART
2.1 Molasses
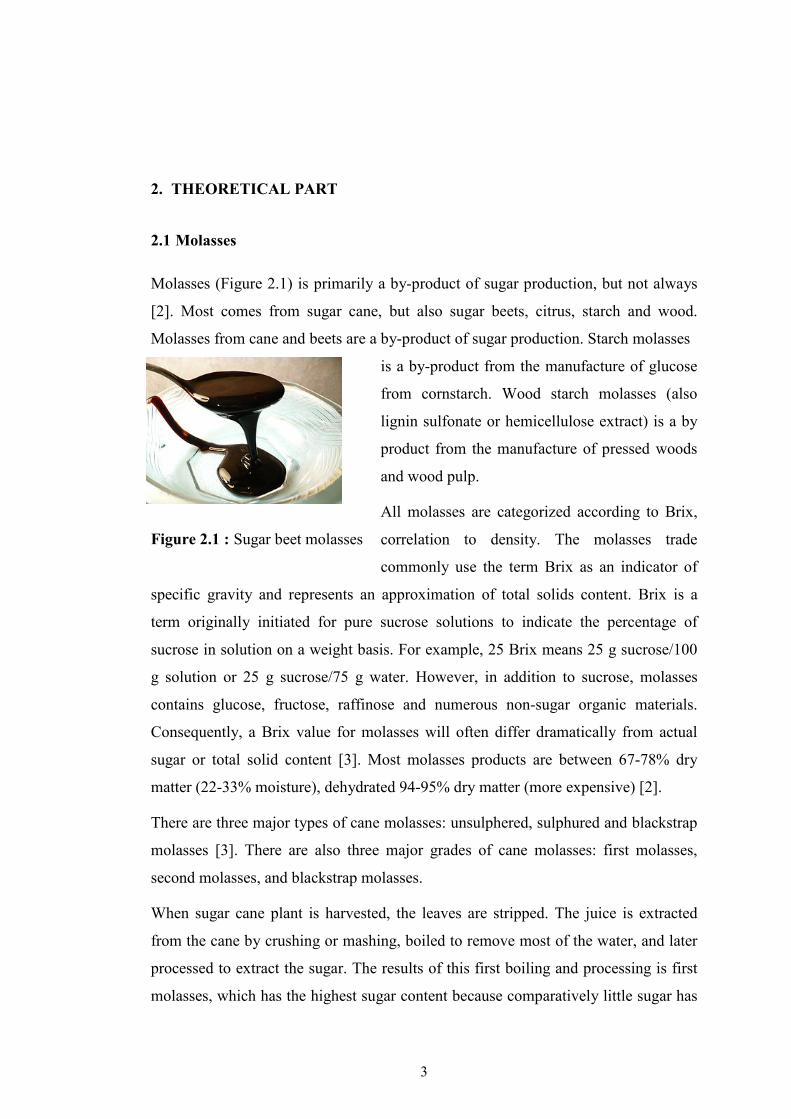
Molasses (Figure 2.1) is primarily a by-product of sugar production, but not always
[2]. Most comes from sugar cane, but also sugar beets, citrus, starch and wood.
Molasses from cane and beets are a by-product of sugar production. Starch molasses
is a by-product from the manufacture of glucose
from cornstarch. Wood starch molasses (also
lignin sulfonate or hemicellulose extract) is a by
product from the manufacture of pressed woods
and wood pulp.
All molasses are categorized according to Brix,
correlation to density. The molasses trade
commonly use the term Brix as an indicator of
specific gravity and represents an approximation of total solids content. Brix is a
term originally initiated for pure sucrose solutions to indicate the percentage of
sucrose in solution on a weight basis. For example, 25 Brix means 25 g sucrose/100
g solution or 25 g sucrose/75 g water. However, in addition to sucrose, molasses
contains glucose, fructose, raffinose and numerous non-sugar organic materials.
Consequently, a Brix value for molasses will often differ dramatically from actual
sugar or total solid content [3]. Most molasses products are between 67-78% dry
matter (22-33% moisture), dehydrated 94-95% dry matter (more expensive) [2].
There are three major types of cane molasses: unsulphered, sulphured and blackstrap
molasses [3]. There are also three major grades of cane molasses: first molasses,
second molasses, and blackstrap molasses.
When sugar cane plant is harvested, the leaves are stripped. The juice is extracted
from the cane by crushing or mashing, boiled to remove most of the water, and later
processed to extract the sugar. The results of this first boiling and processing is first
molasses, which has the highest sugar content because comparatively little sugar has
Figure 2.1 : Sugar beet molasses

4
been extracted from the juice. Unsulphered molasses is the finest quality. It is made
from the juice of sun-ripened cane and the juice is clarified and concentrated.
Barbados molasses is one type of unsulphered molasses, light in colour and high in
sucrose mainly sold for cooking, confectionery and in the production of rum.
Second molasses is created from a second boiling and sugar extraction, so there is
less sugar. It has a darker colour and a slightly bitter taste, or as some would say a
more pronounced flavour.
Further rounds of processing and boiling yield blackstrap molasses. Blackstrap
molasses is from the third boil and has a commercial value in the manufacture of
cattle feed and other industrial uses. It is 55 to 65% sugar.
Sulphured molasses is made from green sugar cane that has not matured long enough
and treated with sulphur fumes during the sugar extracting process.
Cooking molasses is a blend of fancy and blackstrap molasses. It is 59 to 69% sugar.
Cane molasses is a by-product of the manufacture or refining of sucrose from sugar
cane. Cane molasses purchased as an animal feed will contain more than 46% total
sugars expressed as invert sugars. If its moisture content exceeds 27%, its density
determined by double dilution must not be less than 79,50 Brix.
Beet molasses is a by-product of the manufacture of sugar (sucrose) from sugar
beets. It will have more than 48% total sugars expressed as invert and its density
determined by double dilution must not be less than 79,50 Brix.
However, some molasses from sugar beets is so well processed it has virtually no
sugar. So, if you are buying beet molasses, be sure to find out first if it is sweet.
Citrus molasses is the partially dehydrated juices obtained from the manufacture of
dried citrus pulp. It must contain not less than 45% total sugars expressed as invert
and its density determined by double dilution must not be less than 71,0 Brix.
Starch molasses is a by-product of dextrose manufacture from starch derived from
corn or grain sorghums where the starch is hydrolyzed by enzymes and/or acid. It is
at least 43% reducing sugars expressed as dextrose and not less than 50% total sugars
expressed as dextrose.

5
Interestingly, molasses is also an excellent chelating agent. An object coated with
iron rust placed for two weeks in a mixture of one part molasses to nine parts water
will lose its rust due to the chelating action of the molasses.
2.1.1 Sugar beet molasses
Molasses that comes from the sugar beet is different from cane molasses [4]. Only
the syrup left from the final crystallization stage is called molasses; intermediate
syrups are referred to as "high green" and "low green" and these are recycled within
the crystallization plant to maximize extraction. Beet molasses is about 46-48%
sugar by dry weight, predominantly sucrose but also containing significant amounts
of glucose and fructose. Beet molasses is limited in biotin (Vitamin H or B7) for cell
growth, hence it may need to be supplemented with a biotin source. The non-sugar
content includes many salts such as calcium, potassium, oxalate, and chloride. These
are either as a result of concentration from the original plant material or as a result of
chemicals used in the processing. As such, it is unpalatable and is mainly used as an
additive to animal feed (called "molassed sugar beet feed") or as a fermentation
feedstock.
It is possible to extract additional sugar from beet molasses through a process known
as molasses desugarisation. This technique exploits industrial scale chromatography
to separate sucrose from non-sugar components. The technique is economically
viable in trade protected areas where the price of sugar is supported above the world
market price. As such it is practiced in the U.S.
Beet molasses is included in animal feed, alcohol, beverages, bakery goods and
pharmaceuticals [5].
Molasses is produced as a by-product during the production process of sugar from
sugar beet in many factories in Turkey. The production 2007-2008 term total
molasses production is 269.300 tones in Turkey [6]. Molasses production in Turkey
is given in detail in Table 2.1.

6
Table 2.1: Molasses production in respect of factories in Turkey
Factory Molasses (Tones) Factory Molasses (Tones)
Afyon 15.040 Erzurum 7.928
Ağrı 6.492 Eskişehir 22.178
Alpullu 7.016 Ilgın 20.885
Ankara 12.600 Kars 3.035
Bor 9.607 Kastamonu 8.500
Burdur 13.700 Kırşehir 8.044
Çarşamba 5.830 Malatya 8.176
Çorum 15.021 Muş 7.440
Elazığ 5.506 Susurluk 13.530
Elbistan 7.533 Turhal 23.345
Erciş 3.678 Uşak 5.240
Ereğli 25.980 Yozgat 7.070
Erzincan 5.926 Total 269.300
2.1.2 Content of sugar beet molasses
Most molasses products are between 67-78% dry matter (22-33% moisture),
dehydrated 94-95% dry matter (much more expensive)[2].
2-6% crude protein, low in vitamins A, D, B1 and B2, but are a good source of
pantothenic acid and niacin. Energy content 3,4-3,5 Mcal/kg, similar to oats, but
energy in molasses is in the form of monosaccharides/simple sugars, primarily
sucrose, fructose and glucose; while energy in grains is primarily in the form of
starch.
Molasses is known to be containing organic acids such as mainly lactic acid (1.7%),
malic, fumaric, valeric, oxalic acids and the trace amount of glucuronic and
galactronic acids where the total organic acid content can reach up to 4% [7].
Potassium, calcium, magnesium and sodium constitute a wide percentage of
molasses and it is stated that ferrum, zinc, manganese, copper, cobalt and lead are
present in trace amounts in molasses. Beside water, fermentable monosaccharides
(sucrose, glucose, fructose), the materials except monosaccharides and the materials
generated during the process and storing constitute the composition of molasses. The

7
sugar content accepted for sugar beet molasses is 46-48%. Also, it is determined that
the materials acting as inhibitor and increasing fermentation are present in molasses.
The content of sugar beet molasses comparable with cane molasses types are shown
in the Table 2.2 [8].
Table 2.2: Analysis of molasses types
Content Standart cane Molasses (%)
Feed cane Molasses (%)
Sugar beet Molasses (%)
Dry matter 73 71 73
Water 27 29 27
Total sugars 44-47 42-44.5 46-48
Crude protein 3-5 3-5 8-10
Crude ash 8-12 8-12 8-10
Crude fiber 0 0 0
Crude oil 0 0 0
Calcium 0.8 0.7 0.5
Phosphorus 0.5 0.4 0.3
Potassium 3 2.9 4
Magnesium 0.3 0.2 0.09
Copper 7-15* 7-15* 11*
*ppm
2.1.3 Industrial application of sugar beet molasses
Due to its unique physical and chemical properties molasses has traditionally been
used as a major component in compound feeds, livestock feeds and silage additives
[9]. However, it is now also being more widely used in various industrial processes.
Molasses has recently been recognised in a number of different industries, including
food and drinks manufacture, fuels, rubber, printing, chemical and construction
industries, alongside the traditional agricultural uses.
Animal feeding
Molasses is mainly used in animal feeding [2]. It is added to livestock rations for
four reasons:

8
• increases palatability.
• reduces dustiness of feed in processing (remember risk of explosions in grain
mills).
• binder in pelleting or to keep loose particles of feed (ie vit/min premix) from
sifting out.
• sometimes used as a carrier for a mineral or protein source (such as urea)
provided as a lick to range cattle.
It is high in reducing agents which have an effect on lysine, research reported
destruction of 0,5% lysine content per day. So if molasses is in grain mix, 1/3 of
lysine content would be destroyed within 3 months and 1/2 of lysine content would
be destroyed within 5 months. It does not mean to not use molasses in grain mix,
just means to either feed grain quickly, supply additional lysine, or don't feed grain
mixes with a lot of molasses to young, growing animals.
Molasses is usually added to grain as 5% of the total mixture. More than 5% in loose
grain mix in hot, humid weather may lead to mold, and more than 10% makes it too
sticky and hard to handle. When used as a binder in pelleting, molasses usually
added between 7-10%. All molasses products have a laxative effect and rations more
than 15-25% cause diarrhea and digestive upset.
Palatability differs among different types of molasses. Cane molasses has the most
pleasing odor and is the most palatable, this is the one used for human consumption
(blackstrap molasses). Beet molasses has a fishy odor, but doesn't affect palatability
for livestock. Cattle like wood molasses the least, and pigs like citrus molasses the
least.
Binding
Its main advantage over traditional binding materials is that it does not release
pollutants, during high temperature manufacture [9]. When molasses is burned it
produces only carbon dioxide and water. In contrast, other traditional binding agents
produce toxic emissions on combustion.
Coal Briquettes
Molasses is an environmentally friendly binding agent for coal briquettes for
domestic and industrial use.

9
Carbon Black Agglomeration
Industrial molasses provides a consistent and stable performance as a binding agent
for more efficient and safer handling of this fine powder which is used to reinforce
and colour pneumatic tyre rubber and employed in printing pigments, sugar refining
and other chemical processes.
Stabilising Cement
A low rate of molasses, added to cement, delays concrete setting by 12-24 hours.
This allows pumping or temporary storage, which is very beneficial for large scale
operations such as motorway construction.
Jumadurdiyev et al. studied [10] about usage of molasses in delaying hardening of
cement. Molasses, a by-product of sugar industry, increases the fluidity of fresh
concrete, and also delays the hardening time of cement paste. Setting times of cement
pastes prepared with molasses at three different dosages (0,20, 0,40, and 0,70 wt.%
of cement content) were determined and it was found that molasses addition causes
considerable increase in both initial and final setting times. Flexural and compressive
strengths were determined on hardened concretes at both early ages (1, 3, and 7
days), and moderate and later ages (28, 90, 180, 365, and 900 days).The strength of
concretes with molasses showed slight increase at all ages, except early age, with
respect to the control mix and no adverse effect has been experienced on the
durability properties over a long period of time (900 days).
Casting Moulds
Molasses makes an effective sand glue for casting moulds. The lack of toxic
emissions during firing and moulding gives it a distinct advantage over more
conventional substances.
Fermentation Processes
Molasses is used as an energy source in a wide range of fermentation processes to
grow yeasts, moulds and bacteria which produce brewing, baking, distilling and feed
yeasts [9].
Bakers and Brewers Yeasts
Molasses has a significant biotin content needed for growth in bakers and brewers
yeast.

10
Citric Acid
Large amounts of citric acid for soft drinks and pharmaceuticals manufacture are
produced from moulds adapted to utilise molasses as their energy source.
Industrial Alcohol
Industrial molasses contains B Vitamins and biotin, both helpful in the fermentation
process to produce alcohol for use in alcohol drinks, cosmetics and solvents. Beet
molasses due to its buffering capacity requires a higher content of sulphuric acid to
reduce pH to optimum fermentation levels than when cane molasses forms the
energy source.
Lotfy studied [11] the utilization of beet molasses as a novel carbon source for
cephalosporin C production by Acremonium Chrysogenum. Under experimental
conditions; Soya oil, beet molasses and corn steep liquor were found to be the major
factors contributing to the antibiotic production.
M.S.G.(Monosodium glutamate) & Lysine
Molasses is the perfect energy source for the complicated technology involved in
producing M.S.G. and Lysine. These amino acids are increasingly used in human and
livestock food processing. Only can molasses provides the biotin required for both
processes.
Food Products
The high energy and digestibility characteristics of molasses allied to an attractive
taste and aroma, make it an increasingly used constituent of human food products
[9]. Molasses is used as a flavouring and colouring agent, in sauces, speciality
sugars, brown sugars and sweets. It is also incorporated into specialist compost
which provides a high energy activator for mushrooms.
Palatability differs among different types of molasses. Cane molasses has the most
pleasing odor and is the most palatable, this is the one used for human consumption
(blackstrap molasses). Beet molasses has a fishy odor, but does not affect palatability
for livestock [2].
Additionally, there are studies to utilize molasses for alternative application areas.
Yang et al. [12] studied the alkaline degradation of invert sugar from molasses to be
used as de-icer. Sugar beet and sugar cane molasses have shown to be suitable

11
starting materials for producing de-icer preparations. The sucrose in the molasses
hydrolyzed to glucose and fructose by invertase. The reducing sugars then degraded
by NaOH, the alkali neutralized by the sugar acids produced, resulting in an increase
of the ionic strength and consequently depression of the freezing point of the
resulting solution. The reaction products showed the same freezing point depression
as seen in the degradation products from pure glucose.
2.2 Properties and Usage of Ce(IV) in Redox Polymerization
Ce(1V) ions are versatile reagents for the oxidation of numerous functional groups in
organic synthesis, as well as in transition metal chemistry [13]. They are also
employed to achieve nitration, hydroxylation, rearrangement, addition of carbonyl
compounds to 1,3-dienes, homolytic malonylation of aromatic hydrocarbons,
alkoxyiodination, nitratoiodination, and more. Most of these transformations open up
a broad applicability due to their mild reaction conditions, fast conversions, and
convenient work-up procedures. The use of ceric ion as an oxidant for organic
substrates gained prominence as an analytical reagent. Most of the reactions involve
a direct oxidation of the organic compound by Ce(1V). However, some indirect
oxidations are also considered in which Ce(1V) produces an active oxidant.
2.2.1 Oxidations of Ce(IV)
Cerium is a member of Group III A of the periodic table, commonly referred to as
rare earth metals, lanthanons, or lanthanides [14]. The normal oxidation states of
cerium salts are three (cerous, Ce(III)) and four (cerium, Ce(IV)); therefore,
monomeric cerium will be a one-electron oxidant. Cerous compounds resemble other
trivalent lanthanons, but cerium compounds are like the elements titanium,
zirconium, and thorium. The oxidation potential for the reaction (2.1), depends on
the nature of the medium.
Ce(III) Ce(IV) + e- (2.1)
Values of E0298 are reported to be between -1.28 and -1.70 V. The electrode potential
for the reaction (2.2), is +2,335 V on the hydrogen scale.
12
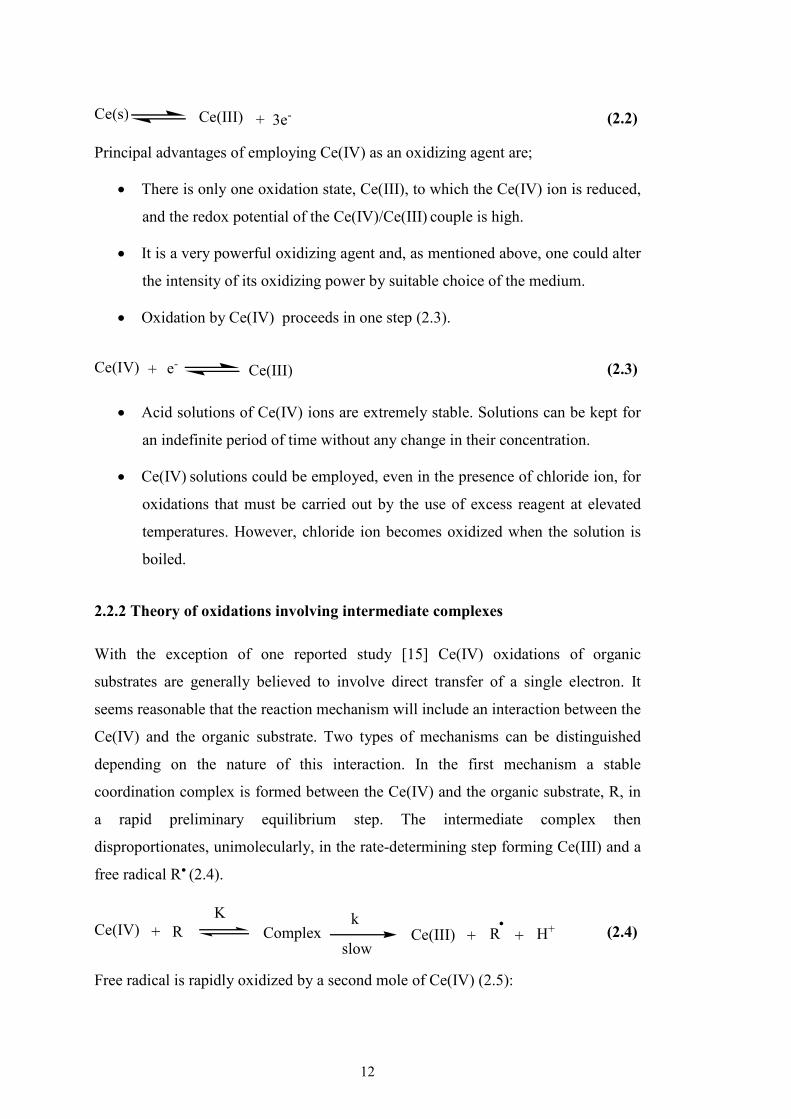
Ce(s) Ce(III) 3e-+ (2.2)
Principal advantages of employing Ce(IV) as an oxidizing agent are;
• There is only one oxidation state, Ce(III), to which the Ce(IV) ion is reduced,
and the redox potential of the Ce(IV)/Ce(III) couple is high.
• It is a very powerful oxidizing agent and, as mentioned above, one could alter
the intensity of its oxidizing power by suitable choice of the medium.
• Oxidation by Ce(IV) proceeds in one step (2.3).
Ce(III)Ce(IV) + e- (2.3)
• Acid solutions of Ce(IV) ions are extremely stable. Solutions can be kept for
an indefinite period of time without any change in their concentration.
• Ce(IV) solutions could be employed, even in the presence of chloride ion, for
oxidations that must be carried out by the use of excess reagent at elevated
temperatures. However, chloride ion becomes oxidized when the solution is
boiled.
2.2.2 Theory of oxidations involving intermediate complexes
With the exception of one reported study [15] Ce(IV) oxidations of organic
substrates are generally believed to involve direct transfer of a single electron. It
seems reasonable that the reaction mechanism will include an interaction between the
Ce(IV) and the organic substrate. Two types of mechanisms can be distinguished
depending on the nature of this interaction. In the first mechanism a stable
coordination complex is formed between the Ce(IV) and the organic substrate, R, in
a rapid preliminary equilibrium step. The intermediate complex then
disproportionates, unimolecularly, in the rate-determining step forming Ce(III) and a
free radical R� (2.4).
Ce(IV) + RK
Complexk
slowCe(III) + R + H+
(2.4)
Free radical is rapidly oxidized by a second mole of Ce(IV) (2.5):

13
Ce(IV) + Rfast
Ce(III) + H+Product + (2.5)
The second mechanism assumes that the substrate is oxidized directly by Ce(IV). In
this case the interaction takes place in the transition state (2.6):
Ce(IV) + R Ce(III) + H++R[Ce(IV)--------R] (2.6)
As in the first mechanism (2.4), the free radical is rapidly oxidized by a second mole
of Ce(IV). The participation of intermediate complexes in the reaction mechanism
can be evaluated from kinetic data. Duke [16] originally derived the general theory
for oxidations involving intermediate complexes and was the first to apply it to
Ce(IV) oxidations. It is assumed: (1) that the stoichiometry of the complex requires
one oxidant and one substrate molecule (2.4); (2) that coordination equilibrium is
rapidly established and that equilibrium is maintained despite the unidirectional
disproportionation of the complex; and (3) the free radical formed is rapidly oxidized
by a second mole of Ce(IV) (2.5).
Free radicals are produced from two types of complexes, alcohol complex and the
glycol complex, as shown in (2.6), where A and B are alcohol and glycol complexes,
respectively.
C
H
CH2
OH
Ce (IV)+ C CH2
OH
H+
A
Ce (III)+ +
Ce (IV) C
H
C
OH
+
H
OH
H+B Ce (III)+ +C
H
C
O
H
OH
+
C
H
CH2
O
and/or
(2.7)

14
2.2.3 Synthesis of block and graft copolymers by Ce(IV) initiated redox
polymerization
The possibility of modifying cellulosic materials by graft copolymerization with
vinyl monomers has directed research effort to various methods of generating free
radicals. The cerium ion-alcohol redox system, suggested by Mino and Kaizerman
[17], has received much attention. The mechanism of free radical formation is
believed to involve the formation of a complex between cerium ion and cellulosic
hydroxyl groups. The complex then disproportionate unimolecularly forming a free
radical on the cellulose backbone. The free radical initiates polymerization when
vinyl monomers (M), are present. The mechanism can be summarized as (2.8):
Ce(IV) + ROH Complex Ce(III) + H+ + ROH
+ M R(OH)M
R(OH)M + nM R(OH)Mn+1
ROH
(2.8)
The polymerization is terminated by oxidation of the free radical by Ce(IV).
For initiating vinyl polymerization Ce(IV) ions are used alone or in conjunction with
suitable reducing agents [18]. Various alcohols such as benzyl alcohol, ethanol,
ethylene glycol, and 3-chloro-1 propanol have been employed with cerium ions to
form redox systems for homopolymerization, block or graft copolymerization.
Pramanick and Sarkar [19], investigated the polymerization of methyl methacrylate
initiated by only cerium ions and found that the mechanism of initiation depends
strongly on the acidity of the medium and is independent of the nature of anion
associated with the cerium ion. In a moderately acidic medium, the primary reaction
is the formation of hydroxyl radical by cerium-ion oxidation of water. When cerium
sulfate is used, the hydroxyl radicals initiate the polymerization and appear as end
groups in the polymer molecule. If, on the other hand, cerium ammonium sulfate or a
mixture of cerium sulfate and ammonium sulfate are used, some of the hydroxyl
radicals react with the ammonium ion, producing ammonium radicals, and both
radicals act as initiators, giving polymers with both hydroxyl and amino end groups.
Ce (IV) salts are well known initiators for graft copolymerization of vinyl monomers
such as acrylonitrile and acrylamide. For example, a redox reaction between Ce(IV)

15
and -CH2OH groups of ketonic resin and free radicals generated initiates the
polymerization (2.9) [20].
HO CH2 C
C
CH3
CH3
CH2 OH
O
HO CH2 C
C
CH3
CH3
CH
OHOCe(IV)
Methyl ethyl ketone/formaldehyde resin
CH CNCH2n
HO CH2 C
C
CH3
CH3
CH
OHO
mm
m
CH2 CH
CN n (2.9)
In the first step, Ce(IV)/methylol redox reaction occurs and free radicals are
generated. These free radicals initiate polymerization of acrylonitrile. Polymerization
may proceed from other –CH2OH groups of ketonic resin molecule also. This occurs
when Ce(IV) (linear termination) or combination by themselves (mutual termination)
may both be possible, by depending on the Ce(IV) concentration. Increasing Ce(IV)
concentration results in a linear termination.
Water-soluble cellulose derivatives such as methyl cellulose (MC) and methyl
hydroxy propyl cellulose (MHPC) (2.10) and polyethylene glycols (2.11) were also
used as reducing agents for block/graft copolymer synthesis of acrylamide and
acrylonitrile [21].

16
O
H
OH
OCH3
H H
O
O
H H
CHOH
H2C CH
Methyl Celulose-polyacrylonitrile (MC-PAN)
O
H
OH
OCH3
H H
O
O
H H
CHOH
HC
C
CH2
CN
NH2
O
Methyl Celulose-polyacrylonitrile (MC-PAM)
n
n
O
H
OH
OCH3
H H
O
O
H H
CH2OCH2CH2CHOH
CH2 CH
C
NH2
O
n
Methyl Hydroxypropyl Cellulose-Polyacrylamide (MHPC-PAM)
(2.10)
CH CH2 CH2 CH2 O CH2 CH2 O CH2 CH2 CH2 CH2
X OH OH Xn m p
m= 30 and 90
X= CN, CONH2 (2.11)
The redox system of a cerium salt and α,ω-dihydroxy poly(dimethylsiloxane) is used
by Öz and Akar [22] to polymerize vinyl monomers such as acrylonitrile and styrene
to produce block copolymers (2.12).
CH CH2 CH CH2 Si O Si CH2 CH CH2 CH
X OH
CH3
CH3
CH3
CH3OH X
p nm3 3
(2.12)
The concentration and type of α,ω-dihydroxy poly(dimethylsiloxane) has shown to
affect the yield and molecular weight of the copolymers. The copolymers obtained
have lower glass-transition temperatures at about 208ºC and much higher contact
angle values than those of the corresponding homopolymer of vinyl monomers,
17
regarding the fact that the weight percentage of α,ω-dihydroxy
poly(dimethylsiloxane) of the copolymers was in the range of 1-2%.
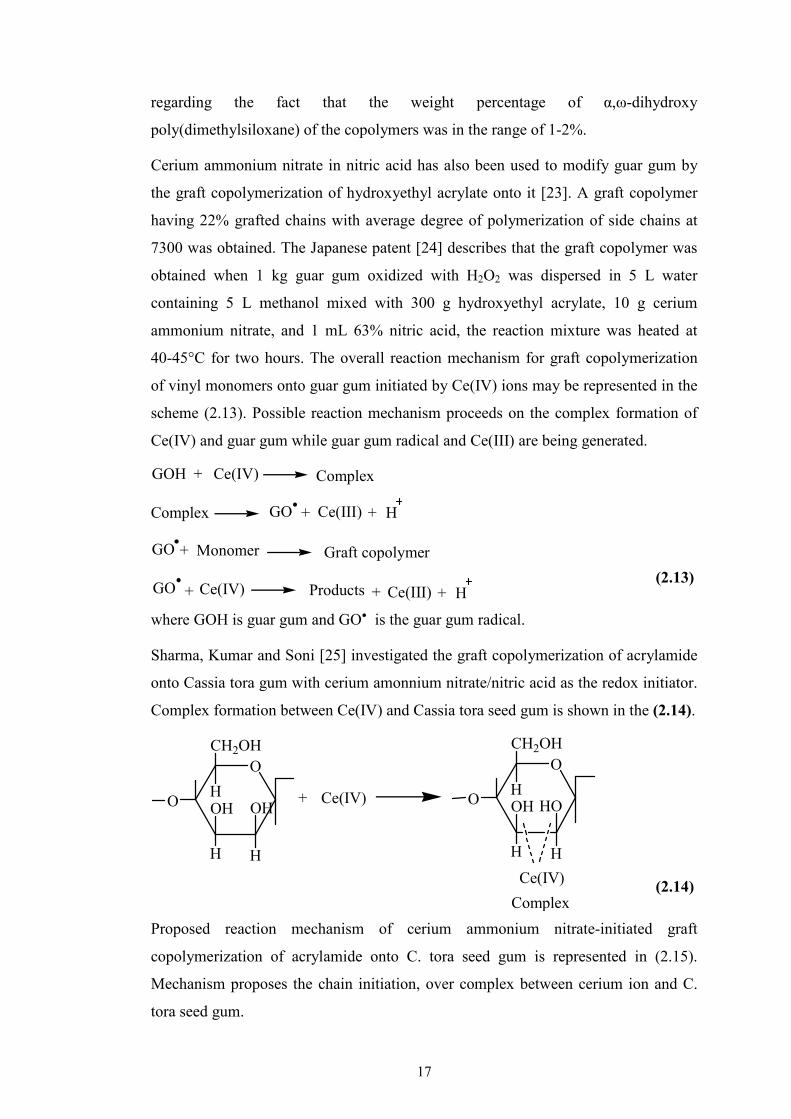
Cerium ammonium nitrate in nitric acid has also been used to modify guar gum by
the graft copolymerization of hydroxyethyl acrylate onto it [23]. A graft copolymer
having 22% grafted chains with average degree of polymerization of side chains at
7300 was obtained. The Japanese patent [24] describes that the graft copolymer was
obtained when 1 kg guar gum oxidized with H2O2 was dispersed in 5 L water
containing 5 L methanol mixed with 300 g hydroxyethyl acrylate, 10 g cerium
ammonium nitrate, and 1 mL 63% nitric acid, the reaction mixture was heated at
40-45°C for two hours. The overall reaction mechanism for graft copolymerization
of vinyl monomers onto guar gum initiated by Ce(IV) ions may be represented in the
scheme (2.13). Possible reaction mechanism proceeds on the complex formation of
Ce(IV) and guar gum while guar gum radical and Ce(III) are being generated.
GOH + Ce(IV) Complex
Complex GO Ce(III) H+ +
GO + Monomer Graft copolymer
GO + Ce(IV) Products Ce(III) H++ (2.13)
where GOH is guar gum and GO� is the guar gum radical.
Sharma, Kumar and Soni [25] investigated the graft copolymerization of acrylamide
onto Cassia tora gum with cerium amonnium nitrate/nitric acid as the redox initiator.
Complex formation between Ce(IV) and Cassia tora seed gum is shown in the (2.14).
OCH2OH
HOH
H
OH
H
O + Ce(IV)
O
CH2OH
HOH
H
HO
H
O
Ce(IV)
Complex (2.14)
Proposed reaction mechanism of cerium ammonium nitrate-initiated graft
copolymerization of acrylamide onto C. tora seed gum is represented in (2.15).
Mechanism proposes the chain initiation, over complex between cerium ion and C.
tora seed gum.

18
O
C C
CH2OH
HOH
H
O
H
O
+
Chain initiation
Complex
O
C C
CH2OH
HO
H
OH
H
O
OR Ce(III) + H+
O
C C
CH2OH
HOH
H
O
H
O
+
O
C C
CH2OH
HO
H
OH
H
O
OR (n+1) (CH2=CH-CONH2)
O
C C
CH2OH
HOH
H
O
H
O
CHCH2CHH2NOC
H2NOCn
O
C C
CH2OH
HO
H
OH
H
O
CH CH2 CH2 CH CONH2
CONH2n
+
Chain propagation
(2.15)

19
2.3 Poly(styrene-co-acrylonitrile) (SAN) Copolymer
Poly(styrene-co-acrylonitrile) is the copolymer of styrene and acrylonitrile
monomers (2.16) [1].
CH2 CH
C
CHCH2
N
n m
(2.16)
Because of the polar nature of the acrylonitrile molecule, SAN copolymers have
better resistance to hydrocarbons, oils, and greases than polystyrene. These
copolymers have a higher softening point, a much better resistance to stress cracking
and crazing, and higher impact strength than the homopolymer polystyrene, in
addition they retain the transparency. The toughness and chemical resistance of the
copolymer increases with the acrylonitrile content but so do the difficulty in molding
and the yellowness of the resin. Commercially available SAN copolymers have 20-
30% acrylonitrile content. They are produced by emulsion, suspension, or continuous
polymerization.
Due to their rigidity, transparency, and thermal stability, SAN resins have found
applications for dials, knobs, and covers for domestic appliances, electrical
equipment, car equipment, dishwasher safe housewares, such as refrigerator meat
and vegetable drawers, blender bowls, vacuum cleaner parts, humidifier parts, plus
other industrial and domestic applications with requirements more stringent than can
be met by polystyrene. SAN resins are also reinforced with glass to make dashboard
components and battery cases. Over 35% of the total SAN production is used in the
manufacture of ABS blends.
SAN copolymers are amorphous, transparent, and glossy random copolymers
produced by batch suspension, continuous mass (or solution), and emulsion
polymerization processes [26]. The molecular weight and the acrylonitrile content of
the copolymer are the key factors in determining polymer properties. SAN has
improved tensile yield, heat distortion, and solvent residence than polystyrene
because of the incorporation of acrylonitrile. For example, SAN is resistant to
aliphatic hydrocarbons, alkalines, battery acids, vegetable oils, foods, and detergents.
20
SAN is attacked by some aromatic hydrocarbons, ketones, esters, and chlorinated
hydrocarbons. Emulsion processes are used to produce SAN diluent for ABS resins.
SAN produced by mass and suspension processes are primarily used for molding
applications. A variety of copolymer properties or grades is available, depending on
the molecular weight and the copolymer composition (styrene/acrylonitrile ratio).
The major problems in SAN processes are related to reactor temperature control,
mixing, and copolymer composition control. The viscosities of concentrated SAN
solutions are higher than polystyrene of the same molecular weight; thus, heat
removal becomes more difficult. In a continuous reactor process, the mixing of low
viscosity reacting fluid can be difficult. The polymerization rate is higher than that of
styrene homopolymerization. If mixing is not homogeneous, SAN degrades resulting
in coloring and contamination. To avoid composition drift in a batch
copolymerization process, SAN copolymers are often manufactured at the azeotropic
point, where monomer and polymer have the same composition (Figure 2.2).
However, if the desired copolymer composition is not the azeotropic composition,
the copolymer composition varies with conversion (or composition in the bulk
phase). Composition drift in SAN copolymers is undesirable because SAN
copolymers of different compositions are incompatible and cause phase separation.
Therefore, it is very important to monitor the bulk-phase composition and to make
some corrective actions to prevent the copolymer composition drift. For example,
more reactive monomer or comonomer can be added to the reactor during
polymerization to keep the monomer/comonomer ratio constant. The polymerization
reactors that can be used for continuous mass processes are loop reactors and
continuous stirred tank reactors (CSTR) with an anchor agitator.
2.3.1 Copolymerization of styrene and acrylonitrile
Styrene homopolymer is a brittle polymer [27]. Styrene copolymers are industrially
of significant importance because a wide variety of polymer properties can be
obtained by copolymerizing styrene with rubbers (diens) and other vinyl monomers.
The copolymers of acrylonitrile and styrene are thermoplastics of increasing
commercial importance because of their superior properties to those of polystyrene
and the relative ease of fabrication [28]. The properties of SAN copolymers are
dependent on their acrylonitrile content. With increasing acrylonitrile content,
21
copolymers demonstrate continuous improvements in barrier properties and chemical
and UV resistance, but thermal stability deteriorates. These monomers exhibit
strongly contrasting electron donating properties, and hence there is a strong
tendency to alternation in copolymerization.
The copolymer composition can be determined by the reactivity ratios (2.17) defined
as
r1 =k11
k12
r2 =k22
k21 (2.17)
The mole fraction (F1) of monomer M1 in the polymer phase can then be expressed
as follows (2.18):
=F1
r1f1 + f1f2
r1f12 + 2f1f2 + r2f2
2
(2.18)
where f1 and f2 are the mole fractions of monomer 1 and monomer 2 in the bulk
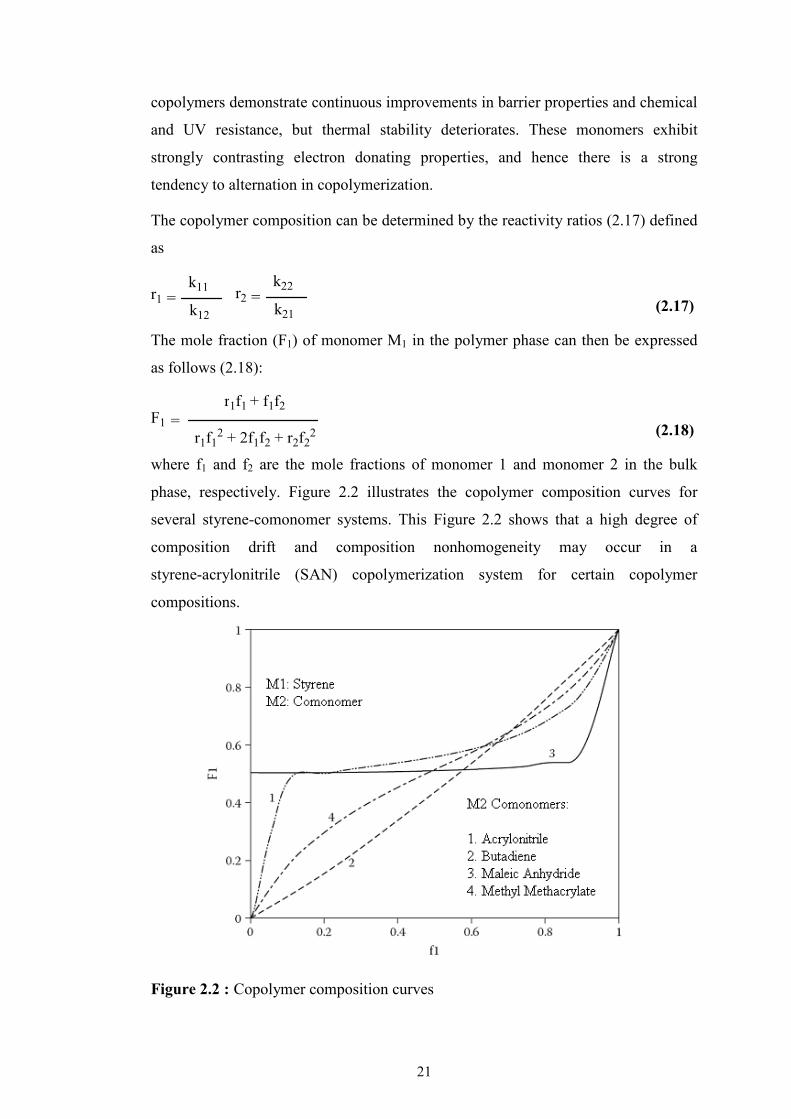
phase, respectively. Figure 2.2 illustrates the copolymer composition curves for
several styrene-comonomer systems. This Figure 2.2 shows that a high degree of
composition drift and composition nonhomogeneity may occur in a
styrene-acrylonitrile (SAN) copolymerization system for certain copolymer
compositions.
Figure 2.2 : Copolymer composition curves

22
2.3.2 Emulsion process of poly(styrene-co-acrylonitrile) (SAN) copolymers
Both batch (or semicontinuous) and continuous emulsion process are used to
manufacture SAN latex [29]. In a batch process, a styrene, acrylonitrile, and aqueous
solution of a water-soluble initiator, e.g., potassium persulfate), emulsifier, and chain
transfer agent (molecular-weight regulator, e.g., dodecyl mercaptan) are charged into
a stirred tank reactor. The weight ratio of styrene/acrylonitrile is generally kept
between 70:30 and 85:15. If the desired copolymer composition corresponds to the
azeotropic composition, copolymer composition drift will be minimal. Otherwise, a
monomer mixture having a different styrene/acrylonitrile ratio from the initial charge
must be added continuously during polymerization to keep the ratio constant because
any wall deviation in the bulk monomer phase composition can easily result in
significant composition heterogeneity. For example, two SAN copolymers differing
more than 4% in acrylonitrile content are incompatible, resulting in poor physical
and mechanical properties. To calculate the monomer feeding policy, a dynamic
optimization technique can be used with a detailed process model. In such a process,
the reactor temperature can also be varied to minimize the batch reaction time while
maintaining the copolymer composition and molecular weight and/or molecular-
weight distribution at their target values.
In a continuous emulsion process, two or more stirred tank reactors in series are
used. Separate feed streams are continuously added into each reactor. The reactors
are operated at about 68oC. The latex is transferred to a holding tank (residence time
of about 4 h) before being steam-stripped to remove unreacted monomers. In a
continuous process, the residence time distribution is generally broad. A large
holding tank placed downstream of the reactors provides extra time to the reaction
mixture and reduces the molecular-weight distribution.
Mino [30] studied the bead copolymerization of styrene and acrylonitrile, in the
presence of 1-azobis-1-phenylethane at high temperature (90-100°C) and determined
the distribution of acrylonitrile between styrene and the aqueous phase in the
conversion. The initial distribution of acrylonitrile between styrene and the aqueous
phase and the change of this distribution during the copolymerization were
determined. The concentration of acrylonitrile in the aqueous phase remains fairly
constant up to 20-25% conversion, then it decreases rapidly up to about 90%

23
conversion. The over-all rate of copolymerization following an induction period,
remains constant up to about 30-35% conversion, then it increases slightly only to
decrease rapidly at about 90% conversion. In a system of this type the mole fraction
of acrylonitrile in the oil phase increases through the polymerization, partly because
acrylonitrile reacts at a lower relative rate, partly because the acrylonitrile dissolved
in the aqueous phase diffuses continuously into the beads. The reactivities of styrene
and acrylonitrile in aqueous dispersion are the same as in bulk if the partition of
acrylonitrile between the two phases is taken into account. The initial rates of
copolymerization, in bulk, increase with the acrylonitrile content of the mixture. At
high conversion, a marked acceleration in rates takes place. This autoacceleration is
due to the increased viscosity of the medium and to the variation of the comonomer
composition with converting.
Beside the acrylonitrile dispersion, the initiator is important in emulsion
polymerization of styrene-acrylonitrile copolymer. Medizabal et al. studied [31] the
synthesis of styrene-acrylonitrile (SAN) copolymers by emulsion or microemulsion
polymerization using either a water-soluble (potassium persulfate or KPS) or a
water-insoluble (AIBN) initiator. The surfactant used was
dodecyltrimethylammonium bromide (DTAB) or sodium dodecylbenzenesulfonate
(SDBS). Polymerization in DTAB microemulsions initiated with AIBN are faster
and have higher conversions than those initiated with KPS, but the opposite effect is
observed for emulsion polymerization. In both emulsion and microemulsion
polymerizations, high molecular weights (2-4 106 Dalton) SAN copolymers are
produced with composition richer in styrene (S/AN = 81/19 w/w) than the initial feed
composition (75/25 w/w). Latex produced by microemulsion polymerization contain
particles two- to three-fold smaller than those prepared by emulsion polymerization.
SAN copolymers are often manufactured at the azeotropic point, where monomer
and polymer have the same composition [26, 29]. Vanderhoff et al. studied [32]
Emulsion copolymerization of azeotropic styrene-acrylonitrile monomer mixture in
polystyrene seed latexes. The azeotropic 80:20 styrene-acrylonitrile mixture was
polymerized in 190nm and 300nm-diameter monodisperse polystyrene seed latexes
by batch, batch-with-equilibrium-swelling, and semi-continuous polymerization.
Polystyrene seed latexes were used to determine the degree of grafting of the
substrate as well as the styrene-acrylonitrile copolymer. The critical factor
24
determining the formation of new particles was the surface area of the seed latex: at
or above 226 m2/dl, new particles were not formed; at or below 179 m2/dl, a new
crop of particles was nucleated, the number increasing with decreasing surface area.
The degree of grafting of the polystyrene seed substrate was greater for the smaller
particle size seed latex, and increased exponentially with increasing seed surface
area. The amount of grafted styrene-acrylonitrile copolymer determined the stability
of the grafted particles in acetone, a good solvent for the copolymer. Dynamic
mechanical spectroscopy showed that the continuous phase was either the
polystyrene substrate (Tg 104°C) or the styrene-acrylonitrile copolymer phase (Tg
120°C) except where the degree of grafting was high, in which case, the Tg was
intermediate between the two values. Beside this study, Lin et al. studied [33]
simulation model for the emulsion copolymerization of acrylonitrile and styrene in
azeotropic composition. A simulation model based on the unit segment concept
which provides prediction of conversion and molecular weight of product, is
proposed for the emulsion polymerization of acrylonitrile and styrene in azeotropic
composition. Effects of initiator concentration and emulsifier concentration on
conversion and molecular weight were studied experimentally and theoretically. It is
found that the desorption of acrylonitrile radicals should be taken into account, and
the number of radicals per particle is always less than 0,5. The concentration of
polymer particles is proportional to the 0.58 power in respect of the emulsifier
concentration and to the 0,35 power in respect of the initiator concentration. The
auto-acceleration effect becomes significant when both initial emulsifier
concentration and initiator concentration decrease, which influences the average
molecular weight of the products. The azeotropic composition of
acrylonitrile/styrene is 28,5:71,5 by weight for this system at 60°C reaction
temperature.
2.3.3 Suspension process of poly(styrene-co-acrylonitrile) (SAN) copolymers
Suspension polymerization is performed by using a single reactor or two paralel
reactors [34]. A mixture of monomers, monomer-soluble initiator (peroxides and azo
compounds), and any additives (e.g. chain transfer agents) is dispersed in water by
mechanical agitation in the presence of a suspension stabilizer. The suspension
polymerization temperatures range from 70oC to 125oC. The reactor temperature is

25
increased gradually during the batch. SAN copolymer particles of 10–3000 µm are
obtained. To keep the copolymer composition constant, a mixture of monomers is
added into the reactor as in emulsion processes.
Kido et al. reported the suspension copolymerization of acrylonitrile-styrene [35]?
using dilauroyl peroxide and the SnCl2 redox system. In suspension
copolymerization of acrylonitrile-styrene, mixtures of 10–40 wt% acrylonitrile and
40–90 wt% styrene are polymerized in H2O in the presence of inorganic dispersing
agents according to the typical recipe presented in Table 2.3, to produce transparent
copolymer beads containing >90% 100–400-µ mesh particles.
Table 2.3: Typical recipe: Suspension copolymerization of acrylonitrile and styrene*
Ingredients Amount (ppm)
Water 150 Hydroxylapatite 2 Polyethylene glycol alkyl aryl ether phosphate 0,01 SnCl2 x 2H2O 0,02 Acrylonitrile 25 Styrene 75 tert-Dodecyl mercaptan 0,5 Dilauroyl peroxide 0,71 HCCl– CCl2 240
*Polymerization for 1 h at 25oC followed by 15 h at 60oC at stirring rate of 400 rpm.
Also, the acrylonitrile–styrene copolymer [36] was prepared by suspension
polymerization in the presence of 0,005–0,05% (based on monomers) tert-Bu, 3,5,5-
trimethyl perhexanoate, and tert-butyl peracetate at 110–140oC according to a typical
recipe presented in Table 2.4 to give a copolymer (unreacted monomer 0,1%) with
lower yellow neon and haze than a control (unreacted monomer) prepared without
tert-Bu peracetate.
26
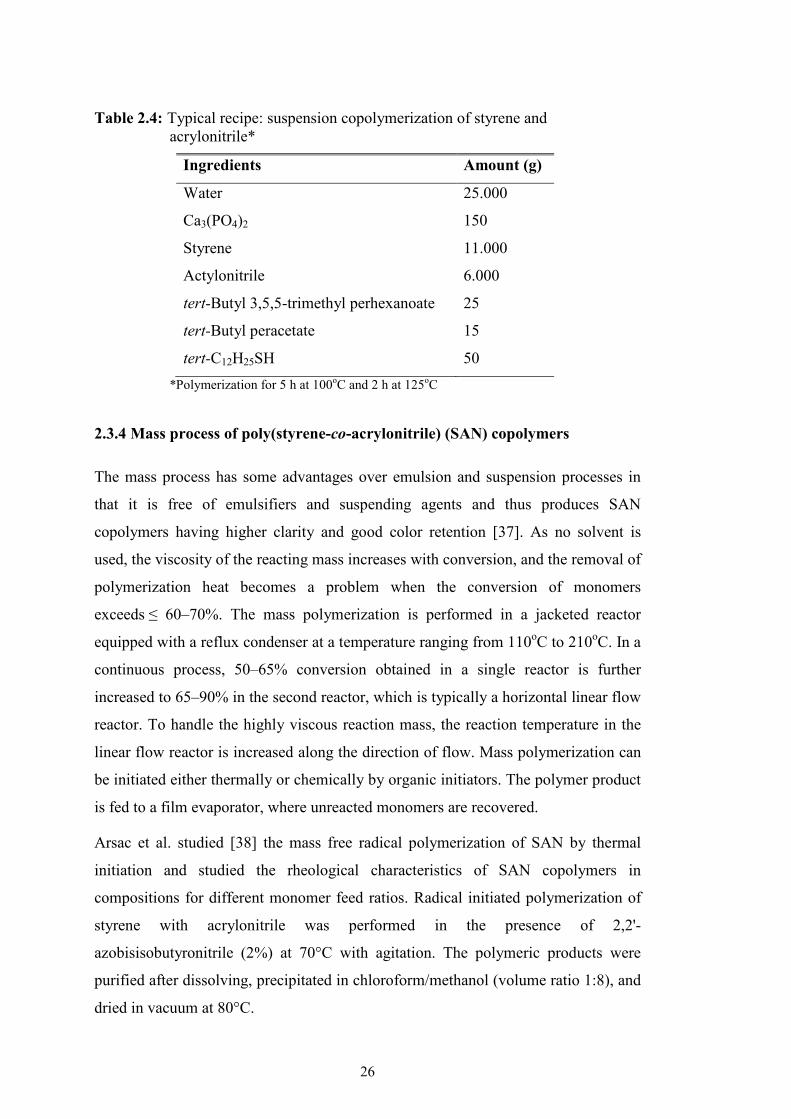
Table 2.4: Typical recipe: suspension copolymerization of styrene and acrylonitrile*
Ingredients Amount (g)
Water 25.000
Ca3(PO4)2 150
Styrene 11.000
Actylonitrile 6.000
tert-Butyl 3,5,5-trimethyl perhexanoate 25
tert-Butyl peracetate 15
tert-C12H25SH 50
*Polymerization for 5 h at 100oC and 2 h at 125oC
2.3.4 Mass process of poly(styrene-co-acrylonitrile) (SAN) copolymers
The mass process has some advantages over emulsion and suspension processes in
that it is free of emulsifiers and suspending agents and thus produces SAN
copolymers having higher clarity and good color retention [37]. As no solvent is
used, the viscosity of the reacting mass increases with conversion, and the removal of
polymerization heat becomes a problem when the conversion of monomers
exceeds ≤ 60–70%. The mass polymerization is performed in a jacketed reactor
equipped with a reflux condenser at a temperature ranging from 110oC to 210oC. In a
continuous process, 50–65% conversion obtained in a single reactor is further
increased to 65–90% in the second reactor, which is typically a horizontal linear flow
reactor. To handle the highly viscous reaction mass, the reaction temperature in the
linear flow reactor is increased along the direction of flow. Mass polymerization can
be initiated either thermally or chemically by organic initiators. The polymer product
is fed to a film evaporator, where unreacted monomers are recovered.
Arsac et al. studied [38] the mass free radical polymerization of SAN by thermal
initiation and studied the rheological characteristics of SAN copolymers in
compositions for different monomer feed ratios. Radical initiated polymerization of
styrene with acrylonitrile was performed in the presence of 2,2'-
azobisisobutyronitrile (2%) at 70°C with agitation. The polymeric products were
purified after dissolving, precipitated in chloroform/methanol (volume ratio 1:8), and
dried in vacuum at 80°C.

27
Beside free radical polymerization, mass polymerization can be applied via atom
transfer radical polymerization. Al-Harthi et al. studied [39] atom transfer radical
polymerization of styrene and acrylonitrile via mass polymerization with
monofunctional and bifunctional initiators. A bifunctional initiator (benzal bromide)
was used to initiate the bulk atom transfer radical polymerization of styrene and
acrylonitrile at 90oC with CuBr/2,2-bipyridyl. Bulk atom transfer radical
polymerization of styrene and acrylonitrile with a bifunctional (benzal bromide) and
monofunctional initiator (1-bromoethyl benzene) was successfully conducted in this
investigation.
2.4 Polymer-Clay Nanocomposites
Within the fascinating world of nanomaterials in general, polymer–clay
nanocomposites carry on their weight in terms of intrigue and applicability [40].
Consider all the factors that must be involved in the dramatic modification and
improvement of a polymer’s behavior upon the addition of just a few weight percent
(wt%) of a nano-size inorganic sheet compound. Tensile modulus and strength can
be doubled and the heat distortion temperature dramatically increased (by 100°C),
without any sacrifice in impact resistance, upon the addition of just 2% by volume of
this compound to nylon, for example. These inorganic, layered silicate species are
clays. It is so-called smectite clays that are exploited in polymer–clay nanocomposite
(PCN) synthesis. Smectites are a class of layered clays that are swellable in water
and contain a significant cation exchange capacity at about 80 meq/100 g (this means
that there are 80 meq of exchangeable cation per 100 g of clay). The fundamental
inorganic unit is comprised of two tetrahedral silicate layers that sandwich a central
metal octahedral layer (Figure 2.3 ).

28
Idealized formulas for montmorillonite, the aluminum-based version, and hectorite,
the magnesium-based version, are Ex0.66[Si8Al3.34Mg0.66O20(OH)4]·H2O and
Ex0.66[Si8Mg5.34Li0.66O20(OH,F)4]·H2O, respectively. Notice the isomorphous
substitution of these clays, primarily within the octahedral layer, which gives rise to a
net negative charge on the basal oxygen surfaces. This is compensated for by the
presence of hydrated exchangeable cations in the interlayer or gallery regions, which
in nature are usually alkali or alkaline earth cations. These cations are easily
exchanged by larger species such as long-chain alkylammonium ions. The distance
from one basal surface to the next in registry is called the basal spacing and is
measured as the lowest angle peak in x-ray powder diffraction spectra. Natural clays
have basal spacings in the range of 1,2 to 2,0 nm, depending on the type of cation
and the amount of water present. This ability to swell is one of the most important
characteristics of a smectite clay. They can, in fact, swell so greatly in some
situations, such as in the presence of large concentrations of macromolecules, that
the sheets can lose interaction with each other, the registry is lost, no basal spacing is
observed, and the system is said to be exfoliated.
Other clays have been exploited in PCN research as well, including saponite,
beidellite, and a synthetic swelling fluorine–mica. All are smectites, with differences
primarily in elemental composition, cation exchange capacity, abundance, aspect
Figure 2.3 : Schematic representation of a montmorillonite smectite clay stucture
29
ratio, and particle size. The interactions of smectite clays with polymeric molecules
both in nature and for industrial applications have been exploited for quite some
time, although the development of polymeric nanocomposites has occurred fairly
recently.
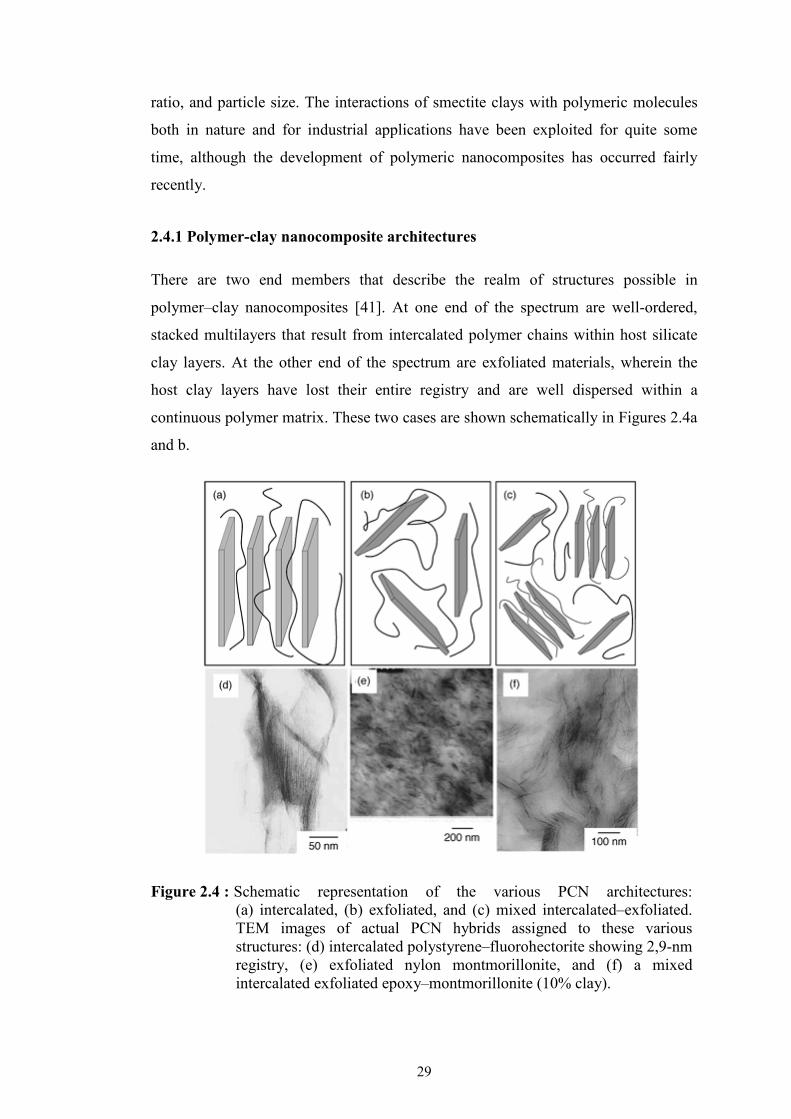
2.4.1 Polymer-clay nanocomposite architectures
There are two end members that describe the realm of structures possible in
polymer–clay nanocomposites [41]. At one end of the spectrum are well-ordered,
stacked multilayers that result from intercalated polymer chains within host silicate
clay layers. At the other end of the spectrum are exfoliated materials, wherein the
host clay layers have lost their entire registry and are well dispersed within a
continuous polymer matrix. These two cases are shown schematically in Figures 2.4a
and b.
Figure 2.4 : Schematic representation of the various PCN architectures: (a) intercalated, (b) exfoliated, and (c) mixed intercalated–exfoliated. TEM images of actual PCN hybrids assigned to these various structures: (d) intercalated polystyrene–fluorohectorite showing 2,9-nm registry, (e) exfoliated nylon montmorillonite, and (f) a mixed intercalated exfoliated epoxy–montmorillonite (10% clay).

30
Exfoliated (also called delaminated) polymer–clay nanocomposites display
acceptable stiffness, strength, and barrier properties with far lower ceramic content
than is achieved for more conventional particulate-filled (e.g., glass fibers) polymer
composites. Generally, the larger the degree of exfoliation in polymer–clay
nanocomposites, the greater the enhancement of these properties. Figure 2.4c
provides an idealized view of a mixed intercalated–exfoliated structure. All three of
these morphologies have been observed, and representative transmission electron
microscopy (TEM) images of each are provided in Figures 2.4d, e and f as well.
Often, there are occasions where retention of the layered nature of a polymer-clay
nanocomposite is the desired outcome. Such regular nanoassemblies have the
following unique characteristics and applications:
• There are a wide variety of both host materials (clay and nonclay) and
polymers.
• Anisotropic arrangements of polymers in two-dimensional
microenvironments occur.
• The variable gallery spacing is adaptable to polymer size.
• Microenvironments can induce spatial chemistry and host surface chemistry
effects.
• Rigid host layers provide enhancements to structural, chemical, and thermal
stabilities to more fragile guest polymers.
Two primary methods are utilized to prepare intercalated polymer–clay materials.
These are shown schematically in Figure 2.5 as direct intercalation and as in situ
polymerization of preintercalated monomers.

31
Another way to intercalate polymers directly is through a melt method, where the
polymers are heated with a preexfoliated (in most cases) clay. In this way, a
conventional polymer extrusion process can often be utilized. The formation of
PCNs via melt intercalation depends on the thermodynamic interaction between
polymer chains and host layers, and also on the diffusion of polymer chains from
bulk to interlayers.
The most successful process for making exfoliated PCNs has been through the
polymerization of monomers that are in the presence of clay minerals. Conditions
must be optimized to promote a polymerization that causes the uniform dispersion of
silicate layers within the polymer matrix. The heat of reaction evolved (enthalpy)
during polymerization provides an essential component to the exfoliation. Therefore,
exfoliation is enhanced with increasing amounts of intercalated monomers and with
decreasing layer charge on the clay surface.
Mixed intercalated–exfoliated systems in many cases contain units of just a few
intercalated clay layers, rather than an entire extended registry, that are themselves
Figure 2.5 : Methods for creating intercalated polymer–clay architectures via direct polymer contact (usually in solution) and via in situ polymerization of preintercalated monomers.
32
randomly oriented within the polymeric matrix. In most of these cases, conditions
can be varied to foster full exfoliation.
2.4.2 Poly(styrene-co-acrylonitrile)–montmorillonite (SAN-Mt) composites
Interest in hybridizing clays into polymers at the nanoscale level is intense due to the
pronounced improvements in properties at surprisingly low clay contents [42].
Examples of improvement are the increases in mechanical strength, modulus,
thermal stability, gas barrier properties, fire-retardant properties, corrosion
resistance, ionic conductivity and decreased absorption in organic liquids. The low
dielectric constant of polymers leads to applications as electronic insulating
materials. However, the dielectric response of polymer–clay nanocomposites are
seldom studied.
Various nanocomposites have been synthesized by different methods in the
development of reinforcement materials. Dispersion of smectite clays and other
layered inorganic materials that can be broken down into nanoscale building blocks
within the polymer matrix has been recognized as an excellent method for the
preparation of organic–inorganic nanocomposites. Layered smectite-type
montmorillonite (Mt), a hydrous alumina silicate mineral whose lamellae are
constructed from octahedral alumina sheets sandwiched between two tetrahedral
silicate sheets, exhibits a net negative charge on the lamellar surface, which adsorbs
cations such as K+, Na+, Ca+2 and Mg+2. Compatibility with various polymers is
accomplished by modifying the silicates with alkylammonium cations via a cation
exchange reaction or with a silane-coupling agent via a grafting process. When Na+
in the clay is exchanged with the intercalating agent, the clay possesses an excellent
swelling rate in water, and its interlayer spacing becomes large enough for monomer
penetration.
Exfoliated, intercalated or mixed intercalated-exfoliated SAN-Mt nanocomposites
were synthesized by melt process or in situ process. Properties and morphology of
SAN nanocomposites were investigated by Stretz et al [43]. They synthesized SAN
nanocomposites by melt process. Interactions between SAN and a single organoclay
were probed by varying the SAN copolymer composition. Sample preparation was
accomplished by melt processing on a microcompounder followed by injection
molding. The effect of the acrylonitrile content of SAN on the morphology and

33
properties of nanocomposites formed by melt mixing SAN with a single
montmorillonite organoclay has been examined by several techniques. Digital
analysis of TEM photomicrographs indicate that there may be a slight maximum in
particle aspect ratio for composites with about 38 wt% acrylonitrile, and that the PS-
based composite demonstrates significantly higher particle thicknesses and lower
specific particle densities, indicating a poorly exfoliated system compared to the
other SAN-based composites. Modulus enhancement, measured as the slope of the
normalized modulus versus Mt content, was shown to increase with increasing
acrylonitrile content. Increased acrylonitrile content in the copolymer led to
measurable increases in melt viscosity and, therefore, increased the shear stress on
the particles during mixing.
Beside the mechanical properties, thermal properties of SAN nanocomposites were
investigated. Jang et al. [44] studied the effect of clay on the thermal stability of SAN
copolymer. The mass ratio of styrene/acrylonitrile in SAN sample was 75/25 and the
butadiene rubber content in ABS is 17 wt%. SAN and ABS polymers were melt-
blended with montmorillonite type clay. Thermal behaviour of nanocomposites
according to the TGA results demonstrated that as the rubber content in SAN
increases, the thermal stability increased, and the incorporation of clay in SAN or
ABS further increased the thermal stability.
Dispersion of the montmorillonite clay on the molecular scale in polymer matrices,
thus producing nanocomposites, renders possible polymers with superior mechanical
properties and thermal stability [45]. The interaction of the montmorillonite clay with
polymers might give exfoliated, intercalated or immiscible polymer hybrid systems.
Several techniques have been suggested to obtain such high performance polymers
beside melt process. In situ intercalative polymerization proved to be a successful
way also to obtain nanocomposites in which the montmorillonite clay was
organophilized with some organic surfactant to impart miscibility. Khalil et al.
[45]studied the bulk copolymerization of styrene–acrylonitrile monomers using
styrene-N+–montmorillonite complex as a comonomer in the polymerization. Using
styrene-N+–montmorillonite complex as a comonomer in the copolymerization of
styrene–acrylonitrile is an effective method of achieving compatibility between
montmorillonite clay and polymers and hence a strong bonding between the mineral
and polymer matrix. FTIR analysis revealed the existence of the montmorillonite-

34
clay complex in the extracted polymer by the presence of the Si–O stretching
vibration as a sharp peak at 1075 cm−1 but no peaks were observed by XRD in the
extracted polymer sample. This might be due to the presence of a very small amount
of exfoliated clay layers that are strongly miscible and adhere to the polymer sample.
In situ process may be applied by various polymerization methods. SAN-Mt
nanocomposites prepared by emulsion and solution polymerization were compared
by Noh et al [46]. Nonextractable styrene–acrylonitrile copolymer–montmorillonite
(SAN–Mt) nanocomposites were prepared by two different intercalation process: (1)
a usual one-step emulsion copolymerization in the presence of the Na+–Mt; and (2) a
solution copolymerization with Mt modified by dimethyl dihydrogenated tallow
ammonium. The copolymerization conditions were set up to be the same. Many
physicochemical properties, such as polymer loading into the interlayer of Mt,
molecular masses of intercalated polymer, gallery expansion, thermal stability,
mechanical properties, and dispersibility of Mt in the polymer matrix of the emulsion
product are found experimentally to far exceed those of products derived from the
solution polymerization. This indicates that the use of emulsion polymerization is
proven to be of great importance in preparing substantial polymer-clay hybrid
nanocomposite.

35
3. EXPERIMENTAL PART
3.1 Materials
Clay : The clay sample had the chemical composition (wt.%):
SiO2 70,30; Al2O3 15,00; Fe2O3 1,10; CaO 1,60; MgO
2,30; Na2O 1,45; K2O 1,20; TiO2 0,30, ignition loss 6,45.
Na-Montmorrilonite (CEC value: 135 meq) from Ordu,
Ünye region purified, dried and modified with NaCl [47].
Sugar Beet Molasses
: Kastamonu Sugar Factory
Ceric Ammonium Nitrate
: (Merck) Dried in drying oven
(w/w) 65% HNO3 Solution
: (Merck) Used in stock solutions
Styrene : (Fluka) Kept in a fridge at -10oC before use.
Acrylonitrile : (Merck) Kept in a fridge at -10oC before use.
Acetone : (Commercial) Used for precipitation of polymers and
nanocomposites.
DMF : (Merck) Used as solvent in rheology analysis
3.1.1 Preparation of stock solutions
Stock solutions containing (NH4)2Ce(NO3)6 and HNO3 were prepared with the same
method. Desired amount of (NH4)2Ce(NO3)6 and 65% HNO3 (w/w) solution were
diluted to 100 ml with distilled water. Amounts of (NH4)2Ce(NO3)6 and 65% HNO3
(w/w) solution used in stock solutions are given in Table 3.1.

36
Stock solution (NH4)2Ce(NO3)6 (g) (w/w) 65% HNO3 (ml)
0,1 N (NH4)2Ce(NO3)6 ; 0,1 N (w/w) 65% HNO3
5,48
0,7
0,1 N (NH4)2Ce(NO3)6 ; 0,2 N (w/w) 65% HNO3
5,48
1,4
0,1 N (NH4)2Ce(NO3)6 ; 0,33 N (w/w) 65% HNO3
5,48
2,3
0,1 N (NH4)2Ce(NO3)6 ; 0,5 N (w/w) 65% HNO3
5,48
3,4
0,1 N (NH4)2Ce(NO3)6 ; 1 N (w/w) 65% HNO3
5,48
6,9
0,33 N (NH4)2Ce(NO3)6 ; 0,2 N (w/w) 65% HNO3
18,09
1,4
0,33 N (NH4)2Ce(NO3)6 ; 0,5 N (w/w) 65% HNO3
18,09 3,4
3.2 Instruments
Mechanical stirrer : Heildolph RZR1 TypeAC 220V, 50Hz.
Magnetic stirrer : AGE 10.0164, VELP Scientifica srl.
Vacuum : Shel-Lab vacuum drying oven was used for vacuum drying
Freeze Drier : Alpha 1-4 LD plus freeze drier was used to dry sugar beet
molasses
FT-IR : Infrared spectra were recorded on disks of %1 w/w
samples/KBr mixtures by Perkin Elmer spectrum one.
1H-NMR : 1H-NMR spectra were recorded with Bruker 250 MHz
NMR Spectrometer and performed in DMSO-d6 medium.
XRD
: X-ray diffraction measurements were performed on Pan Analytical X-pert Pro model X-ray diffractometer at room temperature using Ni-filtered Cu-Kα radiation between 2θ=2o-10o.
Viscometer : The flow behavior of dispersions was determined with
Brookfield CAP 2000+ Viscometer. CAP Spindle: CAP-S-01
Table 3.1: Amounts of (NH4)2Ce(NO3)6 and (w/w) 65% HNO3 solution used in stock solutions

37
DSC : DSC analysis were performed with TA Instruments Q10
and TA Instruments Q1000
TGA : TGA analysis were performed with TA Instruments Q50
DMA : DMA analysis were performed with TA Instruments
Dynamic Mechanical Analyzer (DMA) Q800
3.3 Synthesis of Monosaccharide-Mediated Poly(styrene-co-acrylonitrile)
(MSAN)
Synthesis of MSAN has been performed with different conditions to obtain
maximum yield. Optimum conditions which lead to 82% yield are given below.
A 250 ml round-bottomed three necked flask was equipped with a magnetic stirrer, a
reflux condenser and a thermometer. The system was plunged into oil bath of which
temperature had been formerly set to 50oC. The temperature of the system has been
monitored by the thermometer. 2 g of molasses and 125 ml of distilled water were
added to the flask and stirred with magnetic stirrer for 15 min. 17,5 ml of
acrylonitrile and 6,5 ml of styrene were added to the reaction mixture and stirred for
15 min. 25 ml of 0,33N (NH4)2Ce(NO3)6/0,2 N HNO3 stock solution was dropped
into the flask with dropping funnel during 20 min. Reaction has continued for 1h.
The product was filtered, washed with acetone and dried in vacuum.
3.4 Synthesis of Monosaccharide-Mediated Poly(styrene-co-acrylonitrile)-NaMt
Nanocomposites (MSAN/NaMt)
(MSAN/NaMt) synthesis was performed by adding different amounts of clay to the
reaction conditions explained in part 3.3.
0,11 g (%0,5), 0,22 g (%1), 0,33 g (1%) and 0,44 g (2%) of clay were placed to the
250 ml round-bottomed three necked flask. 2 g of molasses and 125 ml of distilled
was added. Reaction mixture has been stirred with mechanical stirrer for 24 h at
50oC. Then, 17,5 ml of acrylonitrile and 6,5 ml of styrene were added to the mixture
and stirred for 15 min. 25 ml of 0,33N (NH4)2Ce(NO3)6/0,2 N HNO3 stock solution
was dropped with dropping funnel during 20 min. Reaction has continued for 1 h.
The product was filtered, washed with acetone and dried in vacuum.

38
39
4. RESULTS AND DISCUSSION
The results obtained from this work will be investigated in three sections:
• Preparation of monosaccharide-mediated poly(styrene-co-acrylonitrile)
copolymers (MSAN) by redox polymerization and their characterizations.
• Preparation of monosaccharide-mediated poly(styrene-co-acrylonitrile)-NaMt
nanocomposites (MSAN/NaMt) by in situ polymerization and characterizations
of nanocomposites obtained.
• Comparison of copolymers and composites obtained in terms of their rheologic,
morphologic, thermal, mechanic and water absorption properties.
4.1 Synthesis and Characterization of MSAN
Styrene and acrylonitrile were expected to react in the presence of molasses to form
MSAN copolymer.
Molasses is known to be formed of 46-48% sugars such as glucose, fructose,
raffinose and unseperated sucrose etc [8]. It was used in the reactions as a source of
monosaccharides and at the same time, utilization of molasses was aimed. Reaction
is thought to proceed on radical polymerization in aqueous system using ceric
ion/nitric acid redox initiator. Mechanism of ceric ion reaction is known to be based
on formation of a chelate complex and it decomposes to generate free radical sites
[48, 49].
Monosaccharides are the molecules which include alcohol groups. Free radicals are
produced via oxidation of monosaccharides by Ce(IV). Monosaccharide molecule
and Ce(IV) produce a complex and decompose to generate free radical [50]. The
reaction mechanism which best explains the products and kinetics of glucose
oxidation by Ce(IV) is depicted below (4.1).
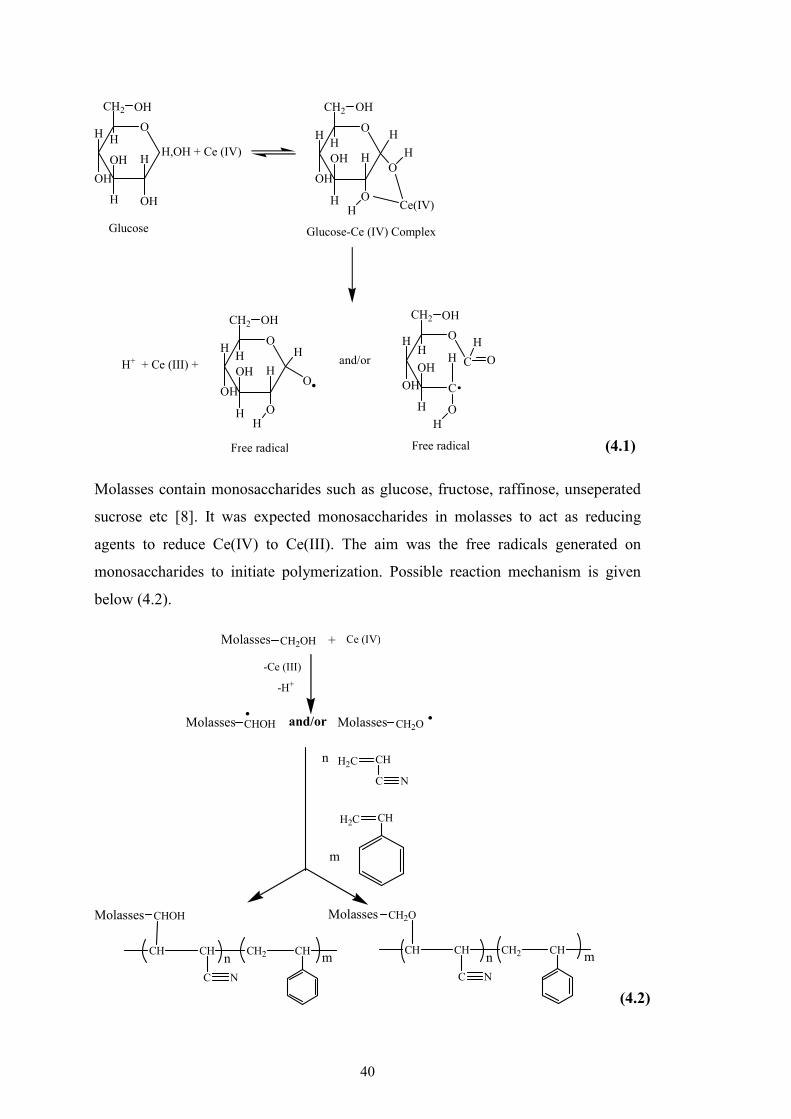
40
O
CH2 OH
H
OH
OH
H
H
OH
H,OH + Ce (IV)
O
CH2 OH
H
OH
OH
H
H
O
H
OH
H Ce(IV)
C
C
O
CH2 OH
H
OH
OH
H
H
O
H
O
H
Free radical
Glucose Glucose-Ce (IV) Complex
O
CH2 OH
H
OH
OH
H
H
O
H
O
H
and/or
Free radical
H H
H H+ Ce (III) +H+
(4.1)
Molasses contain monosaccharides such as glucose, fructose, raffinose, unseperated
sucrose etc [8]. It was expected monosaccharides in molasses to act as reducing
agents to reduce Ce(IV) to Ce(III). The aim was the free radicals generated on
monosaccharides to initiate polymerization. Possible reaction mechanism is given
below (4.2).
Molasses CH2OH + Ce (IV)
CHOH CH2Oand/or
-Ce (III)
-H+
....
Molasses Molasses
CHOH
CH
Molasses
CH CH2 CH
C N
n m
CH2O
CH
Molasses
CH CH2 CH
C N
n m
C
CHH2C
N
n
H2C CH
m
(4.2)

41
Reactions were performed at 50oC during 1h. It was seen that dropping time of
Ce(IV)/HNO3 solution does not have an appreciable effect on yield while
concentrations of monomers, molasses, Ce(IV) and HNO3 were effective on the yield
of product. So that, reaction conditions of experiments were changed in terms of
these parameters (Table 4.1).
Reaction conditions were changed in the parameters of molasses, acrylonitrile,
styrene, Ce(IV) concentration and HNO3 concentration. The path followed to obtain
maximum yield and desired products, and the results were discussed according to the
parameters below.
Molasses concentration
In the experiments of MSAN54-56-57, molasses concentration were kept at 4 g/L,
4g/L, 3g/L respectively. However, the yield of these experiments were low. So that,
in other experiments, concentration of molasses were increased. In the experiments
of MSAN68 and MSAN69, all of the conditions were kept the same except molasses
concentration. These experiments indicates the optimum concentration as 12 g/L.
Ce(IV) concentration
In the experiments, Ce(IV) solutions in different concentrations were used.
Concentration of Ce(IV) in reaction solution was an effective parameter on the yield.
Reaction conditions of MSAN68 and MSAN71 were the same except Ce(IV)
concentration. When they were compared, optimum Ce(IV) concentration was
decided to be 48,53 mmol/L Ce(IV) solution
HNO3 concentration
HNO3 concentration was changed in the experiment while the other conditions were
fixed. Experiments of MSAN60-63-64 have the same conditions except HNO3
concentration. Likewise, MSAN59 have the same conditions with MSAN65 and
MSAN67 except HNO3 concentration. HNO3 concentration was changed as 55
mmol/L, 166,7 mmol/L and 16,7 mmol/L in MSAN60-63-64. Comparison of
MSAN60-63-64 shows the maximum yield (17%) obtained by using 55mmol/L
HNO3. However, in the experiments of MSAN59-65-67, HNO3 concentrations were
changed as 56,9 mmol/L, 86,2 mmol/L and 34,5 mmol/L respectively. Comparison
of them shows that highest value of yield (21%) gets stable at about 56,9-34,5
mmol/L HNO3. So, concentration of HNO3 was prefered as 34,5 mmol/L.

42
Table 4.1: Reaction conditions of synthesis of MSAN during 1 h at 50oC
Experiment Molasses Acrylonitrile Styrene Ce(IV) HNO3 Yield
(g/ L) ml (mole/L) ml (mole/L) mmole/L N (mmol/L) %
MSAN54 4 5 (0,33) 5 (0,31) 14,04 0,5 (21,3) 22
MSAN56 4 5 (0,41) 5 (0,38) 17,07 0,5 (25,9) 0
MSAN57 3 10 (0,64) 5 (0,30) 13,56 0,5 (20,6) 8
MSAN59 14 15 (0,97) 5 (0,30) 17,24 0,33 (56,9) 21
MSAN60 13 15 (0,94) 10 (0,58) 16,67 0,33 (55) 17
MSAN63 13 15 (0,94) 10 (0,58) 16,67 1 (166,7) 0
MSAN64 13 15 (0,94) 10 (0,58) 16,67 0,1 (16,7) 11
MSAN65 14 15 (0,97) 5 (0,30) 17,24 0,5 (86,2) 5
MSAN66 12 10 (0,57) 5 (0,25) 15,15 0,2 (30,3) 24
MSAN67 14 15 (0,97) 5 (0,30) 17,24 0,2 (34,5) 21
MSAN68 12 15 (0,83) 5 (0,26) 14,71 0,2 (29,4) 25
MSAN69 24 15 (0,83) 5 (0,26) 14,71 0,2 (29,4) 16
MSAN71 12 15 (0,83) 5 (0,26) 48,53 0,2 (29,4) 46
MSAN74 12 7,5 (0,41) 15 (0,75) 47,8 0,2 (29) 32
MSAN78 12 17,5 (0,95) 6,5 (0,33) 47,4 0,2 (28,7) 82

43
Monomers
In the experiments, monomer amounts were changed to obtain maximum yield and to
obtain the product in various monomer ratios in polymer chain. In experiments of
MSAN59 and MSAN60, reaction conditions were almost the same except styrene
concentration. In these experiments, it can be seen that yield has decreased when
styrene concentration has been increased from 5 ml (0,3 mol/L)) to 10 ml (0,58
mol/L)) while acrylonitrile concentration was 15 ml (~0,97 mol/L). In the same way,
experiments of MSAN66 and MSAN68 have almost the same reaction conditions
except acrylonitrile concentration. In these reaction conditions, increasing
acrylonitrile concentration from 10 ml (0,57 mol/L) to 15 ml (0,83 mol/L) caused the
yield to increase from 24% to 25%. Considering these four reactions, MSAN71-74-
78 experiments were performed by changing monomer concentrations. Experiments
of MSAN71-74-78 have the same reaction conditions except monomer
concentration. In experiments of MSAN71 and MSAN78 monomer concentrations
were different but monomer ratios (w/w) were ~70% acrylonitrile and ~30% styrene.
In these reaction conditions, MSAN78 had a higher yield than MSAN71 where
monomer amounts were 17,5 ml (0,95 mol/L) of acrylonitrile and 6,5 ml (0,33
mol/L) of styrene. In experiment MSAN74, reaction was performed by using
monomer ratios (w/w) of 30% acrylonitrile and 70% styrene reversely in experiment
MSAN78. Yield of MSAN74 was obtained as a lower value than MSAN78.
Structures of molasses and product of MSAN78 were identified using FT-IR spectra.
In Figure 4.1, FT-IR spectra of molasses and MSAN78 can be seen.

44
Figure 4.1 : FT-IR spectra of molasses and MSAN78
In FT-IR spectrum, absorption bands of molasses were determined as stretching
vibrations of O-H bonds as a wide peak at 3455 cm-1, aliphatic C-H bonds stretching
vibrations at 2925 cm-1, H-O-H deformation at 1618 cm-1 and, aliphatic C-H rocking
vibrations at 1340 cm-1 and 1398 cm-1 (Figure 4.1). The peaks in the region of
approximately 1000-1200 cm-1 (1130 cm-1, 1054 cm-1, 996 cm-1) indicate C-OH and
C-O-C bonds streching vibrations. The IR spectra of monosaccharides in the
1170-980 cm-1 region are sensitive to the axial and equatorial position of the C-OH
groups which can affect quite significantly the main band positions. The
characteristic anomeric region peaks are approximately 834 cm-1 for α-linkage and
898 cm-1 for β-linkage [51]. The peak at 845 cm-1 confirms the α-glycosidic bond
vibrations and 931 cm-1 confirms the β-glycosidic bond vibrations. The characteristic
peaks of molasses are the peaks at 845 cm-1 and 931 cm-1.
In Figure 4.1 MSAN78 can be seen. In the spectrum, streching vibrations of O-H
bonds were determined coming from molasses at 3455 cm-1. The peaks at 3061 cm-1
and 3028 cm-1 confirm stretching vibrations of aromatic C-H bonds belonging to
styrene units in copolymer chain. Aliphatic C-H bond stretching vibrations of

45
copolymer chain are seen at the 2929 cm-1 and 2862 cm-1. The sharp peak at 2241
cm-1 confirm the presence of C≡N bond belonging to the acrylonitrile units in
copolymer chain. Aromatic C=C bond stretching vibration peaks are seen at 1628
cm-1 and 1604 cm-1. The peaks at 1493 cm-1 and 1450 cm-1 are the peaks of aliphatic
C-H bond bending and the peaks at 762 cm-1 and 702 cm-1 are the aromatic C-H
bond rocking peaks. The band at 1708 cm-1 can be associated with carbonyl (C=O)
stretching from a carboxylic acid. The presence of a carboxylic acid is possibly a
result of the nitrile group hydrolysis in acid media [52].
The peaks belonging to aromatic C-H and C≡N streching vibrations confirm the
copolymerization of styrene and acrylonitrile clearly.
Monosaccharides have small amounts in polymer chains. So, it is hard to see the
characteristic peaks of molasses in MSAN78 FT-IR spectrum. For example,
characteristic peaks of molasses at 845 cm-1 and 931 cm-1 may be overlayed with the
peaks of styrene units at 913 cm-1 and 848 cm-1. C-O-C bonds streching vibrations,
belonging to molasses units, strengthens the peaks at 1029 cm-1 and 1069 cm-1. Also,
the peak at 3455 cm-1 which is the –OH streching vibrations confirms that molasses
has reacted with copolymer chain.
Figure 4.2 : FT-IR spectra of MSAN78 and MSAN74

46
The products obtained in experiments MSAN78 and MSAN74 were compared in
Figure 4.2. Reaction conditions of these experiments were the same except monomer
ratios. Monomer ratios in reaction solutions are %30 styrene; %70 acrylonitrile
(w/w) in MSAN78 while it is %70 styrene; %30 acrylonitrile (w/w) in MSAN74. It
is expected that mole fraction of monomers in copolymer chains to be varied due to
the monomer ratios [26]. The product of MSAN74 is expected to have more number
of styrene units than that of MSAN78. If FT-IR spectra of MSAN74 and MSAN78
are observed (Figure 4.2), it can be seen that C≡N stretching vibration peak of
acrylonitrile units of MSAN78 is stronger than that of MSAN74, while aromatic C-H
stretching vibration peaks of both product are nearly in the same strength.
Considering this difference between two spectra, it is predicted that styrene mole
fraction of MSAN74 copolymer chain is higher than that of MSAN78.
Structural identification of copolymers and molasses obtained by FT-IR were
supported with 1H-NMR analysis.
In Figure 4.3 and Figure 4.5, 1H-NMR spectra of molasses and MSAN78 can be seen
respectively.
Figure 4.3 : 1H-NMR spectrum of molasses
1H-NMR spectrum of molasses is depicted in Figure 4.3. Characteristic peaks of
molasses appear in the region between 3 ppm and 6 ppm. Molasses is known to be
containing organic acids such as mainly lactic acid (1,7%), malic, fumaric, valeric,
oxalic acids and the trace amount of glucuronic and galactronic acids where the total
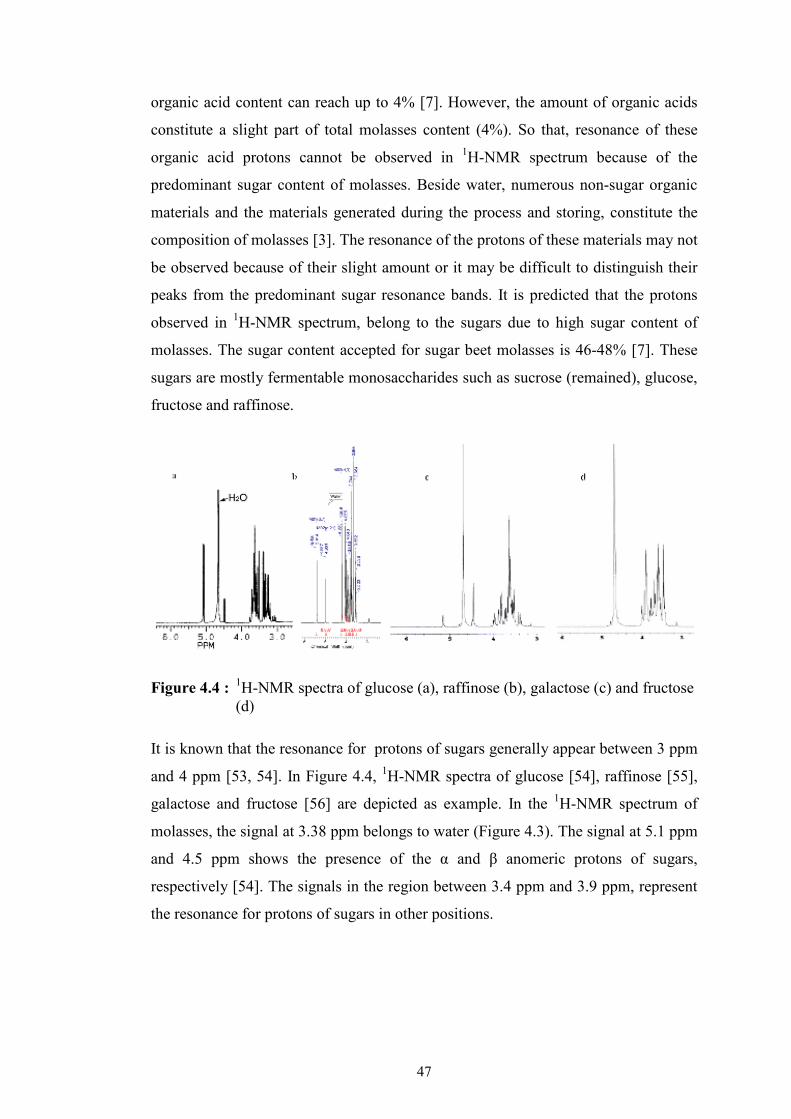
47
organic acid content can reach up to 4% [7]. However, the amount of organic acids
constitute a slight part of total molasses content (4%). So that, resonance of these
organic acid protons cannot be observed in 1H-NMR spectrum because of the
predominant sugar content of molasses. Beside water, numerous non-sugar organic
materials and the materials generated during the process and storing, constitute the
composition of molasses [3]. The resonance of the protons of these materials may not
be observed because of their slight amount or it may be difficult to distinguish their
peaks from the predominant sugar resonance bands. It is predicted that the protons
observed in 1H-NMR spectrum, belong to the sugars due to high sugar content of
molasses. The sugar content accepted for sugar beet molasses is 46-48% [7]. These
sugars are mostly fermentable monosaccharides such as sucrose (remained), glucose,
fructose and raffinose.
Figure 4.4 : 1H-NMR spectra of glucose (a), raffinose (b), galactose (c) and fructose (d)
It is known that the resonance for protons of sugars generally appear between 3 ppm
and 4 ppm [53, 54]. In Figure 4.4, 1H-NMR spectra of glucose [54], raffinose [55],
galactose and fructose [56] are depicted as example. In the 1H-NMR spectrum of
molasses, the signal at 3.38 ppm belongs to water (Figure 4.3). The signal at 5.1 ppm
and 4.5 ppm shows the presence of the α and β anomeric protons of sugars,
respectively [54]. The signals in the region between 3.4 ppm and 3.9 ppm, represent
the resonance for protons of sugars in other positions.
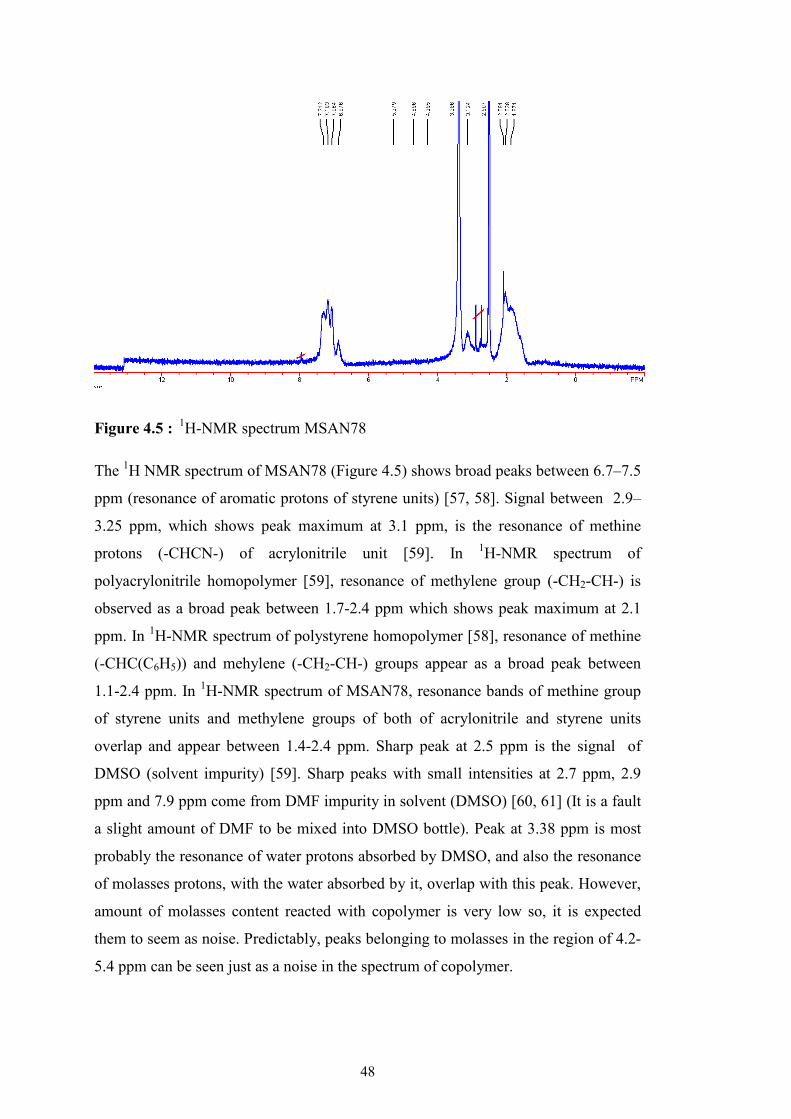
48
Figure 4.5 : 1H-NMR spectrum MSAN78
The 1H NMR spectrum of MSAN78 (Figure 4.5) shows broad peaks between 6.7–7.5
ppm (resonance of aromatic protons of styrene units) [57, 58]. Signal between 2.9–
3.25 ppm, which shows peak maximum at 3.1 ppm, is the resonance of methine
protons (-CHCN-) of acrylonitrile unit [59]. In 1H-NMR spectrum of
polyacrylonitrile homopolymer [59], resonance of methylene group (-CH2-CH-) is
observed as a broad peak between 1.7-2.4 ppm which shows peak maximum at 2.1
ppm. In 1H-NMR spectrum of polystyrene homopolymer [58], resonance of methine
(-CHC(C6H5)) and mehylene (-CH2-CH-) groups appear as a broad peak between
1.1-2.4 ppm. In 1H-NMR spectrum of MSAN78, resonance bands of methine group
of styrene units and methylene groups of both of acrylonitrile and styrene units
overlap and appear between 1.4-2.4 ppm. Sharp peak at 2.5 ppm is the signal of
DMSO (solvent impurity) [59]. Sharp peaks with small intensities at 2.7 ppm, 2.9
ppm and 7.9 ppm come from DMF impurity in solvent (DMSO) [60, 61] (It is a fault
a slight amount of DMF to be mixed into DMSO bottle). Peak at 3.38 ppm is most
probably the resonance of water protons absorbed by DMSO, and also the resonance
of molasses protons, with the water absorbed by it, overlap with this peak. However,
amount of molasses content reacted with copolymer is very low so, it is expected
them to seem as noise. Predictably, peaks belonging to molasses in the region of 4.2-
5.4 ppm can be seen just as a noise in the spectrum of copolymer.
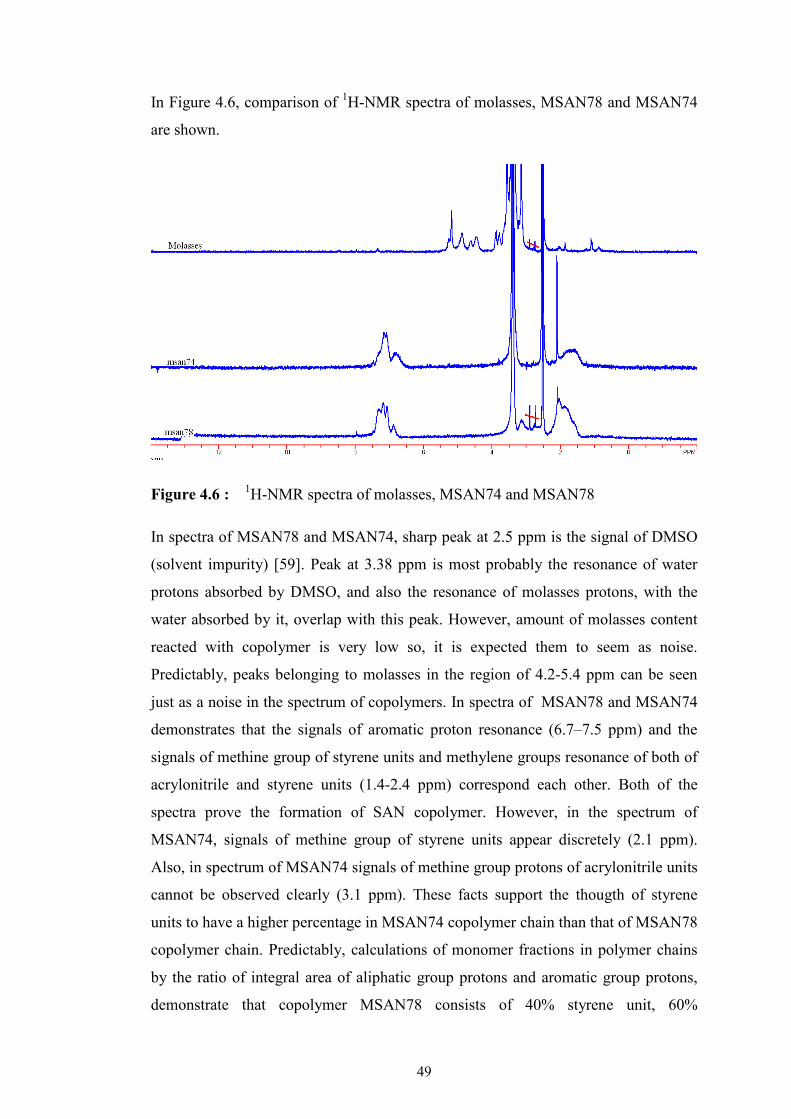
49
In Figure 4.6, comparison of 1H-NMR spectra of molasses, MSAN78 and MSAN74
are shown.
Figure 4.6 : 1H-NMR spectra of molasses, MSAN74 and MSAN78
In spectra of MSAN78 and MSAN74, sharp peak at 2.5 ppm is the signal of DMSO
(solvent impurity) [59]. Peak at 3.38 ppm is most probably the resonance of water
protons absorbed by DMSO, and also the resonance of molasses protons, with the
water absorbed by it, overlap with this peak. However, amount of molasses content
reacted with copolymer is very low so, it is expected them to seem as noise.
Predictably, peaks belonging to molasses in the region of 4.2-5.4 ppm can be seen
just as a noise in the spectrum of copolymers. In spectra of MSAN78 and MSAN74
demonstrates that the signals of aromatic proton resonance (6.7–7.5 ppm) and the
signals of methine group of styrene units and methylene groups resonance of both of
acrylonitrile and styrene units (1.4-2.4 ppm) correspond each other. Both of the
spectra prove the formation of SAN copolymer. However, in the spectrum of
MSAN74, signals of methine group of styrene units appear discretely (2.1 ppm).
Also, in spectrum of MSAN74 signals of methine group protons of acrylonitrile units
cannot be observed clearly (3.1 ppm). These facts support the thougth of styrene
units to have a higher percentage in MSAN74 copolymer chain than that of MSAN78
copolymer chain. Predictably, calculations of monomer fractions in polymer chains
by the ratio of integral area of aliphatic group protons and aromatic group protons,
demonstrate that copolymer MSAN78 consists of 40% styrene unit, 60%
50
acrylonitrile unit while copolymer MSAN74 consists of 55% styrene unit, 45%
acrylonitrile unit When monomer ratios (w/w) and yields of experiments MSAN59-
60-66-68-71-74-78 were compared, it can be seen that yield has been increasing
while monomer ratio of acrylonitrile was converging to 70%. In the same way, yield
decreases while styrene ratio was converging to 30%. In all of the experiment sets,
yields were higher in experiments which had higher acrylonitrile ratio. As a result of
experiments, MSAN78 was constituted as the experiment having optimum reaction
conditions and (MSAN/NaMt) nanocomposites were prepared by performing
reaction conditions of MSAN78.
4.2 Synthesis and Characterization of MSAN/NaMt
MSAN78 was the experiment having optimum reaction conditions. (MSAN/NaMt)
samples were prepared by in situ polymerization performing reaction conditions of
MSAN78. NaMt has been used in the experiments in various amounts as 0,5%, 1%,
1,5% and 2% (Table 4.2). Yield of the product obtained in MSAN78 was 82%.
Yields of nanocomposites decreased to 58% and there was no change in yield while
NaMt amount was increasing. Decrease in yield can be explained by interaction of
copolymer and NaMt. Because of the interaction between molasses and NaMt,
number of active centers on molasses decreases. Decrease in active centers causes a
decrease in number of polymer chains.
Table 4.2: Amount of NaMt in (MSAN/NaMt) samples and yield of products
Experiment NaMt Yield g % (w/w) %
MSAN78 0 0 82 MSAN/NaMt80 0,11 0,5 58 MSAN/NaMt81 0,22 1 58 MSAN/NaMt82 0,33 1,5 58 MSAN/NaMt83 0,44 2 58
Structures and interactions between NaMt and copolymer were identified by FT-IR.
Structure of NaMt was explained and comparison of NaMt, MSAN78 and
MSAN/NaMt80 obtained by using 0,5% NaMt were compared in Figure 4.7.
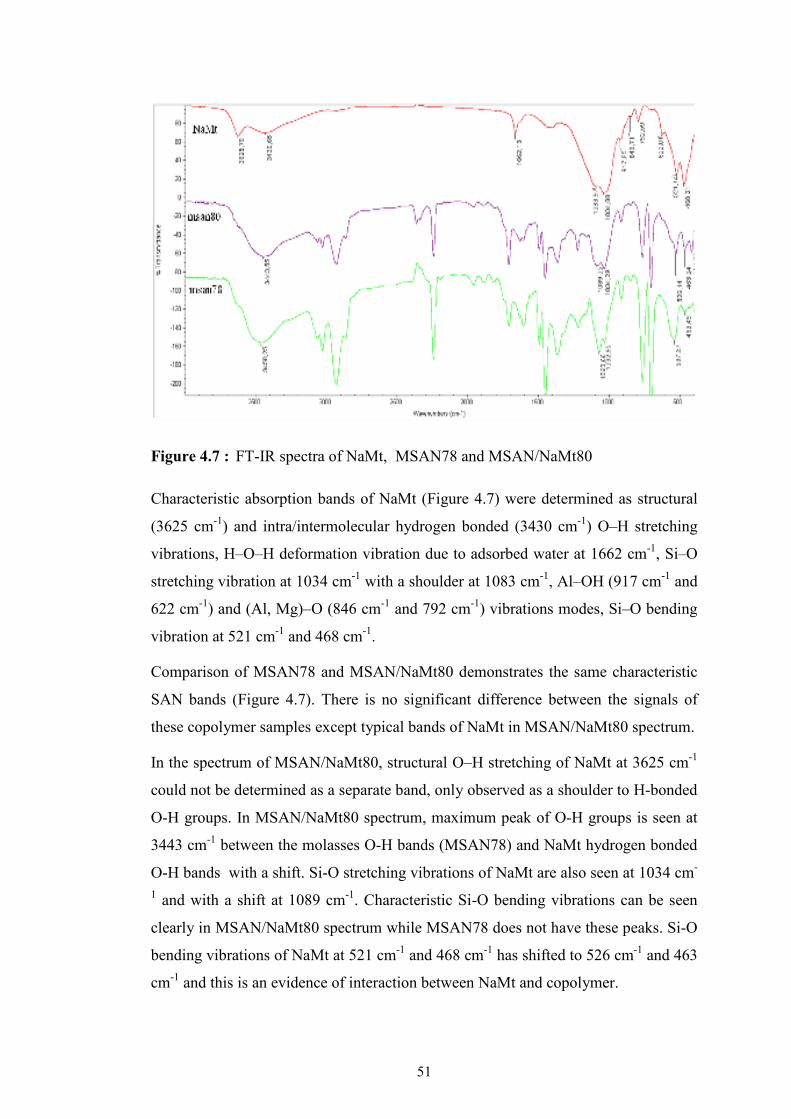
51
Figure 4.7 : FT-IR spectra of NaMt, MSAN78 and MSAN/NaMt80
Characteristic absorption bands of NaMt (Figure 4.7) were determined as structural
(3625 cm-1) and intra/intermolecular hydrogen bonded (3430 cm-1) O–H stretching
vibrations, H–O–H deformation vibration due to adsorbed water at 1662 cm-1, Si–O
stretching vibration at 1034 cm-1 with a shoulder at 1083 cm-1, Al–OH (917 cm-1 and
622 cm-1) and (Al, Mg)–O (846 cm-1 and 792 cm-1) vibrations modes, Si–O bending
vibration at 521 cm-1 and 468 cm-1.
Comparison of MSAN78 and MSAN/NaMt80 demonstrates the same characteristic
SAN bands (Figure 4.7). There is no significant difference between the signals of
these copolymer samples except typical bands of NaMt in MSAN/NaMt80 spectrum.
In the spectrum of MSAN/NaMt80, structural O–H stretching of NaMt at 3625 cm-1
could not be determined as a separate band, only observed as a shoulder to H-bonded
O-H groups. In MSAN/NaMt80 spectrum, maximum peak of O-H groups is seen at
3443 cm-1 between the molasses O-H bands (MSAN78) and NaMt hydrogen bonded
O-H bands with a shift. Si-O stretching vibrations of NaMt are also seen at 1034 cm-
1 and with a shift at 1089 cm-1. Characteristic Si-O bending vibrations can be seen
clearly in MSAN/NaMt80 spectrum while MSAN78 does not have these peaks. Si-O
bending vibrations of NaMt at 521 cm-1 and 468 cm-1 has shifted to 526 cm-1 and 463
cm-1 and this is an evidence of interaction between NaMt and copolymer.

52
Figure 4.8 : FT-IR spectra of NaMt, MSAN78, MSAN/NaMt80, MSAN/NaMt81, MSAN/NaMt82 and MSAN/NaMt83
Comparison of FT-IR spectra of NaMt, MSAN/NaMt samples and MSAN78 can be
seen in Figure 4.8. Structural O-H stretching vibrations of NaMt is determined at
3625 cm-1. In composite samples (MSAN/NaMt80-81-82-83), it can be seen that
both intensity and wavenumber (3622 cm-1) of structural O-H band of NaMt
decreased. This an evidence of interaction with structural O-H groups of NaMt with
copolymer. By the increase in NaMt amount, Si-O stretching vibration bands shifted
to greater wavenumbers ( 1034 cm-1 (NaMt), 1035 cm-1 (MSAN/NaMt80-81), 1038
cm-1 (MSAN/NaMt82), 1042 cm-1 (MSAN/NaMt83) and the strength of the bands
increased. Si-O bending vibration bands of NaMt are at 521 cm-1 and 468 cm-1. Si-O
bending vibration bands at 521 cm-1 have an increase in both wavenumbers and
intensity by addition of NaMt. Band of NaMt at 468 cm-1 has an increase in intensity
by addition of NaMt but the wavenumbers of it shifted to smaller wavenumbers.
In Figure 4.9, 1H-NMR spectra of MSAN78 and MSAN/NaMt80-81-82-83 are
shown. All the signals in the spectra of copolymer and its nanocomposites
correspond each other proving the formation of MSAN copolymer. Structures of
nanocomposites are the same as MSAN78 due to their signals in the same regions.
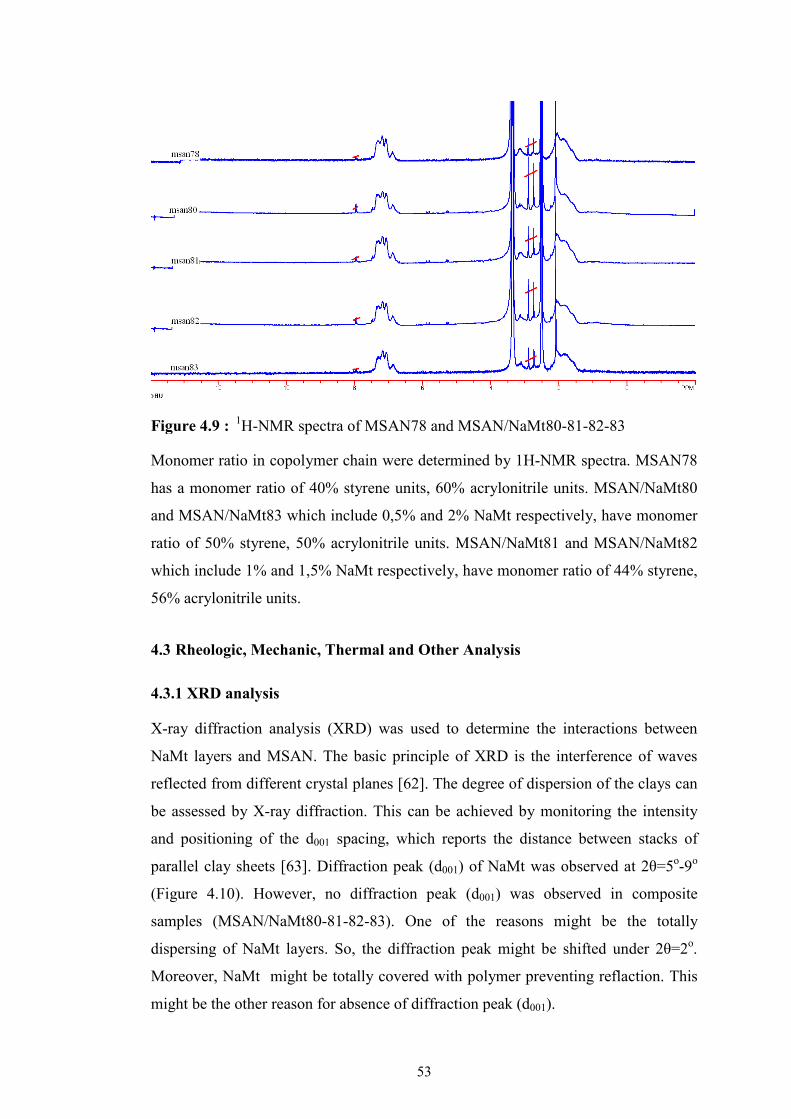
53
Figure 4.9 : 1H-NMR spectra of MSAN78 and MSAN/NaMt80-81-82-83
Monomer ratio in copolymer chain were determined by 1H-NMR spectra. MSAN78
has a monomer ratio of 40% styrene units, 60% acrylonitrile units. MSAN/NaMt80
and MSAN/NaMt83 which include 0,5% and 2% NaMt respectively, have monomer
ratio of 50% styrene, 50% acrylonitrile units. MSAN/NaMt81 and MSAN/NaMt82
which include 1% and 1,5% NaMt respectively, have monomer ratio of 44% styrene,
56% acrylonitrile units.
4.3 Rheologic, Mechanic, Thermal and Other Analysis
4.3.1 XRD analysis
X-ray diffraction analysis (XRD) was used to determine the interactions between
NaMt layers and MSAN. The basic principle of XRD is the interference of waves
reflected from different crystal planes [62]. The degree of dispersion of the clays can
be assessed by X-ray diffraction. This can be achieved by monitoring the intensity
and positioning of the d001 spacing, which reports the distance between stacks of
parallel clay sheets [63]. Diffraction peak (d001) of NaMt was observed at 2θ=5o-9o
(Figure 4.10). However, no diffraction peak (d001) was observed in composite
samples (MSAN/NaMt80-81-82-83). One of the reasons might be the totally
dispersing of NaMt layers. So, the diffraction peak might be shifted under 2θ=2o.
Moreover, NaMt might be totally covered with polymer preventing reflaction. This
might be the other reason for absence of diffraction peak (d001).
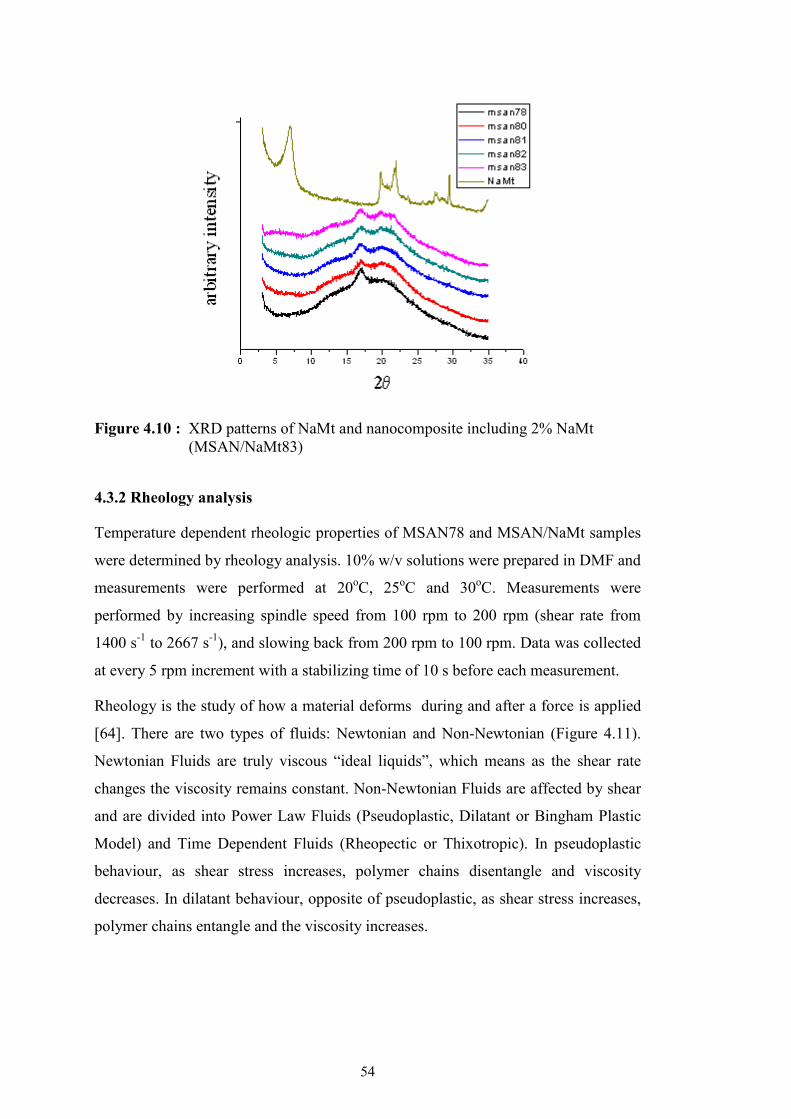
54
Figure 4.10 : XRD patterns of NaMt and nanocomposite including 2% NaMt (MSAN/NaMt83)
4.3.2 Rheology analysis
Temperature dependent rheologic properties of MSAN78 and MSAN/NaMt samples
were determined by rheology analysis. 10% w/v solutions were prepared in DMF and
measurements were performed at 20oC, 25oC and 30oC. Measurements were
performed by increasing spindle speed from 100 rpm to 200 rpm (shear rate from
1400 s-1 to 2667 s-1), and slowing back from 200 rpm to 100 rpm. Data was collected
at every 5 rpm increment with a stabilizing time of 10 s before each measurement.
Rheology is the study of how a material deforms during and after a force is applied
[64]. There are two types of fluids: Newtonian and Non-Newtonian (Figure 4.11).
Newtonian Fluids are truly viscous “ideal liquids”, which means as the shear rate
changes the viscosity remains constant. Non-Newtonian Fluids are affected by shear
and are divided into Power Law Fluids (Pseudoplastic, Dilatant or Bingham Plastic
Model) and Time Dependent Fluids (Rheopectic or Thixotropic). In pseudoplastic
behaviour, as shear stress increases, polymer chains disentangle and viscosity
decreases. In dilatant behaviour, opposite of pseudoplastic, as shear stress increases,
polymer chains entangle and the viscosity increases.

55
Figure 4.11 : Newtonian and Non-Newtonian flow curves
Bingham plastics have constant viscosity like Newtonian Fluids as shear rate changes
but, they have an initial shear stress value different from “0” unlike Newtonian
Fluids. Flow curves were analyzed using the Bingham model, where the Bingham
yield stress τ is given by the relation (4.3)
(4.3)
Here τB is the extrapolated yield value (or critical sheare stress or threshold stress or
initial resistance to flow) and ηpl is the plastic viscosity (or flow index). Once the
curve of shear stress vs. shear rate was obtained for samples under the given
experimental conditions, the value of the extrapolated shear stress was determined
from the intersection of the extrapolated linear portion of the curve with the axis. The
method of least squares was used to determine the values of this intersection. Plastic
viscosity was derived from the slope of this linear section.
In rheopectic behaviour, viscosity increases as a function of time. In thixotropic
behaviour as shear increases, the viscosity decreases.
Flow index is the indicator of flow character. It is determined by calculating slope of
log shear stress- log shear rate plot [65]. If flow index is equal to 1, it is a Newtonian
or Bingham plastic. If flow index is higher or smaller than 1, it is dilatant or
pseudoplastic, respectively. Flow behaviour of MSAN78 and MSAN/NaMt samples
were determined from shear stress versus shear rate plots.
MSAN78 and MSAN/NaMt samples displayed different time-independent
behaviours. MSAN78 displayed Bingham plastic model. Log shear stress- log shear

56
rate plot of MSAN78 at 25oC and 30oC were given in Figure 4.12. Flow index values
of MSAN78 are very close values to 1 at 25oC and 30oC (Table 4.3), So, it displayed
Bingham plastic model at these temperatures.
Figure 4.12 : Log shear stress- log shear rate plot of MSAN78 at 25oC and 30oC.
Table 4.3: Flow index and hysteresis area values of MSAN78- MSAN/NaMt80-81-82-83 at 20oC, 25oC and 30oC
Experiment Flow index (Pa.s) Hysteresis area (Pa.s-1)
20oC 25oC 30oC 20oC 25oC 30oC
MSAN78 0,93 0,98 0,99 7,53 19,05 31,59
MSAN/NaMt80 0,87 0,93 0,92 9,31 13,88 16,51
MSAN/NaMt81 0,76 0,78 0,80 19,17 20,76 22,57
MSAN/NaMt82 0,79 0,84 0,84 13,13 12,31 18,34
MSAN/NaMt83 0,84 0,87 0,88 19,11 28,86 38,21
Yield values (τB) of MSAN78 at 25oC and at 30oC are 63,116 and 18,367,
respectively. A decrease in yield value was observed by the increase of temperature.
Plastic viscosity values (ηpl) at 25oC and at 30oC are 0,6134 and 0,5069,
respectively. A decrease in plastic viscosity value was observed by the increase of
temperature as well. The reason of the decrease in yield value and plastic viscosity
was thougth to be the increase of disentanglement by the increase of temperature.

57
Flow indexes of all of the nanocomposite samples are smaller than 1 (Table 4.3). So,
it is decided them to displayed pseudoplastic behaviour while MSAN78 displayed
Bingham plastic model. In the Figure 4.13, the flow index and NaMt percent were
demonstrated. Flow indexes decreased by increasing amount of NaMt 0 % to 1% .
Then an increase in flow index was observed 1% to 2%. In addition, a slight increase
in flow indexes was observed by the increase of temperature 20oC to 30oC (Table
4.3, Figure 4.13). This results indicated a decrease in gelations with the first addition
of NaMt. After that 1% NaMt addition gradual increased was observed. This may be
caused by the increase in entanglement or flocculation by the increase of NaMt.
Figure 4.13 : Flow index versus NaMt percent plots at 20oC, 25oC and 30oC
The degree of thixotropic or rheopectic behaviour is measurement by the area of the
hysteresis loop [66]. In other words, hysteresis area is the indicator of time-
dependent behaviour. The area between upward and downward curve in shear stress-
shear rate plot is called hysteresis area. Magnitude of hysteresis area is proportional
with the time-dependent behaviour. Hysteresis area of samples were given in Table
4.3. MSAN78 and MSAN/NaMt samples displayed rheopectic behaviour. Shear
stress-shear rate plot of MSAN/NaMt81 were given in Figure 4.14 demonstrating
rheopectic behaviour of it as in all samples.

58
Figure 4.14 : Shear stress-shear rate plots of MSAN/NaMt81 at 20oC, 25oC and 30oC
Hysteresis area values tended to increase by the increase of temperature 20oC to
30oC. This indicates that an increase in rheopectic behaviour of samples were
observed by increase of temperature (Table 4.3). However, increasing amount of
NaMt caused a difference in the rheopectic behaviour (Figure 4.15a). This results
indicated a gradual decrease in gelations with the first addition of NaMt. After that
point increased was observed which reaches a maximum at 1% NaMt. Further
addition of polymer resulted in an increase in the area of the hysteresis loop. This
may be caused by the increase in entanglement by the increase after NaMt 1,5%.
Figure 4.15 : (a) Hysteresis area versus NaMt percent plots at 20oC, 25oC and 30oC. (b) Yield value versus NaMt percent plots at 20oC, 25oC and 30oC
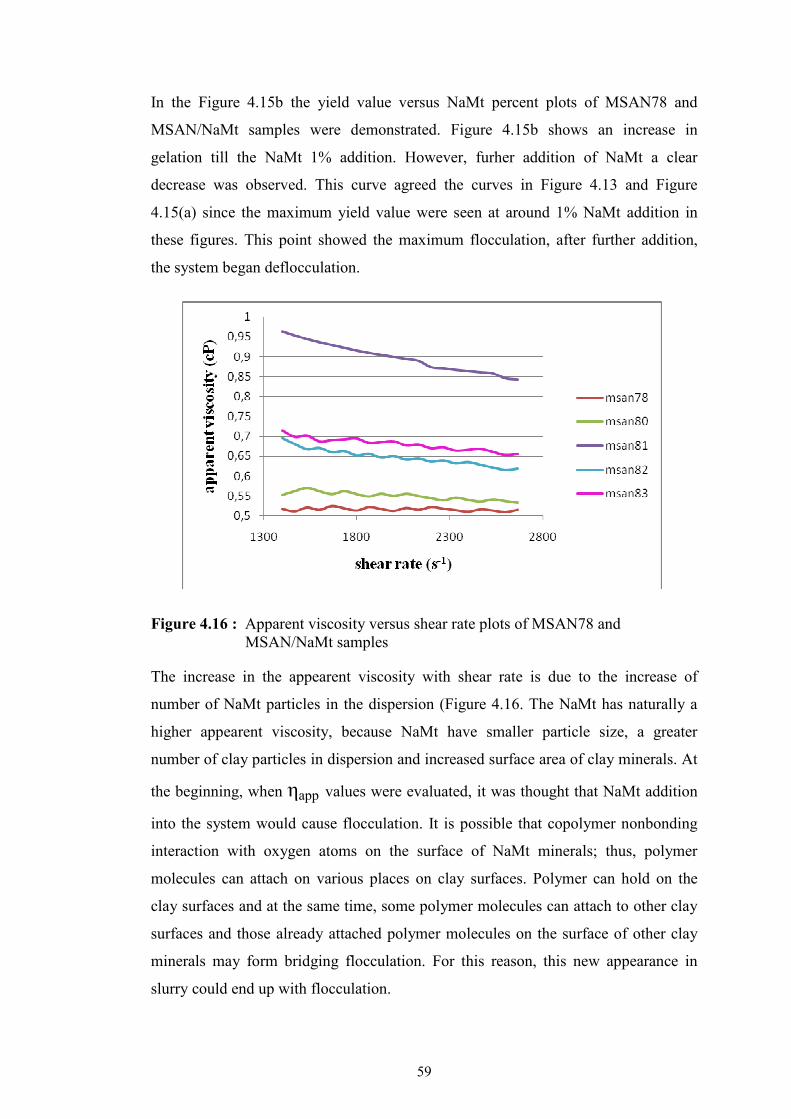
59
In the Figure 4.15b the yield value versus NaMt percent plots of MSAN78 and
MSAN/NaMt samples were demonstrated. Figure 4.15b shows an increase in
gelation till the NaMt 1% addition. However, furher addition of NaMt a clear
decrease was observed. This curve agreed the curves in Figure 4.13 and Figure
4.15(a) since the maximum yield value were seen at around 1% NaMt addition in
these figures. This point showed the maximum flocculation, after further addition,
the system began deflocculation.
Figure 4.16 : Apparent viscosity versus shear rate plots of MSAN78 and MSAN/NaMt samples
The increase in the appearent viscosity with shear rate is due to the increase of
number of NaMt particles in the dispersion (Figure 4.16. The NaMt has naturally a
higher appearent viscosity, because NaMt have smaller particle size, a greater
number of clay particles in dispersion and increased surface area of clay minerals. At
the beginning, when ηapp values were evaluated, it was thought that NaMt addition
into the system would cause flocculation. It is possible that copolymer nonbonding
interaction with oxygen atoms on the surface of NaMt minerals; thus, polymer
molecules can attach on various places on clay surfaces. Polymer can hold on the
clay surfaces and at the same time, some polymer molecules can attach to other clay
surfaces and those already attached polymer molecules on the surface of other clay
minerals may form bridging flocculation. For this reason, this new appearance in
slurry could end up with flocculation.
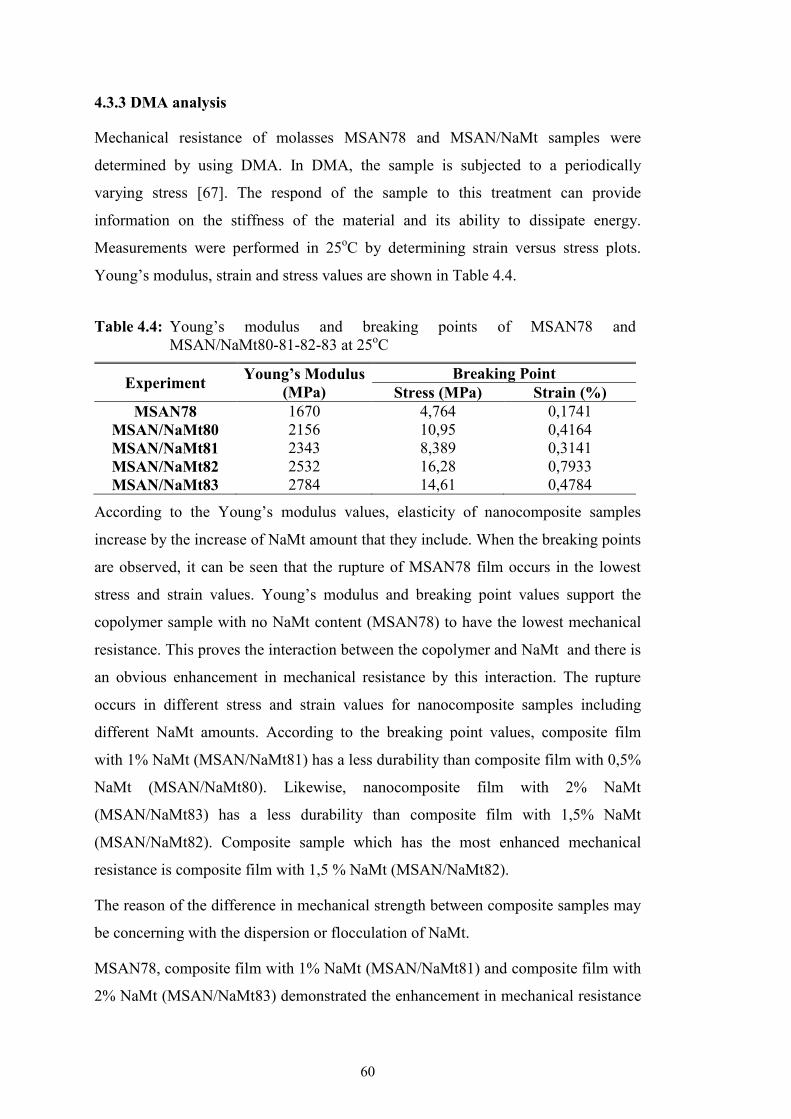
60
4.3.3 DMA analysis
Mechanical resistance of molasses MSAN78 and MSAN/NaMt samples were
determined by using DMA. In DMA, the sample is subjected to a periodically
varying stress [67]. The respond of the sample to this treatment can provide
information on the stiffness of the material and its ability to dissipate energy.
Measurements were performed in 25oC by determining strain versus stress plots.
Young’s modulus, strain and stress values are shown in Table 4.4.
Table 4.4: Young’s modulus and breaking points of MSAN78 and MSAN/NaMt80-81-82-83 at 25oC
Experiment Young’s Modulus
(MPa) Breaking Point
Stress (MPa) Strain (%) MSAN78 1670 4,764 0,1741
MSAN/NaMt80 2156 10,95 0,4164 MSAN/NaMt81 2343 8,389 0,3141 MSAN/NaMt82 2532 16,28 0,7933 MSAN/NaMt83 2784 14,61 0,4784
According to the Young’s modulus values, elasticity of nanocomposite samples
increase by the increase of NaMt amount that they include. When the breaking points
are observed, it can be seen that the rupture of MSAN78 film occurs in the lowest
stress and strain values. Young’s modulus and breaking point values support the
copolymer sample with no NaMt content (MSAN78) to have the lowest mechanical
resistance. This proves the interaction between the copolymer and NaMt and there is
an obvious enhancement in mechanical resistance by this interaction. The rupture
occurs in different stress and strain values for nanocomposite samples including
different NaMt amounts. According to the breaking point values, composite film
with 1% NaMt (MSAN/NaMt81) has a less durability than composite film with 0,5%
NaMt (MSAN/NaMt80). Likewise, nanocomposite film with 2% NaMt
(MSAN/NaMt83) has a less durability than composite film with 1,5% NaMt
(MSAN/NaMt82). Composite sample which has the most enhanced mechanical
resistance is composite film with 1,5 % NaMt (MSAN/NaMt82).
The reason of the difference in mechanical strength between composite samples may
be concerning with the dispersion or flocculation of NaMt.
MSAN78, composite film with 1% NaMt (MSAN/NaMt81) and composite film with
2% NaMt (MSAN/NaMt83) demonstrated the enhancement in mechanical resistance

61
provided with NaMt interaction. Strain versus stress plots of MSAN78 and
composites prepared with 1% (MSAN/NaMt81) and 2% (MSAN/NaMt83) NaMt are
demonstrated in Figure 4.17.
Figure 4.17 : Strain versus stress plots of MSAN78, MSAN/NaMt81 and MSAN/NaMt83 at 25oC
4.3.4 DSC analysis
Some physical properties of molasses, MSAN78 and MSAN/NaMt samples were
determined by DSC. DSC is an analytical technique for detecting the changes in
physical states of matter by measuring the energy necessary to establish a nearly zero
temperature difference between a substance and an inert reference material, as the
two specimens are subjected to identical temperature regimes in an environment
heated or cooled at a controlled rate [68]. It is based on the thought that the thermal
properties of a material are dependent upon changes in its structure and mobility.
Measurements were performed as first heating, cooling and second heating under N2
atmosphere. For MSAN and MSAN/NaMt samples, first heating was applied from -
90oC to 150oC with a ramp rate of 20,0°C/min, then cooled to -90oC and second
heating was applied from -90oC to 400oC. For molasses, first heating was applied
from -90oC to 130oC with a ramp rate of 20,0°C/min, then cooled to -90oC and
second heating was applied from -90oC to 250oC Glass transition temperature (Tg),
melting point (Tm) and decomposition temperatures (Td) of molasses, copolymer
and nanocomposite samples were determined (Table 4.5).

62
Table 4.5: Glass transition, melting and decomposition temperatures of molasses,
MSAN78 and MSAN/NaMt80-81-82-83
Tg1 (oC) Tg2 (
oC) Tm (oC) Td (oC) Molasses -68,55 - 129,39 * MSAN78 -54,81 102,65 194,85 310,37
MSAN/NaMt80 -52,19 101,67 197,51 313,13 MSAN/NaMt81 -54,42 102,87 198,76 312,03 MSAN/NaMt82 -57,47 102,02 199,53 310,76 MSAN/NaMt83 -59,48 99,43 197,43 312,84
*Not heated until decomposition
MSAN78 and nanocomposites of it displayed two glass transitions. First of the Tg
was thought to proceed from molasses content in copolymer. Sopade et al. studied on
glass transition of molasses and determined different types of molasses have Tg
between -75oC to -35oC [69]. So, the endothermic event at -68,55oC was thought to
be the glass transition of molasses. The increase of Tg1 in copolymer and
nanocomposites of it, may be an evidence of reaction between monosaccharides and
copolymer chain. The decrease in Tg1 by the increase of NaMt amount, may also be
the effect of arrengement of NaMt layers. Second glass transition of copolymer and
nanocomposites of it occurs at about 102oC (Table 4.5). Big differences in Tg2 values
were not observed. Ravi et al. determined the melting point of SAN at about 220oC
[70]. So, the endothermic event at about 200oC was thought to be the melting of
copolymer. There is generally an upward trend in melting points (Tm) by the
increase of NaMt amount. This may be the evidence of enhancement in thermal
stability provided by interactions between NaMt and copolymer. SAN is known to
begin to decompose at about 260oC [70]. As seen in the thermograms of MSAN78
and MSAN/NaMt81, (Figure 4.18), exothermic event which have the maximum
temperature at about 310oC is thought as the decomposition of copolymer. It can be
said there is an enhancement in thermal stability by the increase of NaMt amount.

63
Figure 4.18 : DSC thermograms of MSAN78 and NaMt-nanocomposite of it including 1% NaMt (MSAN/NaMt81)
4.3.5 TGA analysis
Thermal decomposition of MSAN78 and MSAN/NaMt samples were determined by
using TGA. TGA is an instrumental method to heat a sample in a small pan by a
programmed temperature change when flushing with an inert gas and at the same
time continuously weighing the pan [71]. Measurements were carried out under N2
atmosphere from 20oC to 600oC with a heating rate of 20oC/min. Signal maximum
temperatures and percentage of residues were given in Table 4.6.
Table 4.6: Residue at 480oC and signal max values of MSAN78 and MSAN/NaMt samples
Experiment Signal max(oC) Residue at 480 oC
(%) MSAN78 427,73 25,10
MSAN/NaMt80 431,52 16,66
MSAN/NaMt81 430,86 17,67
MSAN/NaMt82 427,24 22,23
MSAN/NaMt83 432,94 19,55

64
Figure 4.19 : TGA thermograms of MSAN78 and (MSAN/NaMt80, 81, 82,83)
As evident from the Figure 4.19, copolymer decomposition in the nanocomposites are
found to moved to higher temperature, indicating the enhancement of thermal stability of
composites. This enhancement of thermal stability can be regarded as an additional
evidence of the interactions between copolymer and NaMt. It is also noticeable that the
percentage of the residue lowered in NaMt-nanocomposite samples when compared with
copolymer. Temperatures which 40%, 50% and 60% residues remained were given in
Table 4.7. Temperatures increased in nanocomposites when compared with copolymer
(MSAN78). This indicates that decompositions of composites are higher than that of
copolymer. This is also an evidence of the interactions between copolymer and NaMt.
MSAN/NaMt83 was determined as the most thermally stable nanocomposite sample with
2% NaMt amount. There is a slight decrease in temperatures at the residue percent
remained, in MSAN/NaMt80, MSAN/NaMt81 and MSAN/NaMt82. The reason of this may
be the arrangement of NaMt layers.

65
Table 4.7: Temperatures at 40%, 50% and 60% residue remained in MSAN78 and
nanocomposites of it (MSAN/NaMt80-81-82-83)
Experiment Temp. at 40% residue (oC)
Temp. at 50% residue (oC)
Temp. at 60% residue (oC)
MSAN78 428,17 422,25 415,21 MSAN/NaMt80 432,28 425,50 417,32 MSAN/NaMt81 431,71 424,48 416,38 MSAN/NaMt82 427,39 421,46 414,01 MSAN/NaMt83 434,39 427,03 418,64
4.3.6 Water sorption
Water sorption tests were performed to determine water absorption of MSAN78 and
MSAN/NaMt samples. Water sorption is performed by using discs in particular
dimensions [72]. Water sorption is determined by calculation of ratio of weigth
change and surface area of discs (4.4).
(4.4)
Where; w is weight after immersion in mg, W is conditioned weight in mg and S is
surface area of the disc in cm2.
Discs of MSAN78 and MSAN/NaMt samples were prepared in the dimensions of 40
± 1 mm in diameter x 2 mm. Discs were dried at 130oC and removed to a desiccator
at room temperature for 1h before weighed. All of the discs were weighed. Then,
discs were immersed into distilled water at 37 ± 1oC for 24 h. After 24 h, they were
removed from water, wiped with a clean dry towel removing visible moisture, waved
in the air for 15 s and weighed after 1 min after their removal from the water. After
data was collected, water sorption was calculated. The results were given in Figure
4.20.
As seen in Figure 4.20, water sorption decreased by increasing amount of NaMt.
MSAN78 has the most water sorption. Nanocomposite samples with increasing
amount of NaMt have less water sorption and it stabilized at 1,5% and 2% NaMt
percentage. It is obvious that NaMt provided a good water resistance to MSAN.

66
Figure 4.20 : Water sorption of MSAN78 and nanocomposites of it with increasing NaMt percentage

67
5. CONCLUSION AND RECOMMENDATIONS
Synthesis and characterization of MSAN and MSAN/NaMt samples, can be
summarized as follows;
• MSAN was synthesized by using Ce(IV)/HNO3 redox pair as initiator with
emulsion polymerization.
• Optimum reaction conditions were determined as 12 g/L molasses, 0,95
mole/L acrylonitrile, 0,33 mole/L styrene, 47,4 mmole/L Ce(IV), 28,7
mmole/L HNO3.
• MSAN78 was obtained with optimum reaction conditions with a yield of
82%.
• Monomer ratio of obtained copolymer was 40% styrene units and 60 %
acrylonitrile units in copolymer chain.
• MSAN/NaMt samples were synthesized by in situ polimerization in the
amounts of 0,5%, 1%, 1,5% and 2% NaMt in the same reaction conditions
with MSAN78.
• MSAN/NaMt samples were obtained with a yield of 58%.
• Monomer ratio of obtained copolymer was 50% styrene units and 50 %
acrylonitrile units in copolymer chain for 0,5% and 2% NaMt including
nanocomposites and 44% styrene units and 56% acrylonitrile units for 1%
and 1,5% NaMt including nanocomposites, respectively.
• FT-IR and 1H-NMR analysis demonstrated the synthesis of MSAN and
MSAN/NaMt samples were achieved successfully.
• Thermal analysis (DSC and TGA) demontrated that MSAN/NaMt samples
acquired superior thermal stability than MSAN78.
• DMA analysis demonstrated that mechanical resistance of MSAN/NaMt
samples increased by the increasing amount NaMt.

68
• Water resistance of MSAN/NaMt samples demonstrated an obvious
enhancement by increasing amount of NaMt.
• TEM and SEM analysis should be performed to determine and commentate
the properties of nanocomposites better.

69
REFERENCES
[1] Chanda, M. and Roy, S. K., 2009, Industrial Polymers, in Industrial Polymers, Specialty Polymers, and Their Applications. CRC Press. p. 39.
[2] Garlinghouse, S. E. High energy feeds (grains, liquid supplements,by-products). <http://shady-acres.com/susan/7.html>, accessed at 15.09.2008.
[3] <http://running_on_alcohol.tripod.com/id21.html>, accessed at 03.08.2008. [4] Kochergin, V. and Kearney, M. Chromatographic Seperator Optimization.
1995.<http://www.arifractal.com/assbt%201995%20smb%20optimization.pdf>, accessed at 16.08.2008
[5]<http://www.agmrc.org/commodities__products/grains__oilseeds/sugar_beet_profile.cf>, accessed at 27.10.2008
[6] <http://www.turkseker.gov.tr/KurumIstatistikleri.aspx>, accessed at 12.12.2008. [7] Avcı, A., 2004, Bazı Thermoanaerobacter suşlarının etanol üretim oranlarının
karşılaştırılması, M.Sc. Thesis, Ankara University. [8] <http://www.premiermolasses.ie/standard.htm>, accessed at 03.01.2009. [9] <http://www.premiermolasses.ie/uses.htm>, accessed at 03.01.2009. [10] Jumadurdiyev, A., Ozkul, M. H., Saglam, A. R. and Parlak, N., 2005, The
utilization of beet molasses as a retarding and water-reducing admixture for concrete. Cement and Concrete Research, 35(5): p. 874-882.
[11] Lotfy, W. A., 2007, The utilization of beet molasses as a novel carbon source for cephalosporin C production by Acremonium chrysogenum: Optimization of process parameters through statistical experimental designs. Bioresource Technology. 98(18): p. 3491-3498.
[12] Yang, B. Y. and Montgomery, R., 2007, Alkaline degradation of invert sugar from molasses. Bioresource Technology. 98(16): p. 3084-3089.
[13] Nagarajan, S. and Srinivasan, K. S. V., 1998, Efficiency of ceric ione for oxidation and polymerization - A review. Journal of
Macromolecular Science-Reviews in Macromolecular Chemistry
and Physics. C38(1): p. 54. [14] Nagarajan, S. and Srinivasan, K. S. V., 1998, Efficiency of ceric ione for
oxidation and polymerization - A review. Journal of
Macromolecular Science-Reviews in Macromolecular Chemistry
and Physics. C38(1): p. 54-55. [15] Trahanovsky, W. S. and Young, L. B., 1966, Controlled oxidation of organic
compounds with Cerium(IV). II. The oxidation of toluenes. Journal of Organic Chemistry. 31(6): p. 2033.
[16] Duke, F. R., 1947, Journal of The American Chemical Society. 69: p. 2885. [17] Mino, G. and Kaizerman, S., 1958, A new method for the preparation of graft
copolymers. Polymerization initiated by ceric ion redox systems. Journal of Polymer Science. 31: p. 242.
[18] Yağcı, Y., Reetz, I. and Mishra, M. K., 2009, Chemical Initiation by metals or metal-containing compounds, in Handbook of Vinyl Polymers

70
Radical Polymerization, Process, and Technology, Y. Yağcı and M. K. Mishra, Editors, CRC Press. p. 59-60.
[19] Pramanick, D. and Sarkar, S. K., 1976, Mode of initiation in ceric salt initiated aqueous polymerization of methylmethacrylate. Colloid and Polymer Science. 254(11): p. 989.
[20] Akar, A., Galioglu, O., Gocmen, A. and Sarac, A. S., 1990, Copolymer of Ketonic Resin-Polyacrylonitrile. Journal of Applied Polymer Science. 39(8): p. 1657-1663.
[21] Galioglu, O., Soydan, A. B., Akar, A. and Sarac, A. S., 1994, Block and graft copolymer synthesis via ceric salt. Angewandte Makromolekulare Chemie. 214: p. 19-28.
[22] Öz, N. and Akar, A., 2006, Redox initiation system of ceric salt and dihydroxy poly(dimethylsiloxane)s. Journal of Applied Polymer Science. 102: p. 2112.
[23] Bajpai, U.D.N., 1996, Guar (Graft copolymerization), in Polymeric Materials Encyclopedia, J. C. Solomone, Editor, CRC Press Inc: Florida. p. 188.
[24] Kagaku N. Co. Ltd., Japan, Jpn. Patent 55165909, 1980; CA: 94(22), 17706n, 1994.
[25] Sharma, B. R., Kumar, V. and Soni, P. L., 2002, Ceric ammonium nitrate-initiated graft copolymerization of acrylamide onto Cassia tora gum. Journal of Applied Polymer Science. 86(13): p. 3250-3255.
[26] Choi, K. Y., Kwag, B.G., Park, S.Y. and Cheong, C. H., 2009, Technical Processes for Industrial Production, in Handbook of Vinyl Polymers Radical Polymerization, Process, and Technology, M. K. Mishra and Y. Yagci, Editors, CRC Press. p. 389-390.
[27] Choi, K. Y., Kwag, B.G., Park, S.Y. and Cheong, C. H., 2009, Technical Processes for Industrial Production, in Handbook of Vinyl Polymers Radical Polymerization, Process, and Technology, M. K. Mishra and Y. Yagci, Editors, CRC Press. p. 387-389.
[28] Tripathi, S. and Srivastava, A. K., 2007, Kinetics and mechanism of copolymerization of styrene with acrylonitrile using triphenylbismuthonium 1,2,3,4-tetraphenylcyclopentadienylide as the radical initiator. Polymer-Plastics Technology and Engineering. 46(3): p. 213-218.
[29] Choi, K. Y., Kwag, B.G., Park, S.Y. and Cheong, C. H., 2009, Technical Processes for Industrial Production, in Handbook of Vinyl Polymers Radical Polymerization, Process, and Technology, M. K. Mishra and Y. Yagci, Editors., CRC Press. p. 390.
[30] Mino, G., 1956, Copolymerization of styrene and acrylonitrile in aqueous dispersion. Journal of Polymer Science. 22(102): p. 369-383.
[31] Medizabal, E., Rodriguez-Ruvalcaba, R., Rabelero, V., Puig, J. E., Velazquez, R. and Castano, V., 1995, A Comparison of emulsion and microemulsion copolymerization of styrene and acrylonitrile, International Journal of Polymeric Materials. 30(3-4): p. 167-179.
[32] Vanderhoff, J. W., Dimonie, V., El-Aasser, M. S. and Klein, A., 1993, Emulsion copolymerization of azeotropic styrene-acrylonitrile monomer mixture in polystyrene seed latexes. Die
Makromolekulare Chemie. 10(S19851): p. 391-402.

71
[33] Lin, C.C., Ku, H.C. and Chiu, W.Y., 1981, Simulation model for the emulsion copolymerization of acrylonitrile and styrene in azeotropic composition. Journal of Applied Polymer Science. 26(4): p. 1327 - 1342.
[34] Choi, K. Y., Kwag, B.G., Park, S.Y. and Cheong, C. H., 2009, Technical Processes for Industrial Production, in Handbook of Vinyl Polymers Radical Polymerization, Process, and Technology, M. K. Mishra and Y. Yagci, Editors, CRC Press. p. 390-391.
[35] Kido, K., Wakamori, H., Asai, G. and Kushida, K., 1978, Jpn. Kokai Tokkyo Koho. JP 78,126,094.
[36] Kato, S. and Momoka, M., Jpn. Kokai Tokkyo Koho. JP 7,882,892 (89,180616z).
[37] Choi, K. Y., Kwag, B.G., Park, S.Y. and Cheong, C. H., 2009, Technical Processes for Industrial Production, in Handbook of Vinyl Polymers Radical Polymerization, Process, and Technology, M. K. Mishra and Y. Yagci, Editors., CRC Press. p. 391.
[38] Arsac, A., Zerroukhi, A., Ainser, A. and Carrot, C., 2000, Rheological characterization of styrene acrylonitrile copolymers. Journal of Applied Polymer Science. 77(6): p. 1316-1321.
[39] Al-Harthi, M., Sardashti, A., Soares, J. B. P. and Simon, L. C., 2007, Atom transfer radical polymerization (ATRP) of styrene and acrylonitrile with monofunctional and bifunctional initiators. Polymer. 48(7): p. 1954-1961.
[40] Carrado, K. A., 2003, Polymer–Clay Nanocomposites, in Advanced Polymeric Materials-Structure Property Relationships, G. O. Shonaike and S. G. Advani, Editors., CRC Press. p. 1-3.
[41] Carrado, K.A., 2003, Polymer–Clay Nanocomposites, in Advanced Polymeric Materials-Structure Property Relationships, G. O. Shonaike and S. G. Advani, Editors, CRC Press. p. 4-12.
[42] Wang, H. W., Chang, K. C. and Chu, H. C., 2005, Effect of clay on the properties of poly(styrene-co-acrylonitrile)-clay nanocomposites. Polymer International. 54(1): p. 114-119.
[43] Stretz, H. A. and Paul, D. R., 2006, Properties and morphology of nanocomposites based on styrenic polymers. Part I: Styrene-acrylonitrile copolymers. Polymer. 47(24): p. 8123-8136.
[44] Jang, B. N. and Wilkie, C. A., 2005, The effects of clay on the thermal degradation behavior of poly(styrene-co-acrylonitirile). Polymer. 46(23): p. 9702-9713.
[45] Khalil, H., Mahajan, D. and Rafailovich, M., 2005, Complex formation of montmorillonite clay with polymers. Part 2: The use of montmorillonite clay-vinyl monomer complex as a comonomer in the copolymerization reaction of styrene-acrylonitrile monomers. Polymer International. 54(2): p. 428-436.
[46] Noh, M. H. and Lee, D. C., 1999, Comparison of characteristics of SAN-MMT nanocomposites prepared by emulsion and solution polymerization. Journal of Applied Polymer Science. 74(12): p. 2811-2819.
[47] Ünlü, Cüneyt H., Günister, Ebru and Atıcı, Oya, 2008, Synthesis and characterization of NaMt biocomposites with corn cob xylan in aqueous media. Carbohydrate Polymers.

72
[48] Atici, O. G., Akar, A., Ayar, Y. and Mecit, O., 1999, Synthesis of block copolymers via redox polymerization. Journal of Applied Polymer Science. 71(9): p. 1388.
[49] Nagarajan, S. and Srinivasan, K. S. V., 1998, Efficiency of ceric ione for oxidation and polymerization - A review. Journal of
Macromolecular Science-Reviews in Macromolecular Chemistry
and Physics. C38(1): p. 55-56. [50] Czappa, D. J., 1974, The role of acid in the cerium (IV) oxidation of
carbohydrates, PhD Thesis, The Institute of Paper Chemistry, Lawrence University.
[51] Kacurakova, M., Capek, P., Sasinkova, V., Wellner, N. and Ebringerova, A., 2000, FT-IR study of plant cell wall model compounds: pectic polysaccharides and hemicelluloses. Carbohydrate Polymers. 43(2): p. 195-203.
[52] Silva, A. L. A., Takase, I., Pereira, R. P. and Rocco, A. M., 2008, Poly(styrene-co-acrylonitrile) based proton conductive membranes. European Polymer Journal. 44(5): p. 1462-1474.
[53] Clark, S., Barnett, N. W., Adams, M., Cook, I. B., Dyson, G. A. and Johnston, G., 2006, Monitoring a commercial fermentation with proton nuclear magnetic resonance spectroscopy with the aid of chemometrics, 338-345, 10.1016/j.aca.2005.11.033, ISI:000236570900042
[54] Drake, E. N. and Brown, C. E., 1977, Conformational analysis of sugars by 1H NMR spectroscopy and polarimetry. Journal of Chemistry. 54(124): p. 7.
[55]<http://hmdb.ca/labm/servlet/labm.mlims.showFile?tbl=tbl_hnmrv&id=121978935435965822>, accessed at 05.03.2009.
[56] Boduroğlu, S., 2006, New Supramolecular Approach for Sugar Analysis, PhD Thesis, The Graduate Faculty of the University of Akron, University of Akron.
[57] Jun, J. B., Uhm, S. Y. and Suh, K. D., 2003, Preparation and electrorheological characterization of suspensions of monodisperse micron-sized styrene-acrylonitrile copolymer particles. Macromolecular Chemistry and Physics. 204(3): p. 451-459.
[58] Simons, W.W. and Zanger, M., 1973, The Sadtler Guide to The NMR Spectra of Polymers. Philadelphia: Sadtler research laboratories, Inc. Sabsidiary of block engineering, Inc. 42.
[59] Simons, W.W. and Zanger, M., 1973, The Sadtler Guide to The NMR Spectra of Polymers. Philadelphia: Sadtler research laboratories, Inc. Sabsidiary of block engineering, Inc. 52.
[60]<http://www.muhlenberg.edu/depts/chemistry/chem201woh/1Hdmf.html> accessed at 16.03.2009.
[61] Gal, Y. S., Jin, S. H. and Kim, S. H., 2006, Synthesis and characterization of ionic polyacetylene derivative with azobenzene moieties. Journal of Industrial and Engineering Chemistry. 12(2): p. 235-240.
[62] Vahaplar, Kadir, 2007, Structural and magnetic properties of Si(100)/Ta/Co multilayers for spintronics applications, M.Sc Thsis, Graduate School of Engineering and Sciences, Đzmir Institute of Technology.

73
[63] Greenfield, D. and Clegg, F.C., 2004, Enhancement of barrier properties in organic coatings using nanocomposites. The Journal of Corrosion Science and Engineering. 8(8).
[64] <http://www.kitpackers.com/PDFs/TT-UnderstandingRheology.pdf>, accessed at 05.02.2009.
[65] Djordjevic, D., 1992, Coextrusion. 15. [66] Mezger, Thomas G., 2006, The rheology handbook: for users of rotational and
oscillatory rheometers. 2 ed: Vincentz Network GmbH & Co KG. 299.
[67] Brown, Michael E., 2001, Introduction to thermal analysis: techniques and applications. 2, illustrated ed: Springer. 264.
[68] Yang, H.L. , 2006, Controlling the stereoregularıty of polyacrylonitrile and its determination using small molecule host inclusion compounds, M.Sc. Thesis, the Graduate Facultv of North Carolina State University, North Carolina State University, No of Pages.
[69] Sopade, P. A., Lee, S. B., White, E. T. and Halley, P. J., 2007, Glass transition phenomena in molasses. Lwt-Food Science and Technology. 40(6): p. 1117-1122.
[70] Ravi, P. and Divakar, S., 2000, beta-cyclodextrin mediated synthesis of sterically controlled styrene-acrylonitrile copolymer. Journal of Inclusion Phenomena and Macrocyclic Chemistry. 38(1-4): p. 323-336.
[71] Wiehe, Irwin A., 2008, Process Chemistry of Petroleum Macromolecules: CRC Press. 456.
[72] Snell, Foster Dee and Ettre, Leslie S., 1971, Water Sorption, in Encyclopedia of Industrial Chemical Analysis Interscience Publishers, 11, 302-306

74

75
CURRICULUM VITA
Name and Surname : Nurhan KADAK
Place and date of birth : ISTANBUL/ 07.02.1983
Permanent Address : Cumhuriyet mah Aşık Veysel cad. Mine sok. Kent Apt.No:2 D:7 Küçükçekmece/ĐSTANBUL
University attended : Chemistry Department/Istanbul Technical University
Publications:
Atıcı O., Đşçi S., Kadak N., Synthesis and Characterization of Poly(acrylonitrile-g-methyl cellulose)/Organoclay Nanocomposites. National Clay Symposium, October 2007, Kütahya, Turkey.