
Stakeholder Meeting on AER’s Preliminary Decision for SA Power Networks 27 May 2015 Adelaide Bev...
33
Stakeholder Meeting on AER’s Preliminary Decision for SA Power Networks 27 May 2015 Adelaide Bev Hughson Consumer Challenge Panel Member
-
Upload
bertina-murphy -
Category
Documents
-
view
215 -
download
1
Transcript of Stakeholder Meeting on AER’s Preliminary Decision for SA Power Networks 27 May 2015 Adelaide Bev...
Stakeholder Meeting on AER’s Preliminary Decision
for SA Power Networks
27 May 2015Adelaide
Bev HughsonConsumer Challenge Panel Member
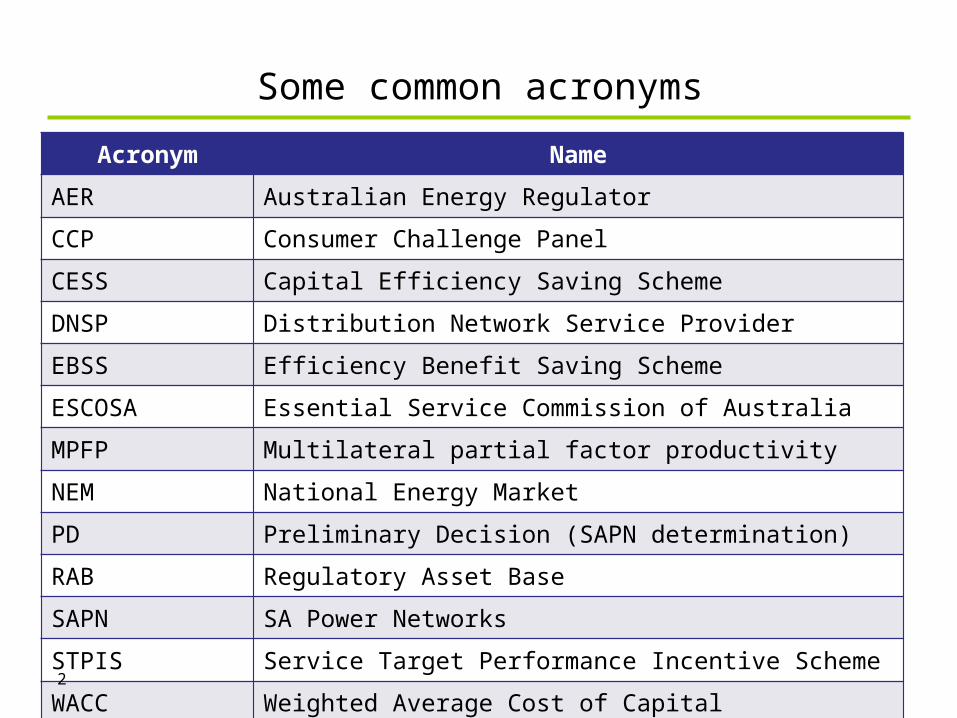
Some common acronyms
Acronym Name
AER Australian Energy Regulator
CCP Consumer Challenge Panel
CESS Capital Efficiency Saving Scheme
DNSP Distribution Network Service Provider
EBSS Efficiency Benefit Saving Scheme
ESCOSA Essential Service Commission of Australia
MPFP Multilateral partial factor productivity
NEM National Energy Market
PD Preliminary Decision (SAPN determination)
RAB Regulatory Asset Base
SAPN SA Power Networks
STPIS Service Target Performance Incentive Scheme
WACC Weighted Average Cost of Capital2
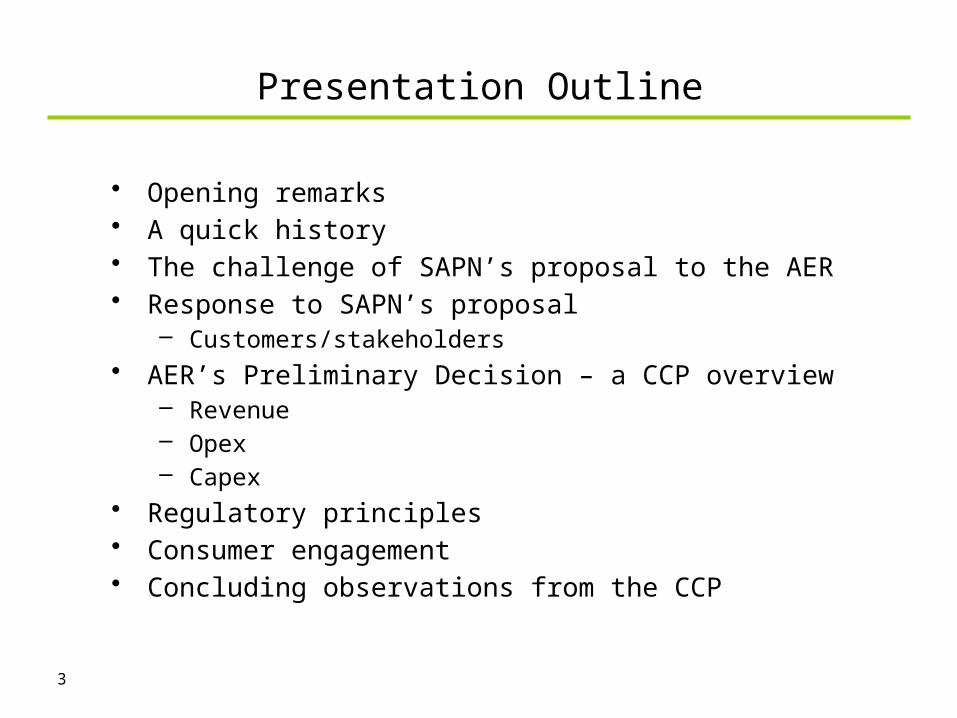
Presentation Outline
• Opening remarks• A quick history• The challenge of SAPN’s proposal to the AER• Response to SAPN’s proposal
– Customers/stakeholders• AER’s Preliminary Decision – a CCP overview
– Revenue– Opex– Capex
• Regulatory principles• Consumer engagement• Concluding observations from the CCP
3
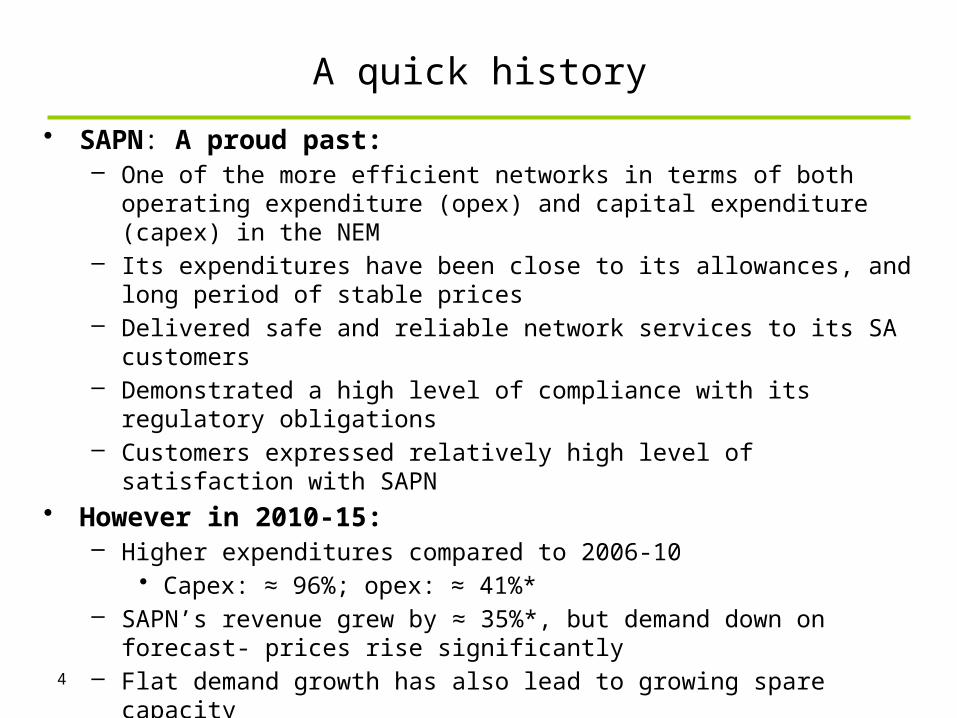
A quick history
• SAPN: A proud past:– One of the more efficient networks in terms of both operating expenditure
(opex) and capital expenditure (capex) in the NEM– Its expenditures have been close to its allowances, and long period of stable
prices– Delivered safe and reliable network services to its SA customers– Demonstrated a high level of compliance with its regulatory obligations – Customers expressed relatively high level of satisfaction with SAPN
• However in 2010-15: – Higher expenditures compared to 2006-10
• Capex: ≈ 96%; opex: ≈ 41%*– SAPN’s revenue grew by ≈ 35%*, but demand down on forecast- prices rise
significantly – Flat demand growth has also lead to growing spare capacity – The RAB has started to grow, as has RAB per customer
* Source: AER, State of the Energy Market 2014, Figures 2.4, 2.6 & 2.8. These figures are not necessarily the same as the data provided in the RIN data sets. 4
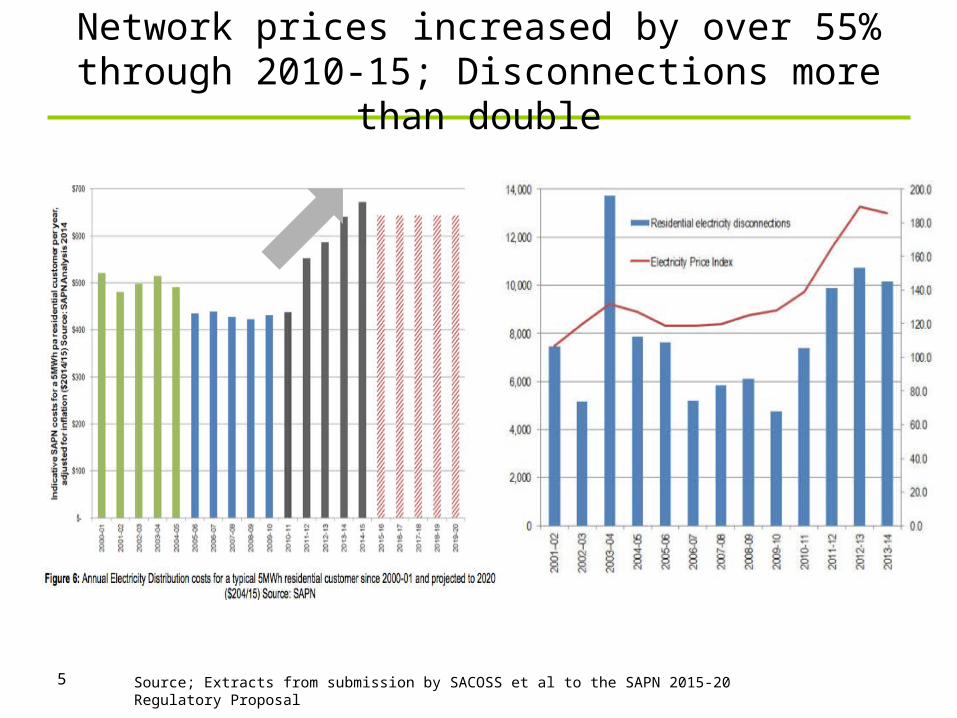
Network prices increased by over 55% through 2010-15; Disconnections more than double
5 Source; Extracts from submission by SACOSS et al to the SAPN 2015-20 Regulatory Proposal
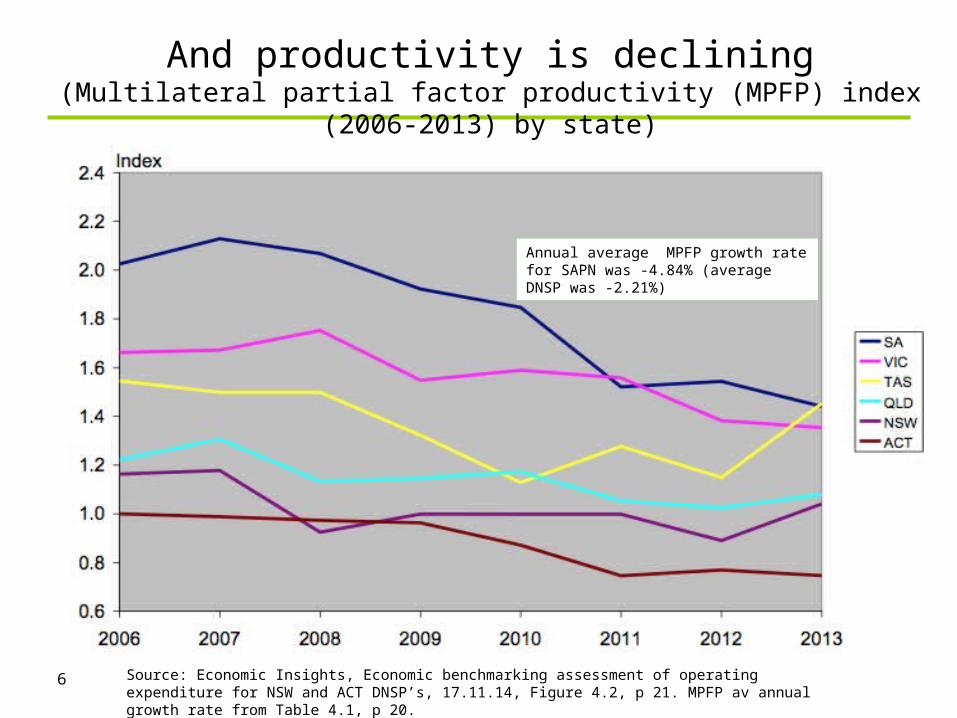
And productivity is declining(Multilateral partial factor productivity (MPFP) index (2006-2013) by
state)
6 Source: Economic Insights, Economic benchmarking assessment of operating expenditure for NSW and ACT DNSP’s, 17.11.14, Figure 4.2, p 21. MPFP av annual growth rate from Table 4.1, p 20.
Annual average MPFP growth rate for SAPN was -4.84% (average DNSP was -2.21%)
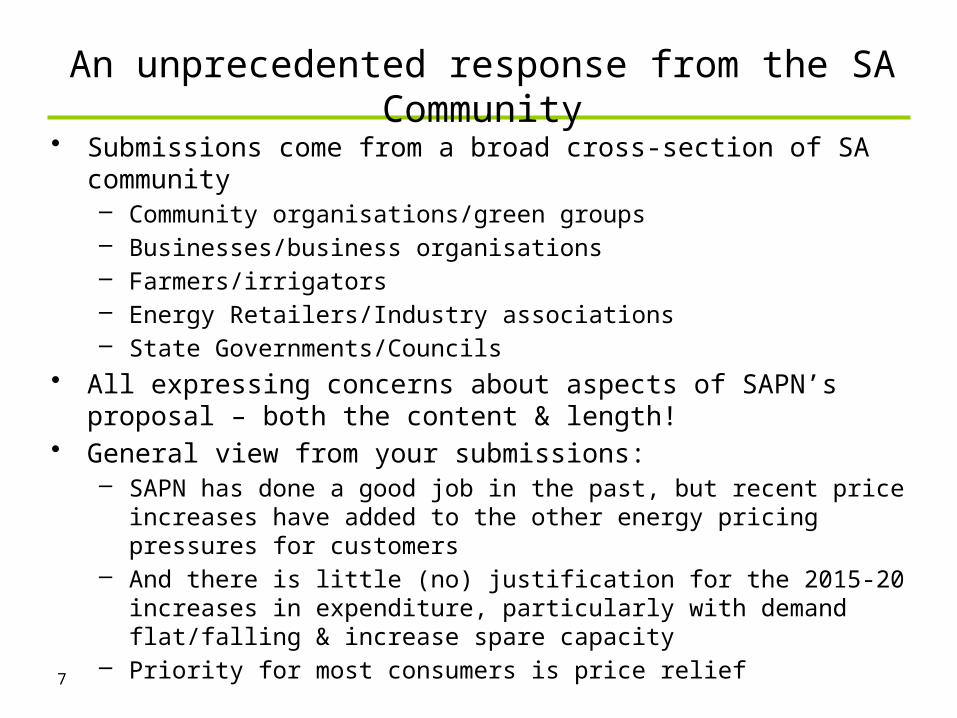
An unprecedented response from the SA Community
• Submissions come from a broad cross-section of SA community– Community organisations/green groups– Businesses/business organisations– Farmers/irrigators– Energy Retailers/Industry associations– State Governments/Councils
• All expressing concerns about aspects of SAPN’s proposal – both the content & length!
• General view from your submissions: – SAPN has done a good job in the past, but recent price increases have
added to the other energy pricing pressures for customers– And there is little (no) justification for the 2015-20 increases in
expenditure, particularly with demand flat/falling & increase spare capacity– Priority for most consumers is price relief
7
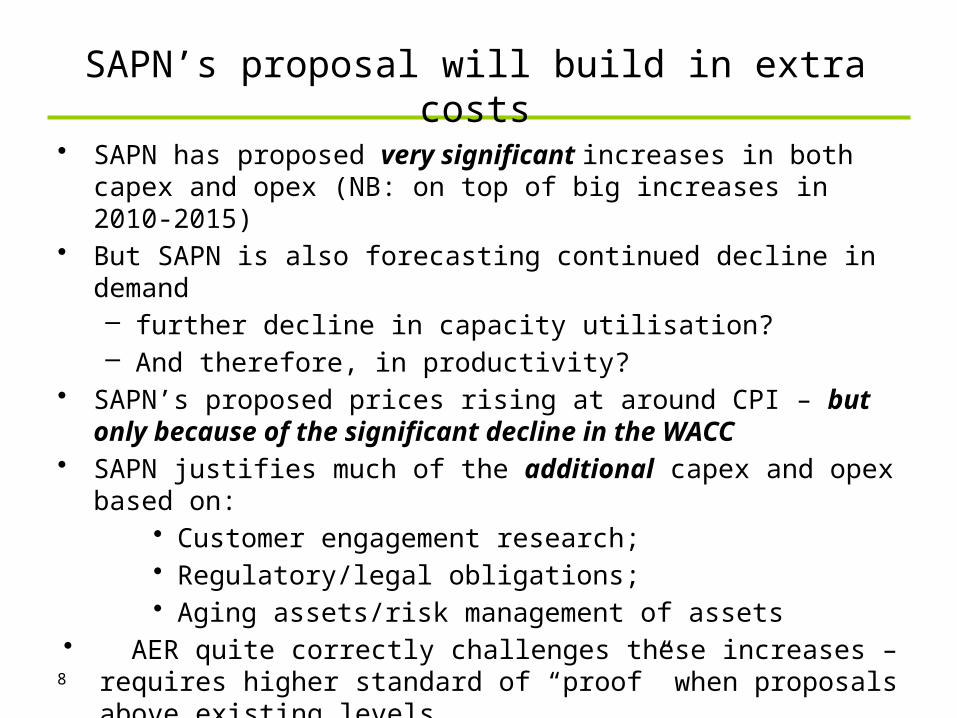
SAPN’s proposal will build in extra costs
• SAPN has proposed very significant increases in both capex and opex (NB: on top of big increases in 2010-2015)
• But SAPN is also forecasting continued decline in demand – further decline in capacity utilisation?– And therefore, in productivity?
• SAPN’s proposed prices rising at around CPI – but only because of the significant decline in the WACC
• SAPN justifies much of the additional capex and opex based on:• Customer engagement research; • Regulatory/legal obligations;• Aging assets/risk management of assets
• AER quite correctly challenges these increases – requires higher standard of “proof” when proposals above existing levels
8
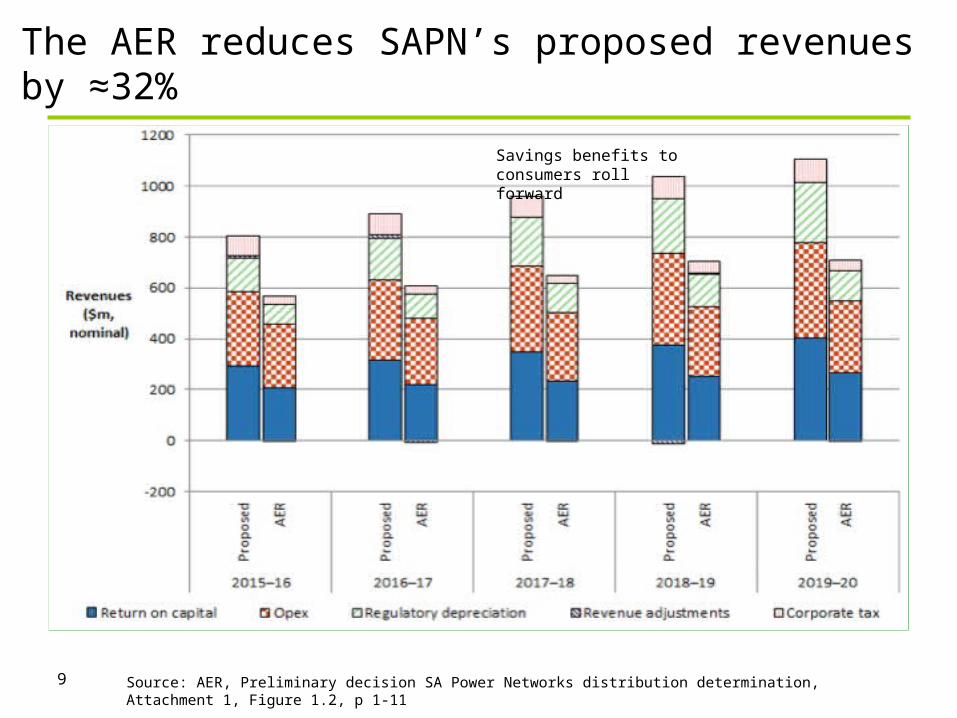
The AER reduces SAPN’s proposed revenues by ≈32%
9 Source: AER, Preliminary decision SA Power Networks distribution determination, Attachment 1, Figure 1.2, p 1-11
Savings benefits to consumers roll forward
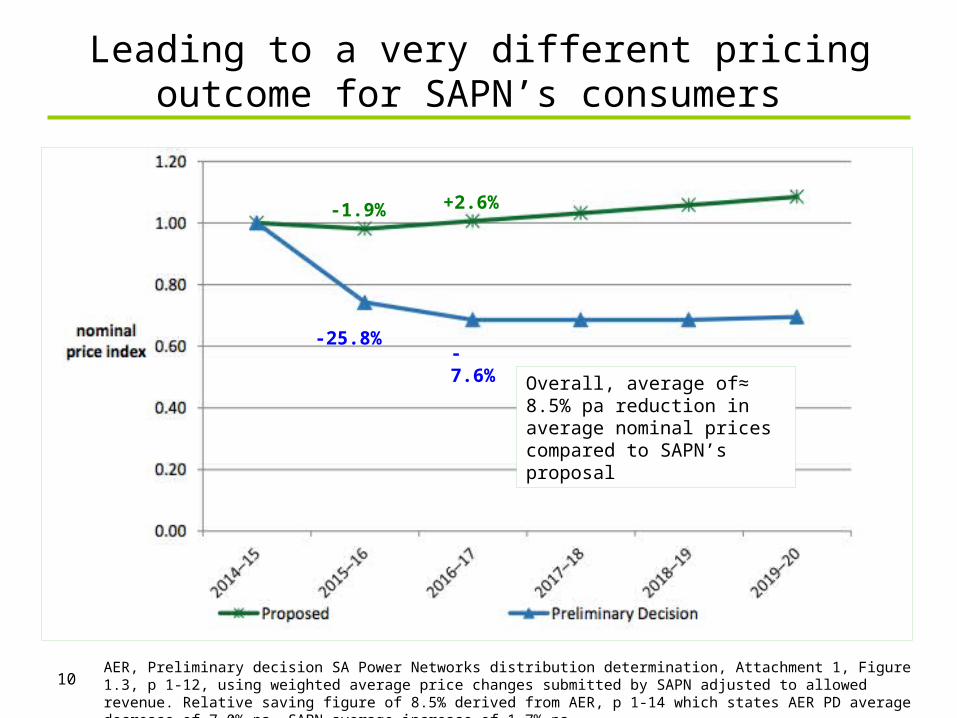
Leading to a very different pricing outcome for SAPN’s consumers
10AER, Preliminary decision SA Power Networks distribution determination, Attachment 1, Figure 1.3, p 1-12, using weighted average price changes submitted by SAPN adjusted to allowed revenue. Relative saving figure of 8.5% derived from AER, p 1-14 which states AER PD average decrease of 7.0% pa, SAPN average increase of 1.7% pa
Overall, average of≈ 8.5% pa reduction in average nominal prices compared to SAPN’s proposal
-25.8%
-1.9%
-7.6%
+2.6%
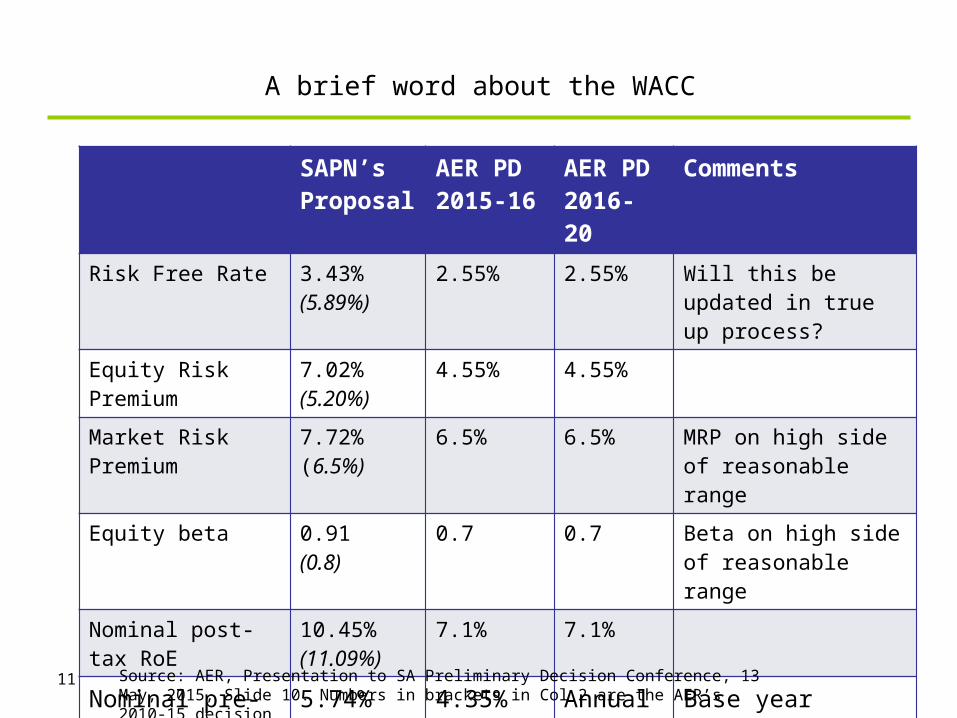
A brief word about the WACC
11
SAPN’s Proposal
AER PD2015-16
AER PD 2016-20
Comments
Risk Free Rate 3.43%(5.89%)
2.55% 2.55% Will this be updated in true up process?
Equity Risk Premium
7.02%(5.20%)
4.55% 4.55%
Market Risk Premium
7.72%(6.5%)
6.5% 6.5% MRP on high side of reasonable range
Equity beta 0.91(0.8)
0.7 0.7 Beta on high side of reasonable range
Nominal post-tax RoE
10.45%(11.09%)
7.1% 7.1%
Nominal pre-tax return on debt
5.74%(8.74%)
4.35% Annual update
Base year issue?
Nominal Vanilla WACC
7.62%(9.76%)
5.45% Annual update
Source: AER, Presentation to SA Preliminary Decision Conference, 13 May, 2015, Slide 10. Numbers in brackets in Col 2 are the AER’s 2010-15 decision
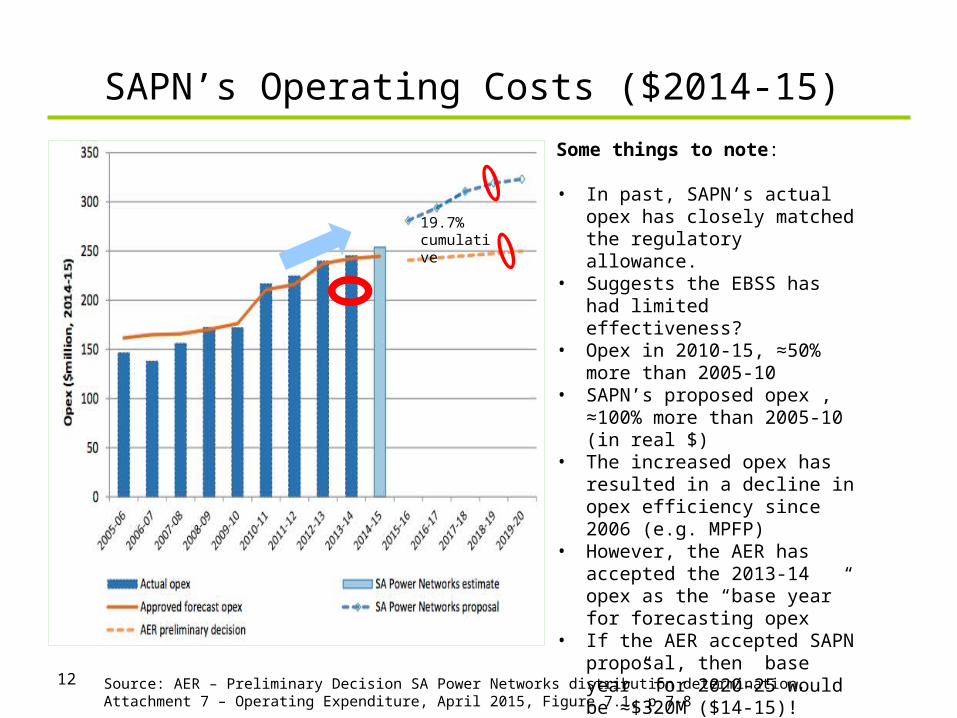
SAPN’s Operating Costs ($2014-15)
12
Some things to note:
• In past, SAPN’s actual opex has closely matched the regulatory allowance.
• Suggests the EBSS has had limited effectiveness?
• Opex in 2010-15, ≈50% more than 2005-10
• SAPN’s proposed opex , ≈100% more than 2005-10 (in real $)
• The increased opex has resulted in a decline in opex efficiency since 2006 (e.g. MPFP)
• However, the AER has accepted the 2013-14 opex as the “base year” for forecasting opex
• If the AER accepted SAPN proposal, then base year” for 2020-25 would be ≈$320M ($14-15)!
• The AER’s PD is still (just) above average of 2010-15 in $14.15
Source: AER – Preliminary Decision SA Power Networks distribution determination, Attachment 7 – Operating Expenditure, April 2015, Figure 7.1, p 7-8
19.7% cumulative
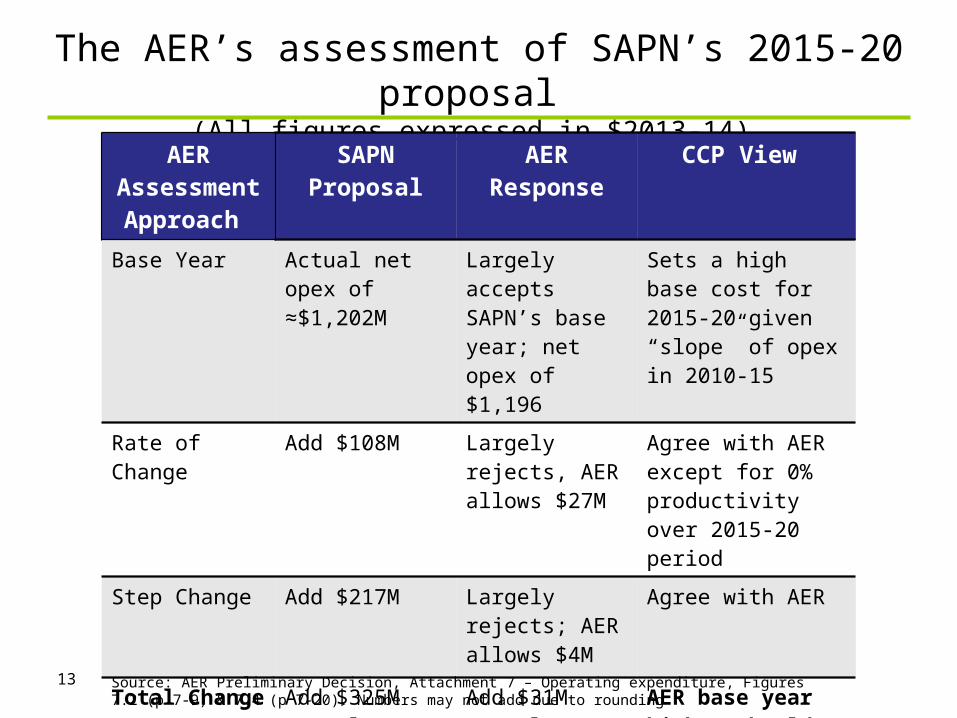
The AER’s assessment of SAPN’s 2015-20 proposal
(All figures expressed in $2013-14)
13
AER Assessment Approach
SAPN Proposal
AER Response
CCP View
Base Year Actual net opex of ≈$1,202M
Largely accepts SAPN’s base year; net opex of $1,196
Sets a high base cost for 2015-20 given “slope” of opex in 2010-15
Rate of Change Add $108M Largely rejects, AER allows $27M
Agree with AER except for 0% productivity over 2015-20 period
Step Change Add $217M Largely rejects; AER allows $4M
Agree with AER
Total Change over Base Year
Add $325M(Total = $1,527M)
Add $31M (Total = $1,226M)
AER base year high & should include some productivity gain over period
Source: AER Preliminary Decision, Attachment 7 – Operating expenditure, Figures 7.2 (p 7-9) & 7.4 (p 7-20). Numbers may not add due to rounding
How has the AER responded?
• AER generally agrees with SAPN’s forecast of demand growth ((≈ 0%) & consumer number growth (≈ 1% to 1.5%)
• But (like consumers) the AER has rejected many of SAPN’s proposed additional expenditures– AER’s general approach is to look at historical expenditures & trends as
a starting point – Although this is supplemented by other valuation techniques such as
benchmarking, engineering assessments…• The AER seeks higher standard of “proof” for claims for additional
expenditures; – it is not reviewing current prudency/efficiency (other than overall
benchmarking)– Therefore not driving continuous productivity growth– The AER is relying on the “incentive mechanisms” (EBSS, CESS, STPIS)
to encourage ongoing improvement – has EBSS achieved this to date?
14
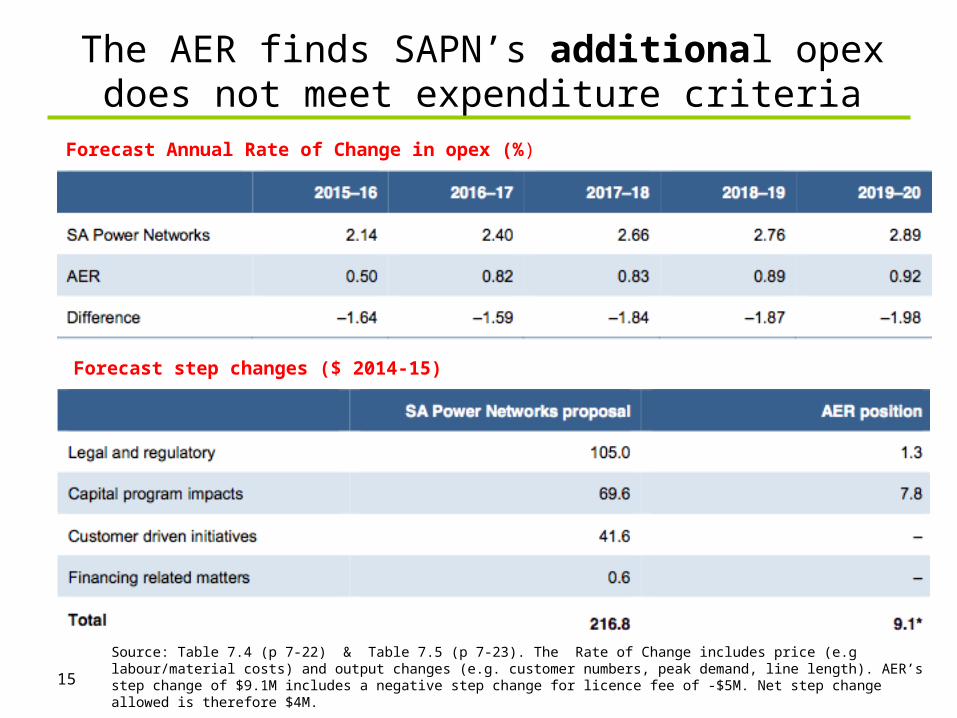
The AER finds SAPN’s additional opex does not meet expenditure criteria
15
Forecast Annual Rate of Change in opex (%)
Forecast step changes ($ 2014-15)
Source: Table 7.4 (p 7-22) & Table 7.5 (p 7-23). The Rate of Change includes price (e.g labour/material costs) and output changes (e.g. customer numbers, peak demand, line length). AER’s step change of $9.1M includes a negative step change for licence fee of -$5M. Net step change allowed is therefore $4M.
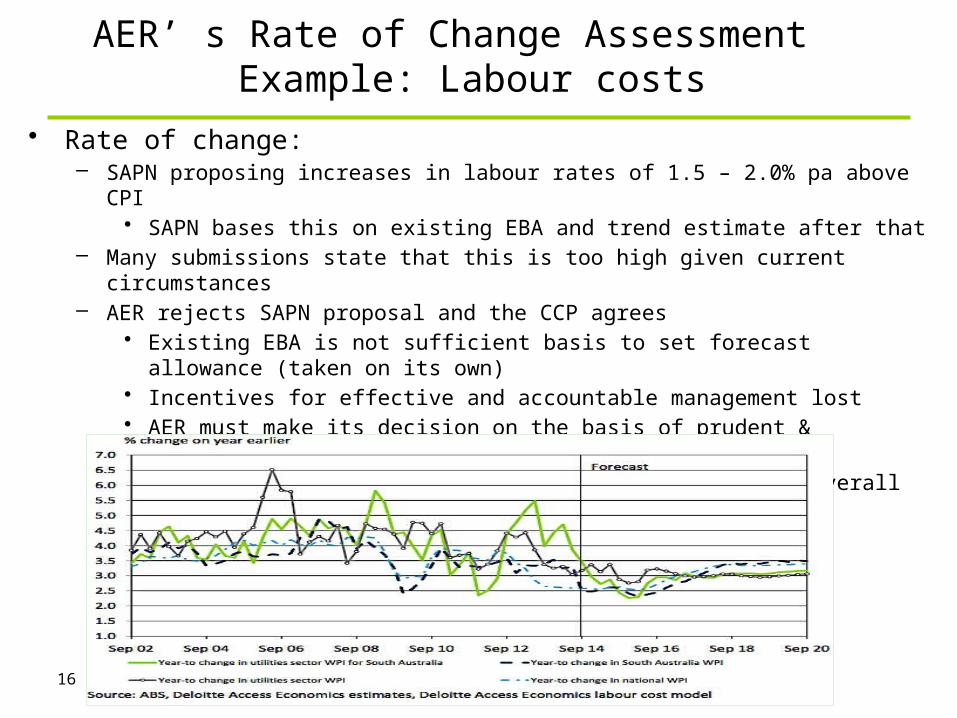
AER’ s Rate of Change Assessment Example: Labour costs
• Rate of change:– SAPN proposing increases in labour rates of 1.5 – 2.0% pa above CPI
• SAPN bases this on existing EBA and trend estimate after that– Many submissions state that this is too high given current circumstances– AER rejects SAPN proposal and the CCP agrees
• Existing EBA is not sufficient basis to set forecast allowance (taken on its own)• Incentives for effective and accountable management lost• AER must make its decision on the basis of prudent & efficient benchmark costs• Up to SAPN management to decide optimal approach to overall wage bill given the
AER’s overall opex decision
16
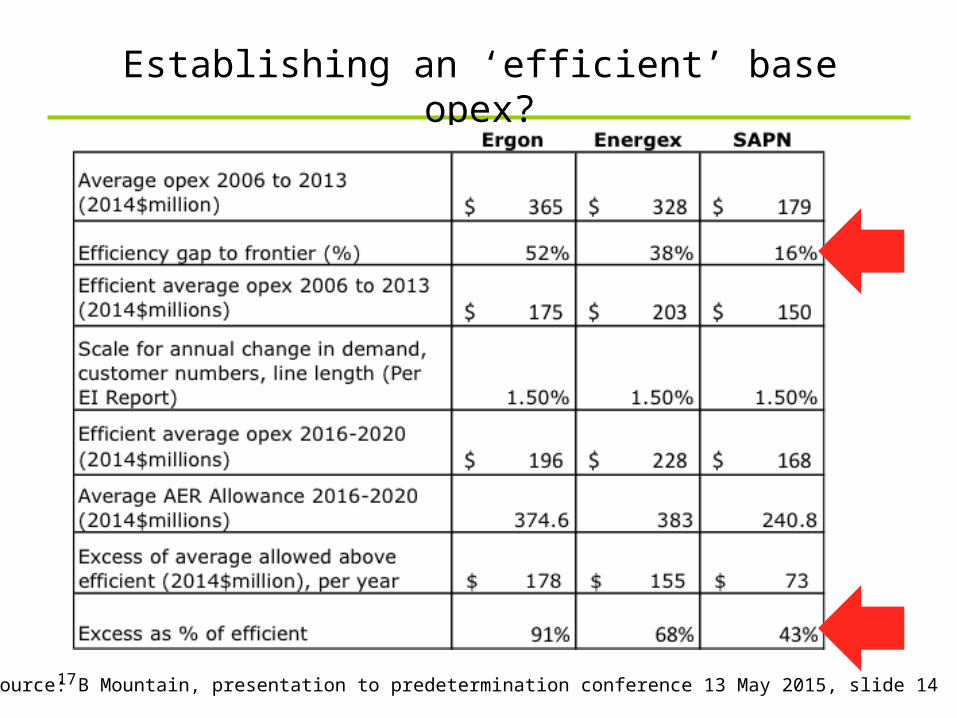
Establishing an ‘efficient’ base opex?
17 Source: B Mountain, presentation to predetermination conference 13 May 2015, slide 14
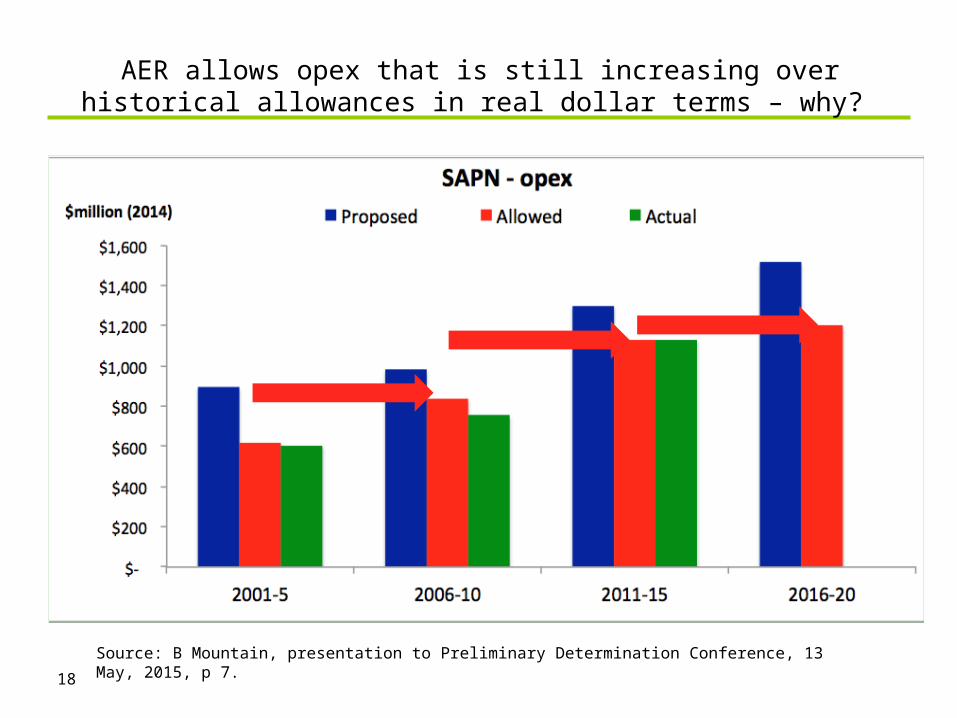
AER allows opex that is still increasing over historical allowances in real dollar terms – why?
18
Source: B Mountain, presentation to Preliminary Determination Conference, 13 May, 2015, p 7.
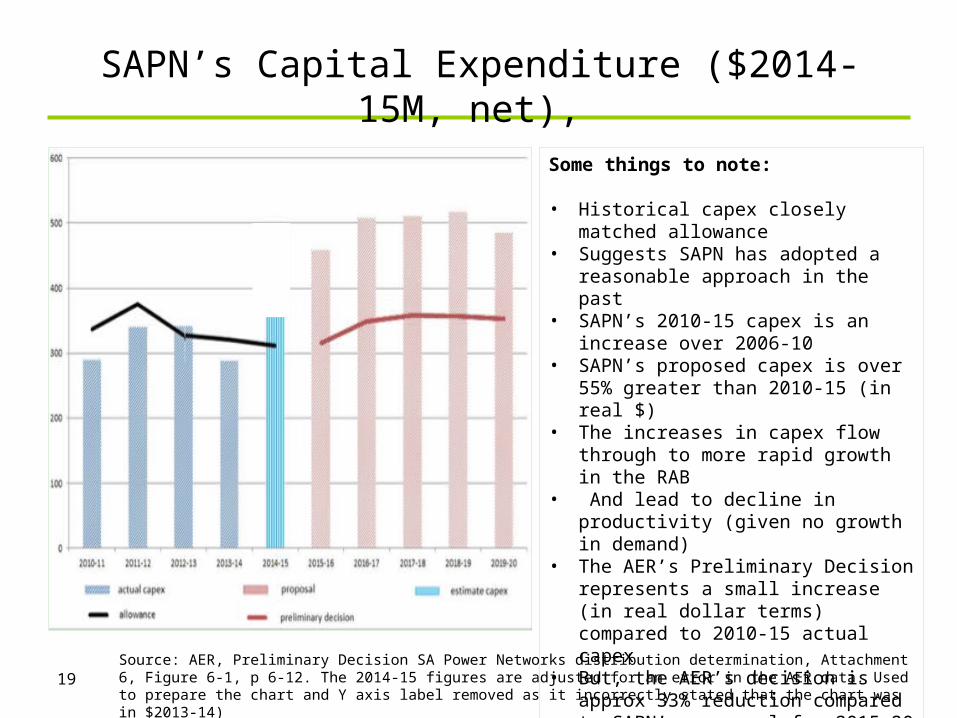
SAPN’s Capital Expenditure ($2014-15M, net),
19
BBBB
Some things to note:
• Historical capex closely matched allowance
• Suggests SAPN has adopted a reasonable approach in the past
• SAPN’s 2010-15 capex is an increase over 2006-10
• SAPN’s proposed capex is over 55% greater than 2010-15 (in real $)
• The increases in capex flow through to more rapid growth in the RAB
• And lead to decline in productivity (given no growth in demand)
• The AER’s Preliminary Decision represents a small increase (in real dollar terms) compared to 2010-15 actual capex
• But, the AER’s decision is approx 33% reduction compared to SAPN’s proposal for 2015-20
Source: AER, Preliminary Decision SA Power Networks distribution determination, Attachment 6, Figure 6-1, p 6-12. The 2014-15 figures are adjusted for an error in the AER data. Used to prepare the chart and Y axis label removed as it incorrectly stated that the chart was in $2013-14)
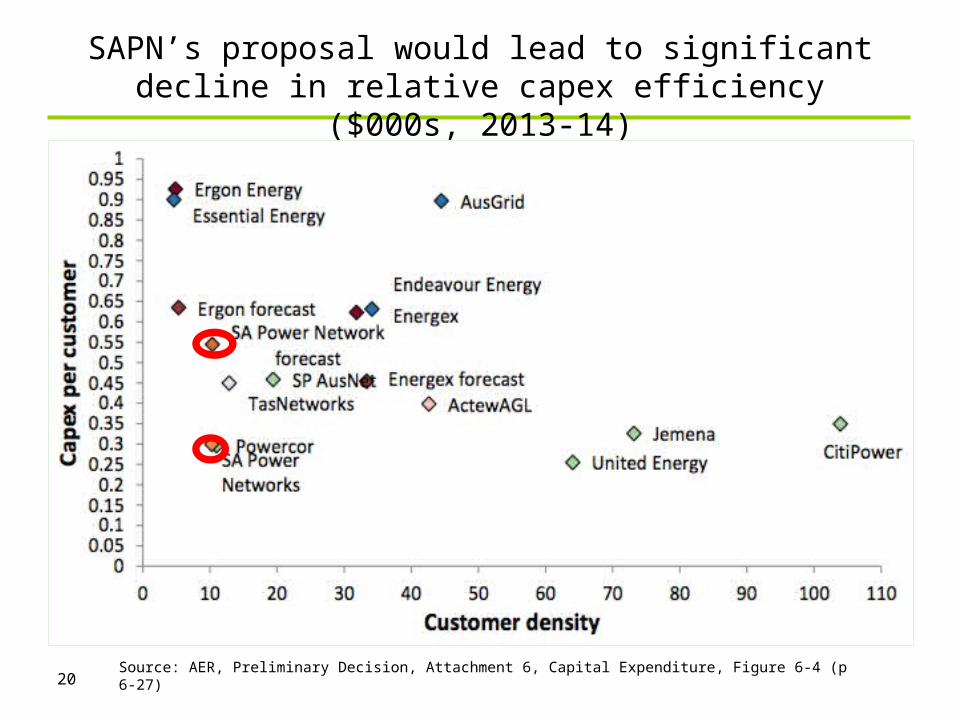
SAPN’s proposal would lead to significant decline in relative capex efficiency ($000s, 2013-14)
20Source: AER, Preliminary Decision, Attachment 6, Capital Expenditure, Figure 6-4 (p 6-27)
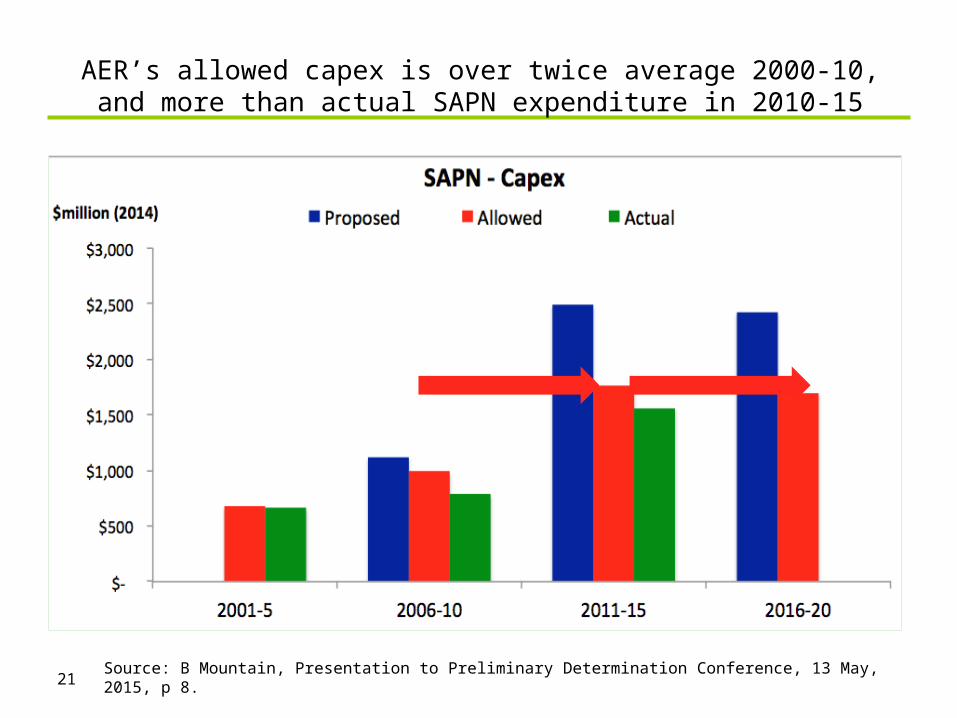
AER’s allowed capex is over twice average 2000-10, and more than actual SAPN expenditure in 2010-15
21Source: B Mountain, Presentation to Preliminary Determination Conference, 13 May, 2015, p 8.
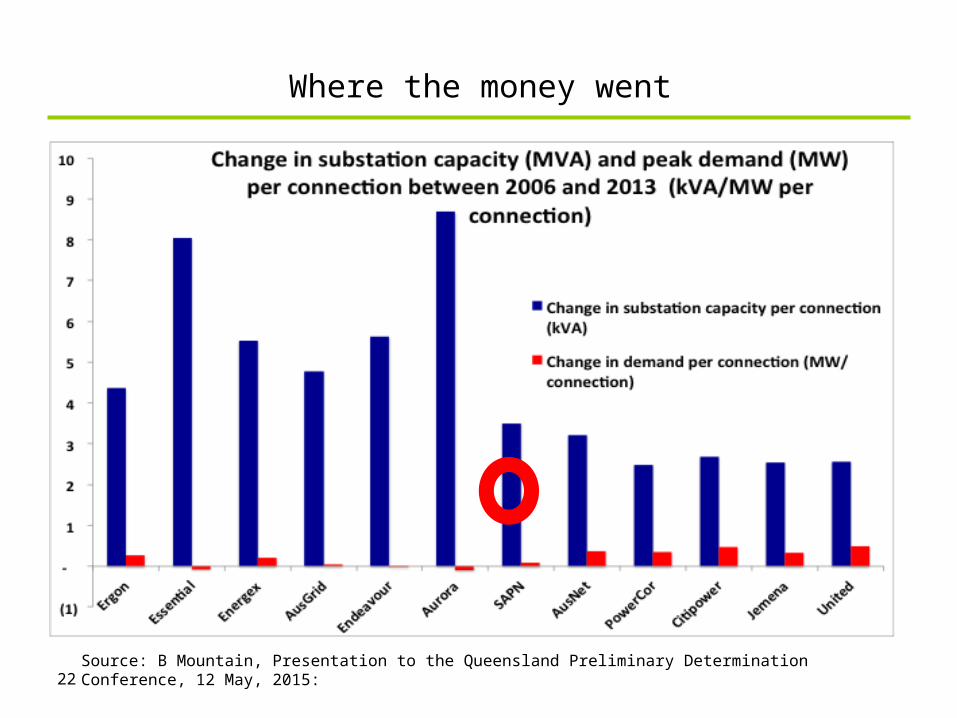
Where the money went
22Source: B Mountain, Presentation to the Queensland Preliminary Determination Conference, 12 May, 2015:
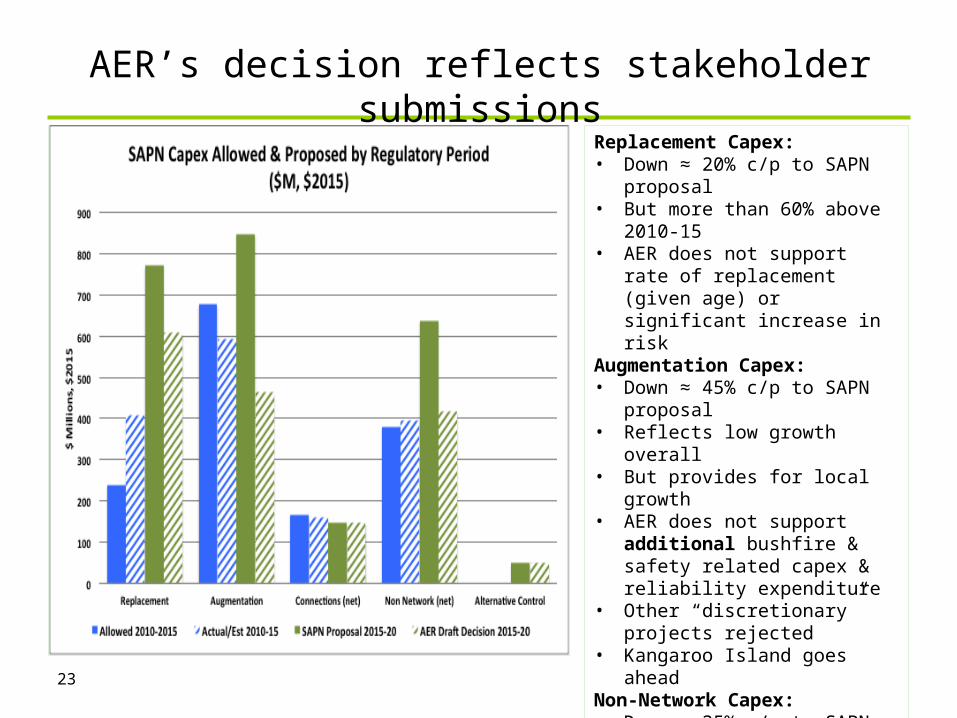
AER’s decision reflects stakeholder submissions
23
Replacement Capex:• Down ≈ 20% c/p to SAPN
proposal• But more than 60% above 2010-
15• AER does not support rate of
replacement (given age) or significant increase in risk
Augmentation Capex: • Down ≈ 45% c/p to SAPN
proposal• Reflects low growth overall• But provides for local growth• AER does not support
additional bushfire & safety related capex & reliability expenditure
• Other “discretionary” projects rejected
• Kangaroo Island goes aheadNon-Network Capex:• Down ≈ 35% c/p to SAPN
proposal• IT deliverability/prudency?• Property/vehicles prudency?
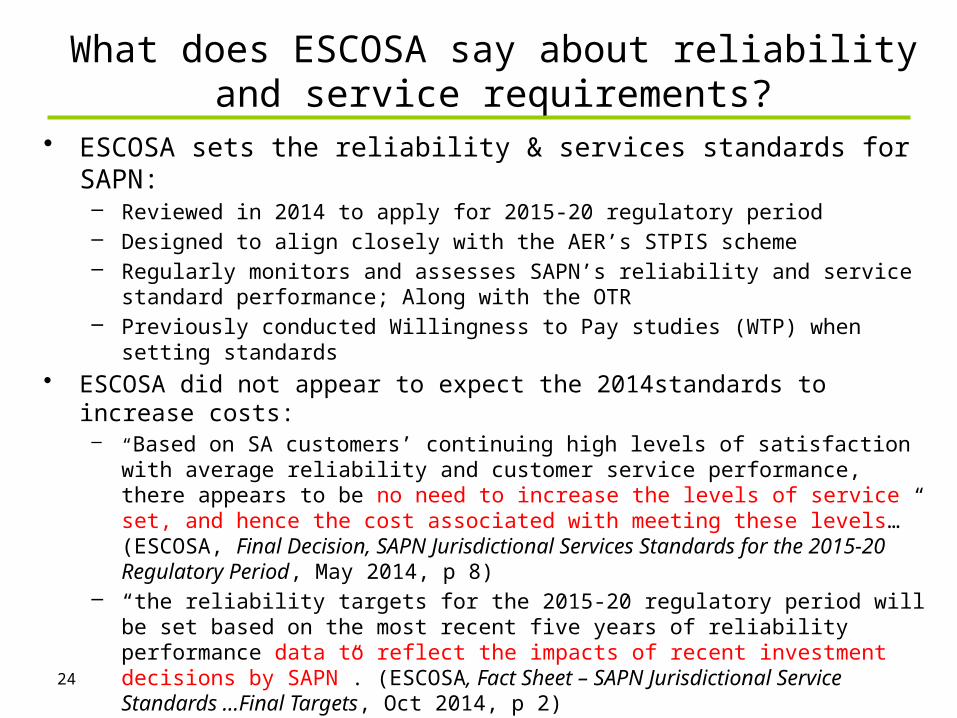
What does ESCOSA say about reliability and service requirements?
• ESCOSA sets the reliability & services standards for SAPN: – Reviewed in 2014 to apply for 2015-20 regulatory period– Designed to align closely with the AER’s STPIS scheme– Regularly monitors and assesses SAPN’s reliability and service standard
performance; Along with the OTR– Previously conducted Willingness to Pay studies (WTP) when setting standards
• ESCOSA did not appear to expect the 2014standards to increase costs: – “Based on SA customers’ continuing high levels of satisfaction with average reliability
and customer service performance, there appears to be no need to increase the levels of service set, and hence the cost associated with meeting these levels…” (ESCOSA, Final Decision, SAPN Jurisdictional Services Standards for the 2015-20 Regulatory Period, May 2014, p 8)
– “the reliability targets for the 2015-20 regulatory period will be set based on the most recent five years of reliability performance data to reflect the impacts of recent investment decisions by SAPN”. (ESCOSA, Fact Sheet – SAPN Jurisdictional Service Standards …Final Targets, Oct 2014, p 2)
– “SAPN’s distribution network must be built to perform consistently within normal weather conditions…Network reliability measurements and improvements should focus on performance during the normal course of events and efficient restoration practices when the network is under unusual stress”. (ibid, p 3). 24
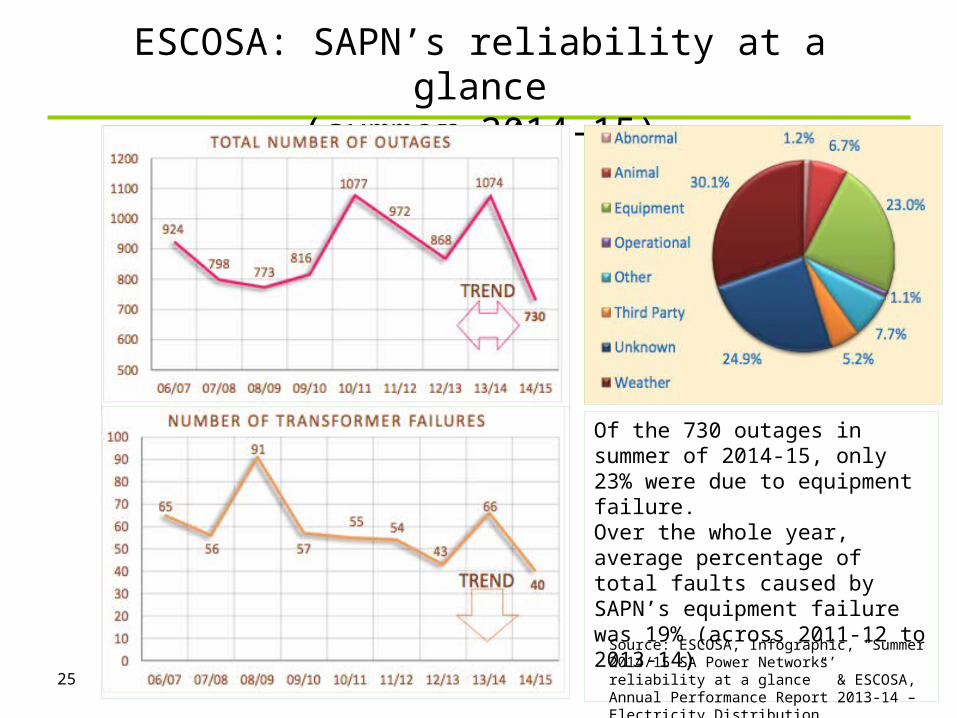
ESCOSA: SAPN’s reliability at a glance (summer 2014-15)
25
Of the 730 outages in summer of 2014-15, only 23% were due to equipment failure.Over the whole year, average percentage of total faults caused by SAPN’s equipment failure was 19% (across 2011-12 to 2013-14)
Source: ESCOSA, Infographic, “Summer 2014/15 SA Power Networks’ reliability at a glance” & ESCOSA, Annual Performance Report 2013-14 – Electricity Distribution
AER establishes some important assessment principles
• The emphasis in incentive regulation is on management accountability for its priorities & decisions
• The AER approves (or replaces) the total capex and opex expenditure allowances– The AER does not “approve” specific projects – up to the businesses to set priorities for specific capex or opex projects
• The AER does not prevent businesses from spending more than their regulatory allowances, but: – Overspend opex, then additional costs are borne by owners out of
profits/retained earnings (the EBSS) – Overspend capex, then - assuming expenditure is found (ex post) to be
efficient and prudent - additional capex may become part of the future RAB
• And options are available for SAPN to seek pass through allowance for unexpected events/costs– SAPN has already done this for increased vegetation costs
26
AER’s assessment principles (2)
• The AER assumes that a business has been operating efficiently (subject to benchmarking tests!)– Therefore, if no material change in circumstances, AER’s starting
assumption is there is no need for additional expenditures– Up to the network to establish material change & that additional
expenditures are prudent and efficient• Expenditure initiatives designed to improve network efficiency are not
(per se) recognised as pass-through costs to consumers– The network will be rewarded through incentive schemes (EBSS, CESS)– Should be undertaken on a business case basis
• Expenditure to improve reliability of network (above regulatory standards) are not (per se) recognised as pass through costs– The network will be rewarded through STPIS/public image …
• Discretionary expenditure will not (per se) be compensated for• Programs with broad community benefit/stakeholders should not be funded by
electricity consumers (unless through change of regulation), e.g.– A coherent and multidisciplinary response to bushfire &/or undergrounding
27
CCP’s Response to these Principles
• Strongly support the AER’s overarching principles of management accountability
• These are particularly important in the context of SAPN’s proposal for very significant increases in expenditure allowances– Which will lead to lower productivity, future price rises & inflated RAB
• The AER has provided SAPN with expenditure allowances that are in line with, or greater than, previous expenditures (in real $)– It is up to SAPN management to respond to this by setting priorities & driving
efficiency– SAPN will be rewarded through the incentive schemes for doing this– In a time of declining/flat demand, this focus is essential
• What’s missing?– A clear strategy around demand management– More critical examination of historical expenditure efficiency– “Unbiased” use of regulatory discretion (e.g. WACC parameters)– Ambitious, more direct targeting of future productivity improvements– Assess proposals against the “competitive market test”
28
A Final Word About Customer Engagement
• CCP notes and appreciates that SAPN has conducted an extensive customer engagement program over a number of years– Customers have indicated that they appreciated this commitment– And, it will assist SAPN management to set priorities in its expenditures
• However, SAPN has used the customer engagement outcomes to justify very substantial increases in its expenditures: For example:
– Significant additional expenditures on bushfire risk management, more undergrounding of assets, enhanced vegetation management - which are not required by regulation
– Discretionary expenditures - things consumers say they would like, but are not required by regulation or industry practice
– Note: SAPN can still spend on these, just not recover cost through the regulatory process
• SAPN must, therefore, be willing to face greater and more detailed scrutiny of its engagement
• And take appropriate account of the many submissions on customer engagement and its use by SAPN to justify additional expenditures29
A Final Word About Consumer Engagement (2)
• While SAPN considers its research is appropriate:– Direct feedback to the CCP tells a somewhat different story– Consumer submissions have raised considerable concerns about using
the research to justify increased expenditures• Find it problematic that low income households would be willing to pay for
additional services (as stated by SAPN) given their feedback from consumers• Concern that consumers did not really have sufficient knowledge and/or did
understand the options• SACOSS research (2014) – 93% of respondents want reduction in price of
electricity, onlly 7% comfortable with existing prices & 25% with difficulties/stress about electricity bills
– Business SA submissions claim SAPN’s research does not reflect their members views:
• Survey to rank priorities, price reductions are the No 1 priority for 87% of its members/89% not willing to pay for any increase in reliability
– The state government has expressed concerns about some programs– ESCOSA’s previous research indicated consumers were comfortable with
current service standards– AER’s consultant cautioned about using study to justify large increases
30
CCP has its own concerns & supports AER’s caution
• Did consumers have sufficient knowledge of:– the industry & its regulation to really understand the trade-offs between price & service– The actual outcome of the investment options (ie. not just cost, but lives saved etc)– the long term consequences of additional investment– the existing processes/penalties & rewards in place (e.g STPIS/GSL)– The current level of service being delivered by SAPN?
• Did consumers understand that other parties had equal or more responsibility for managing the states bushfire risks & road safety (for instance)?
• Did consumers have a clear option put to them that the alternative was a significant reduction in energy prices, within current levels of service?
• Did framing the questions around a “CPI cap” influence the trade-off?– Statement only true because of reduction in WACC/hides the impact of the total costs
• Did consumers understand the “risks”; eg: – If interest rates increase, or demand declines then increased expenditures will lead to
higher than CPI prices – Particularly because adds circa $300M to the RAB – to be paid off over 30 years!
31
Concluding comments from the CCP
• Much progress has been made, but CCP considers more to go: • We remain concerned about
– The assessment of the WACC & the history of very high profits for SAPN (& others)– The AER’s approach to setting the efficient frontier and applying the benchmarks– The long term issue of the RAB value & declining demand– The potential for “status quo” thinking when SAPN’s customers are facing
international competition and price/cost pressures– Are the rewards & penalties in the incentive schemes sufficient to overcome inertia– The approach to regulation that has led to volumes of “evidentiary” material
• Consumer input has been invaluable to the CCP – and to the AER– We hope that SAPN will also take note of the many submissions– AND please, please keep it up
• Still some stormy waters ahead…– This is a preliminary determination, – The AER is committed to revisiting some areas of expenditure/WACC to be updated – Potential for SAPN to appeal the AER’s decision– But consumers can appeal too (or intervene or provide additional information)
32

THANK YOU
33