Staff sizing as a mechanism of efficiency: An application ...
17
Damasceno Cunha et al., Cogent Business & Management (2018), 5: 1463835 https://doi.org/10.1080/23311975.2018.1463835 MANAGEMENT | RESEARCH ARTICLE Staff sizing as a mechanism of efficiency: An application of a non-parametric method Raissa Damasceno Cunha 1 *, Andr Luiz Marques Serrano 2 , Vithor Rosa Franco 1 and Patricia Guarnieri 3 Abstract: The concept of staff sizing aims to estimate or determine the ideal or opti- mal number of people needed to perform some organizational activities, which can be considered as a trend. So, models for staff sizing constitute a fundamental part of accurately identifying staff allocation. The objective of this paper is to propose a framework for decision-making based on Data Envelopment Analysis–DEA, to esti- mate the staff sizing in a Brazilian entity responsible for promoting and supporting the competitiveness and sustainable development of micro and small enterprises. Data collection was carried out in the headquarters of the entity, located in Brasilia. Firstly, interviews were carried with managers in order to assess qualitatively the needs of staff for each service unit. Secondly, the documental analysis of reports from 21 units was analyzed quantitatively in order to determine their efficiency in terms of staff sizing. The results found through DEA show that only three service units can be considered efficient in terms of staff sizing. Thus, there is a need to re- duce the number of workers in most of the organization. In this context, the contri- butions for the entity lie in the discussion on the creation of quantitative indicators and the adoption of an efficiency analysis, which can be used to better estimate or determine the optimal quantity of staff. This paper innovates by proposing a quanti- tative and systematized approach to estimate the staff sizing, which is the DEA. *Corresponding author: Raissa Damasceno Cunha is doctoral student in Psychology in the postgraduation program in Social Psychology of the Work and Organizations (PSTO), Universidade de Braslia (UnB), Campus Universitrio Darcy Ribeiro, Prdio da FACE, Asa Norte CEP, 70.910–900, Braslia, DF, Brasil E-mail: [email protected] Reviewing editor: Yusliza Mohd Yusoff, Universiti Malaysia Terengganu, Malaysia Additional information is available at the end of the article ABOUT THE AUTHORS Raissa Damasceno Cunha is a doctoral student in Psychology in the postgraduation program in Social Psychology of the Work and Organizations (PSTO), at Universidade de Braslia (UnB). Andre Luiz Marques Serrano is an assistant professor and researcher of the Department of Business Administration in Faculty of Economics, Administration, Accounting and Public Policies Management (FACE), at Universidade de Braslia (UnB), Brazil. He is doctor in Economics by University of Braslia. Vithor Rosa Franco is a doctoral student in Psychology in the postgraduation program in Social Psychology of the Work and Organizations (PSTO), at Universidade de Braslia (UnB). Patricia Guarnieri is an assistant professor and researcher of the Department of Business Administration in Faculty of Economics, Administration, Accounting and Public Policies Management (FACE), at Universidade de Braslia (UnB), Brazil. She is a doctor in Production Engineering by Federal University of Pernambuco, Brazil. PUBLIC INTEREST STATEMENT Models for staff sizing constitute a fundamental part of accurately identifying staff allocation, giving relevant information to managers in decision- making process. This paper proposes a framework based on Data Envelopment Analysis, to estimate the staff sizing in a Brazilian entity, which promotes and supports the competitiveness and sustainable development of micro and small enterprises. The data collection was carried out in the headquarters of the entity in Braslia through interviews with managers and by documental analysis of reports of 21 units operating throughout Brazil, to determine its efficiency in terms of staff sizing. The results found can be useful for practitioners and researchers from development countries, as such as, Brics, Caribbean and Mercosul ones. In the case of the current Brazilian scenario of crisis, there is an even greater attention to the need to promote a better management with personnel expenses, in line with strategic planning. Received: 21 November 2017 Accepted: 06 April 2018 First Published: 17 April 2018 © 2018 The Author(s). This open access article is distributed under a Creative Commons Attribution (CC-BY) 4.0 license. Page 1 of 17
Transcript of Staff sizing as a mechanism of efficiency: An application ...

Damasceno Cunha et al., Cogent Business & Management (2018), 5: 1463835https://doi.org/10.1080/23311975.2018.1463835
MANAGEMENT | RESEARCH ARTICLE
Staff sizing as a mechanism of efficiency: An application of a non-parametric methodRaissa Damasceno Cunha1*, Andre Luiz Marques Serrano2, Vithor Rosa Franco1 and Patricia Guarnieri3
Abstract: The concept of staff sizing aims to estimate or determine the ideal or opti-mal number of people needed to perform some organizational activities, which can be considered as a trend. So, models for staff sizing constitute a fundamental part of accurately identifying staff allocation. The objective of this paper is to propose a framework for decision-making based on Data Envelopment Analysis–DEA, to esti-mate the staff sizing in a Brazilian entity responsible for promoting and supporting the competitiveness and sustainable development of micro and small enterprises. Data collection was carried out in the headquarters of the entity, located in Brasilia. Firstly, interviews were carried with managers in order to assess qualitatively the needs of staff for each service unit. Secondly, the documental analysis of reports from 21 units was analyzed quantitatively in order to determine their efficiency in terms of staff sizing. The results found through DEA show that only three service units can be considered efficient in terms of staff sizing. Thus, there is a need to re-duce the number of workers in most of the organization. In this context, the contri-butions for the entity lie in the discussion on the creation of quantitative indicators and the adoption of an efficiency analysis, which can be used to better estimate or determine the optimal quantity of staff. This paper innovates by proposing a quanti-tative and systematized approach to estimate the staff sizing, which is the DEA.
*Corresponding author: Raissa Damasceno Cunha is doctoral student in Psychology in the postgraduation program in Social Psychology of the Work and Organizations (PSTO), Universidade de Brasilia (UnB), Campus Universitario Darcy Ribeiro, Predio da FACE, Asa Norte CEP, 70.910–900, Brasilia, DF, BrasilE-mail: [email protected]
Reviewing editor:Yusliza Mohd Yusoff, Universiti Malaysia Terengganu, Malaysia
Additional information is available at the end of the article
ABOUT THE AUTHORSRaissa Damasceno Cunha is a doctoral student in Psychology in the postgraduation program in Social Psychology of the Work and Organizations (PSTO), at Universidade de Brasilia (UnB).
Andre Luiz Marques Serrano is an assistant professor and researcher of the Department of Business Administration in Faculty of Economics, Administration, Accounting and Public Policies Management (FACE), at Universidade de Brasilia (UnB), Brazil. He is doctor in Economics by University of Brasilia.
Vithor Rosa Franco is a doctoral student in Psychology in the postgraduation program in Social Psychology of the Work and Organizations (PSTO), at Universidade de Brasilia (UnB).
Patricia Guarnieri is an assistant professor and researcher of the Department of Business Administration in Faculty of Economics, Administration, Accounting and Public Policies Management (FACE), at Universidade de Brasilia (UnB), Brazil. She is a doctor in Production Engineering by Federal University of Pernambuco, Brazil.
PUBLIC INTEREST STATEMENTModels for staff sizing constitute a fundamental part of accurately identifying staff allocation, giving relevant information to managers in decision-making process. This paper proposes a framework based on Data Envelopment Analysis, to estimate the staff sizing in a Brazilian entity, which promotes and supports the competitiveness and sustainable development of micro and small enterprises. The data collection was carried out in the headquarters of the entity in Brasilia through interviews with managers and by documental analysis of reports of 21 units operating throughout Brazil, to determine its efficiency in terms of staff sizing. The results found can be useful for practitioners and researchers from development countries, as such as, Brics, Caribbean and Mercosul ones. In the case of the current Brazilian scenario of crisis, there is an even greater attention to the need to promote a better management with personnel expenses, in line with strategic planning.
Received: 21 November 2017Accepted: 06 April 2018First Published: 17 April 2018
© 2018 The Author(s). This open access article is distributed under a Creative Commons Attribution (CC-BY) 4.0 license.
Page 1 of 17
Page 2 of 17
Damasceno Cunha et al., Cogent Business & Management (2018), 5: 1463835https://doi.org/10.1080/23311975.2018.1463835
Subjects: Work & Organizational Psychology; Introductory Work/Organizational Psychol-ogy; Innovation Management; Human Resource Development
Keywords: workforce planning; workforce sizing; data envelopment analysis; micro and small companies
1. IntroductionIn the early 1980s, a new vision emerged regarding the role of people management within organiza-tions. From the United States of America, the Strategic Human Resources Management (or simply Strategic Management) model is now recognized as necessary to achieve competitive results in the short and long terms (Lacombe & Tonelli, 2001). There has been a process of recognition that plan-ning requires a systematic process of assessing the future needs of human capital, relating the composition and profile to the definition of the actions that can make it possible to reach the needs of an institution (Devana, Fombrun, & Tichy, 1984).
Although the concept of workforce planning has existed for a long time, there are few studies on the subject, due mainly to the existence of few tools to support decision-making. In addition, it is important to point out that these tools are usually based on intuition and experience, making them more susceptible to inaccuracies and errors (Di Francesco, Diaz-Maroto Llorente, Zanda, & Zuddas, 2016). Some papers have been published in this context, some of them can be highlighted.
Gunter (2008) researched the workforce planning policy, “School Workforce Remodeling”, in England. Celik, Xi, Xu, and son (2010) proposed a framework to help project managers develop an ideal workforce with assignments that consider the short- and long-term aspects of projects in the Kuali Foundation, a nonprofit organization in the USA. Goodman, French, and Battaglio (2015) evalu-ated the use of workforce planning by municipalities in the USA. Di Francesco et al. (2016) proposed a general mathematical programming model for the short-term workforce planning problem. de la Torre, Lusa, and Mateo (2016) proposed a Mixed-integer linear programming (MILP) model for deal-ing with the long-term staff composition planning in public universities. Chen, Lin, and Peng (2016) proposed a two-stage method in order to determine an integrated medical staff allocation and staff scheduling problem in uncertain environments. Nayebi, Mohebbifar, Azimian, and Rafiei (2017), studied the number of nursing staff in an emergency department of a general training hospital in Qazvin, Iran. Kroezen, Van Hoegaerden, and Batenburg (2017) discussed the results of the Joint Action on Health Workforce Planning and Forecasting (JAHWF, 2013–2016) in all current challenges in health workforce planning.
It seems relevant to note that some of the papers related to workforce planning propose a frame-work or methodology in order to help managers in decision-making, besides that it is very common to find papers related to medical sciences. To the best of our knowledge, research focusing on the problem of staff sizing using the efficiency concept with Data Envelopment Analysis - DEA is still scarce. Banker (1984) has shown that DEA can determine the optimal scale in a production process inside hospitals. Biørn, Hagen, Iversen, and Magnussen (2003) compared hospitals’ relative efficien-cy. Braglia, Zanoni, and Zavanella (2003) studied the productivity of systems.
Therefore, the objective of this paper is to propose a framework for decision-making based on Data Envelopment Analysis (DEA), to estimate the staff sizing in a Brazilian entity responsible for promoting and supporting the competitiveness and sustainable development of micro and small enterprises in Brazil.
The relevance of the company chosen for this study is related to its scope and segment in which it operates in the country. The researched company originated in the public sector and, since 1990, it has been a private and non-profit entity, maintained by the largest companies in the country, in ac-cordance with the law. Considering that in Brazil, most of the formalized companies are micro and small, generating a considerable number of jobs, the role of this entity is essential.
Page 3 of 17
Damasceno Cunha et al., Cogent Business & Management (2018), 5: 1463835https://doi.org/10.1080/23311975.2018.1463835
Data collection was primarily carried out through interviews with managers from the headquar-ters located in Brasilia. It seems important to highlight that the company has service points located in 27 cities of the country, and in its headquarter the new strategies are planned and implemented as a pilot in one city that has 21 units, which were analyzed through DEA. In a second moment, the researchers had access to reports, which served as a basis to the quantitative analysis and modeling process with DEA.
Although there is no consensus of how Strategic Management should be carried out, some prac-tices already exist. Among them, the idea of privileging internal and more qualified recruitment (Devana et al., 1984) can be cited. It stands out as one of the directives of this new management, the allocation of employees who have an expertise in the company and the training for those who do not have the same level of knowledge (Lacombe & Tonelli, 2001).
However, a diagnosis is necessary, in which aspects related to the compatibility of the abilities of each individual with their functions and with the managerial skills for strategic administration are taken into account (Reis, Freitas, Martins, & Oliveira, 2015). Within planning in organizations, the procedure of staff sizing, defined as the estimation of the ideal or optimal number of people needed to develop some organizational process, has consequences to how one might compose their work-force (Ostroff & Schmitt, 1993).
In addition, planning strategies can be classified as: (a) job analysis; (b) professional profiles; (c) staff sizing; and (d) scheduling (Sinclair, 2004). In this context, some of the workforce planning tools can be used: Succession plans (Cappelli, & Keller, 2014); Talent Management (Cappelli & Keller, 2014); Sustainable human resource management (Kramar, 2014); and, Staff Sizing (Tachizawa, 2015). According to Tachizawa (2015), there is no complete methodology in the literature that gives directions and definitions about the size of the staff/workforce within companies.
In this paper, the strategy approached is the staff sizing which can be categorized as a strategy of workforce planning. The results found through DEA showed that among 21 service units analyzed, only three can be considered efficient in terms of staff sizing. Thus, the results point out the need to analyze the reduction of personnel in most of the organization. In this context, the contributions for the entity lie in the discussion on the creation of quantitative indicators and the adoption of an ef-ficiency analysis, which can be used to better estimate or determine the optimal quantity of staff
The innovation of the paper lies in the adoption of a quantitative and systematized approach to estimate the staff sizing, which is the DEA and, in terms of originality of the case study. The results can be useful for practitioners and researchers from developing countries, such as Brics, Caribbean and Mercosul ones. In the case of the current Brazilian scenario of crisis, there is an even greater attention to the need to promote a better management with personnel expenses, in line with stra-tegic planning, because control strategies allow strategically proper adjusted management.
2. Literature review
2.1. Workforce planning and sizing of operational and strategic activitiesThe workforce sizing result-driven approach has transformed organizational spaces, highlighting the performance of employees and the development of their skills within the company, due to the inten-sification of competitiveness. Following this trend that seeks efficiency and valorization of employ-ees, models for staff sizing constitute a fundamental part of accurately identifying personnel allocation needs (Vianna et al., 2013).
In the same way as happens with more common practices, such as the management of compe-tencies, staff sizing should be structured based on a strategic planning of the organization (Carbone, Brandão, & Leite, 2009). In contrast, while competency management aims to identify the
Page 4 of 17
Damasceno Cunha et al., Cogent Business & Management (2018), 5: 1463835https://doi.org/10.1080/23311975.2018.1463835
competencies needed to achieve strategy formulated (Brandão & Bahry, 2005), sizing determines the ideal number of workers for carrying out activities and tasks within each organizational unit so that possible relocations or layoffs can be achieved (Vianna et al., 2013). Therefore, an adequate staff sizing allows not only the hiring of staff for effective positions, but also, for example, an ade-quate hiring of temporary staff or trainees (Davis-Blake & Uzzi, 1993).
In a context in which strategic personnel planning is a central tool it is necessary to conduct a suitable strategy for estimating the size of the staff of an organization. Thus, this process should focus on two main results: (1) subsidize decisions of movements, assignments, promotions, and disconnections; and (2) identify the potentialities and interests of employees in face of the needs of the institution’s units, enabling reallocations. Ideally, in the same way that performance evaluations are carried out, the implementation of a sizing should be constantly improved and give support for fluid and constant decision-making. Finally, the objective of this study is to present an elaborated methodology for sizing the production capacity of a private company, using a non-parametric meth-od of efficiency analysis known as Data Envelopment Analysis (Charnes, Cooper, Lewin, & Seiford, 1997).
For the reasons presented above, it is essential for the public and private company to prepare and guide people (Vieira, 2016). In the process of sizing the productive capacity, it must be considered together with the acquisition of technology, the restructuring of the productive process and the structuring of new management models. Other aspects to be taken into consideration are the pro-cess of improvement, qualification and development of individuals as well as hiring or firing, all of which present organizational dilemmas of planning and adequacy. Thus, this finding allows deci-sion-makers to know the gaps and leftovers in relation to the different career levels or different levels of complexity of the essential processes (Reis et al., 2015).
Considering this context, sizing staff needs, in the long, medium and short term, to ensure the demands and goals of an organization that seek the workforce suitable to the reality of each institu-tion. The basic assumptions of human resource planning will define the guidelines and decisions regarding the feasibility of planning. The identification of the number of people needed to perform a given job had already been used by Taylor since the last century and continues to be a challenge for personnel management professionals. In part due to the fact that the measured reality is complex and the uncertainties of the context, like opportunities and threats in the labor market influence decisions about movements into the institutions (Mascarenhas, 2008).
Staff planning is an aspect normally dealt with by Human Resources or Personnel Management areas, based on mathematical modeling. Planning the staff involves three main types of flows: (i) recruitment; (ii) internal staff flows between different categories of employees (among other promo-tion flows) and waste (Guerry, 2011). Workforce planning is a process designed to ensure that an organization is prepared for its current and future needs, having the right people in the right places at the right times (Jacobson, 2010).
This concept creates a systematic evaluation of the content and composition of an organization workforce to determine the actions that need to be taken to respond to current and future demands to achieve organizational goals and objectives pertaining to personnel management (Jacobson, 2010). The International Personnel Management Association (IPMA), 2002 defines planning as a methodical process that analyzes the current staff/workforce, determining future staff/workforce needs, so that the organization can fulfill its mission, goals and objectives. The five strategic areas commonly covered by workforce planning are: personnel, infrastructure, organizational design, or-ganizational culture, and risk management (Goodman et al., 2015).
2.2. Studies related to staff/workforce planningSome studies on staff/workforce planning have been developed in the last few years, most of them with qualitative approach. In England, a workforce planning policy, “School Workforce Remodeling”
Page 5 of 17
Damasceno Cunha et al., Cogent Business & Management (2018), 5: 1463835https://doi.org/10.1080/23311975.2018.1463835
(Gunter, 2008) was implemented, in which schools should expand the number and change the role of what was traditionally known as support staff.
The use of workforce planning by municipalities in the USA was evaluated by Goodman et al. (2015). That research shows that certain aspects of staff/workforce planning, such as employee re-tirement, long-term recruitment and retention, training and development, have been integrated into the human resources functions of various municipalities. Lewis and Yoon Jik Cho (2011) exam-ined the effects on turnover, institutional memories, diversity, and educational qualifications that the American Community Census, developed employing surveys through the US Office of Personnel Management (OPM) and US MSPB, from 1989 to 2007. They found that retirement of servers, espe-cially in leadership positions and critical occupations has led to negative results related to these issues.
A framework to help project managers to develop an ideal workforce with assignments was pro-posed by Celik et al. (2010), considering the short- and long-term aspects of projects that must be completed through multi-organizational social networks. The study was developed based on the case of the Kuali Foundation, a nonprofit organization in the United States, which was created to facilitate and coordinate community-based software development partnerships between major uni-versities and colleges.
A mathematical programming model for the short-term workforce planning problem was pre-sented by Di Francesco et al. (2016), which can be used for any shift setup. Nayebi et al. (2017), de-termined the required number of nursing staff in an emergency department of a general training hospital in Qazvin, Iran, in 2016. The authors used the WISN method, which is a combination of judgment of specialists and measurement of activity patterns to define workload standards for each category of workforce.
Kroezen et al. (2017) discussed the results of the Joint Action on Health Workforce Planning and Forecasting (JAHWF, 2013–2016) in all current challenges in health workforce planning, terminolo-gy, data availability, model-based planning, and future-based planning and collaboration.
The traditional workforce planning models determine the size and experience levels required to support production and are generally based on the aggregate planning model from Operational Research. In this framework, a sufficient level of workforce must be maintained to provide the ser-vices of the system under study. However, in order to maintain a balanced workforce, one should try to minimize the use of overtime, which is usually included in the objective function (Jennings & Shah, 2014). In such framework, staff sizing can be used as a strategy in order to estimate or determine the quantity of workforce needed to accomplish a given task or activity. The staff sizing concept is detailed in the next section.
2.3. Staff/workforce sizingOrganizations that can predict the need for personnel both quantitatively and qualitatively in an environment of uncertainty gain a great competitive advantage (Marconi, 2003). The adequate staff/workforce sizing is a systematic and continuous process of assessing the current and future needs of human resources, regarding the ideal number of workers and the composition of employ-ees’ profiles (Tachizawa, 2015). The result of a sizing indicates the correct number of people with the appropriate skills, competencies and aptitude to perform the correct assignments at the right time and place (Rodrigues, Oliveira, & Lima, 2015).
The definition of the composition of personnel and the strategic approach to personnel manage-ment are understood to obtain the results of the use of competitive advantage, planning, coherence between policies, employment practices and business strategy, and decision-making on aspects of the employment relationship at the highest hierarchical level. The scenario of managing people with strategic corporate actions results in the alignment between actions and organizational goals. In
Page 6 of 17
Damasceno Cunha et al., Cogent Business & Management (2018), 5: 1463835https://doi.org/10.1080/23311975.2018.1463835
this perspective, the human resources management model focuses on elements such as valuation of human talent, attraction and maintenance of people, motivation and mobility, diagnosis, infor-mation management, and integrated policies (Lacombe & Chu, 2008).
It is worth highlighting a relevant point among the advantages of staff sizing. After planning the necessary framework and attracting the professional relevant to the vacancy, it is necessary that personnel management be prepared to support their development and post-selection adaptation. From a strategic point of view, being clear about an organization’s value chain is the basis for inter-nal analysis that guides the planning process by recognizing available resources as well as vulnera-bilities. In this context, the staff-sizing model is a technique to identify the skill gaps necessary to achieve strategic objectives and, thus serve as input to the strategies for the provision and develop-ment of the staff. The constant evaluation of human capital allows even greater synergy between the organizational values and its employees, insofar as it shows the expected competencies, experi-ence and degree of commitment (Morrow, Jackson, Disch, & Mood, 2014).
Another relevant point in the composition of the workforce dimensioning refers to the interrela-tions of the productive capacity between the execution time of the demands, the absence of the employee, reliability of the service, complexity and the percentage of productive capacity. In the meantime, issues related to the labor supply are indicated as being preponderant factors for the calculation of an optimal number of employees. Thus, the classic problem of productive capacity planning as described by Koutsopoulos and Wilson (1987) and by Hickman, Koutsopoulos, and Wilson (1988) refers to the unit cost of employees and absenteeism that impact on the institution’s budget. The result of the problem will comprise the size and composition of the staff/workforce in the planning horizon.
To solve this problem of inefficiency, the economic theory suggests models in which the level of work is defined in the employee’s hiring. In this case, the decision variables of the model are the regular workforce available to perform the job, which consists of employees whose responsibility is the execution and fulfillment of goals and tasks. If the total cost per hour of work was lower for a worker who works more hours than for an employee who works regular time, then the solution would be to rely heavily on overtime or hire new employees to fill missing jobs. This solution is com-mon in Brazil in some sectors of economy, mainly due to the high cost of additional benefits applied to employees who work on a regular basis.
The greater the confidence in working hours is, the greater the number of situations in which no employee will be willing to work more hours during the week is, and the institution will achieve the fulfillment of its goals. Whenever this does not occur, service reliability will be affected, which in it-self is an important determinant of the results achieved, so it can be expected to affect the results to be achieved by the institution. Even, when workforce is available, replacement employees may not be familiar with their routines and designated processes, resulting in delays in service and lack of reliability. On the other hand, some employees may be more likely to decrease their effort after reaching a weekly wage limit, and this level can be reached after a few hours of work. Other employ-ees may reduce their level of effort for other reasons such as absenteeism. For the composition of this paper, we considered factors as such as, complexity of work, effort employed, percentage of productive capacity, such as those defined by Nicholson (1977), Fichman (1984), Dilts, Deitsch, and Paul (1985).
Firstly, the decrease in effort is an approach-avoidance behavior. This research is based on this premise (Beehr & Gupta, 1978; Gupta & Jenkins, 1982), as most of the work based on job satisfaction is (Steers & Rhodes, 1978). Occupational stress can also be included in this category. Then, the decrease in effort is the result of a decision process. The expectancy theory (Vroom, 1964) and some attitude models (Ajzen & Fishbein, 1977) are decision models in which the most attractive action or object is chosen. In the idealized model, the person decides on a given day to participate or not in the work impacting productivity. According to the economic theory and using the utility

Page 7 of 17
Damasceno Cunha et al., Cogent Business & Management (2018), 5: 1463835https://doi.org/10.1080/23311975.2018.1463835
maximization model or work-leisure trade-offs there are other useful examples for optimal labor basket composition (Allen, 1981; Chelius, 1981).
Lastly, reducing effort is a habit. The habit is implicit in the frequent observation that some work-ers are responsible for decreased production. Predicating on the basis of the past is consistent with the habit hypothesis but does not directly support it (Breaugh, 1981; Morgan & Herman, 1976; Waters & Roach, 1979). Thus, the management model is determined by the way in which a company organizes and guides the behavior of the employees’ production in order to minimize the reduction of the allocated effort and thus achieve production goals following the strategic directions. It is im-portant to point out that, what distinguishes a management approach from another is its ability to propose innovations proper to its organizational maturity (Carneiro, 2000).
It is worth noting that employees maximize their utility, which consists of income and production, so that employees face the budget constraint and the time restriction. The time constraint indicates that the total time in the period under consideration should be equal to the sum of the contracted number of work hours, hours worked as overtime hours, leisure hours, illnesses and other situations described in the CLT—Consolidation of work laws in Brazil, or specific law that include hours (Leisure hours include all activities that are not working time, for example: family activities and duties, sleep, etc.).
Thus, products or services are the items that make up the unit’s portfolio and reflect the unit’s contribution to the achievement of organizational objectives and strategies. Such products or ser-vices may serve the end customers, Federative Units, Government or internal customers. While the outcomes are groupings of assignments that make up the services/products of the unit and the as-signments are the set of activities necessary for an outcome to take place. An outcome can have multiple assignments in different amounts. Assignments should highlight “what to do” rather than “how to do”. In this way, macroprocess is defined as a set of processes executed in an orderly way, in one or more units, of wide aspect and necessary to the achievement of organizational goals and objectives (Nicoluci, Ferreira, & de Mogi Mirim, 2012). The integration between the macroprocess of an organization is fundamental for its competitiveness in the market. Every macroprocess defined must have a reason to exist, products and services generated, someone responsible for its execu-tion, and customers and suppliers to its production line (Carpinetti, 2000).
Another relevant point for this research is the understanding and distinction of concepts pre-sented in the production engineering literature, in which the distinction between the concepts of ef-ficacy and efficiency is one of the most common (Ferreira & Gomes, 2009). The first concept deals with the simple accomplishment of a task: a work is efficacious if it reaches its objective. The concept of efficiency evolves from the concept of efficacy, adding that not only must the objective be achieved, but it also must be achieved with an optimal relation between inputs and outputs.
A widely spread measure of efficiency is presented by Farrell (1957), known as “Farrell`s efficiency”, where the level of efficiency of a company is measured by the distance between the production ob-served and what would be its optimal production. Among the many methodologies developed, DEA stands out as one of the main operational research techniques (Fethi & Pasiouras, 2010). The DEA technique is detailed as follows.
2.4. Efficiency of organizational sizing with DEADEA is an inferential analysis technique, based on linear programming (Charnes et al., 1997). Its mechanism starts with the definition of a frontier of production possibilities, analyzing only the tech-nical efficiency, defined as the capacity to change the quantity of inputs due to what is produced, or to change what is produced due to what is consumed. This feature is especially convenient for ser-vices in general, given that, in this context, the distinction between input and output is not always well defined (Golany & Roll, 1989) and, it is often not possible to change the quantity of inputs or

Page 8 of 17
Damasceno Cunha et al., Cogent Business & Management (2018), 5: 1463835https://doi.org/10.1080/23311975.2018.1463835
outputs that are generated. In this analysis, the monetary value of the inputs and outputs is not necessarily considered.
The model does not demand the need for functional relations between inputs and products and is not restricted to single, unique measures of inputs and outputs either (Ferreira & Gomes, 2009). Therefore, it can be labeled as a nonparametric method of analysis, with gives it some advantages over parametric methods, such as Stochastic Frontier Analysis (Afonso & St Aubyn, 2005).
DEA works through benchmarking comparisons (Cooper, Seiford, & Zhu, 2004) of individual cases with an exemplar case, which is closer to the production frontier. It is widely used in several contexts such as, comparisons among hospitals relative efficiency (Biørn et al., 2003) and productivity of sys-tems (Braglia et al., 2003). Banker (1984) reported that DEA can determine the optimal scale in a production process inside hospitals using as inputs: nursing service hours, general service hours, ancillary service hours and number of beds. Many others used number of employees as a factor re-lated to performance efficiency (Mahajan, 1991; Yu & Lin, 2008).
From this, comparing efficiency within a company when comparing procedurally similar organiza-tional units can result in workforce sizing. Since the primary focus of sizing is to calculate the re-quired number of people to perform a task, the number of people in each area has been calculated. This indicator is considered the input for the DEA. This means that, it is necessary to create an index that serves as output, oriented to the organizational objective of generating more organizational value.
In order to identify and quantify the efficiency of equivalent organizational units in staff alloca-tion, an applied, descriptive and quantitative study was carried out. It was divided into five parts. A brief introduction to the objectives is given first. Secondly, the theoretical reference is presented. Then, the methods and techniques of the research with its implementation stages and applied mathematical model are presented. Finally, the results and discussions related to the methodologi-cal and theoretical procedures used are presented.
3. Method–Design and proceduresThis research is classified as applied, descriptive and quali-quantitative. The case study and the model were used as strategy of study. In this sense, two main theoretical tools were used: the map-ping of employees’ technical skills (Barduchi & Miglinski, 2015); and the use of a non-parametric method of efficiency analysis known as DEA. The case study was carried out in a private, non-profit entity under public law, and maintained by resources from the largest companies in the country, proportional to the value of their payrolls.
The origin of the entity was in the public sector, from which it was separated in 1990. The entity is responsible to promote and support the competitiveness and sustainable development of micro and small enterprises in Brazil. The organization researched has a focus on strengthening entrepreneur-ship and accelerating the process of formalization of the economy through partnerships with the public and private sectors, promoting training programs, access to credit and innovation and en-couraging partnership.
This entity has been in operation for over 45 years in Brazil throughout the entire country and has service points in the 27 federal units. In this paper, the unit researched is the national headquarter, located in Brasilia, which maintains the top managers and, usually, implements practices that serve as a pilot for the other units of the federation. For the purpose of this paper, documents related to 21 units were judgmentally sampled and analyzed in order to determine its efficiency in terms of staff sizing in one federal unit during the year of 2017. It is important to emphasize that it is the only entity operating in this segment with this scope in the country and has a total of 512 employees. Particularly in Brazil, the role of this entity is very important, considering that in the Brazilian
Page 9 of 17
Damasceno Cunha et al., Cogent Business & Management (2018), 5: 1463835https://doi.org/10.1080/23311975.2018.1463835
economy, the micro and small companies represent 99% of the total number of existing establish-ments and account for around 40% of the paid employees in private companies.
First of all, the data collection and the quantitative estimation of the efficiency of its units were carried out through interviews and documental analysis. The interviewers and documents were cho-sen under the criteria of accessibility and representativeness. For the collection of primary data, in-terview scripts were used to access information about the attributions of the products and services. First, the 21 managers were interviewed and information about the work performed at the units was collected. The interviewees were then interviewed and briefed on the position, competencies and activities each of them performed.
The interviews were aimed at identifying the specific technical competencies of each unit within the institution, in order to ensure that each unit was compared to units that have qualitatively simi-lar goals. Therefore, greater precision is reached in the evaluation processes, and as a consequence, it specifies the measurement model for outcomes and expected results, used in DEA.
Data analysis took place in two stages. First, a Productivity Capacity Index (PCI) was created per unit. For modeling the PCI, information was collected about the complexity of each task, the amount of times the task is done during a year and how much dedication each employee devotes to it. Subsequently, this index was used for efficiency analysis using DEA. The focus of the analysis using DEA is the comparison between the DMUs that will be used. All modeling process and the relation-ship between variables are detailed below.
4. Data analysis: Productivity capacity indexAs in the construction of any mathematical model, or economic indicators of production, for the construction of the PCI a series of assumptions was established. The first assumption addresses the productive potential of the employees of the sizeable institution. Since all employees are at a me-dium level and more than 93% are at a higher level, the productive potential of each employee is considered constant. The second assumption refers to the outcomes used. The variability between unit and occupational spaces indicates that the outcome does not have the same nature or level of complexity (Klein, Dansereau, & Hall, 1994).
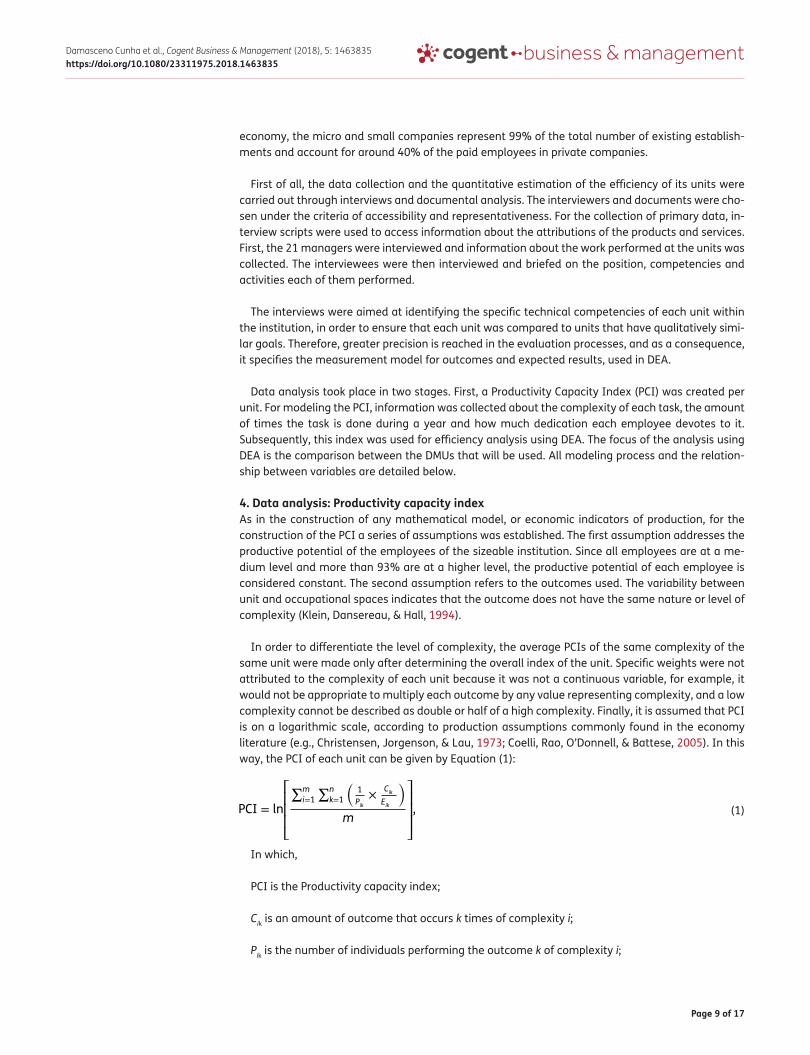
In order to differentiate the level of complexity, the average PCIs of the same complexity of the same unit were made only after determining the overall index of the unit. Specific weights were not attributed to the complexity of each unit because it was not a continuous variable, for example, it would not be appropriate to multiply each outcome by any value representing complexity, and a low complexity cannot be described as double or half of a high complexity. Finally, it is assumed that PCI is on a logarithmic scale, according to production assumptions commonly found in the economy literature (e.g., Christensen, Jorgenson, & Lau, 1973; Coelli, Rao, O’Donnell, & Battese, 2005). In this way, the PCI of each unit can be given by Equation (1):
In which,
PCI is the Productivity capacity index;
Cik is an amount of outcome that occurs k times of complexity i;
Pik is the number of individuals performing the outcome k of complexity i;
(1)PCI = ln
⎡⎢⎢⎢⎣
∑m
i=1
∑n
k=1
�1
Pik×
Cik
Eik
�
m
⎤⎥⎥⎥⎦,

Page 10 of 17
Damasceno Cunha et al., Cogent Business & Management (2018), 5: 1463835https://doi.org/10.1080/23311975.2018.1463835
Eik is the effort measured in hours on outcome k of complexity i;
n is the number of outcome types performed;
m is the maximum complexity level stipulated for area outcomes.
With PCI being used as output and the number of people as input, it is possible to compare the units in relation to their efficiency through input-oriented DEA and to estimate the efficient quantitative of the workforce in each unit. It is worth mentioning that the method used makes it possible to cal-culate the comparative efficiency of production units, called Decision-Making Units (DMUs). Weak assumptions regarding the frontier of production technology and the axioms (Fare, Grosskopf, & Lovell, 1994) enable this approach to compare multiple inputs and outputs. Also, this means that the focus of the analysis will be dependent on which organizational dimension one intends to act on: inputs or outputs. For example, if the number of people is the input and ICP is the output, and the goal is to know which organizational unit is most efficient in the use of its personnel, then an input-oriented analysis should be carried out.
4.2. Data analysis: DEATo use DEA, one must first establish which production frontier will be used. According to the theory, for each DMU, technology transforms nonnegative inputs xk = (xk1,… , xkN) ∈ R
N+ into non-negative
products yk = (yk1,… , ykN) ∈ RN+. When the measure of technical efficiency is input-oriented, technol-
ogy is represented by the set of production possibilities T = {(x, y): x can produce y}, which includes all vectors of feasible inputs and outputs. The correspondence of inputs to the DEA reference technology, characterized by Constant Return to Scale (CRS) and the existence of free disposition of inputs (strong disposability, S), defines the linear technology, built from the combinations of inputs and outputs:
The matrix M with dimension k × m has m products observed in k DMUs; N represents the matrix k × n with n inputs; and z is the vector 1 × k of the parameters. For each activity, the technical efficiency in the inputs, Fi, can be defined as
Consequently, this measure of radial efficiency varies between 0 and 1. Efficient production has a score equal to a unity. Thus, (1 − θ) represents the proportion at which inputs can be reduced without changing production. Using the technology specified in (2), the technical efficiency (input oriented) for agency k can be calculated as the solution of the following linear programming problem:
According to DEA, the model presented implies strong constraints on the production, the existence of constant returns of scale (the increase in the number of inputs causes a proportional increase in the outputs, when a DMU is operating in its optimal capacity) being known as CCR model (Charnes, Cooper, & Rhodes, 1978) or CRS. This assumption can be easily relaxed by modifying the constraints on the intensity vector z. Fare et al. (1994) extended this technique to include the existence of de-creasing returns (DRS - Decreasing Return to Scale). For this, the following restriction was added to the problem (4):
(2)L(y�CRS, S
)= { x:y ≤ zM, zN ≤ x, z ∈ Rk
+, y ∈ Rk
+}
(3)F(yk, xk�CRS, S
)= min{ �:�x ∈ L
(yk�CRS, S
)}
(4)
��= min(�); Subject to
�xkm≥
K∑j=1
zkjxjn , n = 1, 2, 3, 4,… ,N
ykm ≥
K∑j=1
zkjyjm , m = 1, 2, 3, 4,… ,N
�, Zkj ≥ 0 , j = 1, 2, 3, 4,… , N

Page 11 of 17
Damasceno Cunha et al., Cogent Business & Management (2018), 5: 1463835https://doi.org/10.1080/23311975.2018.1463835
Thus, it is inferred that the sum of the intensity variables cannot exceed unity, which implies that the different activities cannot be expanded infinitely. In the presence of Variable Return to Scale (VRS), the model proposed by Banker, Charnes, and Cooper (1984) considers that activities cannot be ex-panded without limit, nor contracted at source. Thus, increasing returns, that is, the increase in the number of inputs causes a disproportionally greater increase in the number of outputs, which occurs when a DMU is operating well below its optimum capacity, for the low levels of production and de-creasing returns to the highest levels. In this model, called DEA-BCC (or DEA-VRS), efficiency indices are obtained by imposing equality to the constraint (5). Figure 1 graphically represents the differ-ences between BCC and CCR boundaries for a two-dimensional DEA (1 input and 1 output). DMUs A, B, and C—are efficient BCC; the DMU B is efficient CCR. DMUs D and E are inefficient in both models.
One can understand, therefore, that the BCC model proposes to compare only DMUs that operate in a similar scale. This has the consequence that the efficiency of a DMU is obtained by dividing its productivity by the higher productivity among the DMUs that have the same type of return to scale. Thus, the BCC frontier presents straight lines of varying angles, which characterizes a linear bound-ary by parts (Mello, Lins, & Gomes, 2002). Finally, the model analyzed here has an input orientation and VRS assumption about the production frontier, in order to ensure that the optimal number of employees is determined to generate the current ICP and that the DMUs are compared in the same measurement scale, respectively.
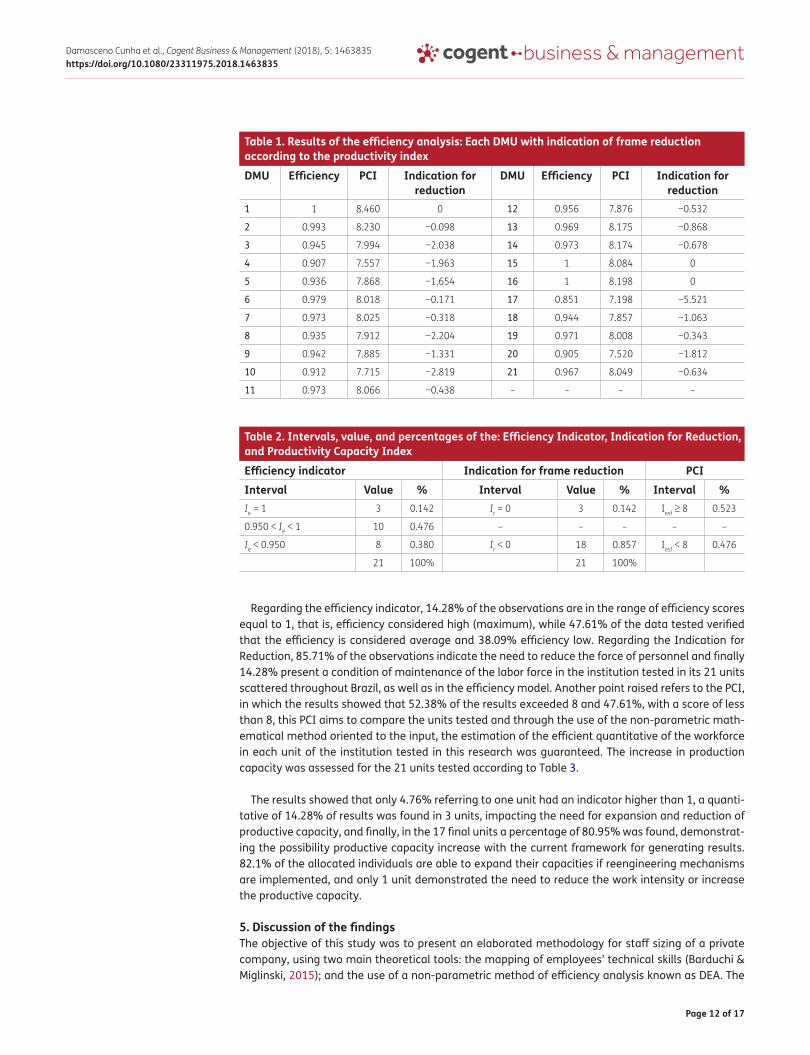
The use of DEA allowed the estimation of existing gaps between the current staff and the capacity to meet the current and future demands of each unit, based on quantitative criteria. The results that pointed to a distance between the current staff and a quantitative reduction in 18 of the 21 units are presented in Table 1.
In addition to identifying the efficient DMUs, the DEA models were seen to allow the measurement and location of inefficiency and to estimate a piecemeal production function, which provides the benchmark for the inefficient DMUs. This benchmark is determined by the projection of inefficient DMUs at the efficiency frontier. The way in which this projection is done determines orientation of the model: orientation to inputs (when it is desirable to minimize inputs, keeping output values con-stant) and orientation to outputs (when it is desirable to maximize results without cutting resourc-es). Table 2 shows the intervals of efficiency scores, the indication for reduction of the workforce and the effort index in the institution object of this simulation.
(5)K∑j=1
zkj ≤ 1, j = 1, 2, 3,… , K; k = 1… .K
Figure 1. DEA production boundary.
Page 12 of 17
Damasceno Cunha et al., Cogent Business & Management (2018), 5: 1463835https://doi.org/10.1080/23311975.2018.1463835
Regarding the efficiency indicator, 14.28% of the observations are in the range of efficiency scores equal to 1, that is, efficiency considered high (maximum), while 47.61% of the data tested verified that the efficiency is considered average and 38.09% efficiency low. Regarding the Indication for Reduction, 85.71% of the observations indicate the need to reduce the force of personnel and finally 14.28% present a condition of maintenance of the labor force in the institution tested in its 21 units scattered throughout Brazil, as well as in the efficiency model. Another point raised refers to the PCI, in which the results showed that 52.38% of the results exceeded 8 and 47.61%, with a score of less than 8, this PCI aims to compare the units tested and through the use of the non-parametric math-ematical method oriented to the input, the estimation of the efficient quantitative of the workforce in each unit of the institution tested in this research was guaranteed. The increase in production capacity was assessed for the 21 units tested according to Table 3.
The results showed that only 4.76% referring to one unit had an indicator higher than 1, a quanti-tative of 14.28% of results was found in 3 units, impacting the need for expansion and reduction of productive capacity, and finally, in the 17 final units a percentage of 80.95% was found, demonstrat-ing the possibility productive capacity increase with the current framework for generating results. 82.1% of the allocated individuals are able to expand their capacities if reengineering mechanisms are implemented, and only 1 unit demonstrated the need to reduce the work intensity or increase the productive capacity.
5. Discussion of the findingsThe objective of this study was to present an elaborated methodology for staff sizing of a private company, using two main theoretical tools: the mapping of employees’ technical skills (Barduchi & Miglinski, 2015); and the use of a non-parametric method of efficiency analysis known as DEA. The
Table 1. Results of the efficiency analysis: Each DMU with indication of frame reduction according to the productivity indexDMU Efficiency PCI Indication for
reductionDMU Efficiency PCI Indication for
reduction1 1 8.460 0 12 0.956 7.876 −0.532
2 0.993 8.230 −0.098 13 0.969 8.175 −0.868
3 0.945 7.994 −2.038 14 0.973 8.174 −0.678
4 0.907 7.557 −1.963 15 1 8.084 0
5 0.936 7.868 −1.654 16 1 8.198 0
6 0.979 8.018 −0.171 17 0.851 7.198 −5.521
7 0.973 8.025 −0.318 18 0.944 7.857 −1.063
8 0.935 7.912 −2.204 19 0.971 8.008 −0.343
9 0.942 7.885 −1.331 20 0.905 7.520 −1.812
10 0.912 7.715 −2.819 21 0.967 8.049 −0.634
11 0.973 8.066 −0.438 – – – –
Table 2. Intervals, value, and percentages of the: Efficiency Indicator, Indication for Reduction, and Productivity Capacity IndexEfficiency indicator Indication for frame reduction PCIInterval Value % Interval Value % Interval %Ie = 1 3 0.142 Ir = 0 3 0.142 Iesf ≥ 8 0.523
0.950 < Ie < 1 10 0.476 – – – – –
Ie < 0.950 8 0.380 Ir < 0 18 0.857 Iesf < 8 0.476
21 100% 21 100%

Page 13 of 17
Damasceno Cunha et al., Cogent Business & Management (2018), 5: 1463835https://doi.org/10.1080/23311975.2018.1463835
results showed that there is a need to reduce the personnel in most of the organization. It is worth noting that, using a method of efficiency estimation, only in very specific contexts–such as the esti-mation of superefficiency (Avkiran, 2011)—it is possible to observe a need to increase the picture.
Also, it is understood that the method employed works heuristically as follows: it observes the relation between inputs and outputs, defines where the optimal units should be, ranks the observed units, defines the quantity of inputs (expressed by the number of people) to be reduced in the units that have not been completely efficient. However, like every model that tries to explain a reality, it presents a series of limitations and distortions in the results. One of the reasons that generates dis-tortions is the monthly variation that each outcome presents and the limitation as to the accuracy that the employees have to express their percentage of dedication.
It is important to consider the need to enlarge or reduce the staff, since the comparison of the current situation with the desired situation through the DEA model allows the decision makers to check the gaps and the leftovers in relation to the framework and also to the complexity of the es-sential processes. To fill these gaps, the organization may promote trainings, hire staff, or service providers (Neri, 1999). Also, in the case of an excess contingent, the transfer of people or even their dismissal as a mechanism of budget cuts should be evaluated in order to maintain and consolidate the institution.
Some observations have to be made about the range of problems that can be solved using the proposed method. DEA diagnoses units that are below the possible target of efficiency because it establishes the most efficient units (in the frontier) and, then, compares the other units. This implies that it will always show only the need to reduce the size of the workforce. A solution to this problem may be the use of models of super efficiency (Seiford & Zhu, 1999), which can estimate unities with efficiencies higher than 1. Nevertheless, more problems can arise with the application of those mod-els (Li, Jahanshahloo, & Khodabakhshi, 2007; Mehrabian, Alirezaee, & Jahanshahloo, 1999). The method proposed also uses only one composed indicator, which may cause information loss and possibly over or underestimation (Smith, 1997). Future studies should use the literature on sizing and production to be able to create a model with several other indicators that could be transformed to corroborate with the understanding and estimation of the ideal number of workers (Rocha & Morais, 2009).
A multidimensional performance model that encompasses several dimensions of performance as synonymous with outcome, which could be observed in whatever occupational positions, would be ideally implemented. The model proposed by Viswesvaran, Schmidt, and Ones (2005) offers subsi-dies for this type of measurement. The scaling model sought to simplify an extremely complex real-ity that is organizational. Despite the possibility of implementations, the results enabled the presentation of information that objectively guides decisions on allocation, dismissal and the like.
The results led to the conclusion that there is a need to reflect, structure and develop methods that can lead not only to quantitative outcomes, but also promote discussion about the reconfigura-tion of organizational processes which affect the real needs of workers. Institutions and the popula-tion are within the scope of action of the categories involved. Assisted by will and support, where the institutionalization of a work management policy can guide the implementation of managerial tools
Table 3. Increase in production capacityInterval Unit Percentage Individuals PercentageAcap ≥ 1 1 0.04762 4.76% 37 0.0848 8.48%
Acap = 0 3 0.14286 14.28% 41 0.0940 9.40%
Acap < 1 17 0.80952 80.95% 358 0.8211 82.1%
21 1 100% 436 1 100%

Page 14 of 17
Damasceno Cunha et al., Cogent Business & Management (2018), 5: 1463835https://doi.org/10.1080/23311975.2018.1463835
and, mainly, contribute to the understanding of the subjective factors of the care actions by the institution.
The role of research in face of the challenges of labor management problems is fulfilled, as well as the need to invest in the improvement and management of labor force information, both quantita-tively and qualitatively. It must rely on an information system that is capable of providing strategic information to the employees of an institution, in which it deserves full attention for its facilitating and contributing potential in the recognition, identification and analysis of the workforce.
6. Concluding remarksConsidering that thinking human resources strategically is a trend, this research presents findings related to the importance of the integration of qualitative and quantitative research in order to esti-mate or determine staff sizing. The main purpose is providing relevant elements and information to managers in decision-making processes related to staff sizing. In this paper, specifically considering the particularities of the entity studied, which acts promoting competitiveness and supporting micro and small companies in Brazil, whose economy and employment generation are concentrated on small businesses.
Nevertheless, it is important to point out some limitations of this study. First of all, the case study does not allow generalizations, some results can be similar to micro and small companies from other developing countries, however, the particularities of Brazil can be considered. The application of the study only in the headquarters of the entity under study can be also considered a limitation. Although this unit can be considered representative, since the strategies to be adopted in the other units throughout the country are first analyzed in this unit, it can be highlighted as a limitation. The utilization of DEA as a single quantitative approach to estimate staff sizing can be also considered a limitation of this study. Another limitation was the distortions caused by the monthly variation that each outcome presents and the limitation as to the accuracy that the employees have to express their percentage of dedication. The method proposed also uses only one composed indicator, which may cause information loss and possibly over or underestimation (Smith, 1997).
Future studies can conduct surveys with managers from all 27 service points of the studied entity throughout the country, in order to test the results of this research. Qualitative research with man-agers from other units can also be conducted in order to compare results obtained in this research. Further research can also investigate the reality of micro and small companies in terms of staff siz-ing in emerging economies and other developing and developed countries. In this sense, some com-parative studies can be developed in order to analyze the practices carried out in developing vs developed countries. The utilization of other approaches to estimate or determine staff sizing can also be used in this context such as, Multicriteria decision-aid approach, Markov chains, Linear Programming and Stochastic models, and others. Finally, future studies should use the literature on sizing and production to be able to create a model with several other indicators that could be trans-formed to corroborate with the understanding and estimation of the ideal quantity of personnel (Rocha & Morais, 2009).
To the best of our knowledge, this is the first paper using DEA in the context of staff sizing. Thus, the main contribution of this paper lies in the adoption of a quantitative and systematized approach to estimate the staff sizing problem, which is the DEA. Another contribution lies in the study of a larger entity, which is the only one to operate in the segment, supporting micro and small compa-nies throughout Brazil. In terms of the case study, considering that Brazil has a significant role in the Mercosul – Mercado Comum do Sul (South Common Market, comprising Argentina, Brazil, Paraguay and Uruguay), representing 75% of the economy and population, the results can be relevant to these countries for providing insights related to the promotion of micro and small businesses.
On the other hand, it is important to highlight that when compared to Brics (Brazil, Russia, India, China and South Africa), Brazil presents more differences than similarities, mainly related to

Page 15 of 17
Damasceno Cunha et al., Cogent Business & Management (2018), 5: 1463835https://doi.org/10.1080/23311975.2018.1463835
common interests, incentives to trading, infrastructure and others. Nevertheless, the Brazilian real-ity, in terms of small businesses, can be compared with other developing countries such as the Caribbean and the Mercosul ones. In this sense, some practices related to staff sizing can also be useful for these developing countries. For practitioners, the framework presented in this paper can be useful as a staff sizing model for micro and small companies, considering the particularities of the case studied. For researchers, this paper can provide insights for further studies related to the utiliza-tion of staff sizing systematized models. Other framework or approaches can be compared with the DEA approach in order to analyze its strengths and weaknesses. The issue related to policies regard-ing staff sizing aimed to micro and small companies in developing countries can be also focus of investigation.
Author detailsRaissa Damasceno Cunha1
E-mail: [email protected] ID: http://orcid.org/0000-0002-5310-8854Andre Luiz Marques Serrano2
E-mail: [email protected] ID: http://orcid.org/0000-0001-5182-0496Vithor Rosa Franco1
E-mail: [email protected] ID: http://orcid.org/0000-0002-8929-3238Patricia Guarnieri3
E-mail: [email protected] ID: http://orcid.org/0000-0001-5298-53481 Doctoral student in Psychology in the Post-graduation
Program in Social Psychology of the Work and Organizations (PSTO), Universidade de Brasilia (UnB), Campus Universitario Darcy Ribeiro, Predio da FACE, Asa Norte CEP, 70.910-900, Brasilia, DF, Brasil.
2 Department of Business Administration in Faculty of Economics, Administration, Accounting and Public Policies Management (FACE), Universidade de Brasilia (UnB), Address: Campus Universitario Darcy Ribeiro, Predio da FACE, Asa Norte CEP, 70.910-900, Brasilia, DF, Brasil.
3 Department of Business Administration in Faculty of Economics, Administration, Accounting and Public Policies Management (FACE), Universidade de Brasilia (UnB), Campus Universitario Darcy Ribeiro, Predio da FACE, Sala 111-7, 1. Andar, bloco A4, Asa Norte CEP, 70.910-900, Brasilia, DF, Brasil.
Citation informationCite this article as: Staff sizing as a mechanism of efficiency: An application of a non-parametric method, Raissa Damasceno Cunha, Andre Luiz Marques Serrano, Vithor Rosa Franco & Patricia Guarnieri, Cogent Business & Management (2018), 5: 1463835.
ReferencesAfonso, A., & St Aubyn, M. (2005). Non-parametric approaches
to education and health efficiency in OECD countries. Journal of Applied Economics, 8(2), 227.
Ajzen, I., & Fishbein, M. (1977). Attitude-behavior relations: A theoretical analysis and review of empirical research. Psychological Bulletin, 84(5), 888. https://doi.org/10.1037/0033-2909.84.5.888
Allen, S. G. (1981). Compensation, Safety, and Absenteeism: Evidence from the Paper Industry. ILR Review, 34(2), 207–218. https://doi.org/10.1177/001979398103400203
Avkiran, N. K. (2011). Association of DEA super-efficiency estimates with financial ratios: Investigating the case for Chinese banks. Omega, 39(3), 323–334. https://doi.org/10.1016/j.omega.2010.08.001
Banker, R. D. (1984). Estimating most productive scale size using data envelopment analysis. European Journal of Operational Research, 17(1), 35–44. https://doi.org/10.1016/0377-2217(84)90006-7
Banker, R. D., Charnes, A., & Cooper, W. W. (1984). Some models for estimating technical and scale inefficiencies in data envelopment analysis. Management Science, 30(9), 1078–1092. https://doi.org/10.1287/mnsc.30.9.1078
Barduchi, A. L. J., & Miglinski, C. A. (2015). Planejamento estrategico de recursos humanos. Revista de Ciências Gerenciais, 10(12), 119–127.
Beehr, T. A., & Gupta, N. (1978). A note on the structure of employee withdrawal. Organizational Behavior and Human Performance, 21(1), 73–79. https://doi.org/10.1016/0030-5073(78)90040-5
Biørn, E., Hagen, T. P., Iversen, T., & Magnussen, J. (2003). The effect of activity-based financing on hospital efficiency: A panel data analysis of DEA efficiency scores 1992–2000. Health Care Management Science, 6(4), 271–283. https://doi.org/10.1023/A:1026212820367
Braglia, M., Zanoni, S., & Zavanella, L. (2003). Measuring and benchmarking productive systems performances using DEA: An industrial case. Production Planning & Control, 14(6), 542–554. https://doi.org/10.1080/09537280310001621994
Brandão, H. P., & Bahry, C. P. (2005). Gestão por competências: Metodos e tecnicas para mapeamento de competências. Revista do Serviço Público, 56(2), 179
Breaugh, J. A. (1981). Relationships between recruiting sources and employee performance, absenteeism, and work attitudes. Academy of Management Journal, 24(1), 142–147. https://doi.org/10.2307/255829
Cappelli, P., & Keller, J. R. (2014). Talent management: Conceptual approaches and practical challenges. Annual Review of Organizational Psychology and Organizational Behavior, 1(1), 305–331.
Carbone, P. P., Brandão, H. P., & Leite, J. B. D. (2009). Gestão por competências e gestão do conhecimento. Brazil: FGV.
Carneiro, A. (2000). How does knowledge management influence innovation and competitiveness? Journal of Knowledge Management, 4(2), 87–98. https://doi.org/10.1108/13673270010372242
Carpinetti, L. C. (2000). Proposta de um modelo conceitual para o desdobramento de melhorias estrategicas. Gestão & Produção, 7(1), 29–42. https://doi.org/10.1590/S0104-530X2000000100003
Celik, N., Xi, H., Xu, D., & Son, Y. J. (2010). Simulation-based workforce assignment considering position in a social network. In Simulation Conference (WSC), Proceedings of the 2010 Winter (pp. 3228–3240).
Charnes, A., Cooper, W. W., & Rhodes, E. (1978). Measuring the efficiency of decision making units. European Journal of Operational Research, 2(6), 429–444. https://doi.org/10.1016/0377-2217(78)90138-8
Charnes, A., Cooper, W., Lewin, A. Y., & Seiford, L. M. (1997). Data envelopment analysis theory, methodology and applications. Journal of the Operational Research Society, 48(3), 332–333. https://doi.org/10.1057/palgrave.jors.2600342
Chelius, J. R. (1981). Understanding absenteeism: The potential contribution of economic theory. Journal of Business Research, 9(4), 409–418. https://doi.org/10.1016/0148-2963(81)90016-3
Page 16 of 17
Damasceno Cunha et al., Cogent Business & Management (2018), 5: 1463835https://doi.org/10.1080/23311975.2018.1463835
Chen, P. S., Lin, Y. J., & Peng, N. C. (2016). A two-stage method to determine the allocation and scheduling of medical staff in uncertain environments. Computers & Industrial Engineering, 99, 174–188. https://doi.org/10.1016/j.cie.2016.07.018
Christensen, L. R., Jorgenson, D. W., & Lau, L. J. (1973). Transcendental logarithmic production frontiers. The Review of Economics and Statistics, 28–45. https://doi.org/10.2307/1927992
Coelli, T. J., Rao, D. S. P., O’Donnell, C. J., & Battese, G. E. (2005). An introduction to efficiency and productivity analysis. Berlin: Springer Science & Business Media.
Cooper, W. W., Seiford, L. M., & Zhu, J. (2004). Data envelopment analysis. In Cooper, W. W., Seiford, L. M., & Zhu, J. (Eds.), Handbook on data envelopment analysis (vol. 71). Boston, MA: Springer.
Davis-Blake, A., & Uzzi, B. (1993). Determinants of employment externalization: A Study of temporary workers and independent contractors. Administrative Science Quarterly, 38, 195–223. https://doi.org/10.2307/2393411
Devana, M. A., Fombrun, C., & Tichy, N. M. (1984). Strategic human resource management. New York, NY: John Wiley & Sons.
de la Torre, R., Lusa, A., & Mateo, M. (2016). A MILP model for the long term academic staff size and composition planning in public universities. Omega, 63, 1–11. https://doi.org/10.1016/j.omega.2015.09.008
Di Francesco, M., Diaz-Maroto Llorente, N. D. M., Zanda, S., & Zuddas, P. (2016). An optimization model for the short-term manpower planning problem in transhipment container terminals. Computers & Industrial Engineering, 97, 183–190. https://doi.org/10.1016/j.cie.2016.04.012
Dilts, D. A., Deitsch, C. R., & Paul, R. J. (1985). Getting absent workers back on the job: An analytical approach. New York, NY: Quorum Books.
Fare, R., Grosskopf, S., & Lovell, C. K. (1994). Production frontiers. Cambridge University Press.
Farrell, M. J. (1957). The measurement of productive efficiency. Journal of the Royal Statistical Society. Series A (General), 120(3), 253–290. https://doi.org/10.2307/2343100
Ferreira, C. M. C., & Gomes, A. P. (2009). Introdução à análise envoltória de dados: Teoria, modelos e aplicações. Brazil, Viçosa: Universidade Federal de Viçosa.
Fethi, M. D., & Pasiouras, F. (2010). Assessing bank efficiency and performance with operational research and artificial intelligence techniques: A survey. European Journal of Operational Research, 204(2), 189–198. https://doi.org/10.1016/j.ejor.2009.08.003
Fichman, M. (1984). A theoretical approach to understanding employee absence. In Goodman, P. S., & Atkin, R. S. (Eds.), Absenteeism: New approaches to understanding, measuring, and managing employee absence (pp. 1–46). San Francisco, CA: Jossey-Bass.
Golany, B., & Roll, Y. (1989). An application procedure for DEA. Omega, 17(3), 237–250. https://doi.org/10.1016/0305-0483(89)90029-7
Goodman, D., French, P. E., & Battaglio, R. P., Jr (2015). Determinants of local government workforce planning. The American Review of Public Administration, 45(2), 135–152. https://doi.org/10.1177/0275074013486179
Guerry, M. A. (2011). Hidden heterogeneity in manpower systems: A Markov-switching model approach. European Journal of Operational Research, 210(1), 106–113. https://doi.org/10.1016/j.ejor.2010.10.039
Gunter, H. M. (2008). Policy and workforce reform in England. Educational Management Administration & Leadership, 36(2), 253–270. https://doi.org/10.1177/1741143207087776
Gupta, N., & Jenkins, G. D. (1982). Absenteeism and turnover: Is there a progression? Journal of Management Studies, 19(4), 395–412. https://doi.org/10.1111/joms.1982.19.issue-4
Hickman, M. D., Koutsopoulos, H. N., & Wilson, N. H. (1988). Strategic model for operator work-force planning in the transit industry. (Transportation Research Record No. 1165). Transit Management and Replacement Capital Planning.
International Personnel Management Association (IPMA-HR). (2000). Workforce planning resource guide for public sector human resource professionals. U.S.. Alexandria, VA: Department of Homeland Security.
Jacobson, W. S. (2010). Preparing for tomorrow: A case study of workforce planning in North Carolina municipal governments. Public Personnel Management, 39(4), 353–377. ttps://doi.org/10.1177/009102601003900404
Jennings, M. G., & Shah, N. (2014). Workforce planning and technology installation optimisation for utilities. Computers & Industrial Engineering, 67, 72–81. https://doi.org/10.1016/j.cie.2013.10.008
Kramar, R. (2014). Beyond strategic human resource management: is sustainable human resource management the next approach? The International Journal of Human Resource Management, 25(8), 1069–1089.
Klein, K. J., Dansereau, F., & Hall, R. J. (1994). Levels issues in theory development, data collection, and analysis. Academy of Management Review, 19(2), 195–229.
Koutsopoulos, H. N., & Wilson, N. H. (1987). Operator workforce planning in the transit industry. Transportation Research Part A: General, 21(2), 127–138. https://doi.org/10.1016/0191-2607(87)90005-7
Kroezen, M., Van Hoegaerden, M., & Batenburg, R. (2018). The Joint Action on Health Workforce Planning and Forecasting: Results of a European programme to improve health workforce policies. Health Policy, 122(2), 87–93.
Lacombe, B. M. B., & Chu, R. A. (2008). Politicas e práticas de gestão de pessoas: As abordagens estrategica e institucional. Revista de Administração de Empresas, 48(1), 25–35. https://doi.org/10.1590/S0034-75902008000100003
Lacombe, B. M. B., & Tonelli, M. J. (2001). O discurso e a prática: O que nos dizem os especialistas e o que nos mostram as práticas das empresas sobre os modelos de gestão de recursos humanos. Revista de Administração Contemporânea, 5(2), 157–174. https://doi.org/10.1590/S1415-65552001000200008
Lewis, G. B., & Yoon Jik Cho, Y. J. (2011). The Aging of the State Government Workforce: Trends and Implications. The American Review of Public Administration, 41(1), 48–60. https://doi.org/10.1177/0275074009359308
Li, S., Jahanshahloo, G. R., & Khodabakhshi, M. (2007). A super-efficiency model for ranking efficient units in data envelopment analysis. Applied Mathematics and Computation, 184(2), 638–648. https://doi.org/10.1016/j.amc.2006.06.063
Mahajan, J. (1991). A data envelopment analytic model for assessing the relative efficiency of the selling function. European Journal of Operational Research, 53(2), 189–205. https://doi.org/10.1016/0377-2217(91)90134-H
Marconi, N. (2003). Politicas integradas de recursos humanos para o setor público. In Biblioteca Virtual TOP sobre Gestión Pública. Buenos Aires.
Mascarenhas, A. O. (2008). Gestão estratégica de pessoas. São Paulo: Cengage.
Mehrabian, S., Alirezaee, M. R., & Jahanshahloo, G. R. (1999). A complete efficiency ranking of decision making units in data envelopment analysis. Computational Optimization and Applications, 14(2), 261–266. https://doi.org/10.1023/A:1008703501682
Page 17 of 17
Damasceno Cunha et al., Cogent Business & Management (2018), 5: 1463835https://doi.org/10.1080/23311975.2018.1463835
© 2018 The Author(s). This open access article is distributed under a Creative Commons Attribution (CC-BY) 4.0 license.You are free to: Share — copy and redistribute the material in any medium or format Adapt — remix, transform, and build upon the material for any purpose, even commercially.The licensor cannot revoke these freedoms as long as you follow the license terms.
Under the following terms:Attribution — You must give appropriate credit, provide a link to the license, and indicate if changes were made. You may do so in any reasonable manner, but not in any way that suggests the licensor endorses you or your use. No additional restrictions You may not apply legal terms or technological measures that legally restrict others from doing anything the license permits.
Mello, J. C. C. B. S., Lins, M. P. E., & Gomes, E. G. (2002). Contruction of a smoothed DEA frontier. Pesquisa Operacional, 22(2), 183–201. https://doi.org/10.1590/S0101-74382002000200006
Morgan, L. G., & Herman, J. B. (1976). Perceived consequences of absenteeism. Journal of Applied Psychology, 61(6), 738. https://doi.org/10.1037/0021-9010.61.6.738
Morrow J. R., Jr., Jackson, A. W., Disch, J. G., & Mood, D. P. (2014). Medida e Avaliação do Desempenho Humano-4. Brazil: Artmed.
Nayebi, B. A., Mohebbifar, R., Azimian, J., & Rafiei, S. (2017). Estimating nursing staff requirement in an emergency department of a general training hospital: Application of Workload Indicators of Staffing Need (WISN). International Journal of Healthcare Management, 1–6. https://doi.org/10.1080/20479700.2017.1390182
Neri, A. A. (1999). Gestão de RH por competências e a empregabilidade. Campinas: Papirus Editora.
Nicholson, N. (1977). Absence behaviour and attendance motivation: A conceptual synthesis. Journal of Management Studies, 14(3), 231–252.
Nicoluci, M., Ferreira, L., & de Mogi Mirim, F. A. T. E. C. (2012). Gestão por Processos: Fluxo de Trabalho de Áreas Funcionais para Processos de Negócio da Organização. RACRE-Revista de Administração, 12(16), 23–3.
Ostroff, C., & Schmitt, N. (1993). Configurations of organizational effectiveness and efficiency. Academy of Management Journal, 36(6), 1345–1361. https://doi.org/10.2307/256814
Reis, C. Z. T., Freitas, Á. M. R., Martins, S., & Oliveira, A. R. (2015). Aspectos impactantes no dimensionamento da força de trabalho em uma instituição de ensino superior. Revista Gestão Universitária na América Latina-GUAL, 8(2), 28–49. https://doi.org/10.5007/1983-4535.2015v8n2p28
Rocha, A. M. D. C., & Morais, M. R. (2009). A construção de uma metodologia para o planejamento da força de trabalho (PFT) no âmbito da administração pública do estado de Minas Gerais. Brasilia: Congresso Consad de Gestão Pública.
Rodrigues, A. D. M., Oliveira, C. B. D. N., & Lima, H. L. D. (2015). Dimensionamento da força de trabalho baseado no
mapeamento de competências: A construção de uma metodologia na administração pública no estado de Pernambuco. In Anais do VIII Congresso Consad de Gestão Pública. Brasilia, DF.
Seiford, L. M., & Zhu, J. (1999). Infeasibility of super-efficiency data envelopment analysis models. INFOR: Information Systems and Operational Research, 37(2), 174–187.
Sinclair, A. (2004). Workforce planning: A literature review. Falmer, BN1: Institute for Employment Studies.
Smith, P. (1997). Model misspecification in data envelopment analysis. Annals of Operations Research, 73, 233–252. https://doi.org/10.1023/A:1018981212364
Steers, R. M., & Rhodes, S. R. (1978). Major influences on employee attendance: A process model. Journal of Applied Psychology, 63(4), 391. https://doi.org/10.1037/0021-9010.63.4.391
Tachizawa, T. (2015). Gestão com pessoas: Uma abordagem aplicada às estratégias de negócios. São Paulo: Editora FGV.
Vianna, C. M., Pierantoni, C. R., França, T. C., Magnago, C., da Silva Rodrigues, M. P., & Campos Morici, M. (2013). Modelos econometricos de estimativa da força de trabalho: Uma revisão integrativa da literatura. Physis-Revista de Saúde Coletiva, 23(3), 925–949.
Vieira, F. S. (2016). Crise econômica, austeridade fiscal e saúde: Que lições podem ser aprendidas?. Brasilia: Ipea.
Viswesvaran, C., Schmidt, F. L., & Ones, D. S. (2005). Is there a general factor in ratings of job performance? A meta-analytic framework for disentangling substantive and error influences. Journal of Applied Psychology, 90(1), 108. https://doi.org/10.1037/0021-9010.90.1.108
Vroom, V. H. (1964). Work and motivation (p. 45). NY: John Wiley & sons.
Waters, L. K., & Roach, D. (1979). Job satisfaction, behavioral intention, and absenteeism as predictors of turnover. Personnel Psychology, 32(2), 393–397. https://doi.org/10.1111/peps.1979.32.issue-2
Yu, M. M., & Lin, E. T. (2008). Efficiency and effectiveness in railway performance using a multi-activity network DEA model. Omega, 36(6), 1005–1017. https://doi.org/10.1016/j.omega.2007.06.003