
Stable Isotope Analysis of Intrapopulation, Spatial, and
76
Stable Isotope Analysis of Intrapopulation, Spatial, and Temporal Variation of Laughing Gull (Larus atricilla) Diets in the Virginia Coast Reserve and Jamaica Bay, New York Amanda Joy Knoff Richmond, Virginia B.S., The College of William and Mary, 1997 A Thesis presented to the Graduate Faculty of the University of Virginia in Candidacy for the Degree of Master of Science Department of Environmental Sciences University of Virginia January 2000 ________________________________ ________________________________ ________________________________
Transcript of Stable Isotope Analysis of Intrapopulation, Spatial, and

Stable Isotope Analysis of Intrapopulation, Spatial, and Temporal Variation of Laughing Gull (Larus atricilla) Diets in the Virginia Coast Reserve and Jamaica Bay, New York
Amanda Joy Knoff Richmond, Virginia
B.S., The College of William and Mary, 1997
A Thesis presented to the Graduate Faculty of the University of Virginia in Candidacy for the Degree of
Master of Science
Department of Environmental Sciences
University of Virginia January 2000
________________________________
________________________________
________________________________

ii
ABSTRACT
In this study, the δ13C, δ15N, and δ34S values for blood, muscle, feather, and egg
membranes were compared to examine temporal, interpopulation, and intrapopulation
variation in the diets of Laughing Gulls (Larus atricilla) nesting in coastal Virginia and
Jamaica Bay, New York. In addition, the stable isotopic compositions of Laughing Gull
prey species were also measured. Stable isotopes are a powerful tool for the study of
trophic linkages in dynamic coastal estuarine systems. The results reveal that there was a
significant amount of intrapopulation variation in the diets of Laughing Gulls from both
colonies. In addition, young Virginia Laughing Gulls consumed more foods of marine
origin than did young from the New York colony. Results also indicate that young from
the Virginia colony consumed proportionately more marine food items than did adult
females during the period prior to egg laying. The stable isotopic compositions of blood
and muscle from young Virginia Laughing Gulls indicate that there were two distinct
feeding strategies employed by the parental gulls. Some young were fed a diet consisting
of more estuarine species whereas other young were fed more marine food items. Based
on sampling different portions of feathers from prefledged young, a temporal shift to a
diet consisting of higher trophic level foods (higher δ15Ν and δ13C values) over time was
observed for the young in the Virginia colony. No such temporal diet shift was apparent
from feather analyses of the New York colony young. This study provides further
insights into how stable isotope analysis can be applied to the study of avian feeding
ecology.

iii
ACKNOWLEDGMENTS
I would like to thank my co-advisors Steve Macko and Mike Erwin for all the
guidance and encouragement they have provided during this project. In addition, I would
like to thank Hank Shugart for providing feedback as my third committee member.
Thanks also to friends and lab mates for providing advice, support, and most
importantly, laughter through the trials and tribulations. Also, many thanks to my father,
Warren Knoff and mother, Elizabeth Knoff.
I would also like to acknowledge and thank Randy Carlson, Jimmy Spitler, and all
my “shore buddies” for helping out with fieldwork and providing a great working and
learning environment. In addition, I would like to thank Kevin Brown for providing the
Jamaica Bay, NY samples and Dr. Glenn Olsen (USGS Patuxent Wildlife Research
Center) for his assistance with the muscle and blood sampling. Also, thanks to the
Virginia Coast Reserve Long Term Ecological Research Project (National Science
Foundation grants BSR-8702333-06, DEB-9211772, and DEB-9411974)) and USGS
Patuxent Wildlife Research Center (Laurel, MD) for providing funding.

iv
TABLE OF CONTENTS
Abstract…………………………………………………………………………………...ii Acknowledgements………………………………………………………………………iii Table of Contents……………………………………………………………………....…iv List of Tables………………………………………………………………………….......v List of Figures……………………………………………………………………………vii Introduction………………………………………………………………………………..1 Background literature for feeding biology………………………………………………...6
Materials and methods…………………………………………………………………...15 Field component…………………………………………………………………15 Laboratory analyses……………………………………………………………...20
Statistical analyses……………………………………………………………….24
Results……………………………………………………………………………………27
Discussion………………………………………………………………………………..40
Conclusions………………………………………………………………………………50
References………………………………………………………………………………..52
Appendix A: Stable isotopic compositions of organisms from the Virginia and New York systems……………………………………………………………………………...……57
Appendix B: Raw isotope data……………………………………………………….….59

v
LIST OF TABLES
Table Page 1 Previous studies of avian feeding ecology utilizing stable isotope analysis …….…..9 2 δ13C and δ15N diet-feather fractionation factors
for various avian species………………………………...……………….…………12
3 Analysis of variance results for Laughing Gull blood, muscle, feather, and egg
membrane isotope values…………………………………………………….……...31
4 Relationship between the stable isotopic compositions of base and tip
portions of Virginia colony feathers…………………………………….…………..37
5 Relationship between the stable isotopic compositions of base and tip
portions of New York feathers..…………………………………………….……….37
6 Relationship between the stable isotopic compositions of Virginia and New York
feathers……………………………………………………………………………...38
A-1 Stable isotopic compositions of organisms from the Virginia and New York
systems……………………………………………………………………………...58
B-1 Isotopic values for muscle and blood from young Virginia colony Laughing
Gulls……………………………………………………………………………...…60
B-2 Isotopic values for Virginia colony Laughing Gull egg membranes with estimations
of δ13C and δ15N of diets based on diet-tissue fractionation factors…………..…62
B-3 Results of lipid removal treatments on feather isotope values……………….……65
B-4 Stable isotopic values of feathers from young Virginia colony Laughing

vi
Gulls………………………………………………………………………...………66
B-5 Stable isotopic values of feathers from young New York colony Laughing
Gulls………………………………………………………………………………...68
vii
LIST OF FIGURES Figure Page 1 Map of the Virginia Coast Reserve………………………………………………16 2 Map of Jamaica Bay Wildlife Refuge and its surroundings……………………..20 3 Relationship between δ13C values in Laughing Gull
muscle and blood tissues…………………………………………………………27
4 Relationship between δ15N values of Laughing Gull
muscle and blood tissues…………………………………………………………28 5 Relationship between δ13C and δ15N values in Laughing Gull
blood……………………………………………………………………………..29 6 Relationship between δ13C and δ15N values in Laughing Gull
egg membranes…………………………………………………………………..31 7 Relationship between δ13C values in Laughing Gull
blood and feather tissues…………………………………………………………32 8 Relationship between δ15N values in Laughing Gull
blood and feather tissues……………………………………………….………...33 9 Relationship between δ34S values in Laughing Gull
blood and feather tissues………………………………………………….……...34 10 Sequential δ13C sampling of young Virginia Laughing Gull
feathers……………………………….…………………………………………..35
11 Sequential δ15N sampling of young Virginia Laughing Gull
feathers…………………………………………………………………………..36

viii 12 Spatial distribution of marked nests within the Virginia colony……………...…42

1
INTRODUCTION
The area that constitutes the Virginia Coast Reserve of the Long Term Ecological
Research Project (VCR-LTER) is a highly dynamic coastal estuarine system. One of the
goals of the VCR-LTER project is understanding the state of the system at present so that
future changes can be recognized and evaluated. An understanding of the dynamics of
ecosystem functioning is crucial to successful conservation (Odum 1959). Despite concern
that a major state change occurred in this area during the 1930’s (Hayden et al. 1991) and
the likelihood that similar changes will occur again in the future, food web linkages in this
area are poorly understood. Traditionally, theoretical perspectives of trophic relationships
do not account for spatial and temporal variation in the diets of different populations of
the same species. However, spatial and temporal variation in prey composition can have a
large influence on the flows of nutrients, contaminants, and energy within the ecosystem.
In this study, Laughing Gulls (Larus atricilla) were used as a model organism
because of their numerical abundance as a top trophic level consumer as well as their
broad and opportunistic diet that includes foods of terrestrial, marine, and freshwater
origin. Stable isotopes of carbon, nitrogen, and sulfur were analyzed in several types of
Laughing Gull tissues as well as in their primary prey species to: (1) determine the
feasibility of using different gull tissues in the evaluation of spatial, intrapopulation, and
temporal variability in diet and trophic relationships, and (2) initiate the development of a
stable isotope signature database for the entire VCR-LTER. Stable isotope analysis is a
powerful tool for assessing certain changes in prey composition in space and time by top-

2level consumers in coastal estuaries subject to ecosystem stressors. This technique is
particularly valuable because only a small amount of tissue is necessary for analysis.
Therefore, it is often possible to use stable isotope analysis to obtain valuable information
about the diet of organisms without sacrificing the study organism. This advantage is
particularly salient to studies examining the diets of endangered or threatened species.
This study examines dietary variation in Laughing Gulls on intrapopulation, spatial,
and temporal scales. Spatially, the diets of Laughing Gulls nesting in coastal Virginia were
compared to those of a Jamaica Bay, New York colony. Temporally, significant dietary
shifts in nestlings were examined in both the coastal Virginia and Jamaica Bay colonies. In
addition, the degree of intrapopulation dietary variation was also studied for adult and
nestling Laughing Gulls in both colonies.
STABLE ISOTOPES:
In this study, a multiple stable isotope approach was used to insure that the trophic
linkages were thoroughly analyzed. The use of stable isotope ratios in studies of food web
dynamics is based on the fact that the stable isotopic ratio of the diet is reflected in the
isotopic ratio of the consumer. As animals metabolize their food, stable isotopes undergo a
process known as fractionation. Fractionation refers to an enrichment or depletion of the
heavy isotope relative to the light isotope as a result of certain physical and chemical
processes. Enrichment occurs when a greater amount of the heavier of the two forms of
stable isotopes for a particular element (13C, 15N, 34S) is retained in the tissues of the
consumer while a greater amount of the lighter isotopes (12C, 14N, and 32S) is lost.
Although there are several theories regarding the physiological processes that lead to this

3enrichment, there is no general agreement as to which is most likely (Michener and Schell
1994).
Carbon:
For carbon, the enrichment may occur owing to a preferential loss of 12CO2 during
the respiration process. Other possibilities are that there is a fractionation of the carbon
during metabolic processes or that 13C is preferentially absorbed during the digestion
process. In light of the relatively small enrichment that occurs on average (0.5-1‰),
carbon isotopic compositions are particularly useful in elucidating food webs in which
there are several food sources that differ significantly in their δ13C values (Michener and
Schell 1994). For example, there are distinct differences in the δ13C values of plants that
use the Calvin cycle (C3), Hatch-Slack cycle (C4), and Crassulacean acid metabolism
(CAM) photosynthetic pathways. These differences are due to differences in the degree of
fractionation at the diffusion, dissolution, and the carboxylation steps of photosynthesis.
As these plants are sources of primary productivity at the base of the food web,
differences in the δ13C values of plants utilizing these different pathways are then reflected
throughout the food web (Lajtha and Marshall 1994).
When isotopic compositions are employed in the examination of diets and food
web dynamics, it is important to realize that the isotopic compositions of different tissues
of the study animal will reflect the diet of the animal during different temporal periods.
Tissues that are rapidly replaced in the body will reflect the diet of the animal in the
relatively recent past, and those tissues that do not have high turnover rates will reflect the
diet over a longer span of time. This complication is also relevant to nitrogen and sulfur

4isotopes (Michener and Schell 1994). Complexities arising from this effect can be lessened
to some extent by either using a sample that consists of a homogenization of the entire
organism, averaging the isotopic values obtained for several different tissue types, or by
sampling different areas of a tissue (i.e. feathers and tusks) (Dieudonne 1998) that are
deposited at different times. The present study examined the isotopic compositions of
blood, muscle, egg membranes, and feathers. In addition, different portions of feathers
were analyzed to examine the possibility that a temporal diet shift occurred in the young
Laughing Gulls during the period of feather development. It is also important to conduct
the isotopic analysis on several organisms within the examined species, as individuals of
the same species eating approximately the same diet may vary in their isotopic
compositions by up to 2‰ (Michener and Schell 1994). Numerous studies have examined
and documented the utility of stable carbon isotopic analysis in studies of diet and trophic
dynamics (Smith 1972, DeNiro and Epstein 1978, Tieszen et al. 1983, Jackson and
Harkness 1987).
Nitrogen:
Like carbon isotopes, nitrogen isotopes are useful primarily in systems where there
are two (or more) types of primary food sources that differ significantly in their δ15N (such
as aquatic versus terrestrial food sources). The approximately 3‰ enrichment in nitrogen
with each successive trophic level makes the nitrogen isotope values particularly useful in
the study of trophic dynamics (Michener and Schell 1994). The enrichment of nitrogen
isotopes occurs either through the preferential excretion of 15N-depleted nitrogen (i.e.
higher in 14N) in urea or ammonia or the preferential utilization of 15N-enriched protein (or

5through a combination of both processes) (Michener and Schell 1994). Specifically, it has
been shown that nutritional stress may lead to significantly larger 15N enrichment in birds
(Hobson et al. 1993). This increased enrichment may be due to the physiological transfer
of proteins from one part of the body to the other in response to nutritional stress (Hobson
et al. 1993). The reactions involved in these movements may result in increased
enrichment of nitrogen. Another possible explanation for this enrichment is that the types
and amounts of amino acids may vary depending on whether a bird is experiencing
nutritional stress (Hobson and Clark 1992). It has been shown that different amino acids
have different stable isotopic signatures (Macko et al. 1983), so changes in the types and
relative amounts of amino acids could very likely have a significant effect on the isotopic
composition of the birds (Hobson and Clark 1992). Also, the utility of nitrogen isotopes in
dietary studies may be limited by the extensive use of nitrogen fertilizers throughout the
world. These fertilizers may affect the distribution of nitrogen isotopes in the primary food
source (plants), and this variation will then be reflected throughout the food web (DeNiro
and Epstein 1981). Several studies have utilized both carbon and nitrogen isotopic
analyses in examination of trophic dynamics (Rau 1991-1992, Schoeninger and DeNiro
1984), and others have used only nitrogen isotopes (DeNiro and Epstein 1981, Minagawa
and Wada 1984, Cabana and Rasmussen 1994).
Sulfur:
Although it appears that there is little or no enrichment in 34S in animals relative to their
diets, there is a very large difference between the isotopic ratios of seawater sulfate and
sulfides (around 21‰ and –10‰, respectively) (Michener and Schell 1994). This

6difference is very useful in studies of estuarine food web dynamics because one can readily
distinguish between benthic and pelagic primary producers (benthic algae versus
phytoplankton, for example). Like benthic producers, marsh plants tend to be richer in
sulfur derived from sulfides, and they therefore characteristically have a less enriched δ34S
signal (Michener and Schell 1994). Several studies have utilized stable sulfur isotopes in
conjunction with carbon and nitrogen analyses to examine the flow of organic matter
through estuarine systems (Peterson and Howarth 1987, Neill and Cornwell 1992).
Background Literature for Feeding Biology-
Many studies have examined and documented aspects of the breeding biology of
Laughing Gulls (Dinsmore and Schreiber 1974, Schreiber and Schreiber 1980, Schreiber et
al. 1979). Dosch (1997) examined the diets of nestling Laughing Gulls in southern New
Jersey using regurgitation samples and found that over eighty percent of the diet of these
chicks by volume was composed of terrestrial food items. Like the Laughing Gulls
examined in coastal Virginia in the present study, the New Jersey gulls nest on salt marsh
islands, and it is therefore likely that food items of estuarine origin are closer in proximity
to the nesting areas than foods available on the mainland. Dosch (1997) proposed that a
possible explanation for the willingness of the parent gulls to fly longer distances to obtain
inland food for their young is related to the lower salt content of terrestrial food items as
compared to those of marine or estuarine origin. As Dosch (1997) also found a significant
negative linear relationship between percent volume of marine food items in the diets of
the young gulls and chick weight, he hypothesized that the salt gland of the young gulls is

7not fully developed. Similarly, Johnston and Bildstein (1990) found evidence for the same
physiological constraint in White Ibis (Eudocimus albus). Harriman (1967) and Dosch
(1997) also found that increased salt consumption resulted in a negative effect on the
growth and survival of young Laughing Gulls. These studies therefore suggest that adult
Laughing Gulls may feed their young diets higher in foods of terrestrial, anthropogenic,
and freshwater origin to reduce physiological stress on the immature osmoregulatory
systems of the young.
In contrast, Annett (1987) found that adults that consumed large amounts of
garbage (inland food) early in the breeding season began taking more small fish (especially
anchovies) when the chicks hatched. Similarly, Pierotti and Annett (1990) found that
seabirds that focused their feeding on mussels produced significantly larger and heavier
young than generalists or those that specialized on petrels or garbage. They also had more
eggs per clutch than birds using any of the other feeding strategies. Another finding of this
study is that garbage specialists produced significantly more addled eggs (those that are
either infertile or fail to develop completely), whereas mussel specialists produced
significantly less addled eggs than birds specializing on other items. This study also
documented the relatively higher success of seabirds feeding fish to their young as
opposed to refuse. Fish and mussels are high in sulfonated amino acids, which are essential
for the early stages of bone development in birds (Pierotti and Annett 1990). In contrast,
refuse contains high amounts of connective tissue and fat as well as a great deal of
relatively undigestable parts, and it is consequently low in the necessary sulfonated amino

8acids. Hobson (1993) similarly documents seabird parents feeding their young diets
consisting of higher proportions of fish.
Therefore, in contrast to the findings of studies indicating that the optimal feeding
pattern for parent Laughing Gulls may be to feed their young fewer foods of marine origin
(Harriman 1967, Dosch 1997, Dosch 1997), other studies have found evidence for
increased breeding success in parents utilizing the opposite feeding pattern (Annett 1987,
Pierotti and Annett 1990, Hobson 1993).
Many studies have utilized isotopic analyses of several different avian tissue types
to examine various aspects of avian feeding biology. Schaffner and Swart (1991)
established that the carbonate from eggshells could be used to assess certain aspects of the
diet of the female at the time of egg formation. The relative reliance on marine and
terrestrial food items as well as the relative trophic status of the females was established.
In another study utilizing isotopic analyses of eggshell components, Hobson (1995)
examined several different portions of whole eggs and determined their relative
enrichments relative to the diet of the birds. The membrane inside an eggshell was found
to be enriched by 3.5‰ for 15N and 2.7‰ for 13C relative to the diet of a carnivorous bird.
Stable isotope analyses have been utilized in studies examining various aspects of
the feeding ecology of many avian species (Table 1). Many different tissue types were
used in these studies, and several used isotopic analyses of tissues that were analyzed in
the present study. Some studies focused their isotopic analyses on only one type of tissue,
and others used several types of tissue to examine the diet of the birds over different
temporal periods (Table 1). Tissues such as blood and muscle with a relatively high

9metabolic activity, and thus turnover rate, reflect the diet of the animals in the relatively
recent past, whereas some tissues, such as feathers, may reflect the diet only during the
period in which the tissue was developing.
Table 1. Previous studies of avian feeding ecology using stable isotope analysis.
Table 1. Previous studies of avian feeding ecology using stable isotope analysis, (continued).
SPECIESSTABLE
ISOTOPES TISSUES STUDYWestern and Glaucous-
winged Gulls C bone Hobson 1987
Marbled Murrelets C, N muscle Hobson 1990
Cormorants C, Nmuscle, bone,and feathers Mizutani et al . 1991
Great Auks N boneHobson and
Montevecchi 1991
Northern Saw-whet Owls Cmuscle and
boneHobson andSealy 1991
Red-billed Tropicbirds, White-tailed Tropicbirds,
Sooty Terns, Laughing Gulls, Elegant Terns, Caspian Terns,
and Western Grebes C, O eggshellsSchaffner and
Swart 1991

10
Table 1. Previous studies of avian feeding ecology using stable isotope analysis, (continued).
SPECIESSTABLE
ISOTOPES TISSUES STUDY
Weddell seabirds C, N muscle Rau et al . 1992
High Arctic seabirds C, Nmuscle,
bone Hobson 1993
Crows C bloodHobson and Clark 1993
Japanese Quail, Ross' Geese C, N
muscle, blood, liver,feathers, bone Hobson et al . 1993
Snow Geese C, N muscleAliskauskas
and Hobson 1993
Canvasback Ducks C, Nblood,muscle Haramis et al . 1994
Auklets, Murrelets,Murres, Storm Petrels,Glaucous-winged Gulls,
Mew Gulls, Northern Fulmars,
Cormorants C, Nmuscle,
bone Hobson et al. 1994
Mallards, Japanese Quail, Prairie Falcons,
GyrfalconsC, N eggshells Hobson 1995
Northern Fulmars C, N feathers Thompson et al . 1995

11
Although numerous studies have utilized isotopic analysis of tissues such as
muscle, blood, and bone to examine the diets of many types of animals, the use of feathers
in the examination of avian feeding ecology is a more recent and less thoroughly explored
application of isotopic analysis and dietary studies. This is a particularly attractive tissue
for this analysis, however, as it is simple and non-lethal. When using the stable isotope
compositions of feathers to examine avian diets, it is important to know the extent of
fractionation occurring during the production of feather tissue. Several studies have
addressed this need by measuring diet-feather fractionation factors (Table 2).
Table 2. δ13C and δ15N diet-feather fractionation factors for various avian species.
SPECIESSTABLE
ISOTOPES TISSUES STUDY
Cormorants, Western Gulls,
Common Murres,Pigeon Guillemots,
Auklets C, N eggs, muscle Sydeman et al . 1997
Redhead DucksC (fatty
acids)fat
(GC-IRMS) Hammer et al . 1998
Glaucous Gulls C, N muscle, liverSchmutz andHobson 1998
Herring Gulls C, N eggs Hebert et al . 1999

12
Table 2. δ13C and δ15N diet-feather fractionation factors for various avian species, (continued).
SPECIES FEATHERS
DIET-FEATHERFRACTIONATIONFACTOR (δ13C)
DIET-FEATHERFRACTIONATIONFACTOR (δ15N) STUDY
Cormorant primary 4.0 not reportedMizutani et al .
1990Black-tailed
Gull ? 4.0 not reportedMizutani et al .
1990
Cormorant primary 3.6 3.6Mizutani et al .
1991Black-tailed
Gull primary 3.6 5.3Mizutani et al .
1992Nankeen
Night Heron primary 3.2 4.2Mizutani et al .
1992Great White
Egretnuptial
plumage 3.1 3.9Mizutani et al .
1992
Grey Heron primary 3.4 4.3Mizutani et al .
1992Humboldt's
Penguin body 2.9 4.8Mizutani et al .
1992
Cormorant primary 3.8 3.7Mizutani et al .
1992
Scarlet Ibis primary 3.8 4.5Mizutani et al .
1992
White Ibis primary 2.5 4.3Mizutani et al .
1992
Flamingo primary 3.6 5.6Mizutani et al .
1992American
Crow primary 4.0 not doneHobson andClark 1992
domestic chicken ? -0.4 1.1
Hobson and Clark 1992
Japanese Quail ? 1.4 1.6
Hobson and Clark 1992
Ring-billed Gull primary 0.2 3.0
Hobson and Clark 1992
Peregrine Falcon ? 2.1 2.7
Hobson and Clark 1992

13
Like other tissues, feathers can be used to estimate the relative dietary
contributions of marine and terrestrial food sources as well as in the determination of
trophic level. Hobson (1992) found that the isotopic composition of growing feathers
reflects the diet of the bird during feather production. In this study, captive crows were
fed a uniform diet of known isotopic composition and the feather produced during this
period was removed and isotopically analyzed. After the feather grown during the
controlled diet was removed, the diet was changed to one with an isotopic composition
that was distinctly different from the initial diet. After the crows consumed this diet for
SPECIES FEATHERS
DIET-FEATHERFRACTIONATIONFACTOR (δ13C)
DIET-FEATHERFRACTIONATIONFACTOR (δ15N) STUDY
Common Murre body 1.0 3.3
Thompsonand Furness
1995
Arctic Tern body 2.1 3.4
Thompsonand Furness
1995
Broad-billed Prion body 2.5 4.3
Thompsonand Furness
1995
Subantarctic Skua body 0.5 3.0
Thompsonand Furness
1995
Cormorant primary 2.6 4.9Bearhop et al .
1999
Shag primary 2.0 3.6Bearhop et al .
1999
Goosander primary 2.4 4.2Bearhop et al .
1999

14some time, feather grown during this period was removed and isotopically analyzed. The
isotopic composition of the diet at the time of feather growth was reflected in a consistent
manner in the isotopic composition of the feathers. As birds do not produce all their
feathers simultaneously, several feathers produced at different times can be removed from
a single bird to examine temporal diet changes (Mizutani et al. 1990, Collier and Lyon
1991, Thompson and Furness 1995, Bearhop et al. 1999). Thompson and Furness (1995)
examined intrafeather isotopic variations by analyzing base and tip portions of primary
feathers. Although there was not a consistent and significant temporal dietary shift in the
population as a whole, the base and tip portions of several feathers did differ significantly
from one another, thus indicating that some individuals did undergo a pronounced dietary
shift during feather formation. Several studies have utilized the fact that the isotopic
composition of feathers reflects the diet during feather formation to identify and link
breeding and wintering grounds for migratory songbirds (Chamberlain et al. 1997, Hobson
and Wassenaar 1997).
Many studies have utilized stable isotopic analyses to examine the flow of organic
matter through a wide variety of estuarine systems (Smith and Epstein 1970, Haines 1976,
Haines 1976, Haines 1977, Haines and Montague 1979, Hackney and Haines 1980,
Stephenson and Lyon 1982, Hughes and Sherr 1983, Peterson et al. 1985, Simenstad and
Wissmar 1985, Peterson et al. 1986, Peterson and Howarth 1987, Neill and Cornwell
1992, Schacher and Wooldridge 1996, Kwak and Zedler 1997, Creach et al. 1997). In
particular, many of these studies have sought to determine which source of primary
productivity provides most of the nutrition for animals at the base of the estuarine food

15web. The analysis of the stable isotopic compositions of carbon, nitrogen, and sulfur has
been shown to be a robust method for the examination of trophic relationships in dynamic
coastal estuarine systems. However, although the base of the estuarine food web has been
well documented isotopically, far fewer studies have examined the influence of top trophic
level consumers in detail. Because these higher level consumers are often larger, more
mobile, and far ranging among habitats, they can have major impacts on the import and
export of organic materials and contaminants.
Materials and Methods
FIELD COMPONENT:
During the summers of 1997 and 1998, samples of species known to serve as prey
items for Laughing Gulls (Burger 1996, K. Brown, personal communication) were
collected in the barrier islands and lagoonal marsh islands of the Virginia Coast Reserve in
Northampton County, VA (figure 1).

16
Figure 1: Map of the Virginia Coast Reserve.

17In June-August of 1998, an intensive study of a breeding colony of Laughing Gulls
on Egging Marsh was conducted. Egging Marsh is a small marsh island located near Hog
Island (75.68 W, 37.46 N) (figure 1). Several hundred pairs of Laughing Gulls nested on
Egging Marsh during the 1998 breeding season. After the eggs were laid in June,
enclosures were constructed around fifteen of the nests using 30-60 cm high wire and
wooden stakes. The enclosures were placed at a distance of at least 60 cm from the
perimeter of the nests. Enclosed nests were selected because of their close proximity to a
site from which visual observations of parental feeding were made.
At this time, eggs were also “floated” to determine the approximate time since
laying (and thus also approximate time until hatching) (Hays and LeCroy 1971). At several
other points prior to hatching the eggs were floated again to monitor their progress. A
marking scheme was developed for all of the chicks within the enclosures so that each
chick had a unique marking. As all chicks within the enclosures did not hatch at the same
time, chicks were marked as they hatched to facilitate their assignment to nests. Markings
consisted of two spots of nail polish on the left and right sides of each chick’s head. Marks
were periodically reapplied because of color fading. Eggshells of hatched chicks were also
collected at all fifteen enclosed nests as well as from numerous other nests within the
colony.
After hatching, marking, and collection of discarded eggshells, visual observations
of parental feeding were made to identify the foods being delivered to young gulls. These
observations were of limited success, as observational distances sufficient to avoid
disturbance of the birds also made identification of food items extremely difficult.

18Information about the diets of individual Laughing Gulls was therefore obtained primarily
through collection and analysis of regurgitations of the stomach contents of chicks. In this
procedure, chicks in the colony (both from within and outside the enclosures) were
handled for approximately five minutes and any regurgitations were collected and analyzed
for content. Regurgitations were collected and maintained on ice until they could be
placed in freezers for storage. This procedure provides a means whereby specific food
items can be identified and their relative contributions to total diet may be quantified.
However, analysis of regurgitations in dietary studies has several drawbacks. First,
identifications of gut contents can be very difficult, as prey items are often partially
digested when the regurgitation is obtained. Second, certain prey items that are rapidly
digested may not be accurately represented in regurgitation contents, whereas the dietary
importance of those that are relatively resistant to digestion may be overestimated
(Michener and Schell 1994)
Like the visual observations, regurgitations were of limited success. Throughout
the breeding season, attempts to obtain regurgitations from nestlings throughout the
colony were made approximately five times per week. Fifteen regurgitations were
obtained during this period. In addition, certain nestlings were more prone to regurgitate
than others. As a result, specific data about the diets of individual young were obtained for
fewer than fifteen young. Observations and collection of regurgitation were continued
until the chicks were between three and four weeks of age. At this point, five of the nests
had failed or been abandoned. A United States Geological Survey Patuxent Wildlife
Research Center (USGS PWRC) veterinarian then collected blood and pectoral muscle

19samples from twelve chicks from the enclosed nests. At least one nestling was sampled
from each nest. Blood (1 cc) was taken from the medial tarsal vein using a syringe, and
small amounts of pectoral muscle tissue (0.5-1.0 mg) were removed using a biopsy needle.
These samples were also stored on ice until they could be moved to freezers. At the time
of the muscle and blood collection, the fifth primary feather was also removed from each
of the twelve sampled chicks. The fifth primary feather was also removed from the other
chicks within the enclosures as well as chicks within the rest of the colony (49 total
feathers). The colony was visited periodically several times in the week after the sampling
procedure to insure that all chicks recovered from the sampling.
Based on organisms observed in the regurgitations as well as remnants of food
items observed on and collected from nests, live specimens of prey that contributed to the
diet of the Laughing Gull chicks were collected. Many species of crabs, fish, insects (from
mainland, marshes, and barrier islands), mollusks, and other marine invertebrates were
collected near Egging Marsh and stored in freezers (Table A-1). To allow comparisons of
Laughing Gulls between locations, feather and prey samples were also obtained by Dr.
Kevin Brown from a colony of Laughing Gulls nesting in the Jamaica Bay Wildlife Refuge
in Jamaica Bay, New York during the summer of 1998 (figure 2).

20
Figure 2: Map of Jamaica Bay Wildlife Refuge and its surroundings.
Additional samples were obtained of species that are probably not part of the diet
of the gulls; these samples have been analyzed to provide data for an overall database of
information about trophic relationships for the organisms within the VCR-LTER (Table
A-1).
LABORATORY ANALYSES:
Blood, muscle, feather, and eggshell membranes from Laughing Gulls as well as
prey samples were analyzed for their stable isotopic compositions using an elemental
analyzer (EA) connected to a Micromass Optima Isotope Ratio Mass Spectrometer
(IRMS). Before these analyses were conducted, however, the samples were prepared.
Feathers and eggshells were cleaned with water to remove any external debris. The

21connective tissue inside the base of the feathers was also removed and this area was
thoroughly cleaned. The waxy sheath covering the base of the feathers was also removed.
The membrane portion of the eggshells was separated from the hard outer shell portion.
Muscle tissue was removed from all prey samples. Eggshell membranes, prey muscle
tissue, as well as juvenile Laughing Gull muscle and blood samples were then dried for
several days at 60° C. After drying, each sample was ground into a fine powder and
homogenized.
After washing, a test was conducted to determine which portion of the feathers
was most appropriate for isotopic analysis. For several feathers, sections from the
proximal and distal ends were removed. Then, the rachis and barb portions of these
sections were isotopically analyzed separately to determine whether the rachis and barbs
from the same area on the same feather had significantly different isotopic compositions.
After it was determined that rachis and barb samples taken from the same area on the
same feather did not have significantly different isotopic compositions, the barb portions
of all feathers were removed from the rachis. The rachis portion was then used in the rest
of the feather analyses, as it was far easier to sample than the barb portions. As all feathers
were taken from chicks of approximately three to four weeks of age, most feathers were
around 15 cm in length. Therefore, feathers between 13 and 17 cm in length were
preferentially sampled. Smaller feathers, although rare, were sometimes sampled when
those larger than 13 cm were not available. For these samples, feather length was noted.
With feathers averaging 15 cm in length, 2 cm was removed from both the proximal and
distal ends of the feather. The ends were removed so that the subdermal portion of the

22feather was not sampled. This was done to attempt to reduce any variation between the
base and tip portions so that isotopic differences observed between these two portions
could be attributed to a change in diet rather than a difference in microenvironment (inside
versus external on the bird). The same amount (2 cm) was also removed from the tip of
the feathers so that the proximal and distal samples were taken from equivalent areas of
the proximal and distal ends. After the ends were removed, samples were taken for carbon
and nitrogen isotopic analysis from the base and tips of all feathers sampled. For some
feathers, the proximal and distal ends were also sampled for sulfur isotopic composition.
Some feathers were not sampled for sulfur, however, as the amount of feather required for
sulfur analysis made sequential sampling along the entire length of the feathers impossible.
In this sequential sampling procedure, a carbon and nitrogen sample was taken every 5mm
along the length of feathers with significantly different isotopic compositions at the
proximal and distal ends. The proximal and distal sampling, as well as the sequential
sampling, was conducted on feathers from both the coastal Virginia and Jamaica Bay,
New York colonies.
A test was also conducted to address the possibility that the presence of waxes or
lipids may influence the carbon isotopic signature of the feathers. Birds often deposit lipid-
rich substances on feathers as waterproofing. As lipids have significantly more depleted
isotopic compositions than other compounds (Michener and Schell 1994), the presence of
these substances on feathers could significantly influence the carbon isotope values
obtained. Therefore, different areas of several different feathers were reflux extracted with
distilled dichloromethane for approximately 30 minutes to remove all lipids. After

23refluxing, the feathers were rinsed several times in clean dichloromethane to remove lipids
released by the reflux process. Feathers were then allowed to dry. The treated samples
were then isotopically analyzed, as were equivalent samples (from the same feathers and
same areas on the examined feathers) that did not undergo the lipid treatment. Isotopic
values for the treated and untreated samples were then compared to determine whether the
presence of lipid significantly influenced the isotopic values obtained. There was no
significant difference between the isotopic compositions of the treated and untreated
feathers.
After sample preparation was complete, each sample was weighed out (0.4-0.6
mg for a carbon and nitrogen sample and 5.0 mg for a sulfur sample) and placed in a tin
boat, sealed, and loaded into the sample carousel on the EA (Micromass Optima IRMS).
The goal of preparation is the conversion of the organic samples into suitable gases that
can then be analyzed by the mass spectrometer. Carbon is converted to CO2, nitrogen to
N2, and sulfur to SO2. The reproducibility of isotopic measurements varies depending on
the specific technique and instruments used, but it is usually around plus or minus 0.2‰
for carbon, nitrogen, and sulfur measurements. Isotopic ratios of samples (Rsa) were
compared to the isotopic ratio of a standard for that element (Rstd). R is the ratio of the
heavy isotope to that of the light isotope of the element, and differences in the ratios are
expressed in ‘delta’ (δ) notation and are reported in per mil (‰):
δNE (‰) = (Rsa/Rstd - 1) * 1000

24The standard for carbon is Pee Dee Belemnite (PDB), which is a Cretaceous age
cephalopod from the Pee Dee formation of South Carolina. The standard for nitrogen is
atmospheric molecular nitrogen, and sulfur samples are compared to troilite of the Canyon
Diablo Meteorite (CDT) (Lajtha and Michener 1994). By definition, the δ values of all the
standards are equal to zero.
STATISTICAL ANALYSES:
Stable isotopic values of muscle and blood from juvenile Laughing Gulls within the
enclosures at the Virginia colony were plotted and an R2 value was calculated to
determine the degree of linear correlation between muscle and blood values from
individual birds. The plots revealed two distinct groups within the isotopic values of the
juvenile gulls. Therefore, a t-test was used to determine whether the two groups were
statistically distinct. The muscle and blood samples were also analyzed using a one-way
analysis of variance (ANOVA) to determine whether there was significant variation among
the carbon, nitrogen, and sulfur isotopic values obtained for muscle and blood. This
analysis was performed separately with values obtained for the muscle δ13C, muscle δ15N,
blood δ13C, blood δ15N, and blood δ34S. Separate t-tests were used to determine whether
there were statistically significant differences between carbon and nitrogen isotopic
compositions of the muscle and blood.
A one-way analysis of variance (ANOVA) was performed to determine whether
there was a significant amount of variation among the isotopic values of the egg
membranes. This analysis was done separately for carbon, nitrogen, and sulfur. The carbon
and nitrogen values for the egg membranes were also plotted so that a R2 value could be

25calculated using a linear regression model. All R2 values were compared to the critical
levels of r obtained from Zuwaylif (1980).
Correlation between the blood and feather isotopic values of the marked juveniles
from the Virginia colony was determined by plotting blood and feather values from the
individual gulls and calculating an R2 value from the linear regression model. The strength
of this correlation may indicate differences in the diet-tissue fractionation factors between
blood and feather tissues.
The isotopic values obtained for egg membranes and feathers taken from adults
and young at the Virginia colony, respectively, were utilized to compare the isotopic
signatures of adult and young Laughing Gulls in this colony. Before this could be done,
however, diet-tissue fractionation factors obtained by previous studies for avian egg
membranes and feathers were used to account for differences in the degree of
fractionation that occurs during the production of these two tissue types. Hobson (1995)
found diet-egg membrane fractionation factors of 2.7‰ for carbon and 3.5‰ for nitrogen
for a carnivorous bird. The δ13C and δ15N values for egg membranes were then corrected
based on these fractionation factors to produce an isotopic values indicative of the diet of
the adult female Laughing Gulls at the time of egg formation. As many more studies have
examined diet-feather fractionation factors, mean fractionation values for carbon and
nitrogen were obtained from the eleven waterbird primary feather values (Table 2). This
mean value was then used to obtain the approximate carbon and nitrogen isotopic values
of the diet that the young gulls were being fed during primary feather growth. The
corrected egg membrane and feather values were then compared using a t-test to

26determine whether there were significant differences between the diets of the adult and
young Laughing Gulls from the Virginia colony.
Paired t-tests were performed to determine whether there was a significant
difference in the isotopic compositions of carbon, nitrogen, and sulfur for the base and tip
portions of the feathers. This was done independently for both Virginia and New York
colony feathers. T-tests were also performed to compare the isotopic compositions of the
New York and Virginia colony feathers. This analysis was done separately for carbon,
nitrogen, and sulfur. Isotopic compositions of feathers obtained from birds within the
enclosures were compared to those from birds outside the enclosures using a t-test. This
analysis was done to ensure that the isotopic values of tissues obtained from enclosed
birds were a representative sample of the colony.
An F-test was performed to determine whether there was a significant difference
between the variances in the isotopic compositions of feathers obtained from the Virginia
and New York colonies. This analysis was done separately for the carbon, nitrogen, and
sulfur compositions of both the base and tip portions. F-tests were also used to compare
variances in the stable isotopic compositions of the base and tip portions of the feathers
analyzed. This analysis was done for carbon, nitrogen, and sulfur on feathers obtained
from both the New York and Virginia colonies.
For the results of all the statistical analyses, a P value less than 0.05 was required
for a result to be considered statistically significant. Results were often tested for
significance at lower P values to indicate relative strength of significance. In addition, as
27many statistical tests were performed in the analysis, testing for significance at lower P
values also reduced the probability of obtaining a false significance result.
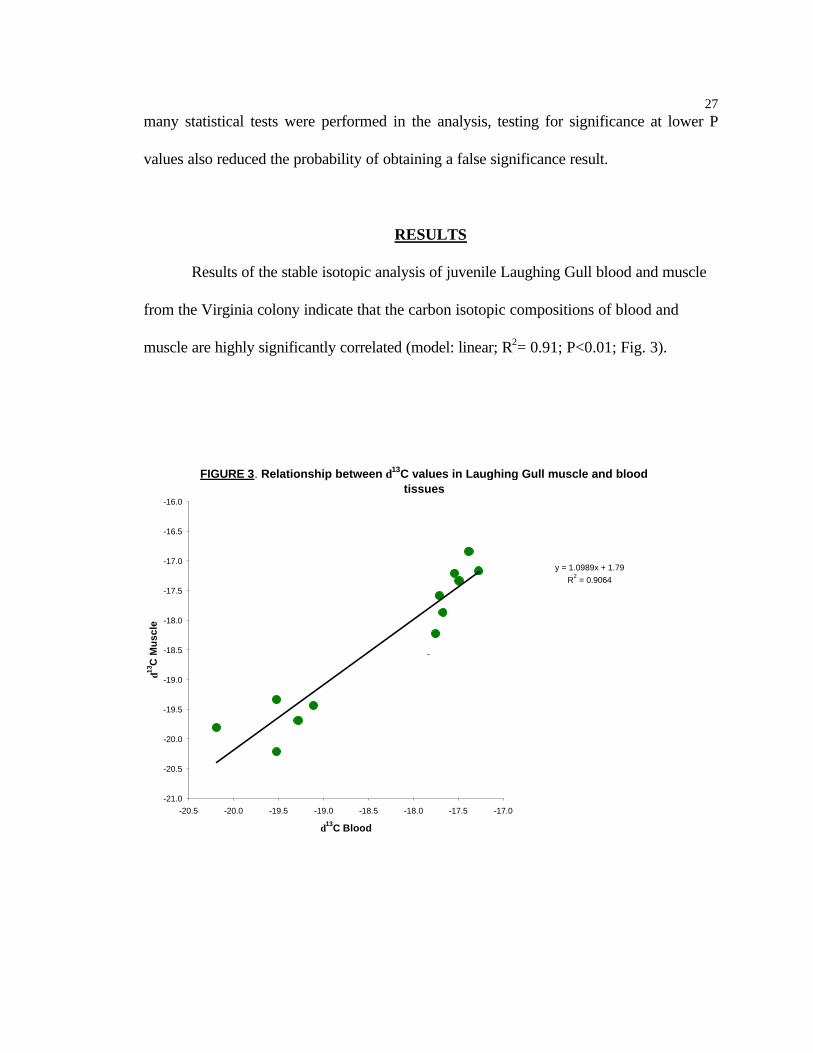
RESULTS
Results of the stable isotopic analysis of juvenile Laughing Gull blood and muscle
from the Virginia colony indicate that the carbon isotopic compositions of blood and
muscle are highly significantly correlated (model: linear; R2= 0.91; P<0.01; Fig. 3).
FIGURE 3. Relationship between δ13C values in Laughing Gull muscle and blood tissues
y = 1.0989x + 1.79R
2 = 0.9064
-21.0
-20.5
-20.0
-19.5
-19.0
-18.5
-18.0
-17.5
-17.0
-16.5
-16.0
-20.5 -20.0 -19.5 -19.0 -18.5 -18.0 -17.5 -17.0
δ13C Blood
δ13C
Mu
scle
-

28
Similarly, the nitrogen isotopic values of the Laughing Gull muscle and blood are highly
significantly correlated (model: linear; R2= 0.92; P<0.01; Fig. 4).
FIGURE 4. Relationship between δ15N values of Laughing Gull muscle and blood tissues
y = 1.0256x - 0.1089R2 = 0.9221
12.0
12.5
13.0
13.5
14.0
14.5
15.0
15.5
16.0
11.0 11.5 12.0 12.5 13.0 13.5 14.0 14.5 15.0 15.5 16.0
δ15N Blood
δ15N
Mu
scle

29
Graphs of the isotopic values of the muscle and blood reveal two distinct clusters
(nest two was considered an outlier), one consisting of birds whose tissues are more
depleted in carbon and more enriched in nitrogen and one with relatively more enriched
carbon values and less enriched nitrogen values (Fig. 5).
FIGURE 5. Relationship between δ13C and δ15N values in Laughing Gull blood
Nest 9
Nest 11
Nest 7Nest 7 Nest 5
Nest 1
Nest 6
Nest 2
Nest 3
Nest 8
Nest 8
Nest 4
11.0
11.5
12.0
12.5
13.0
13.5
14.0
14.5
15.0
15.5
16.0
-20.5 -20.0 -19.5 -19.0 -18.5 -18.0 -17.5 -17.0
δ13C
δ15N

30
Results of a t-test indicate that these two groups are indeed statistically different.
The differences observed between the carbon isotopic values are very highly significant (t
= 11.5; df = 10; P<0.001), and the difference observed in the nitrogen and sulfur values of
the two groups are also significantly different (t nitrogen = 2.41; t sulfur = 1.85; df = 10;
P<0.05).
The results of another series of paired t-tests indicate that there is not a statistically
significant difference between the muscle and blood carbon isotopic values, but that there
is a significant difference between the muscle and blood nitrogen isotopic values (t = 2.25;
df = 11; P<0.05). Results of the one-way analysis of variance indicate that there is a
significant amount of intrapopulation variation among both the carbon and nitrogen
isotopic compositions of the muscle and blood samples. The one-way analysis of variance
conducted on the egg membrane isotopic values similarly revealed that there was a
significant amount of intrapopulation variation in the isotopic values of the membranes.
This significance was indicated for carbon, nitrogen, and sulfur isotopes. The carbon,
nitrogen, and sulfur isotopic compositions of feathers obtained from the Virginia and New
York Laughing Gulls also had a significant amount of intrapopulation variation (Table 3).

31Table 3. Analysis of variance results for Laughing Gull blood, muscle, feather, and
egg membrane isotopic values
Also, the carbon and nitrogen isotopic compositions of the egg membranes are highly
significantly correlated (model: linear; R2=0.51; P<0.01; Fig. 6).
TISSUE F (δ13C) F (δ15N) F (δ34S) DF P<
blooda 1.12 1.44 1.59 11 0.01musclea 1.49 1.65 NA 11 0.01
VA feathersa 0.711 1.49 1.91 48 0.01NY feathersa 0.397 1.12 3.51 19 0.01
egg membraneb 2.23 1.72 2.70 81 0.01
a from youngb from adult females
FIGURE 6. Relationship between δ13C and δ15N in Laughing Gull Egg Membranes
y = 0.5367x + 21.006R2 = 0.5085
9.0
10.0
11.0
12.0
13.0
14.0
15.0
16.0
-21.0 -20.0 -19.0 -18.0 -17.0 -16.0 -15.0 -14.0 -13.0
δ13C
δ15N

32
The carbon isotopic values of feathers and blood taken from the same bird reveal a high
degree of linear correlation between the isotopic values of these two tissues. (Fig. 7).
FIGURE 7. Relationship between δ13C in Laughing Gull feather and blood tissues
y = 1.1067x + 0.0591R2 = 0.8843
-20.5
-20
-19.5
-19
-18.5
-18
-17.5
-17
-16.5
-18.5 -18 -17.5 -17 -16.5 -16 -15.5 -15
δ13C blood
δ13C
fea
ther

33
The nitrogen isotopic compositions of feathers and blood are also significantly correlated
(Fig. 8).
FIGURE 8. Relationship between δ15N in Laughing Gull blood and feather tissues
y = 0.8595x + 2.468R2 = 0.7488
12
12.5
13
13.5
14
14.5
15
15.5
16
16.5
17
11 11.5 12 12.5 13 13.5 14 14.5 15 15.5 16
δ15N Blood
δ15N
Fea
ther

34
Results of these plots indicate that for both carbon and nitrogen, the isotopic compositions
of feathers and blood taken from individual birds are highly correlated (model: linear; R2
for carbon = 0.88, R2 for nitrogen = 0.75; P<0.01). However, the sulfur isotopic
compositions of the feathers and blood were not significantly correlated (model: linear;
R2= 0.13; P>0.05) (Fig. 9):
FIGURE 9. Relationship between δ34S of Laughing Gull blood and feather tissues
y = 0.418x + 4.9839R2 = 0.1285
7
7.5
8
8.5
9
9.5
10
10.5
7 7.5 8 8.5 9 9.5 10 10.5 11
δ34S blood
δ34S
fea
ther

35
Results of the sequential feather sampling indicate that this procedure can be used
to track significant changes in the carbon and nitrogen isotopic compositions of feathers
(Figures 10 and 11).
Figure 10. Sequential δ13C sampling of young Virginia Laughing Gull feathers
-18
-17.5
-17
-16.5
-16
-15.5
-15
-14.5
-14
0 5 10 15 20 25
Time (days since initiation of primary feather growth)
δ13C
feather 1Afeather AAfeather 1feather 2feather 3

36
Results of the t-tests comparing the isotopic values of feather base and tip portions
from the Virginia colony indicate that the portions taken from the base of feathers were
very highly significantly (t carbon = 6.11; t nitrogen = 4.44; df = 48; P<0.001) enriched in
both carbon and nitrogen relative to the corresponding tip portions of the same feathers.
Unlike the carbon and nitrogen isotopes, however, the t-test revealed no statistically
significant difference in the sulfur isotopic compositions of base and tip portions sampled
from the same feathers (table 4).
Figure 11. Sequential δ15N sampling of young Virginia Laughing Gull feathers
11
12
13
14
15
16
17
18
0 5 10 15 20 25
Time (days since initiation of primary feather growth)
δ15N
feather 1Afeather AAfeather 1feather 2feather 3

37Table 4. Relationship between stable isotopic compositions of base and tip
portions of Virginia colony feathers (mean +/- standard error).
Results of the same analysis performed on the isotopic values of the New York
colony feathers reveal that there is no significant difference between the carbon, nitrogen,
or sulfur isotopic compositions of base and tip portions (table 5).
Table 5. Relationship between stable isotopic compositions of base and tip
portions of New York feathers (mean +/- standard error).
FEATHERPORTION δ13C δ15N δ34S
TIP-16.6 +/-0.14
(N=49)13.6 +/- 0.20
(N=49)9.5 +/- 0.26
(N=37)
BASE-15.9 +/- 0.12
(N=49)14.3 +/- 0.19
(N=49)9.9 +/- 0.28
(N=36)
FEATHERPORTION δ13C δ15N δ34S
TIP-16.9 +/- 0.16
(N=20)10.7 +/- 0.26
(N=20)8.5 +/- 0.47
(N=20)
BASE-16.8 +/- 0.15
(N=20)10.6 +/- 0.24
(N=20)7.9 +/- 0.42
(N=20)

38
A mean isotopic value was obtained for each feather by taking the mean of the
base and tip portions. Using these mean values, the New York and Virginia colony
feathers were compared to determine whether there were significant differences between
the isotopic values of feathers taken from birds in the two colonies. Results of the t-tests
indicate that the Virginia Laughing Gull feathers were very significantly (t = 2.88; df = 68;
P<0.01) enriched in carbon relative to the New York feathers. Virginia feathers were also
very highly significantly (t nitrogen = 10.6; df nitrogen = 68; P<0.01; t sulfur = 2.98; df
sulfur = 40; P<0.01) more enriched in nitrogen and sulfur than feathers taken from
Laughing Gulls in the New York colony (table 6).
Table 6. Relationship between the stable isotopic compositions of Virginia and
New York feathers (mean +/- standard error).
Another series of t-tests was performed to determine whether there was a
significant difference between the isotopic compositions of feathers from birds within the
LOCATION δ13C δ15N δ34S
Virginia-16.2 +/-0.12
(N=49)13.9 +/- 0.17
(N=49)9.7 +/- 0.23
(N=36)
New York-16.8 +/- 0.14
(N=20)10.7 +/- 0.24
(N=20)8.2 +/- 0.42
(N=20)

39enclosures and those of birds that were not enclosed. Results indicate that the carbon
isotopic composition of feathers from birds in the enclosures were significantly (t = 1.97;
df = 47; P<0.05) more enriched than the carbon isotopic values of feathers from birds
outside the enclosures. There were no other significant differences between the isotopic
values of the feathers from enclosed and non-enclosed birds.
Results from a series of F-tests indicate that there is no statistically significant
difference in the variances of the carbon, nitrogen, or sulfur isotopic values of base and tip
portions of feathers obtained from either the Virginia or the New York colonies.
Differences in degrees of dietary variation were also examined on a spatial scale, as
the variances for the New York feathers were compared to those of the Virginia feathers.
F-tests were used to determine whether there was a significant difference in the amount of
variance in isotopic values obtained from the New York and Virginia feathers. Results
indicate that the variance in the carbon isotopic compositions of the tip portions of
Virginia feathers was significantly (F = 2.00; df = 48, 19; P<0.05) greater than the
variance in the New York feathers. Although none of the other analyses in this series
revealed statistically significant differences (P values all > 0.05), it is interesting to note
that the variances were higher in the carbon and nitrogen values of the Virginia feathers
(both base and tips), and the sulfur variance was higher for both base and tip portions in
the New York feathers.
Temporal intrapopulation variation in diets was examined for both the New York
and the Virginia colonies by comparing the variances of the base and tip portions of the
feathers. Results from a series of F-tests indicate that there is no statistically significant

40difference in the variances of the carbon, nitrogen, or sulfur isotopic values of base and tip
portions of feathers obtained from either the Virginia or the New York colonies.
DISCUSSION
The results of this study reveal a great deal about intrapopulation and
interpopulation variation in the diets of Laughing Gulls nesting in coastal Virginia and
New York. Muscle and blood samples taken from the young Virginia gulls were
isotopically very similar to one another. As muscle tissue generally has a slower turnover
rate than blood, it reflects the diet of organisms over a longer time span than that of blood.
The fact that the muscle and blood samples are so similar indicates that there was no
significant change in diet in the time periods reflected in the muscle and blood tissues.
Without controlled tests to measure the turnover rates of muscle and blood in Laughing
Gulls, however, it is difficult to ascertain the length of the temporal periods reflected in
muscle and blood tissue. Therefore, although these data indicate that there was no
significant diet change between the times the muscle and blood samples were produced by
the birds, without knowledge of how rapidly these tissues are replaced in young Laughing
Gulls in the wild, the time period over which the diet did not change significantly cannot
be precisely assessed.
Feather and blood isotopic values were also highly correlated among the marked
Virginia young. On average, the δ13C of the feathers appears to be about 1.5‰ to 2.0‰
more enriched than the blood samples taken from the same bird. Similarly, the δ15N of

41feathers appear to be about 0.4‰ more enriched than the blood values. On average, there
appears to be little difference in enrichment of sulfur isotopes in blood and feather samples
taken from the same individual. These blood-feather enrichment factors are valuable as
they may allow the estimation of the isotopic composition of the blood from birds for
which only feather samples were taken. This is especially valuable to studies seeking to
emphasize non-destructive and non-invasive mechanisms for isotopic analysis of birds.
Minimally invasive methods of obtaining tissues for isotopic analysis are especially
valuable to studies examining the diets of endangered or threatened species.
The muscle and blood isotopic values also reveal that there appear to be two
statistically distinct feeding patterns represented in the enclosed nests of the Virginia
colony. One group had more enriched δ13C values, and less enriched δ15N and δ34S values
relative to the other group. Perhaps the group with more enriched δ13C values (and less
enriched δ15N and δ34S) was consuming a diet higher in estuarine prey items, and the
group with more δ15N and δ34S enrichment and less enriched δ13C values represents a
group feeding more heavily on marine prey items. It is also interesting to note that for two
marked nests (7 and 8) more than one chick was sampled. Tissues from chicks in the same
nests had very similar isotopic compositions and therefore fell into the same clusters. At
the same time, the nests are not separated into the two distinct feeding patterns based on
proximity to one another. Nests from different areas in the marked portion of the colony
are randomly represented in the two feeding strategy groups (Fig. 12).

42
Figure 12: Spatial distribution of marked nests within the Virginia colony.
If adult Laughing Gulls nesting near one another learned foraging strategies from
one another, one would perhaps expect that nests displaying the two distinct feeding
strategies would be clustered spatially within the colony. This spatial clustering would also
be expected if adults from nearby nests often foraged in social groups. The fact that these
spatial clusters are not present therefore indicates that individual adult preferences for
food types and foraging areas are probably not determined by the feeding behavior of

43adults nesting nearby. This result also indicates that adults in this colony do not choose
nest location based on some perceived foraging similarity with other nearby nesting adults.
The results indicate that the δ13C of the feather base portions from enclosed
Virginia colony young were significantly less enriched than these values from the non-
enclosed young. It is not clear why there should be any difference in the isotopic
compositions of the enclosed and non-enclosed young. As there were no other significant
differences between the isotope values of the enclosed and non-enclosed young, it is likely
that the difference seen in the δ13C values of the feather bases is an artifact.
In terms of intrapopulation variation in diets, the results of the muscle and blood
isotopic analyses indicate that parent Laughing Gulls in the Virginia colony appear to
develop distinct preferences for certain food sources. If parent Laughing Gulls had no
preference as to what was brought to the nest for the young, one would expect that the
diets, and therefore isotopic compositions, of the young gulls would be not be statistically
distinct. Different parents may find it easier or more efficient to feed in certain locations, at
certain times, or on certain prey and these differences will therefore be reflected in the
amounts and types of food brought back to the young. These preferences may be acquired
either through learning from other birds or learning from personal experiences. As eggs
are produced by females, they therefore reflect the isotopic composition of the diet of the
female during the period of egg formation. The amount of variation in the isotopic
compositions of the egg membranes examined in this study indicate that there was
significant variation in the diets of the maternal Laughing Gulls in the period during which
the eggs were formed. There is a highly significant linear correlation in the egg membrane

44δ13C and δ15N values. Some of the adult females have relatively more depleted δ13C and
δ15N values, indicating a higher proportion of foods of terrestrial origin in the diet. In
contrast, the egg membranes of some females had more enriched δ13C and δ15N values,
thus indicating a diet higher in foods of marine origin.
The results indicate that although there is widespread heterogeneity in feeding
behavior within the population as a whole, there is also homogeneity of feeding behavior
at the individual level. The large-scale heterogeneity is evident from the highly significant
results of the analyses of variance. The smaller-scale homogeneity is indicated by the
distinct feeding clusters apparent in the isotopic compositions of blood taken from
Virginia young. The clusters indicate that at the individual or mating pair level, the parent
Laughing Gulls were feeding in a more homogenous manner. If their feeding was more
heterogeneous, the distinct differences in foraging strategies would not be apparent from
the blood isotopic values. Perhaps paired males and females learn preferred foraging
locations or food types from one another.
As some studies have found a tendency among seabirds to switch to a diet
relatively high in fish and low in foods of terrestrial origin after chick hatching, it is
interesting to compare isotope values from adult females during the period prior to egg
laying to the isotope values of feathers taken from nestlings that are being fed by their
parents. On average, the diet-primary feather fractionation factor for waterbirds is 3.05‰
for carbon and 4.22‰ for nitrogen. According to Hobson (1995), the diet-egg membrane
fractionation factor for a carnivorous bird is 2.7‰ for carbon and 3.5‰ for nitrogen.
Using these diet-tissue fractionation factors, it is possible to compare the isotope values of

45the egg membranes (representing the diet of adult females) to the isotope values of the
feathers (representing the diet of nestlings). As these fractionation factors were not
measured for Laughing Gulls specifically, however, the results of this comparison must be
interpreted cautiously. After correction for fractionation, the average diet of the adult
females has a δ13C value of –19.52‰ and a δ15N value of 8.59‰. The average δ34S for the
adult female Laughing Gull diet is 6.22‰. The corrected values obtained for young
Laughing Gulls based on the δ13C of feathers (-19.22‰) is quite similar, although the
average δ15N value of the young (9.72‰) is significantly larger (t = 4.04; df = 131;
P<0.001), indicating a diet consisting of either higher trophic level foods or more foods of
marine origin. The corrected δ34S of the young feathers (9.69‰) is also significantly (t =
11.2; df = 116; P<0.001) larger than the corrected value for the adult egg membranes.
This indicates that the juveniles may be fed a diet higher in foods of marine origin than
adults take for themselves prior to the hatching period. These data do not support the
findings of previous studies indicating that parents may compensate for immature salt
glands in young by providing a diet lower in foods of marine origin (Dosch 1997). The
carbon values for the young and adults may not be significantly different as the adults may
have been consuming a diet consisting of a mixture of foods of estuarine and terrestrial
origin. The carbon isotopic signatures of these food sources, when combined, would be
indistinguishable from a mostly marine-based diet. These results therefore indicate that
adult Laughing Gulls may feed their young more foods from the marine environment than
they would eat themselves. It is not clear whether the parents also switch to a diet higher
in marine foods after hatching or if they simply bring their young more marine foods than

46they eat themselves. This question could be resolved by isotopically analyzing tissues
obtained from adult Laughing Gulls in the Virginia colony during the period after
hatching.
Although the isotopic compositions of the muscle and blood samples give some
indication that there was no significant dietary change, the results of the analyses on the
base and tip feather portions indicate that there was an overall statistically significant shift
in the diets of the young Virginia birds between the initiation of primary feather formation
(at approximately one week of age) and near fledging (at approximately three to four
weeks of age).
Overall, the stable carbon and nitrogen isotopic compositions of the feathers
became more enriched over time. The base portions of the feathers (representing more
recent diet) were more enriched in carbon and nitrogen isotopes relative to the tip portions
(representing the diet after the initiation of primary feather growth). This pattern could be
indicative of a shift to more marine foods and less terrestrial foods over time, however the
fact that the sulfur isotopic composition of the feathers does not shift significantly from
base to tip fails to support this scenario. As nitrogen and carbon isotopes both undergo
enrichment as they move up a system trophically and sulfur isotopes appear to undergo no
such change, the results suggest that the shift reflects an increase in the trophic level of the
diet. Results of the analysis of the stable isotopic compositions of a variety of organisms in
the VCR-LTER system indicate that trophic level (and therefore δ15N and δ13C) increases
intraspecifically with increasing body size. Perhaps as the young gulls grow, they are
gradually capable of consuming larger prey items that therefore have higher δ15N and δ13C

47values. It is also possible that a food source that was not available to the colony during the
initial stages of primary feather formation later became available and was utilized by the
colony. As this food source was utilized by the parents for feeding their young, therefore,
the isotopic compositions of the feather being produced at that later time would reflect the
influence of this new food source. It is also possible that a food source that was available
to parent gulls earlier in the nesting period became unavailable as time passed. As this
study was only conducted during one breeding season, it is also possible that a food
source that is not normally available to the gulls was available in 1998 and therefore
altered their diet (and therefore isotopic compositions). The dietary shift observed through
the isotopic composition of the feathers may therefore be unique to the breeding season
during which the feather samples were taken. The results of the analysis of the Virginia
colony feathers do not, however, support the results of earlier studies (Dosch 1997) that
postulated that partially developed salt glands in young gulls necessitate increased feeding
of terrestrial food items in the early stages of nestling growth. Isotopic analyses on base
and tip portions of feathers from young in the New York colony indicate that there was no
significant dietary shift during the period of primary feather formation. Although there was
isotopic variation among feathers, the feather base and tip portions were not significantly
different isotopically. Like the Virginia colony, however, it is possible that significant
dietary shifts occur in some years and not in others due to temporal differences in food
availability. However, the 1998 data indicate that there was a significant dietary shift in
young from the Virginia colony whereas there was no such shift in the New York colony.

48As the stable isotopic signature shift most likely represents a shift to higher trophic
level foods over time, it is not clear why such a change would take place only at the
Virginia colony. The young gulls in both colonies would become more capable of
consuming larger food items as they matured. It is possible that the shift to larger and
higher trophic level marine food sources was not observed in the New York birds because
they do not consume a diet as high in foods of marine origin. This difference is
substantiated by the results of comparing the isotopic values of the New York and
Virginia colony feathers.
These data indicate that although the New York gulls do utilize marine food
sources to some extent, that they are more reliant on a diet that is very highly significantly
less enriched in δ15N and δ34S and that is highly significantly less enriched in δ13C. This
indicates that young gulls from the New York colony consume less foods of marine origin
and more of terrestrial origin than the Virginia colony birds. If these terrestrial foods were
of anthropogenic origin, one would not necessarily expect their isotope signals to change
during the course of the nesting season. The New York birds may also consume
proportionately more mainland insects, and as most of these insects feed directly on the
primary producers throughout the season, one would also not expect that their trophic
levels would increase during the summer season.
Variance was also used as an indication of relative intrapopulation or
interpopulation variation in diets. Temporal intrapopulation variation in diets was
examined for both the New York and the Virginia colonies by comparing the variances of
the base and tip portions of the feathers. Significantly more variance in either the base or
49the tip portions may indicate a temporal shift within the colony to a diet either higher or
lower in food source variety. This difference may then be attributed to the developmental
stages to which the temporal periods correspond. There was no statistically significant
base/tip difference for either the New York or Virginia colonies.
Differences in degrees of dietary variation were also examined on a spatial scale, as
the variances for the New York feathers were compared to those of the Virginia feathers.
The variance in the δ13C values of the Virginia feather tips was significantly higher than
the New York tips. This difference could be due either to more variance in the δ13C food
sources available to the Virginia gulls, or it could be an indication that during the period of
primary feather growth initiation, young birds from the Virginia colony were fed a wider
variety of food sources than the New York colony young. It is also possible that this result
is an artifact.
The results of the stable isotopic analysis of Virginia Coast Reserve (VCR)
organisms reveal that marine, estuarine, and terrestrial organisms can be reliably separated
based on their stable isotopic compositions (Table A-1). Also, trophic levels within each
of these systems are apparent, especially from the nitrogen isotope values. It is also clear
that certain species have more intraspecific variation in their isotopic compositions. These
differences in level of variation are indicative of differences in the amount of intraspecific
dietary variation that exists between species living in the same environments.
Conclusions

50
Overall, stable isotope analysis is a strong indicator of trophic level, as well as the
degree of intrapopulation, interpopulation, and temporal variation in the diets of avian
species. The isotopic compositions of feathers obtained from the Virginia and New York
colonies are significantly different, thus indicating that the Laughing Gulls in the Virginia
colony consumed a significantly different diet from Laughing Gulls nesting in the New
York colony. The Virginia colony birds consumed significantly more marine foods than
did the New York colony birds. Young gulls from the Virginia colony also underwent a
significant dietary shift during the period between primary feather initiation and fledging to
a diet consisting of organisms at higher trophic levels. Young gulls in the New York
colony underwent no such diet shift. This may be due to the fact that the New York
colony nestlings were fed a diet consisting of more foods of terrestrial origin, and one
would not expect that these food sources would increase trophically over the course of the
summer season. There was also a significant amount of intrapopulation dietary variation.
This variation was observed for adults from the Virginia colony as well as nestlings from
both the Virginia and New York colonies. Two distinct feeding strategies were observed
based on the muscle and blood samples taken from Virginia colony nestlings. One group
was fed a diet consisting of more foods of estuarine origin, while the other group was fed
more marine prey items. The results also indicate that adult Laughing Gulls consume more
terrestrial foods during the period prior to egg laying than they feed their nestlings.
Further study would be necessary to determine whether the adults also switch to a diet
higher in foods of marine and estuarine origin after hatching.

51
References

52Alisauskas, R.T., and K.A. Hobson. 1993. Determination of Lesser Snow Goose diets and
winter distribution using stable isotope analysis, Journal of Wildlife Management, vol. 57(1), 49-54.
Annett, C. 1987. Proximate mechanisms affecting dietary switches in breeding gulls, Studies in Avian Biology, vol. 10, 102.
Bearhop, S., D.R. thompson, S. Waldron, I.C. Russell, G. Alexander, and R.W. Furness. 1999. Stable isotopes indicate the extent of freshwater feeding by cormorants Phalacrocorax carbo shot at inland fisheries in England, Journal of Applied Ecology, vol. 36, 75-84.
Bennett, C.A. and N.L. Franklin. 1954: Statistical Analysis in Chemistry and the Chemical Industry, John Wiley & Sons, Inc..
Brown, K.M., J.L. Tims, M.E. Richmond, and R.M. Erwin. 1998. Diet composition, Resource partitioning and competition in a community of Larus gulls in Jamaica Bay, New York city, abstract from Meeting of the Colonial Waterbird Society, October, 1998, Miami, FL.
Burger, J. 1996. Laughing Gull (Larus atricilla). In The Birds of North America, No. 225 (A. Poole and F. Gill, eds.). The Academy of Natural Sciences, Philadelphia, PA, and The American Ornithologists’ Union, Washington, D.C.
Cabana, G., and J.B. Rasmussen. 1994. Modelling food chain structure and contaminant bioaccumulation using stable nitrogen isotopes, Nature, vol. 372, 255-257.
Chamberlain, C.P., J.D. Blum, R.T. Holmes, Xiahong Feng, T.W. Sherry, and G.R. Graves. 1997. The use of isotope tracers for identifying populations of migratory birds, Oecologia, vol. 109, 132-141.
Collier, K.J., and G.L. Lyon. 1991. Trophic pathways and diet of Blue Duck (Hymenolaimus malacorhynchos) on Manganuiateao River: a stable carbon isotope study, New Zealand Journal of Marine and Freshwater Research, vol. 25, 181-186.
Creach, V., M.T. Schricke, G. Bertru, and A. Mariotti. 1997. Stable isotopes and gut analyses to determine feeding relationships in saltmarsh macroconsumers, Estuarine, Coastal and Shelf Science, vol. 44, 599-611.
DeNiro, M.J., and S. Epstein. 1978. Influence of diet on the distribution of carbon isotopes in animals, Geochimica et Cosmochimica Acta, vol. 42, 495- 506.
DeNiro, M.J., and S. Epstein. 1981. Influence of diet on the distribution of nitrogen isotopes in animals, Geochimica et Cosmochimica Acta, vol. 45, 341- 351.
Dieudonne, J.A. Keystone species as indicators of climate change (KSICC): a feasibility study, M.S. thesis, Department of Environmental Sciences, University of Virginia, May 1998.
Dinsmore, J.J., and R.W. Schreiber. 1974. Breeding and annual cycle of Laughing Gulls in Tampa Bay, Florida, The Wilson Bulletin, vol. 86(4), 419-427.
Dosch, J.J. 1997. Diet of nestling Laughing Gulls in Southern New Jersey, Colonial Waterbirds, vol. 20(2), 273-281.
Dosch, J.J. 1997. Salt tolerance of nestling Laughing Gulls: an experimental field

53investigation, Colonial Waterbirds, vol. 20(3), 449-457.
Gannes, L.Z., D.M. O’Brien, and C.M. del Rio. 1997. Stable isotopes in animal ecology: assumptions, caveats, and a call for more laboratory experiments, Ecology, vol. 1997, 1271-1276.
Hackney, C.T., and E.B. Haines. 1980. Stable carbon isotope composition of fauna and organic matter collected in a Mississippi estuary, Estuarine and Coastal Marine Science, vol. 10, 703-708.
Haines, E.B. 1976. Stable carbon isotope ratios in the biota, soils and tidal water of a Georgia salt marsh, Estuarine and Coastal Marine Science, vol. 4, 609-616.
Haines, E.B. 1977. The origins of detritus in Georgia salt marsh estuaries, Oikos, vol. 29, 254-260.
Haines, E.B. 1976. Relation between the stable isotope composition of fiddler crabs, plants, and soils in a salt marsh, Limnology and Oceanography, vol. 21, 880-883.
Haines, E.B., and C.L. Montague. 1979. Food sources of estuarine invertebrates analyzed using 13C/12C ratios, Ecology, vol. 60, No.1, 48-56.
Hammer, B.T., M.L. Fogel, and T.C. Hoering. 1998. Stable carbon isotope ratios of fatty acids in seagrass and redhead ducks, Chemical Geology, 152, 29-41.
Haramis, M. 1994. Use of stable isotope ratios to assess the diet of wintering Canvasbacks on Chesapeake Bay, abstract from Northeast Fish and Wildlife Conference, May 1994, Burlington, VT.
Harriman, A.E. 1967. Laughing Gulls offered saline in preference and survival tests, Physiological Zoology, vol. 40, 273-279.
Hayden, B.P., R.D. Dueser, J.T. Callahan, and H.H. Shugart. 1991. Long-term research at the Virginia Coast Reserve, Bioscience, vol. 41(5), 310-318.
Hays, H., and M. LeCroy. 1971. Field criteria for determining incubation stage in eggs of the Common Tern, The Wilson Bulletin, vol. 83(4), 425-429.
Hebert, C.E., J.L. Shutt, K.A. Hobson, and D.V. Chip Weselch. 1999. Spatial and Temporal differences in the diet of Great Lakes Herring Gulls (Larus argentatus): evidence from stable isotope analysis, Canadian Journal of Fisheries and Aquatic Science, vol. 56, 323-338.
Hobson, K.A. 1987. Use of stable-carbon isotope analysis to estimate marine and terrestrial protein content in gull diets, Canadian Journal of Zoology, vol. 65, 1210-1213.
Hobson, K.A. 1990. Stable isotope analysis of Marbled Murrlets: evidence for freshwater feeding and determination of trophic level, Condor, vol. 92, 897-903.
Hobson, K.A. 1993. Trophic relationships among high Arctic seabirds: insights from tissue-dependent stable-isotope models, Marine Ecology Progress Series, vol. 95, 7-18.
Hobson, K.A. 1995. Reconstructing avian diets using stable-carbon and nitrogen isotope analysis of egg components: patterns of isotopic fractionation and turnover, Condor, vol. 97, 752-762.
Hobson, K.A., R.T. Alisauskas, and R.G. Clark. 1993. Stable-nitrogen isotope enrichment

54In avian tissues due to fasting and nutritional stress: implications for isotopic analysis of diet, Condor, vol. 95, 388-394.
Hobson, K.A., and R.G. Clark. 1992. Assessing avian diets using stable isotopes I: turnover of 13C in tissues, Condor, vol. 94, 181-188.
Hobson, K.A., and R.G. Clark. 1992. Assessing avian diets using stable isotopes II: factors influencing diet-tissue fractionation, Condor, vol. 94, 189-197.
Hobson, K.A., and R.G. Clark. 1993. Turnover of 13C in cellular and plasma fractions of blood: implications for nondestructive sampling in avian dietary studies, Auk, vol. 110(3), 638-641.
Hobson, K.A., J.F. Piatt, and J. Pitocchelli. 1994. Using stable isotopes to determine Seabird trophic relationships, Journal of Animal Ecology, vol. 63, 786-798.
Hobson, K.A., and W.A. Montevecchi. 1991. Stable isotope determinations of trophic relationships of Great Auks, Oecologia, vol. 87, 528-531.
Hobson, K.A., and S.G. Sealy. 1991. Marine protein contributions to the diet of Northern Saw-Whet Owls on the Queen Charlotte Islands: a stable-isotope approach, Auk, vol. 108, 437-433.
Hobson, K.A., and L.I. Wassenaar. 1997. Linking breeding and wintering grounds of neotropical migrant songbirds using stable hydrogen isotopic analysis of feathers, Oecologia, vol. 109, 142-148.
Hughes, E.H., and E.B. Sherr. 1983. Subtidal food webs in a Georgia estuary: 13C analysis, Journal of Experimental Marine Biology and Ecology, vol. 67, 227-242.
Jackson, D., and D.D. Harkness. 1987. The use and interpretation of 13C values as a means of establishing dietary composition, Oikos, vol. 48, 258-264.
Johnston, J.W., and K.L. Bildstein. 1990. Dietary salt as a physiological constraint in White Ibis breeding in an estuary, Physiological Zoology, vol. 63(1), 190-207.
Kwak, T.J., and J.B. Zedler. 1997. Food web analysis of Southern California coastal wetlands using multiple stable isotopes, Oecologia, vol. 110, 262-277.
Lajtha, K., and R.H. Michener, 1994. Introduction, in Stable Isotopes in Ecology and Environmental Science. Oxford: Blackwell Scientific Publications.
Lajtha, K., and J.D. Marshall. 1994. Sources of variation in the stable isotopic composition of plants, in Stable isotopes in Ecology and Environmental Science (eds. K. Lajtha and R.H. Michener). Oxford: Blackwell Scientific Publications, pp. 1-21.
Macko, S.A., M.F. Estep, P.E. Hare, and T.C. Hoering. 1983. Stable nitrogen and carbon isotopic composition of individual amino acids isolated from cultured microorganisms. Carnegie Institute Washington Yearbook, vol. 82, 404-410.
Michener, R.H., and D.M. Schell. 1994. Stable isotope ratios as tracers in marine aquatic food webs, in Stable Isotopes in Ecology and Environmental Science (eds. K. Lajtha and R.H. Michener). Oxford: Blackwell Scientific Publications, pp. 138-157
Minagawa, M., and E. Wada. 1984. Stepwise enrichment of 15N along food chains: further evidence for the relation between δ15N and animal age, Geochimica et Cosmochimica Acta, vol. 48, 1135-1140.
Mizutani, H., M. Fukuda, and Y. Kabaya. 1992. 13C and 15N enrichment factors of

55feathers of 11 species of adult birds, Ecology, vol. 73(4), 1391-1395.
Mizutani, H., Y.Kabaya, and E. Wada. 1991. Nitrogen and carbon isotope compositions relate linearly in Cormorant tissues and Its diet, Isotopenpraxis, vol. 27(4), 166-168.
Mizutani, H., M. Fukuda, Y. Kabaya and E. Wada. 1990. Carbon isotope ratio of feathers reveals feeding behavior of Cormorants, The Auk, vol. 107, 400-403.
Neill, C., and J.C. Cornwell. 1992. Stable carbon, nitrogen, and sulfur isotopes in a prairie marsh food web, Wetlands, vol. 12(3), 217-224.
Peterson, B.J., and R.W. Howarth. 1987. Sulfur, carbon, and nitrogen isotopes used to trace organic matter flow in the salt-marsh estuaries of Sapelo Island, Georgia, Limnology and Oceanography, vol. 32(6), 1195-1213.
Peterson, B.J., R.W. Howarth, and R.H. Garritt. 1985. Multiple stable isotopes used to trace the flow of organic matter in estuarine food webs, Science, vol. 227, 1361-1363.
Peterson, B.J., R.W. Howarth, and R.H. Garritt. 1986. Sulfur and carbon isotopes as tracers of salt-marsh organic matter flow, Ecology, vol. 67(4), 865-874.
Pietrotti, R., and C.A. Annett. 1990. Diet and reproductive output in seabirds, BioScience, vol. 40(8), 568-574.
Rau, G.H. 1991,1992. The relationship between trophic level and stable isotopes of carbon and nitrogen, Southern California Coastal Water Research Project- Coastal Water Research Project Biennial Report for Years 1981-1982, 143-148.
Rau, G.H., D.G. Ainley, J.L. Bengston, J.J. Torres, and T.L. Hopkins. 1992. 15N/14N and 13C/12C in Weddell Sea birds, seals, and fish: implications for diet and trophic structure, Marine Ecology Progress Series, vol. 84, 1-8.
Schaffner, F.C., and P.K. Swart. 1991. Influence of diet and environmental water on the carbon and oxygen isotopic signatures of seabird eggshell carbonate, Bulletin of Marine Science, vol. 48(1), 23-28.
Schacher, T.A., and T.H. Wooldridge. 1996. Origin and trophic importance of detritus- evidence from stable isotopes in the benthos of a small, temperate estuary, Oecologia, vol. 106, 382-388.
Schoeninger, M.J., and M.J. DeNiro. 1984. Nitrogen and carbon isotopic composition of bone collagen from marine and terrestrial animals, Geochimica et Cosmochimica Acta, vol. 48, 625-639.
Schreiber, E.A., R.W. Schreiber, and J.J. Dinsmore. 1979. Breeding biology of Laughing Gulls in Florida. part I: nesting, egg, and incubation parameters, Bird-Banding, vol. 50(4), 304-321.
Schreiber, E.A., and R.W. Schreiber. 1980. Breeding biology of Laughing Gulls in Florida. part II: nestling parameters, Journal of Field Ornithology, vol. 51(4), 340-355.
Sherr, E.B. 1982. Carbon isotope composition of organic seston and sediments in a Georgia salt marsh estuary, Geochimica et Cosmochimica Acta, vol. 46, 1227- 1232.
Simenstad, C.A., and R.C. Wissmar. 1985. 13C evidence of the origins and fates of organic carbon in estuarine and nearshore food webs, Marine Ecology- Progress

56Series, vol. 22, 141-152.
Smith, B.N. 1972. Natural abundance of the stable isotopes of carbon in biological systems, BioScience, vol. 22(4), 226-231.
Smith, B.N. and S. Epstein. 1970. Biogeochemistry of the stable isotopes of hydrogen and carbon in salt marsh biota, Plant Physiology, vol. 46, 738-742.
Stephenson, R.L., and G.L. Lyon. 1995. Carbon-13 depletion in an estuarine bivalve: Detection of marine and terrestrial food sources, Oecologia, vol. 55, 110-113.
Sydeman, W.J., K.A. Hobson, P. Pyle, and E.B. McLaren. 1997. Trophic relationships among seabirds in central California: combined stable isotope and conventional dietary approach, Condor, vol. 99, 327-336.
Thompson, D.R., and R.W. Furness. 1995. Stable-isotope ratios of carbon and nitrogen in feathers indicate seasonal dietary shifts in Northern Fulmars, Auk, vol. 112(2), 493-498.
Thompson, D.R., R.W Furness, and S.A. Lewis. 1995. Diets and long-term changes in δ15N and δ13C values in northern fulmars Fulmarus glacialis from two northeast Atlantic colonies, Marine Ecology Progress Series, vol. 125, 3-11.
Tieszen, L.L., T.W. Boutton, K.G. Tesdahl, and N.A. Slade. 1983. Fractionation and turnover of stable carbon isotopes in animal tissues: implications for δ13C analysis of diet, Oecologia, vol. 57, 32-37.
Wardlaw, A.C. 1985: Practical Statistics for Experimental Biologists, John Wiley & Sons.
Zuwaylif, F.H. 1980: General Applied Statistics, Addison-Wesley Publishing Company.

57
APPENDIX A
Stable isotopic compositions of organisms from the Virginia and New York systems
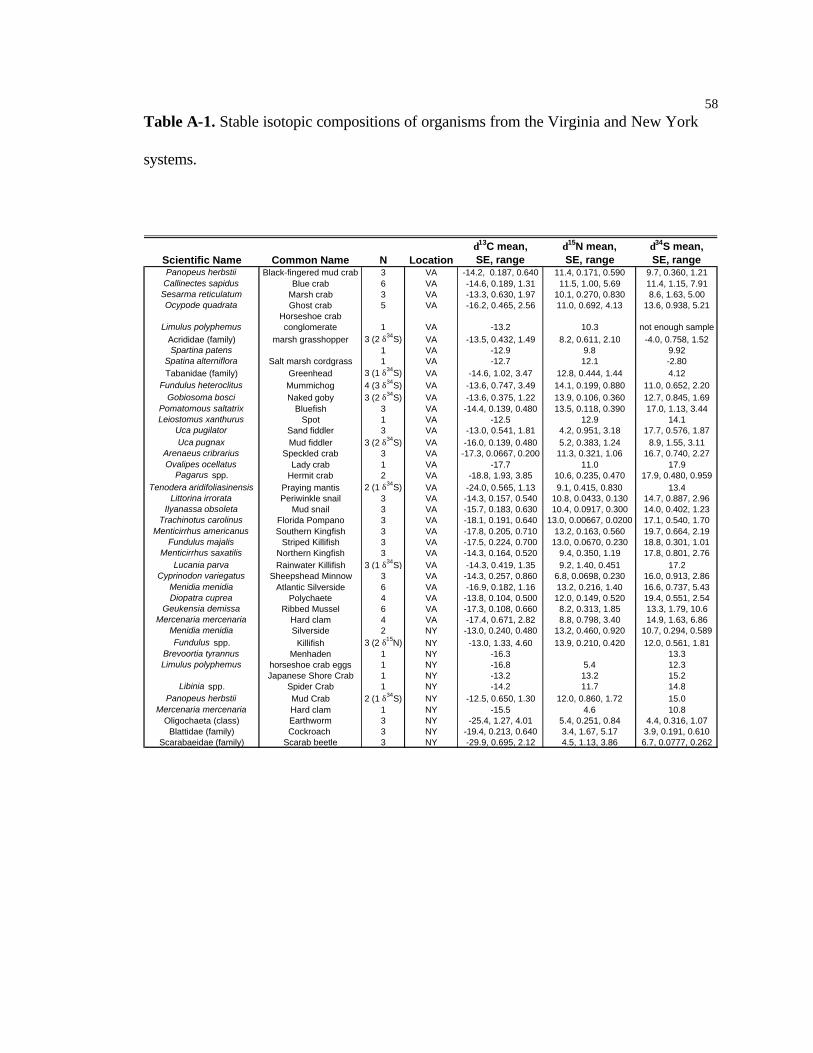
58Table A-1. Stable isotopic compositions of organisms from the Virginia and New York
systems.
Scientific Name Common Name N Locationδ13C mean,SE, range
δ15N mean,SE, range
δ34S mean,SE, range
Panopeus herbstii Black-fingered mud crab 3 VA -14.2, 0.187, 0.640 11.4, 0.171, 0.590 9.7, 0.360, 1.21Callinectes sapidus Blue crab 6 VA -14.6, 0.189, 1.31 11.5, 1.00, 5.69 11.4, 1.15, 7.91
Sesarma reticulatum Marsh crab 3 VA -13.3, 0.630, 1.97 10.1, 0.270, 0.830 8.6, 1.63, 5.00Ocypode quadrata Ghost crab 5 VA -16.2, 0.465, 2.56 11.0, 0.692, 4.13 13.6, 0.938, 5.21
Limulus polyphemusHorseshoe crabconglomerate 1 VA -13.2 10.3 not enough sample
Acrididae (family) marsh grasshopper 3 (2 δ34S) VA -13.5, 0.432, 1.49 8.2, 0.611, 2.10 -4.0, 0.758, 1.52Spartina patens 1 VA -12.9 9.8 9.92
Spatina alterniflora Salt marsh cordgrass 1 VA -12.7 12.1 -2.80Tabanidae (family) Greenhead 3 (1 δ34S) VA -14.6, 1.02, 3.47 12.8, 0.444, 1.44 4.12
Fundulus heteroclitus Mummichog 4 (3 δ34S) VA -13.6, 0.747, 3.49 14.1, 0.199, 0.880 11.0, 0.652, 2.20Gobiosoma bosci Naked goby 3 (2 δ34S) VA -13.6, 0.375, 1.22 13.9, 0.106, 0.360 12.7, 0.845, 1.69
Pomatomous saltatrix Bluefish 3 VA -14.4, 0.139, 0.480 13.5, 0.118, 0.390 17.0, 1.13, 3.44Leiostomus xanthurus Spot 1 VA -12.5 12.9 14.1
Uca pugilator Sand fiddler 3 VA -13.0, 0.541, 1.81 4.2, 0.951, 3.18 17.7, 0.576, 1.87Uca pugnax Mud fiddler 3 (2 δ34S) VA -16.0, 0.139, 0.480 5.2, 0.383, 1.24 8.9, 1.55, 3.11
Arenaeus cribrarius Speckled crab 3 VA -17.3, 0.0667, 0.200 11.3, 0.321, 1.06 16.7, 0.740, 2.27Ovalipes ocellatus Lady crab 1 VA -17.7 11.0 17.9
Pagarus spp. Hermit crab 2 VA -18.8, 1.93, 3.85 10.6, 0.235, 0.470 17.9, 0.480, 0.959Tenodera aridifoliasinensis Praying mantis 2 (1 δ34S) VA -24.0, 0.565, 1.13 9.1, 0.415, 0.830 13.4
Littorina irrorata Periwinkle snail 3 VA -14.3, 0.157, 0.540 10.8, 0.0433, 0.130 14.7, 0.887, 2.96Ilyanassa obsoleta Mud snail 3 VA -15.7, 0.183, 0.630 10.4, 0.0917, 0.300 14.0, 0.402, 1.23
Trachinotus carolinus Florida Pompano 3 VA -18.1, 0.191, 0.640 13.0, 0.00667, 0.0200 17.1, 0.540, 1.70Menticirrhus americanus Southern Kingfish 3 VA -17.8, 0.205, 0.710 13.2, 0.163, 0.560 19.7, 0.664, 2.19
Fundulus majalis Striped Killifish 3 VA -17.5, 0.224, 0.700 13.0, 0.0670, 0.230 18.8, 0.301, 1.01Menticirrhus saxatilis Northern Kingfish 3 VA -14.3, 0.164, 0.520 9.4, 0.350, 1.19 17.8, 0.801, 2.76
Lucania parva Rainwater Killifish 3 (1 δ34S) VA -14.3, 0.419, 1.35 9.2, 1.40, 0.451 17.2Cyprinodon variegatus Sheepshead Minnow 3 VA -14.3, 0.257, 0.860 6.8, 0.0698, 0.230 16.0, 0.913, 2.86
Menidia menidia Atlantic Silverside 6 VA -16.9, 0.182, 1.16 13.2, 0.216, 1.40 16.6, 0.737, 5.43Diopatra cuprea Polychaete 4 VA -13.8, 0.104, 0.500 12.0, 0.149, 0.520 19.4, 0.551, 2.54
Geukensia demissa Ribbed Mussel 6 VA -17.3, 0.108, 0.660 8.2, 0.313, 1.85 13.3, 1.79, 10.6Mercenaria mercenaria Hard clam 4 VA -17.4, 0.671, 2.82 8.8, 0.798, 3.40 14.9, 1.63, 6.86
Menidia menidia Silverside 2 NY -13.0, 0.240, 0.480 13.2, 0.460, 0.920 10.7, 0.294, 0.589Fundulus spp. Killifish 3 (2 δ15N) NY -13.0, 1.33, 4.60 13.9, 0.210, 0.420 12.0, 0.561, 1.81
Brevoortia tyrannus Menhaden 1 NY -16.3 13.3Limulus polyphemus horseshoe crab eggs 1 NY -16.8 5.4 12.3
Japanese Shore Crab 1 NY -13.2 13.2 15.2Libinia spp. Spider Crab 1 NY -14.2 11.7 14.8
Panopeus herbstii Mud Crab 2 (1 δ34S) NY -12.5, 0.650, 1.30 12.0, 0.860, 1.72 15.0Mercenaria mercenaria Hard clam 1 NY -15.5 4.6 10.8
Oligochaeta (class) Earthworm 3 NY -25.4, 1.27, 4.01 5.4, 0.251, 0.84 4.4, 0.316, 1.07Blattidae (family) Cockroach 3 NY -19.4, 0.213, 0.640 3.4, 1.67, 5.17 3.9, 0.191, 0.610
Scarabaeidae (family) Scarab beetle 3 NY -29.9, 0.695, 2.12 4.5, 1.13, 3.86 6.7, 0.0777, 0.262
59
APPENDIX B
Raw isotope data

60Table B-1. Isotopic values for muscle and blood from young Virginia colony Laughing
Gulls
Sample Type Sample ID δ13C δ15N δ34Smuscle nest 1 -16.8 13.0 9.8muscle nest 2 -19.8 12.4muscle nest 3 -19.3 15.0muscle nest 4 -20.2 15.5muscle nest 5 -17.2 12.8muscle nest 6 -17.3 14.2muscle nest 7 -17.9 12.8muscle nest 7 (RG) -18.2 12.7muscle nest 8 -19.7 15.2muscle nest 8 (GR) -19.4 15.3muscle nest 9 -17.6 12.1muscle nest 11 -17.2 12.5blood nest 1 -17.4 13.0 11.3blood nest 2 -20.2 11.9 10.9blood nest 3 -19.5 14.0 10.7blood nest 4 -19.5 15.6 10.5blood nest 5 -17.3 12.7 6.7blood nest 6 -17.5 13.8 10.2blood nest 7 -17.7 12.8 9.3blood nest 7 (RG) -17.8 12.7 8.6blood nest 8 -19.3 14.4 10.0blood nest 8 (GR) -19.1 15.2 10.4blood nest 9 -17.7 12.1 8.7blood nest 11 -17.5 12.5 10.0

61Table B-1. Isotopic values for muscle and blood from young Virginia colony Laughing
Gulls, continued.
Sample Type Sample ID δ13C δ15N δ34Sblood nest 1 -17.4 13.0 11.3blood nest 5 -17.3 12.7 6.7blood nest 6 -17.5 13.8 10.2blood nest 7 -17.7 12.8 9.3blood nest 7 (RG) -17.8 12.7 8.6blood nest 9 -17.7 12.1 8.7blood nest 11 -17.5 12.5 10.0
blood nest 2 -20.2 11.9 10.9blood nest 3 -19.5 14.0 10.7blood nest 4 -19.5 15.6 10.5blood nest 8 -19.3 14.4 10.0blood nest 8 (GR) -19.1 15.2 10.4

62Table B-2. Isotopic values for Virginia colony Laughing Gull egg membranes with
estimations of δ13C and δ15N of diets based on diet-tissue fractionation factors.
Sample Type Sample ID δ13C δ13C diet δ15N δ15N diet δ34SEgg Membrane 1 -13.7 -16.4 12.0 8.5 3.7Egg Membrane 2 -15.8 -18.5 12.3 8.8 3.8Egg Membrane 3 -17.1 -19.8 12.5 9.0 5.4Egg Membrane 4 -14.8 -17.5 12.9 9.4 5.4Egg Membrane 5 -15.0 -17.7 12.6 9.1 5.3Egg Membrane 6 -14.5 -17.2 13.2 9.7 6.1Egg Membrane 7 -15.8 -18.5 13.2 9.7 7.0Egg Membrane 8 -16.0 -18.7 12.2 8.7 4.0Egg Membrane 9 -15.9 -18.6 12.5 9.0 4.8Egg Membrane 10 -15.9 -18.6 13.0 9.5 2.5Egg Membrane 11 -18.7 -21.4 10.4 6.9 3.6Egg Membrane 12 -19.8 -22.5 9.5 6.0 7.8Egg Membrane 13 -16.4 -19.1 12.1 8.6 6.5Egg Membrane 14 -17.0 -19.7 11.1 7.6 5.5Egg Membrane 15 -19.0 -21.7 10.4 6.9 4.8Egg Membrane 16 -20.4 -23.1 10.0 6.5 4.0Egg Membrane 17 -16.4 -19.1 11.3 7.8 3.8Egg Membrane 18 -17.6 -20.3 11.8 8.3 7.7Egg Membrane 19 -16.9 -19.6 12.2 8.7 5.4Egg Membrane 20 -15.0 -17.7 13.8 10.3 7.2Egg Membrane 21 -17.2 -19.9 13.1 9.6 9.2Egg Membrane 22 -17.7 -20.4 10.2 6.7 5.4Egg Membrane 23 -15.9 -18.6 12.5 9.0 5.9Egg Membrane 24 -15.3 -18.0 12.6 9.1 4.3Egg Membrane 25 -17.4 -20.1 12.2 8.7 6.1Egg Membrane 26 -16.2 -18.9 12.7 9.2 5.9Egg Membrane 27 -15.2 -17.9 13.2 9.7 4.9Egg Membrane 28 -16.5 -19.2 12.4 8.9 5.9Egg Membrane 29 -18.0 -20.7 12.5 9.0 5.8Egg Membrane 30 -16.6 -19.3 12.6 9.1 6.4

63Table B-2. Isotopic values for Virginia colony Laughing Gull egg membranes with
estimations of δ13C and δ15N of diets based on diet-tissue fractionation factors, continued.
Sample Type Sample ID δ13C δ13C diet δ15N δ15N diet δ34S
Egg Membrane 31 -16.8 -19.5 11.6 8.1 5.8Egg Membrane 32 -16.8 -19.5 12.3 8.8 5.5Egg Membrane 33 -19.5 -22.2 11.0 7.5 5.5Egg Membrane 34 -18.5 -21.2 12.6 9.1 6.9Egg Membrane 35 -19.2 -21.9 11.6 8.1 5.2Egg Membrane 36 -18.6 -21.3 12.6 9.1 6.0Egg Membrane 37 -16.0 -18.7 12.3 8.8 5.8Egg Membrane 38 -16.8 -19.5 12.9 9.4 5.7Egg Membrane 39 -19.2 -21.9 10.4 6.9 5.2Egg Membrane 40 -18.1 -20.8 12.3 8.8 5.6Egg Membrane 41 -16.8 -19.5 11.4 7.9 4.3Egg Membrane 42 -14.6 -17.3 15.2 11.7 7.6Egg Membrane 43 -16.0 -18.7 13.5 10.0 7.2Egg Membrane 44 -15.3 -18.0 13.2 9.7 6.3Egg Membrane 45 -18.3 -21.0 11.3 7.8 5.2Egg Membrane 46 -17.2 -19.9 12.7 9.2 6.4Egg Membrane 47 -14.8 -17.5 13.6 10.1 6.7Egg Membrane 48 -16.9 -19.6 11.9 8.4 6.4Egg Membrane 49 -19.7 -22.4 9.6 6.1 3.4Egg Membrane 50 -15.5 -18.2 12.2 8.7 6.2Egg Membrane 51 -16.2 -18.9 12.3 8.8 4.4Egg Membrane 52 -17.8 -20.5 10.4 6.9 3.9Egg Membrane 53 -17.2 -19.9 11.6 8.1 5.0Egg Membrane 54 -16.0 -18.7 11.8 8.3 5.0Egg Membrane 55 -18.8 -21.5 10.5 7.0 10.4Egg Membrane 56 -15.9 -18.6 13.4 9.9 8.3Egg Membrane 57 -17.2 -19.9 11.1 7.6 7.3Egg Membrane 58 -17.3 -20.0 11.5 8.0 6.3Egg Membrane 59 -17.4 -20.1 11.0 7.5 6.1Egg Membrane 60 -15.8 -18.5 11.3 7.8 6.3

64Table B-2. Isotopic values for Virginia colony Laughing Gull egg membranes with
estimations of δ13C and δ15N of diets based on diet-tissue fractionation factors, continued.
Egg Membrane 61 -15.4 -18.1 13.0 9.5 7.6Egg Membrane 62 -15.9 -18.6 13.9 10.4 9.5Egg Membrane 63 -20.3 -23.0 10.0 6.5 6.6Egg Membrane 64 -14.8 -17.5 12.9 9.4 7.4Egg Membrane 65 -15.3 -18.0 12.2 8.7 6.1Egg Membrane 66 -15.9 -18.6 10.7 7.2 5.9Egg Membrane 67 -17.4 -20.1 11.6 8.1 5.0Egg Membrane 68 -17.4 -20.1 10.9 7.4 6.7Egg Membrane 69 -15.9 -18.6 11.1 7.6 7.2Egg Membrane 70 -17.5 -20.2 10.6 7.1 5.6Egg Membrane 71 -15.9 -18.6 12.7 9.2 8.3Egg Membrane n. 2 c.1, 72 -17.0 -19.7 11.2 7.7 7.0Egg Membrane n. 9, 73 -15.8 -18.5 12.1 8.6 7.5Egg Membrane n. 7, 74 -16.4 -19.1 11.1 7.6 6.9Egg Membrane n. 9 c. 3, 75 -16.5 -19.2 12.9 9.4 8.1Egg Membrane n. 9 c. 2, 76 -17.2 -19.9 13.2 9.7 8.5Egg Membrane n. 8 c. 1, 77 -17.1 -19.8 11.7 8.2 6.6Egg Membrane n. 8 c. 2, 78 -18.5 -21.2 9.8 6.3 5.0Egg Membrane n. 15, 79 -14.5 -17.2 12.5 9.0 6.7Egg Membrane n. 1 XX, 80 -15.1 -17.8 13.2 9.7 8.2Egg Membrane old n. 6, 81 -20.1 -22.8 17.4 13.9 10.9Egg Membrane new n. 6, 82 -18.4 -21.1 15.6 12.1 11.2
Sample Type Sample ID δ13C δ13C diet δ15N δ15N diet δ34S

65Table B-3. Results of lipid removal treatments on feather isotopic values.
Treated δ13C δ15N Not-treated δ13C δ15Nquill tip -15.8 13.4 quill tip -15.8 13.4
quill base -15.9 14.5 quill base -16.2 13.9downy tip -16.8 13.9 downy tip -16.4 13.7
downy base -16.1 14.3 downy base -16.3 14.0
quill tip -15.6 11.9 quill tip -15.8 12.5quill base -15.6 14.1 quill base -15.2 14.5downy tip -16.1 12.5 downy tip -16.1 12.3
downy base -15.2 14.6 downy base -15.1 14.6
quill tip -15.0 12.4downy tip -16.2 12.9 downy tip -15.1 12.5
downy base -15.1 14.6 downy base -14.8 15.0

66Table B-4. Stable isotopic values of feathers from young Virginia colony Laughing Gulls
Feather IDδ13Ctip
δ15Ntip
δ34Stip
δ13Cbase
δ15N base
δ34S base
δ13C mean
δ15N mean
δ34S mean
AA -17.8 11.2 -15.7 13.2 -16.7 12.2BB -16.3 14.4 -15.5 13.9 -15.9 14.1CC -16.9 11.9 -16.2 13.2 -16.6 12.5DD -16.1 14.7 -15.5 14.4 -15.8 14.5EE -16.2 14.7 -16.3 12.9 -16.2 13.8FF -15.2 16.2 -15.3 15.9 -15.3 16.01 -15.8 12.5 -14.9 13.6 -15.3 13.12 -16.9 11.7 7.4 -15.4 13.9 9.2 -16.1 12.8 8.33 -17.7 14.3 9.4 -16.2 17.1 12.1 -17.0 15.7 10.8A -15.2 13.0 7.5 -15.1 14.7 9.8 -15.1 13.9 8.7B -16.8 14.2 7.9 -16.3 13.1 8.2 -16.5 13.7 8.1C -17.3 14.7 11.0 -17.3 16.0 11.5 -17.3 15.3 11.3D -16.4 13.8 9.4 -16.5 13.2 9.2 -16.4 13.5 9.3E -17.3 15.1 10.4 -14.4 14.8 8.6 -15.9 14.9 9.5F -16.9 13.4 10.1 -15.8 13.8 10.3 -16.4 13.6 10.2G -14.1 13.6 9.6 -14.5 15.5 10.9 -14.3 14.5 10.2H -17.2 13.0 6.6 -15.9 15.9 7.8 -16.6 14.4 7.2I -15.6 13.6 9.3 -15.7 15.3 10.6 -15.7 14.5 10.0J -14.6 12.1 8.2 -14.2 13.2 8.3 -14.4 12.7 8.21 -17.6 13.0 8.2 -16.4 13.5 8.4 -17.0 13.2 8.32 -15.6 16.1 11.9 -15.4 14.7 10.9 -15.5 15.4 11.43 -16.2 15.9 11.5 -16.4 16.4 11.8 -16.3 16.2 11.64 -16.3 12.0 8.6 -16.0 13.6 9.1 -16.1 12.8 8.95 -15.7 10.8 7.30 -15.6 11.8 7.3 -15.6 11.3 7.326 -17.2 14.0 10.6 -16.3 13.7 9.9 -16.8 13.9 10.37 -16.8 12.5 10.5 -16.3 13.9 10.7 -16.5 13.2 10.68 -16.7 12.9 10.7 -15.5 14.3 11.0 -16.1 13.6 10.89 -14.2 14.3 10.1 -14.1 14.8 11.1 -14.1 14.5 10.6
10 -17.6 13.6 11.1 -16.8 15.0 12.5 -17.2 14.3 11.8

67Table B-4. Stable isotopic values of feathers from young Virginia colony Laughing Gulls,
continued.
Feather IDδ13Ctip
δ15Ntip
δ34Stip
δ13Cbase
δ15Nbase
δ34Sbase
δ13Cmean
δ15Nmean
δ34Smean
1A -16.2 12.5 -15.3 14.5 -15.7 13.51B -16.5 14.9 -16.2 15.1 -16.3 15.01C -17.0 16.1 -16.1 16.7 -16.6 16.41D -16.8 14.2 -15.8 15.1 -16.3 14.61E -17.8 15.0 -16.4 15.1 -17.1 15.0
RG-7 -16.3 13.5 9.8 -16.8 12.7 8.6 -16.5 13.1 9.182 (12 cm) -18.9 11.8 8.1 -17.7 14.3 10.1 -18.3 13.0 9.08
GO -15.6 11.2 8.7 -16.0 12.8 8.1 -15.8 12.0 8.413 -17.7 14.2 9.4 -17.1 16.9 10.9 -17.4 15.5 10.27 -16.5 13.4 9.7 -15.7 14.1 9.9 -16.1 13.8 9.77
GR8 (12 cm) -17.7 15.2 8.5 -16.0 13.2 9.4 -16.8 14.2 8.958 -17.3 14.3 9.1 -17.7 16.1 12.6 -17.5 15.2 10.9
XG -18.4 12.2 6.8 -16.3 12.0 6.7 -17.4 12.1 6.739 (12 cm) -16.3 12.5 9.7 -16.0 12.1 6.2 -16.2 12.3 7.971 (11 cm) -15.7 12.6 8.6 -15.0 14.1 12.0 -15.3 13.4 10.3
GB (11 cm) -15.6 11.8 13.6 -16.0 13.2 8.6 -15.8 12.5 11.111 (11 cm) -16.3 12.8 10.4 -15.6 13.0 11.7 -15.9 12.9 11.0
4 (9 cm) -17.5 16.3 9.1 -17.6 16.3 11.4 -17.6 16.3 10.35 -16.1 13.6 13.2 -15.2 13.8 10.8 -15.6 13.7 12.06 -16.8 13.8 8.4 -16.3 14.8 NA -16.5 14.3 NA
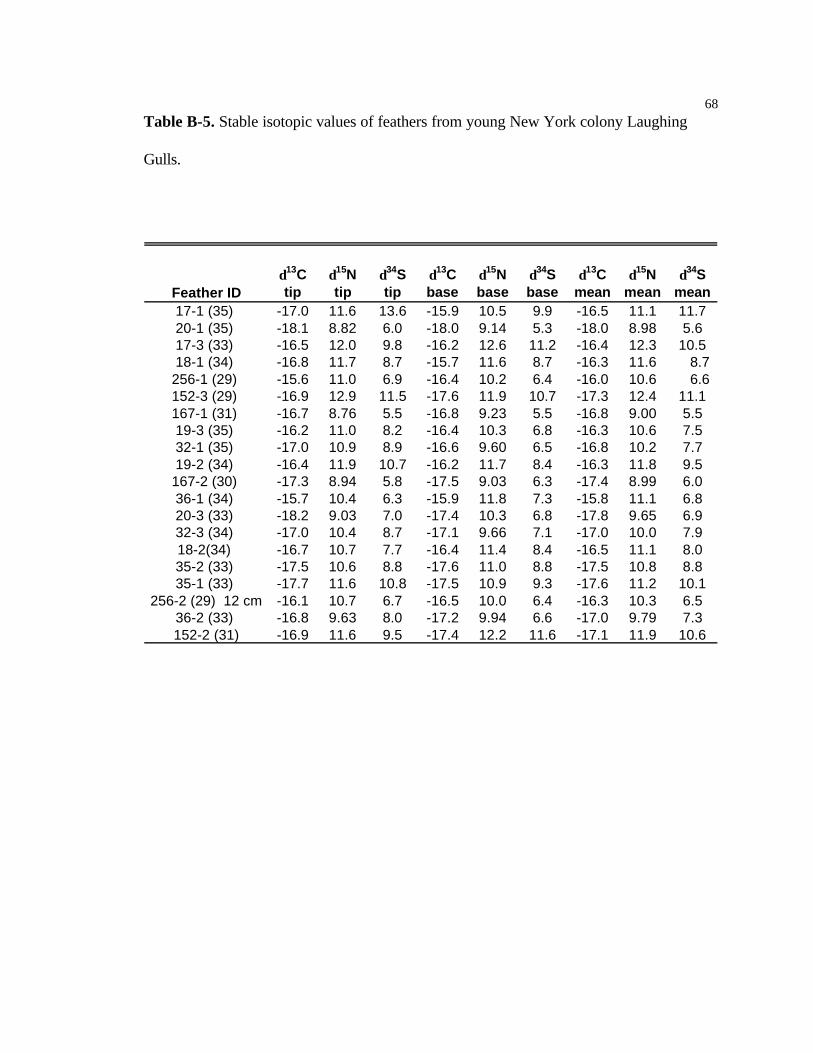
68Table B-5. Stable isotopic values of feathers from young New York colony Laughing
Gulls.
Feather IDδ13C tip
δ15N tip
δ34S tip
δ13C base
δ15N base
δ34S base
δ13C mean
δ15N mean
δ34S mean
17-1 (35) -17.0 11.6 13.6 -15.9 10.5 9.9 -16.5 11.1 11.720-1 (35) -18.1 8.82 6.0 -18.0 9.14 5.3 -18.0 8.98 5.617-3 (33) -16.5 12.0 9.8 -16.2 12.6 11.2 -16.4 12.3 10.518-1 (34) -16.8 11.7 8.7 -15.7 11.6 8.7 -16.3 11.6 8.7 256-1 (29) -15.6 11.0 6.9 -16.4 10.2 6.4 -16.0 10.6 6.6 152-3 (29) -16.9 12.9 11.5 -17.6 11.9 10.7 -17.3 12.4 11.1167-1 (31) -16.7 8.76 5.5 -16.8 9.23 5.5 -16.8 9.00 5.519-3 (35) -16.2 11.0 8.2 -16.4 10.3 6.8 -16.3 10.6 7.532-1 (35) -17.0 10.9 8.9 -16.6 9.60 6.5 -16.8 10.2 7.719-2 (34) -16.4 11.9 10.7 -16.2 11.7 8.4 -16.3 11.8 9.5167-2 (30) -17.3 8.94 5.8 -17.5 9.03 6.3 -17.4 8.99 6.036-1 (34) -15.7 10.4 6.3 -15.9 11.8 7.3 -15.8 11.1 6.820-3 (33) -18.2 9.03 7.0 -17.4 10.3 6.8 -17.8 9.65 6.932-3 (34) -17.0 10.4 8.7 -17.1 9.66 7.1 -17.0 10.0 7.918-2(34) -16.7 10.7 7.7 -16.4 11.4 8.4 -16.5 11.1 8.035-2 (33) -17.5 10.6 8.8 -17.6 11.0 8.8 -17.5 10.8 8.835-1 (33) -17.7 11.6 10.8 -17.5 10.9 9.3 -17.6 11.2 10.1
256-2 (29) 12 cm -16.1 10.7 6.7 -16.5 10.0 6.4 -16.3 10.3 6.536-2 (33) -16.8 9.63 8.0 -17.2 9.94 6.6 -17.0 9.79 7.3152-2 (31) -16.9 11.6 9.5 -17.4 12.2 11.6 -17.1 11.9 10.6