SSF Fermentation of Rape Straw and the Effects of …cdn.intechopen.com/pdfs-wm/27357.pdfSSF...
15
10 SSF Fermentation of Rape Straw and the Effects of Inhibitory Stress on Yeast Anders Thygesen 1 , Lasse Vahlgren 1 , Jens Heller Frederiksen 1 , William Linnane 2 and Mette H. Thomsen 3 1 Biosystems Division, Risø National Laboratory for Sustainable Energy, Technical University of Denmark 2 Roskilde University 3 Chemical Engineering Program, Madsar Institute 1,2 Denmark 3 United Arab Emirates 1. Introduction In 2003 R. E. Smalley (Smalley 2003) made a list of the top 10 problems mankind was going to face in the next 50 years. 1. Energy 2. Water 3. Food 4. Environment 5. Poverty 6. Terrorism and War 7. Disease 8. Education 9. Democracy 10. Population With the declining amount of fossil fuels, and the increasing energy demand, it is not possible to satisfy our large energy consumption without alternative energy sources, especially sustainable ones that also take care of problem number 4, (Environment). One of the possible ways to produce a liquid sustainable energy source is to replace our large gasoline demand with fermented biomass (bioethanol). To ensure that the food availability does not decrease (problem 3), the biomass for bioethanol fermentation is only gathered from waste materials of the food production, such as the straw of cereals. The fermentation on waste products is commonly referred to as 2 nd generation bioethanol. Biomass of interest for cellulosic produced ethanol includes wheat straw, rape straw and macro algae. In 2009 the production of oilseed rape in EU was 21×10 6 ton together with an even larger amount of rape straw (Eurostat 2010). The most commonly used rape in Europe is a winter rape with a low erucic acid and glucosinolate content (Wittkop et. al. 2009). The rape straw is composed of 32% cellulose and 22% hemicelluloses. In this chapter the focus will be on the fermentation of sugars derived from cellulose. www.intechopen.com
Transcript of SSF Fermentation of Rape Straw and the Effects of …cdn.intechopen.com/pdfs-wm/27357.pdfSSF...

10
SSF Fermentation of Rape Straw and the Effects of Inhibitory Stress on Yeast
Anders Thygesen1, Lasse Vahlgren1, Jens Heller Frederiksen1, William Linnane2 and Mette H. Thomsen3
1Biosystems Division, Risø National Laboratory for Sustainable Energy, Technical University of Denmark
2Roskilde University 3Chemical Engineering Program, Madsar Institute
1,2Denmark 3United Arab Emirates
1. Introduction
In 2003 R. E. Smalley (Smalley 2003) made a list of the top 10 problems mankind was going
to face in the next 50 years.
1. Energy
2. Water
3. Food
4. Environment
5. Poverty
6. Terrorism and War
7. Disease
8. Education
9. Democracy
10. Population
With the declining amount of fossil fuels, and the increasing energy demand, it is not possible to satisfy our large energy consumption without alternative energy sources, especially sustainable ones that also take care of problem number 4, (Environment). One of the possible ways to produce a liquid sustainable energy source is to replace our large gasoline demand with fermented biomass (bioethanol). To ensure that the food availability does not decrease (problem 3), the biomass for bioethanol fermentation is only gathered from waste materials of the food production, such as the straw of cereals. The fermentation on waste products is commonly referred to as 2nd generation bioethanol. Biomass of interest for cellulosic produced ethanol includes wheat straw, rape straw and macro algae. In 2009 the production of oilseed rape in EU was 21×106 ton together with an even larger amount of rape straw (Eurostat 2010). The most commonly used rape in Europe is a winter rape with a low erucic acid and glucosinolate content (Wittkop et. al. 2009). The rape straw is composed of 32% cellulose and 22% hemicelluloses. In this chapter the focus will be on the fermentation of sugars derived from cellulose.
www.intechopen.com

Bioethanol 210
The enzymatic hydrolysis can be described in three steps: Endoglucanase separates chains of cellulose by breaking down the bonds in amorphous regions of the crystalline cellulose, thereby creating more free ends in the cellulose. Exoglucanase breaks the cellulose down from the non-reducing end into cellubiose (the disaccharide derived from cellobiose) (Teeri and Koivula 1995). This explains the importance of endoglucanase as it creates more “attack points” for exoglucanase. β-glycosidase breaks down cellubiose into glucose. Cellulase enzymes are commonly produced by the fungus Trichoderma reesei (Busto et al. 1996). This process has two functions, first it produces the glucose needed for the fermentation, and second it turns the non-soluble cellulose into soluble sugars, which provides the liquid medium required for fermentation. The fiber structure consists of cellulose microfibrils, bound to each other with hemicellulose and lignin. A model of a plant fibre is shown in Fig. 1.
Fig. 1. Structure of cellulosic fibers in e.g. rape straw (adapted from Bjerre & Schmidt 1997)
The hemicellulose content consists of branched and acetylated carbohydrates. These molecules consist of 90% xylan and 10% arabinan in wheat straw (Puls and Schuseil 1993). The lignin content of the straw consists of polymerized molecules with a phenolic structure. The ethanol production process was conducted by simultaneous saccharification of cellulose with cellulase enzymes, and fermentation of the produced glucose with Turbo yeast (Saccharomyces cerevisiae, Brewer’s yeast) (SSF) (Thomsen et al. 2009). The production efficiency of the fermentation is strongly dependant on the wellbeing of the yeast. To visualize the health of the yeast, microscopic tests using blue staining were conducted. The bioethanol is produced from wet oxidized rape straw and the effect of the important fermentation inhibitor furfuryl alcohol is tested.
2. Materials and methods
2.1 Furfuryl alcohol effect on glucose fermentation and microscopy
To assess the number of inactive yeast cells “blue staining” is usually done. Methylene blue is the most commonly used color agent. It is a redox indicator that turns colorless in the presence of the active enzymes produced by the yeast Saccharomyces cerevisiae. For verification of the results this compound is compared with erioglaucine (E133) (Brilliant blue No. 1).
www.intechopen.com

SSF Fermentation of Rape Straw and the Effects of Inhibitory Stress on Yeast 211
In order to verify that erioglaucine is equal in quality to methylene blue, a dose response curve for the toxic compound fufuryl alcohol is produced, and the mortality is then examined with the two color agents. 6 fermentations of 100 ml are started with different levels of furfuryl alcohol (0.0, 1.5, 3.5, 6.0, 9.0 and 15.0) (mL/L) and 2 g/L Turbo yeast (from AlcoTec). All the fermentations are completed in blue cap flasks in Millipore water and with
100 g/L glucose monohydrate. The yeast is left to ferment at 25, 32, 40 and 45C, using 100 rpm of stirring for 24 hours. Weight loss is measured during working hours to monitor the fermentation. After 24 hours samples are taken for HPLC analysis as described by Thomsen et al. (2009). A methylene blue and an erioglaucine solution are produced each of 0.29 g/L. The 6 samples are divided into 12 portions to perform double repetition. Six portions were mixed with methylene blue in a 9:1 ratio and six portions with erioglaucine in a 1:1 ratio. The samples are examined with microscopy at 1000x magnification just after the color agent was added.
2.2 Wet oxidation of rape straw
Rape straw was produced after harvest during cultivation of Brassica napus Linnaeus commonly known as rape in Denmark in 2007. The straw was milled to a particle size of 2 mm using a knife mill. The milled straw was then soaked in 80°C hot water for 20 min before wet oxidation in a 2 L loop autoclave (Bjerre et al., 1996). The autoclave setup includes 1 L water, 60 g dry milled rape straw with the canister pressurized to 12 bar oxygen during the reaction. The mixing of oxygen and liquid is obtained by a pumping wheel. The wet oxidation was performed at 205°C for 3 min (Arvaniti et. al 2011). Following the wet oxidation, pressure is released and the prehydrolysate is cooled to room temperature. The filter cake and filtrate are separated and stored at -18° C (Thygesen et. al. 2003). During wet oxidation, oxygen is introduced in the pre-treatment phase at high pressure and temperature. This causes 50 % (w/w) of the lignin to oxidize into CO2, H2O, carboxylic acids and phenolic compounds. It is important that the lignin fraction is low since lignin can denaturize the enzymes involved in the subsequent hydrolysis of cellulose. The majority of the hemicellulose (80 %) is dissolved while 10 % is oxidized to CO2, H2O and carboxylic acids. During this process, carboxylic acids, phenolic compounds, and furans are produced, which act as inhibitors in the fermentation process. However, the concentrations are too low to fully hinder microbial growth as wet oxidation also degrades the toxic intermediate reaction products (Thomsen et. al. 2009).
2.3 SSF fermentation and enzymatic hydrolysis
The dry matter content (DM) of the solid straw fraction after wet oxidation (filtercake) is measured by drying at 105°C overnight. The procedure for SSF is as follows: 250 mL flasks are loaded with 100 ml substrate with either 17 g DM or with 8 g DM. The substrate is adjusted to pH 4.8 with 6 mol/L of NaOH. After pH adjustment, 15 FPU/g DM of Celluclast (Novozymes mixture of endo- and exo-glucanase) is added together with 0.20 ml of Novozym 188 (β-
glycosidase) per ml Celluclast using sterile conditions. The flasks are shaken at 50 C with 120 rpm for 24 hours during the pre-hydrolysis. After the pre-hydrolysis, 10FPU/g DM of Celluclast and 0.20 ml of Novozym 188 (β-glycosidase) per ml Celluclast are added together with 1-4 g/L of Turbo yeast and 0.8 g/L of urea and the pH value re-adjusted to 4.8 with addition of NaOH. The flasks are sealed with glycerol yeast locks and incubated at 37°C with shaking at 120 rpm. During SSF, the flasks are weighed to measure ethanol production with respect to time, and after the SSF termination a sample of the supernatant is analyzed by
www.intechopen.com
Bioethanol 212
HPLC (High Performance Liquid Chromatography, Shimadzu) with a Bio-Rad Aminex HPX87H column and 0.6 mL/min flow of the eluent (4 mmol/L of H2SO4) at 63°C for ethanol and monosaccharides (Thomsen et al., 2009).
2.4 Analysis of the plant fibers for carbohydrates and lignin
The composition of the raw and the pre-treated straw is measured by strong acid hydrolysis
of the carbohydrates. Dried and milled samples (160 mg) are treated with 72 % (w/w)
H2SO4 (1.5 mL) at 30°C for 1 hour. The solutions were diluted with 42 mL of water and
autoclaved at 121°C for 1 hour. After hydrolysate filtration, the Klason lignin content is
determined as the weight of the filter cake subtracted the ash content. The filtrate is
analysed for sugars on HPLC. The recovery of D-glucose, D-xylose and L-arabinose is
determined by standard addition of sugars to samples before autoclavation. The sugars are
determined after separation on a HPLC-system (Shimadzu) with a Rezex ROA column
(Phenomenex) at 63°C using 4 mmol/L H2SO4 as eluent and a flow rate of 0.6 mL/min.
Detection is done by a refractive index detector (Shimadzu Corp., Kyoto, Japan). Conversion
factors for dehydration on polymerization are 162/180 for glucose and 132/150 for xylose
and arabinose (Kaar et al., 1991; Thygesen et al., 2005).
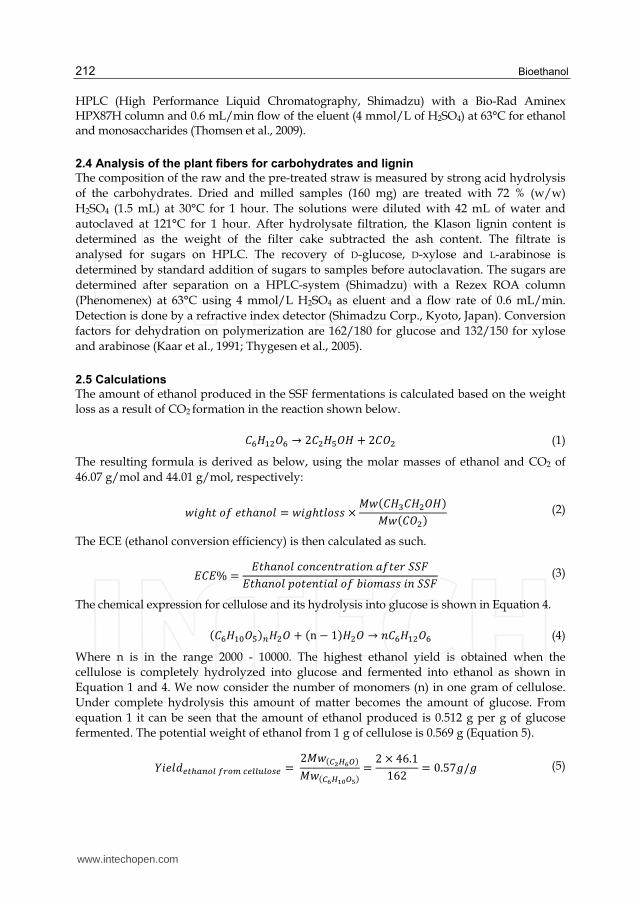
2.5 Calculations
The amount of ethanol produced in the SSF fermentations is calculated based on the weight
loss as a result of CO2 formation in the reaction shown below.
系滞茎怠態頚滞 → に系態茎泰頚茎 + に系頚態 (1)
The resulting formula is derived as below, using the molar masses of ethanol and CO2 of
46.07 g/mol and 44.01 g/mol, respectively:
拳件訣ℎ建 剣血 結建ℎ欠券剣健 = 拳件訣ℎ建健剣嫌嫌 × 警拳岫系茎戴系茎態頚茎岻警拳岫系頚態岻 (2)
The ECE (ethanol conversion efficiency) is then calculated as such.
継系継% = 継建ℎ欠券剣健 潔剣券潔結券建堅欠建件剣券 欠血建結堅 鯨鯨繋継建ℎ欠券剣健 喧剣建結券建件欠健 剣血 決件剣兼欠嫌嫌 件券 鯨鯨繋 (3)
The chemical expression for cellulose and its hydrolysis into glucose is shown in Equation 4.
岫系滞茎怠待頚泰岻津茎態頚 + 岫n − な岻茎態頚 → 券系滞茎怠態頚滞 (4)
Where n is in the range 2000 - 10000. The highest ethanol yield is obtained when the
cellulose is completely hydrolyzed into glucose and fermented into ethanol as shown in
Equation 1 and 4. We now consider the number of monomers (n) in one gram of cellulose.
Under complete hydrolysis this amount of matter becomes the amount of glucose. From
equation 1 it can be seen that the amount of ethanol produced is 0.512 g per g of glucose
fermented. The potential weight of ethanol from 1 g of cellulose is 0.569 g (Equation 5).
桁件結健穴勅痛朕銚津墜鎮 捗追墜陳 頂勅鎮鎮通鎮墜鎚勅 = に警拳岫寵鉄張展潮岻警拳岫寵展張迭轍潮天岻 = に × ねは.ななはに = ど.のば訣/訣 (5)
www.intechopen.com

SSF Fermentation of Rape Straw and the Effects of Inhibitory Stress on Yeast 213
桁件結健穴勅痛朕銚津墜鎮捗追墜陳長沈墜陳銚鎚鎚 = 桁件結健穴勅痛朕銚津墜鎮捗追墜陳頂勅鎮鎮通鎮墜鎚勅 × 潔剣券潔頂勅鎮鎮通鎮墜鎚勅 × 潔剣券潔帖暢 (6)
3. Results and discussion
3.1 Effect of temperature on ethanol fermentation from glucose
Temperature optimizations for glucose fermentation are shown in Fig. 2. The highest rate was obtained at 32°C this fermentation is not limited by hydrolysis of cellulose. A challenge is that the optimal temperature for the yeast is 20°C lower than for the cellulase enzymes.
Fig. 2. The effect of temperature on Turbo yeast in ethanol fermentation with glucose.
By further fermentation of the rape straw in which hydrolysis of cellulose is needed it is therefore an advantage to use a higher temperature at which the yeast survives while the enzymes work at a higher reaction rate (Arvaniti et. al 2011).
3.2 Wet oxidation of rape straw
The rape straw used in the fermentation experiments consist of 32 % cellulose, 16 % hemicellulose, 18 % lignin, 5 % ash and 20 % non cell wall material (NCWM). During the wet oxidation process, large contents of hemicellulose and NCWM are extracted resulting in a liquid phase of glucose (1 g/L), xylose (7 g/L) and arabinose (0.5 g/L). The remaining solid phase became thereby enriched in cellulose and contained 54 % cellulose, 14 % hemicellulose, 23 % lignin, 3 % ash and 13 % NCWM. This solid material was subsequently tested by SSF fermentation.
3.3 Effect of yeast concentration on ethanol fermentation from rape straw
Fig. 3. shows the results of SSF on wet oxidized rape straw with 80 g/L DM content using initial yeast concentrations from 2.0 to 8.2 g/L. As expected, the rate of fermentation dependants on the concentration of yeast, as there is plenty of sugar monomers present in the medium, which are produced in the pre-hydrolysis step of the SSF. At some point the excess sugar from the prehydrolysis is depleted and the rate of fermentation becomes dependent on the amount of sugar released by hydrolysis
www.intechopen.com

Bioethanol 214
Rape straw Solid phase Liquid phase
Compound g/100 g DM Compound g/100 g DM Compound g/L
Cellulose 32 Cellulose 54 Glucose 1.1
Hemicellulose 16 Xylan 13 Xylose 6.7
Arabinan 1 Arabinose 0.5
Lignin 18 Lignin 23 Acetic acid 0.9
Ash 5 Ash 3 Formic acid 0.9
NCWM 20 NCWM 13 Furfural 0.1
Phenolics 1.3
pH 3.9
Table 1. Components of rape straw before and after the wet oxidation pretreatment resulting in a solid and a liquid phase. *NCWM is none cell wall material
Fig. 3. The amount of ethanol produced on wet oxidized rape straw using 80 g/L DM and yeast concentrations of (2.0 to 8.2) g/L.
(rate of hydrolysis). Since the enzyme loading was the same in all the samples the fermentations produce ethanol at roughly the same rate once the excess sugar has been used. In experiments with high dry matter content such as 170 g/L the difference between the
yeast dependant and the enzyme dependant phase is more pronounced than with low DM
content (Fig. 4). The viscosity of the sample changes drastically during SSF since hydrolysis
changes insoluble cellulose to soluble glucose. This means that the rate of both the yeasts
and the enzymes production increases over time, as the production rate of both the enzymes
and the yeast is related to the viscosity of the medium. An explanation can be that a high
concentration of dry matter gives higher inhibitor concentrations and a larger yeast
concentration can make faster detoxification.
www.intechopen.com

SSF Fermentation of Rape Straw and the Effects of Inhibitory Stress on Yeast 215
Fig. 4. The amount of ethanol produced during SSF of wet oxidized rape straw using 170 g/L DM and initial yeast concentrations of (2.0 to 8.2) g/L.
Yeast CO2 Ethanol Ethanol potential ECE
g/L g/L g/L g/L %
170 g/L straw DM 34.9 51.9 67.2
2 32.3 33.8 51.9 65.2
4 30.3 31.7 51.9 61.1
6 33.7 35.3 51.9 68.0
8.2 33.9 35.5 51.9 68.4
80 g/L straw DM 18.4 24.5 75.2
2 16.8 17.6 24.5 71.8
4 17.8 18.6 24.5 76.1
6 17.8 18.6 24.5 76.1
8.2 16.8 17.6 24.5 71.8
Table 2. Ethanol production and ECE (ethanol conversion efficiency) for different DM contents
As shown in table 2, the high DM content result in low ECE% of 67% compared to 75% when using low DM content. This is an essential problem in ethanol production since industrial distillation works best with more than 50 g/L ethanol, which could potentially be achieved with 75% ECE and 220 g/L of rape straw. However, in reality this is a challenge since increased DM contents result in reduced ECE% due to increasing viscosity and difficulties in mixing and higher concentrations of inhibitors. No direct correspondence between the final ECE% and the initial amount of yeast is found in this study. This indicates that the drop in ECE% at high DM can be due to decreasing enzyme performance in high DM pre-hyrolysates of rape straw. The rate of fermentation is calculated for the time period with the highest fermentation rate and the results are shown in Fig. 5. For 170 g/L DM content that is between 10 and 52 hours, and for 80 g/L DM content it is between 2 and 4 hours. This time period covers the phase
www.intechopen.com
Bioethanol 216
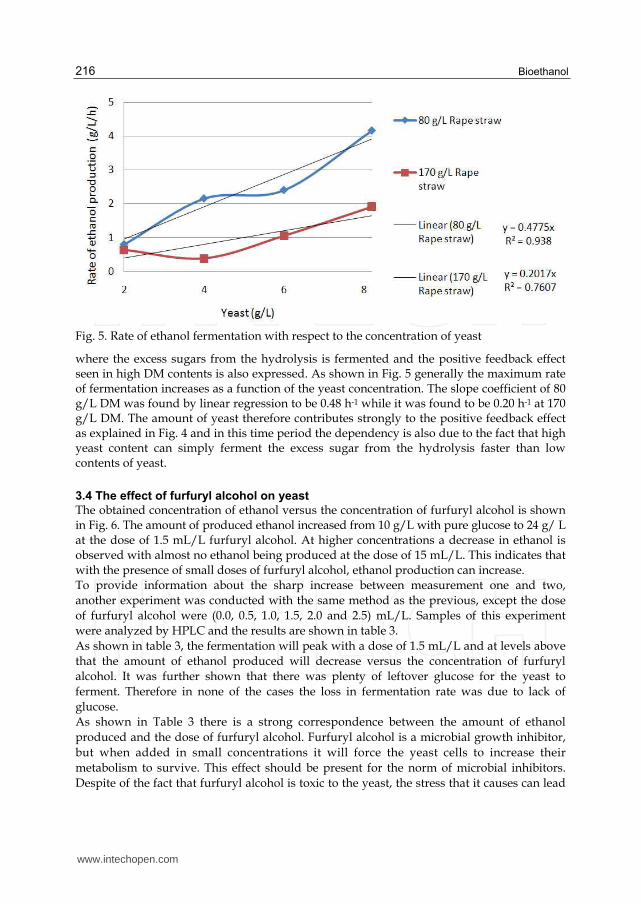
Fig. 5. Rate of ethanol fermentation with respect to the concentration of yeast
where the excess sugars from the hydrolysis is fermented and the positive feedback effect seen in high DM contents is also expressed. As shown in Fig. 5 generally the maximum rate of fermentation increases as a function of the yeast concentration. The slope coefficient of 80 g/L DM was found by linear regression to be 0.48 h-1 while it was found to be 0.20 h-1 at 170 g/L DM. The amount of yeast therefore contributes strongly to the positive feedback effect as explained in Fig. 4 and in this time period the dependency is also due to the fact that high yeast content can simply ferment the excess sugar from the hydrolysis faster than low contents of yeast.
3.4 The effect of furfuryl alcohol on yeast
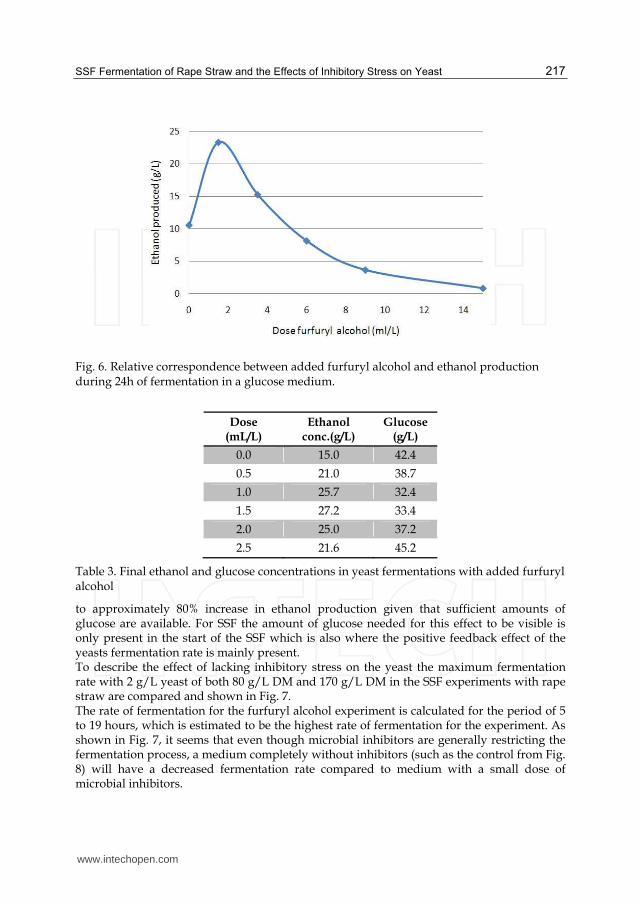
The obtained concentration of ethanol versus the concentration of furfuryl alcohol is shown in Fig. 6. The amount of produced ethanol increased from 10 g/L with pure glucose to 24 g/ L at the dose of 1.5 mL/L furfuryl alcohol. At higher concentrations a decrease in ethanol is observed with almost no ethanol being produced at the dose of 15 mL/L. This indicates that with the presence of small doses of furfuryl alcohol, ethanol production can increase. To provide information about the sharp increase between measurement one and two,
another experiment was conducted with the same method as the previous, except the dose
of furfuryl alcohol were (0.0, 0.5, 1.0, 1.5, 2.0 and 2.5) mL/L. Samples of this experiment
were analyzed by HPLC and the results are shown in table 3.
As shown in table 3, the fermentation will peak with a dose of 1.5 mL/L and at levels above
that the amount of ethanol produced will decrease versus the concentration of furfuryl
alcohol. It was further shown that there was plenty of leftover glucose for the yeast to
ferment. Therefore in none of the cases the loss in fermentation rate was due to lack of
glucose.
As shown in Table 3 there is a strong correspondence between the amount of ethanol
produced and the dose of furfuryl alcohol. Furfuryl alcohol is a microbial growth inhibitor,
but when added in small concentrations it will force the yeast cells to increase their
metabolism to survive. This effect should be present for the norm of microbial inhibitors.
Despite of the fact that furfuryl alcohol is toxic to the yeast, the stress that it causes can lead
www.intechopen.com
SSF Fermentation of Rape Straw and the Effects of Inhibitory Stress on Yeast 217
Fig. 6. Relative correspondence between added furfuryl alcohol and ethanol production during 24h of fermentation in a glucose medium.
Dose (mL/L)
Ethanol conc.(g/L)
Glucose (g/L)
0.0 15.0 42.4
0.5 21.0 38.7
1.0 25.7 32.4
1.5 27.2 33.4
2.0 25.0 37.2
2.5 21.6 45.2
Table 3. Final ethanol and glucose concentrations in yeast fermentations with added furfuryl alcohol
to approximately 80% increase in ethanol production given that sufficient amounts of glucose are available. For SSF the amount of glucose needed for this effect to be visible is only present in the start of the SSF which is also where the positive feedback effect of the yeasts fermentation rate is mainly present. To describe the effect of lacking inhibitory stress on the yeast the maximum fermentation rate with 2 g/L yeast of both 80 g/L DM and 170 g/L DM in the SSF experiments with rape straw are compared and shown in Fig. 7. The rate of fermentation for the furfuryl alcohol experiment is calculated for the period of 5 to 19 hours, which is estimated to be the highest rate of fermentation for the experiment. As shown in Fig. 7, it seems that even though microbial inhibitors are generally restricting the fermentation process, a medium completely without inhibitors (such as the control from Fig. 8) will have a decreased fermentation rate compared to medium with a small dose of microbial inhibitors.
www.intechopen.com

Bioethanol 218
Fig. 7. Fermentation rate with respect to dose of furfuryl alcohol from the glucose experiment from Fig 6. For comparison the fermentation rate with rape straw of both 80 g/L DM and 170 g/L DM content from Fig. 5 is investigated for similar yeast concentrations (2g/L).
3.5 Vitality of the yeast cells
Fig. 8 shows the yeast cells after a glucose fermentation. A large part of the yeast cells have become inactive, even though there is still enough sugar in the substrate to sustain living cells.
Fig. 8. Methylene blue stained yeast cells after glucose fermentation.
www.intechopen.com

SSF Fermentation of Rape Straw and the Effects of Inhibitory Stress on Yeast 219
Fig. 9. Methylene blue stained yeast cells after heating to 100 ºC.
During the experiments with dose response on furfuryl alcohol in glucose fermentation, a relation was found between cell death and the concentration of furfuryl alcohol (Fig. 8). Yet at this writing, there still exist some inconsistencies between erioglaucine and methylene blue. Overall the results produced by methylene blue appeared slightly more consistent and matching with the data for ethanol production.
3.6 Comparison of feed stocks In this study the main focus was on production of bioethanol from rape straw, but there are a lot of other possible feedstocks suitable for bioethanol production in general, all cellulosic material can be converted by physical/chemical pretreatment followed by enzymatic hydrolysis into glucose. It is also possible to produce bioethanol from sugar and starch from crops such as corn, wheat, sugarcane, and sugar beet, but since sugar is a food source, using it could decrease food availability for future generations. Using food sources or available agricultural land for pure energy production is generally classified as a 1st generation technology, and is not normally regarded as a sustainable energy source. To compare the different feedstocks Table 4 is produced. However, there are numerous ways to co-produce food and feedstocks for bioenergy when utilizing the lignocellulosic residues from agricultural production as shown in table 4. As table 4 shows, bast fibers have a very high cellulose content (60-63%) and a low lignin content (3-4 %) which should make them ideal for producing bioethanol, but bast fibers as a feedstock would fall under the category of 1st generation bioethanol, because the production of bast fibers requires land that could otherwise be used for food production. Rape straw has a low cellulose content compared to other straw fibers (32%) but in return the hemicellulose (14%) and lignin (18%) content is also low compared to wheat straw (20%) and corn stover (19 – 21%). Low lignin content is good for the enzymatic hydrolysis, since lignin can denaturize cellulase enzymes (Thygesen et. al 2003). Low hemicellulose content will result in a slightly lower concentration of microbial growth inhibitors derived from oxidation of the hemicellulose. Sugarcane bagasse seems to be the ideal 2nd generation feedstock with its high cellulose content (43%) and low lignin content (11%) but sugarcanes require high temperatures and a lot of rainfall to grow and are therefore only energy efficient when grown in tropical regions, which limits the amount of ethanol produced from sugarcane bagasse worldwide. It is possible to produce bioethanol from wood fibers, like waste wood from carpentry or
www.intechopen.com

Bioethanol 220
Feedstock Cellulose Xylose Arabinose Lignin Ash Ref. % w/w % w/w % w/w % w/w % w/w
Straw fibres Corn stover (Zea
mays) 33 Hemicellulose = 21 19 7 1
Rape straw (Brassica napus)
32 14 2 18 5 2
Sugarcane Bagasse (Saccharum)
43 Hemicellulose = 31 11 6 3
Winter rye (Secale cereal)
41 22 3 16 5 2
Wheat straw (Triticum)
39 20 2 20 7 4
Wood fibres Norway spruce
(Picea abies) 49 Hemicellulose = 20 30 0 1
Marine biomass Green hairweed (Chaetomorpha
linum) 34 - 40 4 - 7 8 - 13 6 - 8 8 - 24 5
Bast fibres Flax (Linum
usitatissimum) 60 8 1 3 4 6
Hemp (Cannabis) 63 9 1 4 4 1
Table 4. The composition of cellulose containing and plant -based raw materials including straw, wood, marine biomass and bast fibers. The individual data comes from the following sources: 1. Thygesen et. al. 2005, 2. Petersson et. al. 2007, 3. Martin et. al. 2007, 4. Schultz-Jensen et. al. 2010, 5. Schultz-Jensen et. al. 2011, 6. Hänninen et. al. 2011.
willow, which can grow on land not suitable for agriculture, using pretreatment methods such as steam explosion (Söderström et. al. 2002). The high lignin content in wood fibers increases the amount of enzymes needed and the time period of the fermentation. Furthermore wood fibers have other uses and can easily be burned to produce electricity and heat in a cogeneration plant. Marine biomass has the advantage that it does not use the same space as agriculture and even though it is not a waste product from food production it is still a viable feedstock because it does not reduce food availability. Chaetomorpha linum has very low lignin content (6 – 8 %) and cellulose content similar to straw fibers (34 – 40 %). C. linum and other types of useable macroalgae are easy to grow in most of the world, and is therefore a suitable candidate for expanding the bioethanol production to more than what can be obtained from waste products (Schultz-Jensen et. al. 2011).
4. Conclusion
The amount of yeast needed for SSF of pretreated rape straw is dependent on the DM content, despite the fact that enzymes continue to be the primary rate-determining factor. The positive feedback effect from the yeast lowering the sugar concentration can have high
www.intechopen.com
SSF Fermentation of Rape Straw and the Effects of Inhibitory Stress on Yeast 221
relevance when running SSF with high DM content. After prolonged testing of Turbo yeast, the optimal temperature of the SSF is found to be 37°C. Furfuryl alcohol and possibly other growth inhibitors as well, show a positive effect on the rate of fermentation when added in small dosages, since yeast will increase its metabolism under stress. The positive effect of growth inhibitors is so strong that the fermentation rate in sugar media is lower than the fermentation rates in a medium produced from wet oxidized rape straw (filter cake), given the DM concentration does not exceed critical levels.
5. Acknowledgement
The Danish Research Council, DSF is gratefully acknowledged for supporting the research project: Biorefinery for sustainable reliable economical fuel production from energy crops (2104-06-0004). The European Union is acknowledged for supporting the EU-project: Integration of biology and engineering into an economical and energy-efficient 2G bioethanol biorefinery (Proethanol nr. 251151). Efthalia Arvaniti is acknowledged for academic advice. Tomas Fernqvist, Ingelis Larsen and Annette Eva Jensen are thanked for technical assistance and HTX Roskilde for providence of microscope cameras.
6. References
Arvaniti, E.; Thygesen, A.; Kádár, Z. & Thomsen, A.B. (2011). Assessing simultaneous saccharification and fermentation conditions for ethanol production from pre-treated rape straw. Unpublished data.
Bjerre, A.B. & Schmidt, A.S. (1997). Development of chemical and biological processes for production of bioethanol: optimization of the wet oxidation process and characterization of products. Technical university of Denmark, Risø-R-967, ISBN 87-550-2279-0, Roskilde, Denmark.
Browling, B.L. (1967). Methods of Wood Chemistry. Vol.1. Interscience Publishers, A division of John Wiley & Sons, New York, USA.
Busto, M.D.; Ortega, N. & PerezMateos, M. (1996). Location, kinetics and stability of cellulases induced in Trichoderma reesei cultures. Bioresource Technology, Vol.57, No.2, (August 1996), pp. 187-192, ISSN 09608524.
EUROSTAT, 2010. Agricultural statistics - Main results 2008-09. Eurostat. pp. 83-92. ISBN: 978-92-79-15246-7 ISSN: 1830-463X doi:10.2785/44845. Available:
http://epp.eurostat.ec.europa.eu/portal/page/portal/product_details/publication?p_product_code=KS-ED-10-001
Hänninen, T.; Thygesen, A.; Mehmood, S.; Madsen, B. & Hughes, M. (2011). Effect of mechanical damage on the susceptibility of flax and hemp fibres to chemical degradation. Unpublished data.
Kaar, W.E.; Cool, L.G.; Merriman, M.M. & Brink, D.L. (1991). The complete analysis of wood polysaccharides using HPLC. Journal of Wood Chemistry and Technology, Vol.11, No.4, pp. 447-463, ISSN 02773813.
Martin, C.; Klinke, H.B. & Thomsen, A.B. (2007). Wet oxidation as a pretreatment method for enhancing the enzymatic convertibility of sugarcane bagasse. Enzyme and Microbial Technology, Vol.40, No.3, (February 2007), pp. 426-432, ISSN 01410229.
Fai, P.B. & Grant, A. (2009). A comparative study of Saccharomyces cerevisae sensitivity against eight yest species sensitivities to a range of toxicants. Chemosphere, Vol.75, No.3, (April 2009), pp. 289-296, ISSN 00456535.
www.intechopen.com

Bioethanol 222
Petersen, M.Ø.; Larsen, J. & Thomsen, M.H. (2009). Optimization of hydrothermal pretreatment of wheat straw for production of bioethanol at low water consumption without addition of chemicals. Biomass and Bioenergy, Vol.33, No.5, (May 2009), pp. 834-840, ISSN 09619534.
Petersson, A.; Thomsen, M.H.; Hauggaard-Nielsen, H. & Thomsen, A.B. (2007). Potential bioethanol and biogas production using lignocellulosic biomass from winter rye, oilseed rape and faba bean. Biomass and Bioenergy, Vol.31, No.11-12, (November-December 2007), pp. 812-819, ISSN 09619534.
Puls, J. & Schuseil, J. (1993). Chemistry of hemicelluloses: Relationship between hemicellulose structure and enzymes required for hydrolysis, In: Hemicellulose and Hemicellulases, M.P. Coughlan & G.P. Hazlewood, (ed.), pp. 1-27, Portland Press Research Monograph, ISBN 1855780364, Great Britain.
Schultz-Jensen, N.; Leipold, F.; Bindslev, H. & Thomsen, A.B. (2011). Plasma assisted pretreatment of wheat straw. Applied Biochemistry and Biotechnology, Vol.163, No.4, (February 2011), pp. 558-572, ISSN 02732289.
Schultz-Jensen, N.; Thygesen, A.; Thomsen, S.T.; Leipold, F.; Roslander, C. & Thomsen, A.B. (2011). Investigation of different pretreatment technologies for the macroalgae Chaetomorpha Linum for the production of bioethanol. Unpublished data.
Smalley, R.E., 2003-last update, Top Ten Problems of Humanity for Next 50 Years. Energy & NanoTechnology Conference, Rice University, May 3, 2003. Available at http://www.scribd.com/doc/2962283/Richard-Smalleys-energy-talk [15/8-2011, .
Söderström, J.; Pilcher, L.; Galbe, M. & Zacchi, G. (2002). Two step steam pretreatment of softwood with SO2 impregnation for ethanol production. Applied Biochemistry and Biotechnology, Vol.98-100, (Spring 2002), pp. 5-21, ISSN 02732289.
Teeri, T.,T. & Koivula, A. (1995). Cellulose degradation by native and engineered fungal cellulases. Carbohydrates in Europe, Vol.12, pp.28-33, ISSN 13850040.
Thomsen, M.H.; Thygesen, A. & Thomsen, A.B. (2009). Identification and characterization of fermentation inhibitors formed during hydrothermal treatment and following SSF of wheat straw. Applied Microbiology and Biotechnology, Vol.83, No.3, (June 2009), pp. 447–455, ISSN 01757598.
Thomsen, M.H.; Thygesen, A. & Thomsen, A.B. (2008). Hydrothermal treatment of wheat straw at pilot plant scale using a three-step reactor system aiming at high hemicellulose recovery, high cellulose digestibility and low lignin hydrolysis. Bioresource Technology, Vol.99, No.10, (July 2008), pp. 4221-4228, ISSN 09608524.
Thygesen, A.; Oddershede, J.; Lilholt, H.; Thomsen, A.B. & Ståhl, K. (2005). On the determination of crystallinity and cellulose content in plant fibres. Cellulose, Vol. 12, No.6, pp. 563-576, ISSN 09690239.
Thygesen, A.; Thomsen, A.B.; Schmidt, A.S.; Jørgensen, H.; Ahring, B.K. & Olsson, L. (2003). Production of cellulose and hemicellulose-degrading enzymes by filamentous fungi cultivated on wet-oxidised wheat straw. Enzyme and Microbial Technology, Vol.32, No.5, (April 2003), pp. 606-615, ISSN 01410229.
Thygesen, A.; Possemiers, S.; Thomsen, A. & Verstraete, W. (2010). Intergration of microbial electrolysis (MECs) in the biorefinery for production of ethanol, H2 and phenolics. Waste and Biomass Valorization, Vol.1, No.1, pp. 9-20, ISSN 18772641.
Wittkop, B.; Snowdon, R.J. & Friedt, W. (2009). Status and perspectives of breeding for enhanced yield and quality of oilseed crops for Europe. Euphytica, Vol.170, No 1-2, pp. 131-140, ISSN 00142336.
www.intechopen.com

BioethanolEdited by Prof. Marco Aurelio Pinheiro Lima
ISBN 978-953-51-0008-9Hard cover, 290 pagesPublisher InTechPublished online 01, February, 2012Published in print edition February, 2012
InTech EuropeUniversity Campus STeP Ri Slavka Krautzeka 83/A 51000 Rijeka, Croatia Phone: +385 (51) 770 447 Fax: +385 (51) 686 166www.intechopen.com
InTech ChinaUnit 405, Office Block, Hotel Equatorial Shanghai No.65, Yan An Road (West), Shanghai, 200040, China
Phone: +86-21-62489820 Fax: +86-21-62489821
Recent studies have shown strong evidence of human activity impact on the climate of the planet. Highertemperatures and intensification of extreme weather events such as hurricanes are among the consequences.This scenario opens up several possibilities for what is now called "green" or low carbon economy. We aretalking about creating new businesses and industries geared to develop products and services with lowconsumption of natural resources and reduced greenhouse gases emission. Within this category of business,biofuels is a highlight and the central theme of this book. The first section presents some research results forfirst generation ethanol production from starch and sugar raw materials. Chapters in the second sectionpresent results on some efforts around the world to develop an efficient technology for producing second-generation ethanol from different types of lignocellulosic materials. While these production technologies arebeing developed, different uses for ethanol could also be studied. The chapter in the third section points to theuse of hydrogen in fuel cells, where this hydrogen could be produced from ethanol.
How to referenceIn order to correctly reference this scholarly work, feel free to copy and paste the following:
Anders Thygesen, Lasse Vahlgren, Jens Heller Frederiksen, William Linnane and Mette H. Thomsen (2012).SSF Fermentation of Rape Straw and the Effects of Inhibitory Stress on Yeast, Bioethanol, Prof. Marco AurelioPinheiro Lima (Ed.), ISBN: 978-953-51-0008-9, InTech, Available from:http://www.intechopen.com/books/bioethanol/ssf-fermentation-of-rape-straw-and-the-effects-of-inhibitory-stress-on-yeast