SR 520 Net Toll Revenue Report 2014 Update - wsdot.wa.gov · Net Toll Revenue Report 2014 Update...
64
SR 520 Bridge Net Toll Revenue Report 2014 Update Prepared for Washington State Department of Transportation Lead Author Parsons Brinckerhoff in association with the SR 520 General Engineering Consultant Team January 30, 2015
Transcript of SR 520 Net Toll Revenue Report 2014 Update - wsdot.wa.gov · Net Toll Revenue Report 2014 Update...

SR 520 Bridge Net Toll Revenue Report
2014 Update
Prepared for
Washington State Department of Transportation
Lead Author
Parsons Brinckerhoff
in association with the
SR 520 General Engineering Consultant Team
January 30, 2015


SR 520 Bridge Net Toll Revenue Report 2014 Update — January 30, 2015
TABLE OF CONTENTS i
TABLE OF CONTENTS
Disclaimer ....................................................................................................................... iv
Introduction ...................................................................................................................... 1
Background and Purpose .................................................................................................... 1
Project Description .............................................................................................................. 2
Key Changes in the November 2014 Net Revenue Projections .......................................... 3
Traffic and Revenue Overview ....................................................................................... 7
Toll Traffic and Gross Toll Revenue Potential ..................................................................... 7
Payment and Toll Transaction Types................................................................................... 9
Gross to Net Toll Revenue ................................................................................................. 11
Actual Net Revenue Performance for FY 2014............................................................ 12
Summary of Changes in the Net Revenue Projections .............................................. 14
Changes to Revenue Adjustments .............................................................................. 15
Toll Payment Fees and Discounts (Column 12) ................................................................. 15
Uncollectible Revenue (Columns 13 & 14) ........................................................................ 17
Miscellaneous Pledged Revenues (Column 16) ................................................................ 20
Transponder Sales Revenue (Column 17) ......................................................................... 20
Pay By Mail Rebilling Fees (Column 18) ............................................................................ 21
Recovered Toll Revenues (Column 19) ............................................................................. 22
Changes to Operating and Maintenance Costs .......................................................... 23
Credit Card / Banking Fees (Column 21) ........................................................................... 23
Toll Collection Operations and Maintenance (Column 22) ............................................... 25
Routine Facility Operations and Maintenance (Column 23) ............................................. 36
Bridge Insurance (Column 24) ........................................................................................... 38
Changes to Other Project Uses of Toll Revenues ......................................................... 41
Total Net Revenue Before R&R (Column 25) .................................................................... 41
Deferred Sales Tax on Construction (Column 26) ............................................................. 42
Periodic Facility Repair and Replacement Costs (Column 27) .......................................... 42
Toll‐Related Repair and Replacement Costs (Column 28) ................................................ 45
SR 520 Bridge Net Toll Revenue Report 2014 Update — January 30, 2015
II TABLE OF CONTENTS
Appendices
Appendix A: Annual Toll Traffic & Revenue Projections................................................................ 51
Appendix B: Toll Payment Activity Workflow ................................................................................ 55
Appendix C: List of Facility Maintenance Activities ....................................................................... 57

SR 520 Bridge Net Toll Revenue Report 2014 Update — January 30, 2015
TABLE OF CONTENTS iii
List of Exhibits
Exhibit 1: Timeline of SR 520 Traffic, Gross Revenue, and Net Revenue Forecasts ......................... 2
Exhibit 2: SR 520 Bridge Replacement and HOV Program Map ...................................................... 3
Exhibit 3: Gross to Net Revenue Comparison — September 2011 vs November 2014 — FY 2015‐56 ............................................................................................................................................ 4
Exhibit 4: Gross to Net Revenue Comparison — October 2013 vs November 2014 — FY 2015‐56 ............................................................................................................................................ 4
Exhibit 5: CDM Smith Toll Transaction Forecast .............................................................................. 8
Exhibit 6: CDM Smith Gross Toll Revenue Potential Forecast .......................................................... 8
Exhibit 7: Projected Market Shares by Payment Method (FY 2015‐56) ......................................... 10
Exhibit 8: Net Revenue Waterfall ................................................................................................... 11
Exhibit 9: Actual Revenue and October 2013 Forecast Comparison for FY 2014 ......................... 12
Exhibit 10: Actual Revenue and September 2011 Forecast Comparison for FY 2014 .................... 13
Exhibit 11: Net Revenue Component Comparison – November 2014 / October 2013 (FY 2015‐56) ......................................................................................................................................... 14
Exhibit 12: Annual Shares of Total Transactions by Payment method (Selected Fiscal Years) ...... 16
Exhibit 13: Projected Credit Card Fees in YOE $ (FY 2015‐56) ....................................................... 25
Exhibit 14: State Operations Assumptions in the November 2014 forecast – SR 520 Values ....... 28
Exhibit 15: State Operations Escalation Assumptions in the November 2014 Forecast ................ 29
Exhibit 16: SR 520 Share of CSC Cost Projection in YOE $ (FY 2015‐56) ........................................ 31
Exhibit 17: Roadway Toll Systems O&M Costs in YOE $ (FY 2015‐56) ........................................... 33
Exhibit 18: Transponder Sales and Inventory Costs in YOE $ (FY 2015‐56) ................................... 36
Exhibit 19: Projected Facility O&M Costs for the $2.90 Billion Program in YOE $ (FY 2015‐56) ................................................................................................................................................... 38
Exhibit 20: Projected Insurance Costs in YOE $ (FY 2015‐56) ........................................................ 40
Exhibit 21: Projected Gross and Net Toll Revenues (FY 2015‐56) .................................................. 41
Exhibit 22: Toll‐Funded Facility Repair and Replacement Cost Estimates by Forecast in YOE $ (FY 2015‐56) ................................................................................................................................ 44
Exhibit 23: Toll Collection Repair and Replacement Cost Estimates by Forecast in YOE $ (FY 2015‐56) ......................................................................................................................................... 48
Exhibit 24: November 2014 Forecast for Toll Collection Repair and Replacement Costs by Component in YOE $ (FY 2015‐56) ................................................................................................. 49
Exhibit 25: Changes in The T&R Table Format across the Four Annual Net Revenue Forecasts ........................................................................................................................................ 52
Exhibit 26: SR 520 Traffic and Revenue Table – November 2014 Forecast ................................... 53
Exhibit 27: SR 520 Toll Transaction Activity Workflow – November 2014 Forecast ...................... 56
Exhibit 28: SR 520 Maintenance Categories and Activities ............................................................ 58

SR 520 Bridge Net Toll Revenue Report 2014 Update — January 30, 2015
IV DISCLAIMER
DISCLAIMER
This report was prepared by Parsons Brinckerhoff as a member of the SR 520 General Engineering
Consultant (GEC) Team in accordance with an agreement with the Washington State Department of
Transportation (WSDOT). This report is subject to the terms and conditions of that agreement, and
is meant to be read as a whole and in conjunction with this disclaimer.
Information and statements contained in this report are based on information provided to Parsons
Brinckerhoff by, and obtained from, WSDOT, WSDOT’s General Toll Consultant (GTC), and other
sources. In the preparation of this report and the opinions contained herein, Parsons Brinckerhoff,
in collaboration with WSDOT and the GTC, makes certain assumptions with respect to conditions
that may exist or events that may occur in the future that are subject to change. Unless a source is
otherwise noted, these assumptions are attributable to WSDOT, the GTC, and/or the SR 520 GEC
Team.
While Parsons Brinckerhoff believes that the projections or other forward‐looking statements
contained within the report are based on reasonable assumptions and correctly represent the inputs
and estimates provided by WSDOT and the GTC as of the date of the report, such forward looking
statements involve risks and uncertainties that may cause actual results to differ materially from the
results predicted.
Parsons Brinckerhoff, Inc. is not a registered Municipal Advisor, and is not subject to the fiduciary
duty a Municipal Advisor has to a municipal entity client as established in Section 15B (c)(1) of the
Securities Exchange Act (Revised). We acknowledge that the WSDOT has informed us that it is
currently represented by registered Municipal Advisors via the Office of the State Treasurer with
regard to the SR 520 Project and that WSDOT will rely on those advisors, or their successors, prior to
taking action on the issuance of municipal securities as it may derive from or in any way depend
upon any work performed by Parsons Brinckerhoff related to the SR 520 Net Revenue Projections.
This report does not constitute a recommendation on the part of Parsons Brinckerhoff, the GEC, the
GTC or WSDOT.

SR 520 Bridge Net Toll Revenue Report 2014 Update — January 30, 2015
INTRODUCTION 1
INTRODUCTION
Background and Purpose
This report documents the preparation of the “November 2014 forecast” of net toll revenue for the
State Route (SR) 520 Bridge across Lake Washington. It serves as an update to previous annual
forecasts, including the most recent “October 2013 forecast” and accompanying SR 520 Bridge Net
Toll Revenue Report — 2014 Update, dated April 2, 2014. As with the previous forecast cycles,
updated investment‐grade traffic and gross toll revenue potential forecasts prepared by CDM Smith
are key inputs to the November 2014 net toll revenue projections. New information about future
traffic, toll revenues, expenditures, and various revenue adjustments are incorporated into the
updated net revenue projections. This report documents the updated projections, describing the
changes in key assumptions, inputs, and influences of operating experience compared to the
previous October 2013 forecast, with select comparisons back to the initial projections from
September 2011.
The net toll revenue projections are used to update the project’s financial plan and represent the
operating cash flow that would be available to pay debt service on toll financing, pay deferred sales
tax on construction, and contribute to other reserve accounts, including one for periodic capital
repair and replacement of facility and toll collection components. Specifically, the projections are
used to demonstrate that tolls on the SR 520 Bridge are predicted to produce revenues in each fiscal
year of the forecast in amounts sufficient for the state to comply with the covenants in Section
7.02(a) of Master Bond Resolution 1117.
All annual amounts in this document are expressed in terms of the state fiscal year (FY), which runs
from July 1 to June 30. The SR 520 forecast horizon extends from FY 2015 through FY 2056.
September 2011 Forecast
For purposes of this document and related materials, the initial CDM Smith investment‐grade traffic
and gross toll revenue potential forecasts and accompanying net toll revenue projections that were
used to support the initial October 2011 bond financing are collectively referred to as the
“September 2011 forecast.”
September 2012 Forecast
In September 2012, as part of ongoing financial planning and the negotiation of a loan from the
United States Department of Transportation (USDOT) through the Transportation Infrastructure
Finance and Innovation Act (TIFIA), CDM Smith completed a revised traffic and gross toll revenue
potential forecast. Accompanying net revenue projections were also prepared, along with
memoranda covering these revisions. During their subsequent toll rate setting process, the
Washington State Transportation Commission (WSTC) opted to round toll rates to the nearest nickel
($0.05) for the July 1, 2013 (FY 2014) and future planned toll increases.

SR 520 Bridge Net Toll Revenue Report 2014 Update — January 30, 2015
2 INTRODUCTION
For purposes of this document and related materials, the traffic and gross toll revenue potential
forecasts, along with the accompanying net toll revenue projections — inclusive of the minor
revision for nickel rounding — are collectively referred to as the “September 2012 forecast.”
October 2013 Forecast
CDM Smith performed a comprehensive traffic and gross toll revenue forecast update in 2013.
Detailed updates to the facility operations and maintenance (O&M) costs, toll collection O&M costs,
and revenue adjustments were also prepared in late summer 2013 to yield updated net revenue
projections. Collectively, these traffic and gross toll revenue forecasts, along with the net toll
revenue projections, are referred to as the “October 2013 forecast.”
November 2014 Forecast
Another comprehensive traffic and gross toll revenue forecast update was prepared by CDM Smith
in 2014. As in 2013, a detailed review of the facility O&M costs, toll collection O&M costs, and
revenue adjustments were made in the summer and fall of 2014, ultimately leading to revised inputs
and assumptions to select forecast components. Collectively, these current traffic and gross toll
revenue forecasts, along with the accompanying net toll revenue projections, are referred to as the
“November 2014 forecast.”
Exhibit 1 illustrates the timeline for the series of SR 520 net toll revenue projections and their
underlying investment‐grade traffic and gross toll revenue potential forecasts.
EXHIBIT 1: TIMELINE OF SR 520 TRAFFIC, GROSS REVENUE, AND NET REVENUE FORECASTS
Project Description
The SR 520 corridor stretches nearly 13 miles between I‐5 in Seattle to the west and SR 202 to the
east, crossing I‐405 at about the halfway point, and serving various Eastside communities, including
Bellevue, Kirkland and Redmond. The SR 520 Bridge Replacement and HOV Program includes the
portion of the corridor between I‐5 and I‐405, and is comprised of five major components:
Net Toll Revenue Forecast prepared in conjunction with CDM Smith Traffic and Gross Revenue Forecast (Forecast Date )
Net Toll Revenue Report / Documentation
*
Apr 2014
Nov 2014
Jan 2015
Modified to incorporate nickel rounding of toll rates in fiscal years 2014‐16, as adopted by the Washington State
Transportation Commission in May 2013.
May 2013
Sep 2012
Sep 2011
SR 520 Bridge
Net Toll Revenue Report
(September 2011)
Forecast Revision
(September 2012)
Minor Forecast
Update Applying
Nickel Rounding of
Toll Rates Only
(September 2012*)
Net Toll Revenue
Report 2013 Update
Comprehensive
Forecast Update
(November 2014)
Net Toll Revenue
Report 2014 Update
Oct 2013
Comprehensive
Forecast Update
(October 2013)
SR 520 Bridge Net Toll Revenue Report 2014 Update — January 30, 2015
INTRODUCTION 3
1) Pontoon Construction;
2) Eastside Transit and HOV Project;
3) Floating Bridge and Landings (FB&L) Project
4) West Approach Bridge North; and
5) I‐5 to Lake Washington, including the West Approach Bridge South
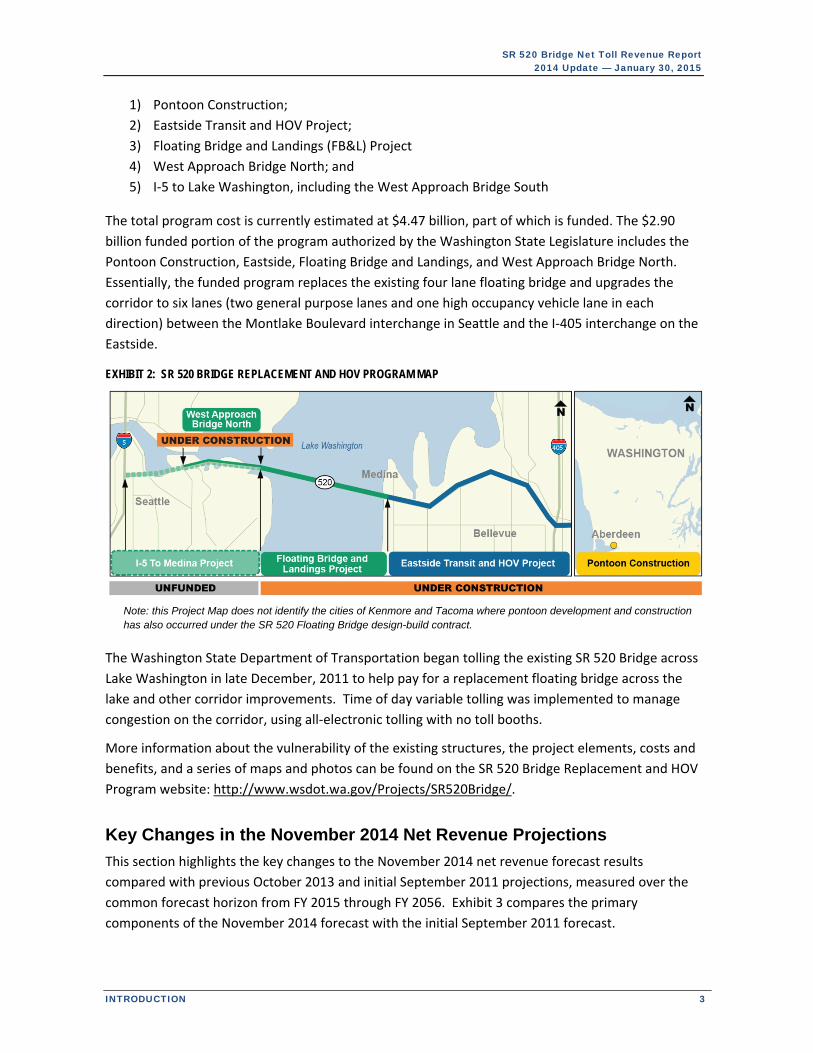
The total program cost is currently estimated at $4.47 billion, part of which is funded. The $2.90
billion funded portion of the program authorized by the Washington State Legislature includes the
Pontoon Construction, Eastside, Floating Bridge and Landings, and West Approach Bridge North.
Essentially, the funded program replaces the existing four lane floating bridge and upgrades the
corridor to six lanes (two general purpose lanes and one high occupancy vehicle lane in each
direction) between the Montlake Boulevard interchange in Seattle and the I‐405 interchange on the
Eastside.
EXHIBIT 2: SR 520 BRIDGE REPLACEMENT AND HOV PROGRAM MAP
Note: this Project Map does not identify the cities of Kenmore and Tacoma where pontoon development and construction has also occurred under the SR 520 Floating Bridge design-build contract.
The Washington State Department of Transportation began tolling the existing SR 520 Bridge across
Lake Washington in late December, 2011 to help pay for a replacement floating bridge across the
lake and other corridor improvements. Time of day variable tolling was implemented to manage
congestion on the corridor, using all‐electronic tolling with no toll booths.
More information about the vulnerability of the existing structures, the project elements, costs and
benefits, and a series of maps and photos can be found on the SR 520 Bridge Replacement and HOV
Program website: http://www.wsdot.wa.gov/Projects/SR520Bridge/.
Key Changes in the November 2014 Net Revenue Projections
This section highlights the key changes to the November 2014 net revenue forecast results
compared with previous October 2013 and initial September 2011 projections, measured over the
common forecast horizon from FY 2015 through FY 2056. Exhibit 3 compares the primary
components of the November 2014 forecast with the initial September 2011 forecast.

SR 520 Bridge Net Toll Revenue Report 2014 Update — January 30, 2015
4 INTRODUCTION
EXHIBIT 3: GROSS TO NET REVENUE COMPARISON — SEPTEMBER 2011 VS NOVEMBER 2014 — FY 2015-56
Exhibit 4 compares the primary components of the November 2014 forecast with the most recent
October 2013 forecast.
EXHIBIT 4: GROSS TO NET REVENUE COMPARISON — OCTOBER 2013 VS NOVEMBER 2014 — FY 2015-56
Traffic and Gross Revenues
Total toll transactions for CDM Smith’s November 2014 forecast over the FY 2015‐56
forecast horizon are 0.7 percent lower than projected in September 2011 and 0.9 percent
higher than the previous October 2013 forecast.
Gross toll revenue potential for the November 2014 forecast is 5.6 percent lower than the
initial September 2011 forecast, compared with 1.2 percent lower than the October 2013
forecast over the forecast horizon.
CDM Smith’s November 2014 traffic and gross toll revenue potential forecasts reflect
upward revisions to underlying socioeconomic projections including higher population and
employment growth specifically in the Seattle central business district compared with
October 2013.
In addition, CDM Smith revised upwards the transaction share associated with Good To Go!
accountholders compared with the October 2013 and September 2011 forecasts, lowering
Pay By Mail transactions which pay a higher toll rate, hence reducing projected revenue.
Revenue forecast values were also revised lower to account for a downward revision in the
forecast for multiple axle vehicles and an increase in the number of weekend closure days
due to construction for FY 2015‐18 relative to previous forecasts. The increase in expected
construction closures is based on the agreement between WSDOT and the contractor on the
West Approach Bridge that will eventually serve westbound traffic.
Forecast Category
(#) = T&R table column reference
Sep 2011 Forecast
(millions)
Nov 2014 Forecast
(millions)
Variance
(millions)
Variance
(%)
Total Toll Transactions (8) 1,441.1 1,430.5 (10.6) –0.7%
Gross Toll Revenue Potential (11) $5,065.3 $4,783.8 ($281.5) –5.6%
Subtotal: Revenue Adjustments (78.8) (112.8) (34.0) +43.1%
Subtotal: O&M Costs (1,492.6) (1,249.9) 242.6 –16.3%
Net Toll Revenue before R&R (25) $3,493.9 $3,421.1 ($72.8) –2.1%
Subtotal: R&R Costs + Deferred Sales Tax (357.6) (472.6) (115.0) +32.2%
Net Toll Revenue after R&R $3,136.3 $2,948.5 ($187.8) –6.0%
Forecast Category
(#) = T&R table column reference
Oct 2013 Forecast
(millions)
Nov 2014 Forecast
(millions)
Variance
(millions)
Variance
(%)
Total Toll Transactions (8) 1,417.7 1,430.5 12.8 +0.9%
Gross Toll Revenue Potential (11) $4,843.9 $4,783.8 ($60.1) –1.2%
Subtotal: Revenue Adjustments (109.3) (112.8) (3.4) +3.1%
Subtotal: O&M Costs (1,253.8) (1,249.9) 3.8 –0.3%
Net Toll Revenue before R&R (25) $3,480.8 $3,421.1 ($59.7) –1.7%
Subtotal: R&R Costs + Deferred Sales Tax (476.9) (472.6) 4.2 –0.9%
Net Toll Revenue after R&R $3,003.9 $2,948.5 ($55.5) –1.8%

SR 520 Bridge Net Toll Revenue Report 2014 Update — January 30, 2015
INTRODUCTION 5
Revenue Adjustments
Updates since the September 2011 forecast include a significant reduction in the projected
use of the short‐term account payment option and an increase in the number of Good To
Go! accountholders using the Pay By Plate option and corresponding revenue associated
with the $0.25 Pay By Plate fee. The Pay By Plate share of total transactions was further
revised upwards in the November 2014 forecast to better align with actual experience on
the facility.
The November 2014 forecast for uncollectible revenue (leakage) associated with revenue
not recognized and unpaid toll revenue is 39 percent higher than projected in September
2011 and 10 percent higher than projected in the October 2013 forecast.
o A key factor in this increase is a refinement to the calculation of average revenue per
transaction that better reflects the mix of expected payment methods and their
associated tolls among the vehicles for which revenue will not be collected.
o Other partially offsetting factors changing since September 2011 include reduced
leakage volumes due to fewer projected Pay By Mail transactions in the traffic
forecasts and revised assumptions based on actual system performance which
indicates improvements in license plate readability and owner identification.
Operating and Maintenance Costs
Overall O&M costs in the November 2014 forecast are $242.6 million or 16.3 percent lower
over the forecast horizon compared to the September 2011 forecast, and $3.8 million or 0.3
percent lower than the October 2013 forecast. Compared to September 2011, changes are
due to:
o Lower toll collection O&M costs, particularly for Customer Service Center (CSC)
vendor costs, printing and postage costs for Pay By Mail invoices,
o Lower credit card fees; and
o Lower transponder purchase and inventory costs.
While the overall O&M costs for the November 2014 forecast were essentially unchanged
over the FY 2015‐56 forecast horizon compared to October 2013, there were some
offsetting movements to various components in the latest forecast:
o Slightly lower total toll collection costs include higher roadway toll system (RTS)
costs and new state general administrative and management cost items not
previously paid from tolls, which were offset by lower CSC and printing and postage
costs, including economies of scale reducing SR 520’s share of system costs from the
addition of I‐405 and SR 99 assumed in FY 2018;
o Lower projected credit card fees; and

SR 520 Bridge Net Toll Revenue Report 2014 Update — January 30, 2015
6 INTRODUCTION
o Higher routine facility O&M costs over the forecast horizon primarily due to revised
energy consumption costs associated with under‐lid lighting and roadway toll
systems.
Net Revenues
As a result of changes in the traffic and gross toll revenue potential forecasts as well as
revisions to the revenue adjustments and O&M costs, the November 2014 forecast of $3.42
billion in net toll revenues over the forecast horizon is 2.1 percent ($73 million) lower than
the original September 2011 forecast.
Compared to the October 2013 forecast, the November 2014 projection for net revenues is
1.7 percent ($60 million) lower over the forecast horizon.
Other Project Uses of Toll Revenues
The projected total deferred sales tax to be repaid with toll revenues was $124.2 million in
the September 2011 forecast. This value subsequently increased to $143.6 million in the
September 2012 forecast, and then to $159.4 million for both the October 2013 and
November 2014 forecasts. The increases reflect a change in the project scope due to
addition of a new West Approach Bridge North for westbound traffic in 2012, and additional
pontoon costs in 2013, bringing the funded project cost to $2.90 billion.
Periodic facility repair and replacement (R&R) costs for the items specifically identified to be
paid from toll revenues in the November 2014 forecast increased by 21 percent from the
September 2011 forecast, to $262 million over the forecast horizon, though this value is 3
percent ($8 million) lower than in the October 2013 forecast.
o Changes in facility R&R estimates from the initial September 2011 forecast to
subsequent forecasts are due to the addition of federally required standard bridge
inspections, higher projected costs for anchor cable replacement, and added costs
for the aforementioned increase in project scope adding the West Approach Bridge
North structure.
Toll collection R&R cost estimates have increased significantly since the original September
2011 forecast. The majority of the increase reflected in both the October 2013 and
November 2014 forecasts is attributable to a new assumption that the State costs associated
with periodically procuring, testing, and transitioning to new CSC and Roadway Toll Systems
(RTS) vendors would be paid from tolls, shared proportionately by each toll facility. For the
November 2014 forecast, this amounts to a $34 million increase over the forecast horizon
compared to the September 2011 forecast, or $4 million higher than the October 2013
forecast.
o The smaller increase from the October 2013 to November 2014 forecast
incorporates additional cost items that were previously excluded, specifically related
to RTS computer equipment and replacement spare parts inventory.

SR 520 Bridge Net Toll Revenue Report 2014 Update — January 30, 2015
TRAFFIC AND REVENUE OVERVIEW 7
TRAFFIC AND REVENUE OVERVIEW
Toll Traffic and Gross Toll Revenue Potential
Annual toll traffic and gross toll revenue potential projections were prepared by CDM Smith, based
on the corridor configuration for the funded $2.90 billion set of improvements. These annual traffic
and gross toll revenue potential forecasts through FY 2056 serve as inputs to the estimation of net
toll revenues. The following summarizes the key assumption changes for the November 2014
forecast that impact the net revenue projections.
The November 2014 forecast included CDM Smith updates of the underlying assumptions to
account for actual performance through FY 2014 and also made revisions to weekend traffic
assumptions, truck traffic, employment, population, and other factors relative to the
October 2013 forecast.
o The projected number of weekend day bridge construction closures from FY 2015
through FY 2018 is now 30 days, an increase of 16, with 10 of the additional closure
days occurring in FY 2016.
o The Good To Go! account‐based transaction share came in higher than expected for
FY 2014 at 84.2 percent. CDM Smith has raised their forecast share to 84.6 percent
in FY 2015, escalating to 87.8 percent by FY 2031, and flat thereafter.
o Following a significant reduction to the truck component of traffic for in the October
2013 forecast, CDM Smith has made a further modest reduction to share of vehicles
with three or more axles based on actual data. Their November 2014 forecast
assumes a 0.7% truck share in FY 2015, increasing to 1.8% by FY 2031.
o While the above factors tend to reduce the gross toll revenue potential forecasts, in
most cases by reducing the average revenue per transaction, updated socio‐
economic (population and employment) forecasts are contributing to slightly higher
traffic projections, helping to offset with more revenue.
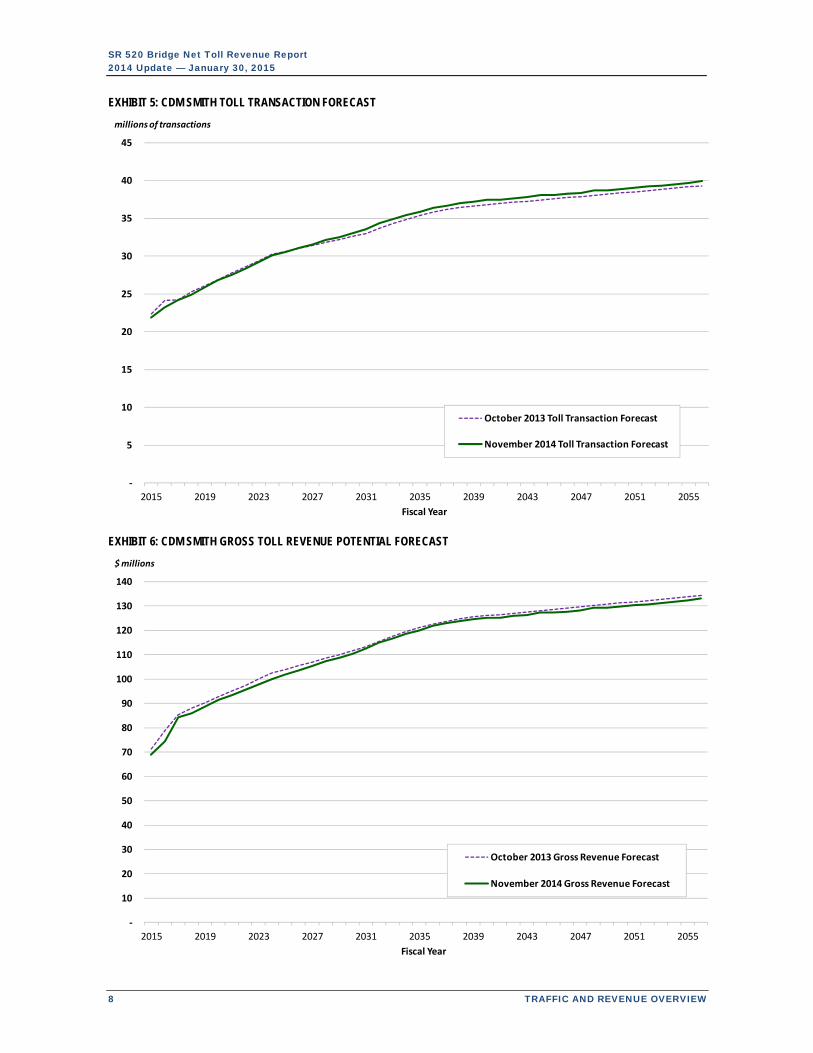
As documented herein, both the volume of toll transactions and amount of gross toll revenue
potential impact certain cost estimates, and thus, the net revenue projections. Exhibit 5 illustrates
CDM Smith’s projected toll transactions for the November 2014 forecast, compared to the previous
October 2013 forecast. Exhibit 6 illustrates the corresponding gross toll revenue potential trends
through FY 2056 for the same two forecasts.
The annual forecast detail for the November 2013 traffic and gross toll revenue potential by fiscal
year can be found in columns 2‐11 of the Exhibit 26 T&R table in Appendix A.
SR 520 Bridge Net Toll Revenue Report 2014 Update — January 30, 2015
8 TRAFFIC AND REVENUE OVERVIEW
EXHIBIT 5: CDM SMITH TOLL TRANSACTION FORECAST
EXHIBIT 6: CDM SMITH GROSS TOLL REVENUE POTENTIAL FORECAST
‐
5
10
15
20
25
30
35
40
45
2015 2019 2023 2027 2031 2035 2039 2043 2047 2051 2055
millions of transactions
Fiscal Year
October 2013 Toll Transaction Forecast
November 2014 Toll Transaction Forecast
‐
10
20
30
40
50
60
70
80
90
100
110
120
130
140
2015 2019 2023 2027 2031 2035 2039 2043 2047 2051 2055
$ millions
Fiscal Year
October 2013 Gross Revenue Forecast
November 2014 Gross Revenue Forecast

SR 520 Bridge Net Toll Revenue Report 2014 Update — January 30, 2015
TRAFFIC AND REVENUE OVERVIEW 9
Payment and Toll Transaction Types
The second key input received from CDM Smith is the output distribution of travel (toll transactions)
and revenue by toll payment method. This information is used to estimate the costs of collection
that differ between user types, as described later in this report. Forecasts have been prepared for
two main categories of customers: prepaid Good To Go! account‐holders and non‐account
customers. Within each of these categories are additional payment options, described in further
detail below.
Good To Go! Account Transactions
When Good To Go! customers set up a prepaid account, they have two options for how to pay their
toll: they can purchase a pass (transponder) for their vehicle(s), and/or they can enroll in “Pay By
Plate” in which a picture of the vehicle’s license plate is captured and linked to their account for
payment, with an additional $0.25 processing fee.
The Good To Go! pass and Pay By Plate payment options require a minimum opening balance of $30;
all accounts established on‐line are automatically enrolled in auto‐charge account replenishment.
When an account reaches a minimum threshold, the account is replenished to a pre‐selected
amount of at least $30, typically using automatic replenishment. Manual customer‐initiated
replenishment is an option.
Non‐Account Transactions
Customers who do not have a Good To Go! account will be billed for their toll using a photo tolling
system and Pay By Mail billing process. Vehicles passing through the toll facility that are not
associated with a Good To Go! account (via a transponder pass or license plate number) will initiate
the Pay By Mail billing process. Using a photo of the license plate, the plate number will be read and
matched with vehicle registration data to obtain an owner name and mailing address from the
Washington State Department of Licensing (DOL) or from a contracted vendor in the case of most
other states. A bill will then be mailed to the registered owner for the applicable Pay By Mail toll
rate plus any additional fees incurred. Pay By Mail customers will have 80 days and two invoice
cycles from the time of travel to pay their toll before the transaction is considered unpaid and
becomes subject to a civil penalty. The Pay By Mail toll rate was initially $1.50 higher than the
applicable Good To Go! rate for each time of day. Currently, the differential ranges from $1.60 to
$1.65 due to the nickel rounding of toll increases. The increment is projected to increase to an even
$1.70 by FY 2017, with no further increases assumed thereafter.
Although the incidence of use is very low, it is possible for customers without a Good To Go! account
to self‐initiate toll payment before or after travel via opening a Short‐Term Account prior to
receiving a bill in the mail. Customers that do this will receive a $0.50 discount off the Pay By Mail
toll rate. This process effectively allows the user to establish a temporary account valid for up to 14
days. A Short‐Term Account may be opened up to 10 days prior to, or up to three days after the first
travel day.

SR 520 Bridge Net Toll Revenue Report 2014 Update — January 30, 2015
10 TRAFFIC AND REVENUE OVERVIEW
Virtually all of the toll trips by customers without a Good To Go! account are projected to be
processed as Pay By Mail transactions in which the customer responds to a toll bill received in the
mail, with less than one percent initiating payment via a Short‐Term Account.
Projected Gross Toll Revenue and Transactions by Payment Type
Projections for the percentage shares of Good To Go! and non‐account toll transactions provided by
CDM Smith are shown in Exhibit 7. Over time, it is estimated that the share of Good To Go! account
customers will increase to an assumed ceiling of approximately 88 percent, while the share of non‐
account customers will decrease. Marketing efforts, the expansion of tolling to other WSDOT
facilities, technology advancements, and customer incentives (the lower toll rate for account‐based
toll payments) are among the factors that will influence the market share distribution between
account and non‐account customers.
EXHIBIT 7: PROJECTED MARKET SHARES BY PAYMENT METHOD (FY 2015-56)
As part of the estimation of toll payment fees and discounts described later in this report, the CDM
Smith projected market shares by payment method are further divided into sub‐categories. Good To
Go! transactions are subdivided into those using a transponder pass and Pay By Plate transactions,
as shown in Exhibit 12 on page 16, with their percentage shares relative to total transactions. For
Good To Go! accountholders, transponder pass usage is forecasted to comprise between 80 and 90
percent of all Good To Go! transactions.
Though not shown in Exhibit 7 or Exhibit 12, non‐account transactions are further subdivided into
normal Pay By Mail transactions and Short‐Term Account transactions, with the latter comprising
less than 0.2 percent of all non‐account transactions, or about 0.02 percent of total transactions.
0%
10%
20%
30%
40%
50%
60%
70%
80%
90%
100%
2015 2019 2023 2027 2031 2035 2039 2043 2047 2051 2055
Fiscal Year
October 2013 Forecast
November 2014 Forecast
Source: CDM Smith
Good To Go! Market Share
Non‐Account Market Share

SR 520 Bridge Net Toll Revenue Report 2014 Update — January 30, 2015
TRAFFIC AND REVENUE OVERVIEW 11
Gross to Net Toll Revenue
Toll transactions by payment type and
gross toll revenue potential forecast
values provided by CDM Smith are the
initial inputs used in the net revenue
forecasts.
Exhibit 8 to the right illustrates the flow of
funds or “waterfall” of revenue
adjustments and expenditures that are
projected to occur in transitioning from
gross toll revenue potential to the net
revenues available to support project
financing.
This net toll revenue report update is
organized around this waterfall in
presenting the revisions to assumptions
and values for each “bucket.” Consistent
with the toll traffic and gross revenue
forecasts, the projections for the revenue
adjustments and O&M expenditure items
that yield net revenues were prepared for
the FY 2015‐56 forecast horizon.
A detailed T&R table provided as Exhibit 26
in Appendix A provides the annual toll
transactions and the annual dollar
projections for each of the waterfall
elements listed in Exhibit 8, shown in
numbered columns. As the sections of this
report cover the net revenue components
in the waterfall diagram, reference is made
to annual values for each component in
the Appendix A, Exhibit 26 T&R table by
their column number.
Note that while the waterfall follows the
structure of the T&R table, the subsequent
uses of the net toll revenues in the bottom
three buckets actually follow a separate
flow of funds in the financial plan that
accounts for annual contribution to debt
service and various reserve accounts.
EXHIBIT 8: NET REVENUE WATERFALL
SR 520 Bridge Net Toll Revenue Report 2014 Update — January 30, 2015
12 ACTUAL NET REVENUE PERFORMANCE FOR FISCAL YEAR 2014
ACTUAL NET REVENUE PERFORMANCE FOR FY 2014
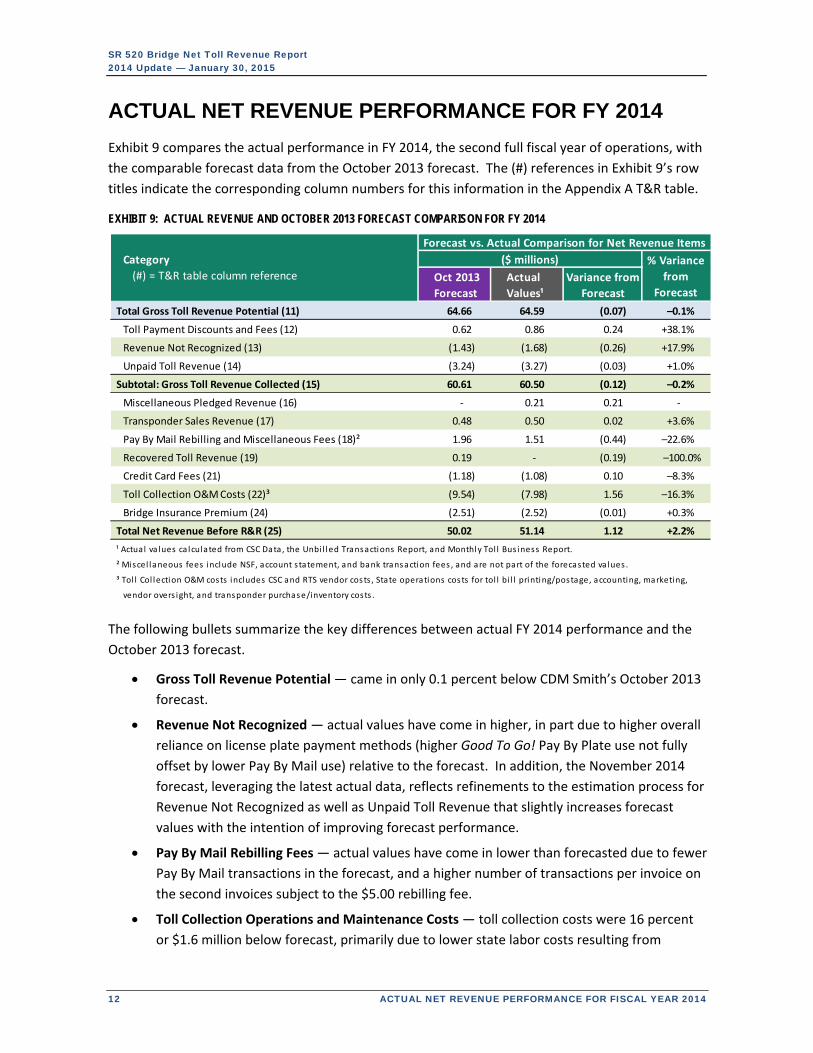
Exhibit 9 compares the actual performance in FY 2014, the second full fiscal year of operations, with
the comparable forecast data from the October 2013 forecast. The (#) references in Exhibit 9’s row
titles indicate the corresponding column numbers for this information in the Appendix A T&R table.
EXHIBIT 9: ACTUAL REVENUE AND OCTOBER 2013 FORECAST COMPARISON FOR FY 2014
The following bullets summarize the key differences between actual FY 2014 performance and the
October 2013 forecast.
Gross Toll Revenue Potential — came in only 0.1 percent below CDM Smith’s October 2013
forecast.
Revenue Not Recognized — actual values have come in higher, in part due to higher overall
reliance on license plate payment methods (higher Good To Go! Pay By Plate use not fully
offset by lower Pay By Mail use) relative to the forecast. In addition, the November 2014
forecast, leveraging the latest actual data, reflects refinements to the estimation process for
Revenue Not Recognized as well as Unpaid Toll Revenue that slightly increases forecast
values with the intention of improving forecast performance.
Pay By Mail Rebilling Fees — actual values have come in lower than forecasted due to fewer
Pay By Mail transactions in the forecast, and a higher number of transactions per invoice on
the second invoices subject to the $5.00 rebilling fee.
Toll Collection Operations and Maintenance Costs — toll collection costs were 16 percent
or $1.6 million below forecast, primarily due to lower state labor costs resulting from
Forecast vs. Actual Comparison for Net Revenue Items
($ millions)
Oct 2013
Forecast
Actual
Values¹
Variance from
Forecast
Total Gross Toll Revenue Potential (11) 64.66 64.59 (0.07) –0.1%
Toll Payment Discounts and Fees (12) 0.62 0.86 0.24 +38.1%
Revenue Not Recognized (13) (1.43) (1.68) (0.26) +17.9%
Unpaid Toll Revenue (14) (3.24) (3.27) (0.03) +1.0%
Subtotal: Gross Toll Revenue Collected (15) 60.61 60.50 (0.12) –0.2%
Miscellaneous Pledged Revenue (16) ‐ 0.21 0.21 ‐
Transponder Sales Revenue (17) 0.48 0.50 0.02 +3.6%
Pay By Mail Rebilling and Miscellaneous Fees (18)² 1.96 1.51 (0.44) –22.6%
Recovered Toll Revenue (19) 0.19 ‐ (0.19) –100.0%
Credit Card Fees (21) (1.18) (1.08) 0.10 –8.3%
Toll Collection O&M Costs (22)³ (9.54) (7.98) 1.56 –16.3%
Bridge Insurance Premium (24) (2.51) (2.52) (0.01) +0.3%
Total Net Revenue Before R&R (25) 50.02 51.14 1.12 +2.2%
¹ Actual va lues ca lculated from CSC Data, the Unbi l led Transactions Report, and Monthly Tol l Bus iness Report.
² Miscel laneous fees include NSF, account statement, and bank transaction fees , and are not part of the forecasted va lues .
³ Tol l Col lection O&M costs includes CSC and RTS vendor costs , State operations costs for tol l bi l l printing/postage, accounting, marketing,
vendor overs ight, and transponder purchase/inventory costs .
% Variance
from
Forecast
Category
(#) = T&R table column reference
SR 520 Bridge Net Toll Revenue Report 2014 Update — January 30, 2015
ACTUAL NET REVENUE PERFORMANCE FOR FISCAL YEAR 2014 13
unfilled positions, with lower than forecasted transponder costs a small contributing factor.
The labor cost contribution to this variance is not expected to continue in subsequent
forecast years.
Note that the miscellaneous fees component of “Pay By Mail Rebilling and Miscellaneous Fees
(18)”and all of “Miscellaneous Pledged Revenue (16)” are not included in the forecast values.
However, actual amounts for these items are reported in Exhibit 9 and in the T&R table as part of
the pledged toll revenues.
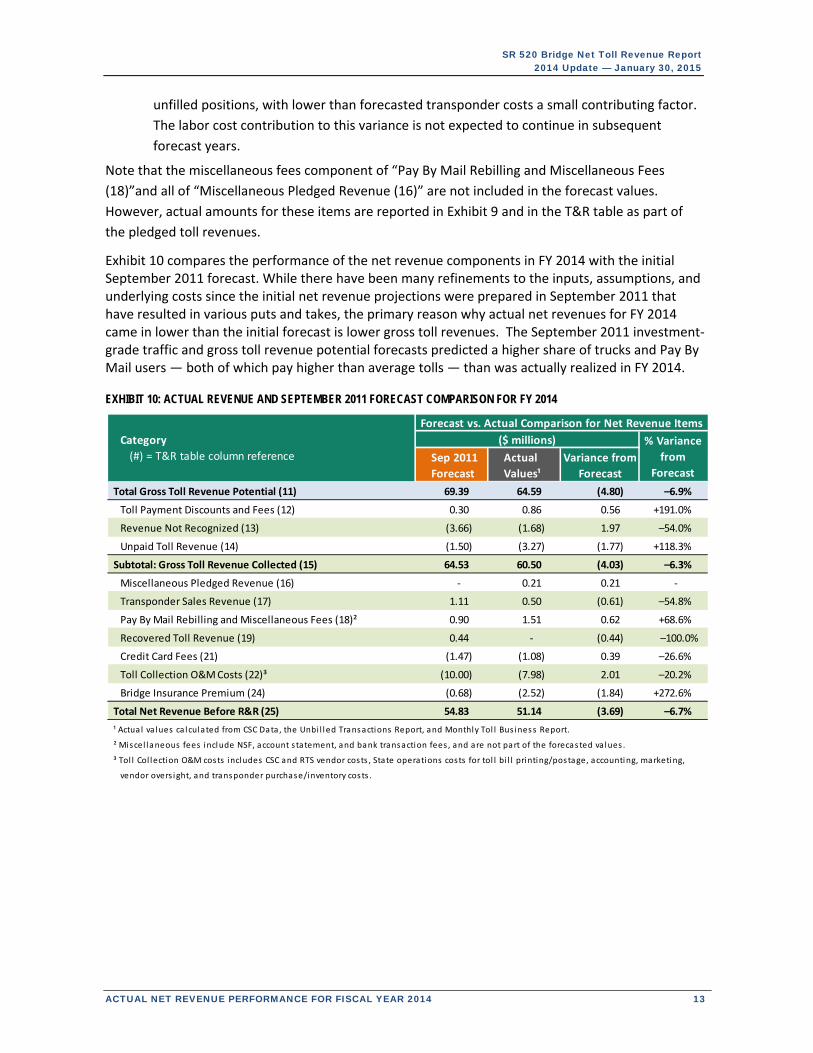
Exhibit 10 compares the performance of the net revenue components in FY 2014 with the initial September 2011 forecast. While there have been many refinements to the inputs, assumptions, and underlying costs since the initial net revenue projections were prepared in September 2011 that have resulted in various puts and takes, the primary reason why actual net revenues for FY 2014 came in lower than the initial forecast is lower gross toll revenues. The September 2011 investment‐grade traffic and gross toll revenue potential forecasts predicted a higher share of trucks and Pay By Mail users — both of which pay higher than average tolls — than was actually realized in FY 2014.
EXHIBIT 10: ACTUAL REVENUE AND SEPTEMBER 2011 FORECAST COMPARISON FOR FY 2014
Forecast vs. Actual Comparison for Net Revenue Items
($ millions)
Sep 2011
Forecast
Actual
Values¹
Variance from
Forecast
Total Gross Toll Revenue Potential (11) 69.39 64.59 (4.80) –6.9%
Toll Payment Discounts and Fees (12) 0.30 0.86 0.56 +191.0%
Revenue Not Recognized (13) (3.66) (1.68) 1.97 –54.0%
Unpaid Toll Revenue (14) (1.50) (3.27) (1.77) +118.3%
Subtotal: Gross Toll Revenue Collected (15) 64.53 60.50 (4.03) –6.3%
Miscellaneous Pledged Revenue (16) ‐ 0.21 0.21 ‐
Transponder Sales Revenue (17) 1.11 0.50 (0.61) –54.8%
Pay By Mail Rebilling and Miscellaneous Fees (18)² 0.90 1.51 0.62 +68.6%
Recovered Toll Revenue (19) 0.44 ‐ (0.44) –100.0%
Credit Card Fees (21) (1.47) (1.08) 0.39 –26.6%
Toll Collection O&M Costs (22)³ (10.00) (7.98) 2.01 –20.2%
Bridge Insurance Premium (24) (0.68) (2.52) (1.84) +272.6%
Total Net Revenue Before R&R (25) 54.83 51.14 (3.69) –6.7%
¹ Actual va lues ca lculated from CSC Data, the Unbi l led Transactions Report, and Monthly Tol l Bus iness Report.
² Miscel laneous fees include NSF, account statement, and bank transaction fees , and are not part of the forecas ted va lues .
³ Tol l Col lection O&M costs includes CSC and RTS vendor costs , State operations costs for tol l bi l l printing/postage, accounting, marketing,
vendor overs ight, and transponder purchase/inventory costs .
Category
(#) = T&R table column reference% Variance
from
Forecast
SR 520 Bridge Net Toll Revenue Report 2014 Update — January 30, 2015
14 SUMMARY OF CHANGES IN THE NET REVENUE PROJECTIONS
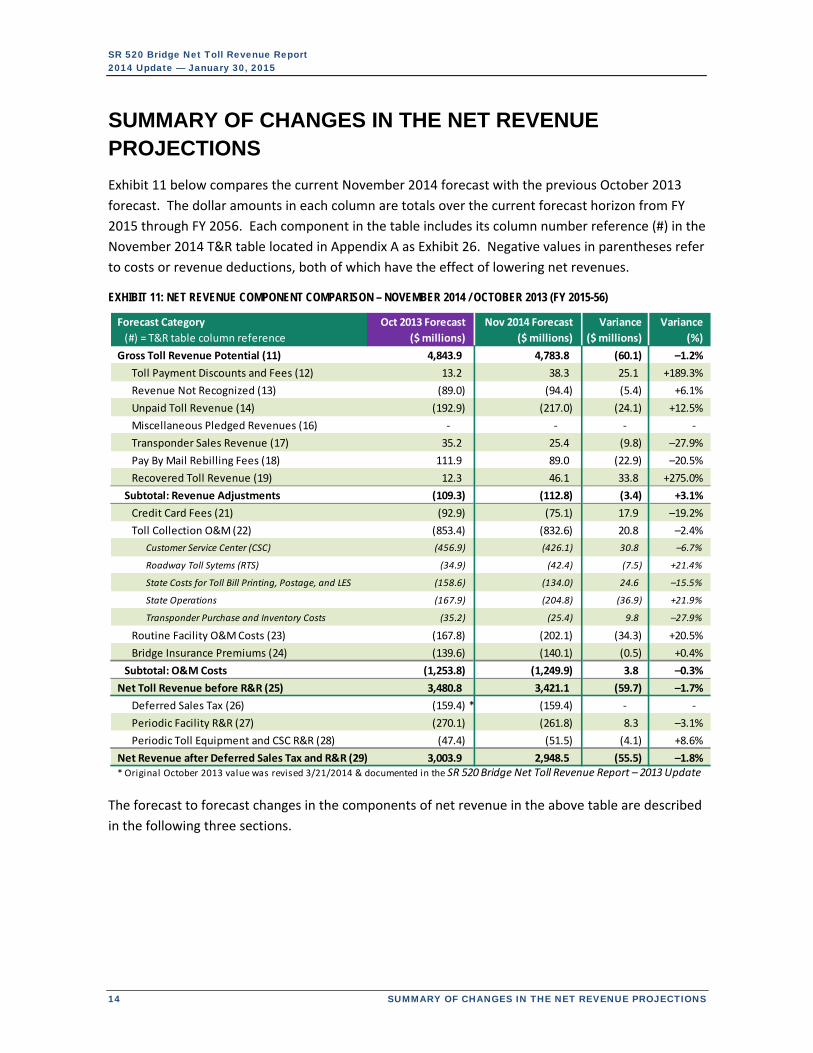
SUMMARY OF CHANGES IN THE NET REVENUE PROJECTIONS
Exhibit 11 below compares the current November 2014 forecast with the previous October 2013
forecast. The dollar amounts in each column are totals over the current forecast horizon from FY
2015 through FY 2056. Each component in the table includes its column number reference (#) in the
November 2014 T&R table located in Appendix A as Exhibit 26. Negative values in parentheses refer
to costs or revenue deductions, both of which have the effect of lowering net revenues.
EXHIBIT 11: NET REVENUE COMPONENT COMPARISON – NOVEMBER 2014 / OCTOBER 2013 (FY 2015-56)
The forecast to forecast changes in the components of net revenue in the above table are described
in the following three sections.
Forecast Category
(#) = T&R table column reference
Oct 2013 Forecast
($ millions)
Nov 2014 Forecast
($ millions)
Variance
($ millions)
Variance
(%)
Gross Toll Revenue Potential (11) 4,843.9 4,783.8 (60.1) –1.2%
Toll Payment Discounts and Fees (12) 13.2 38.3 25.1 +189.3%
Revenue Not Recognized (13) (89.0) (94.4) (5.4) +6.1%
Unpaid Toll Revenue (14) (192.9) (217.0) (24.1) +12.5%
Miscellaneous Pledged Revenues (16) ‐ ‐ ‐ ‐
Transponder Sales Revenue (17) 35.2 25.4 (9.8) –27.9%
Pay By Mail Rebilling Fees (18) 111.9 89.0 (22.9) –20.5%
Recovered Toll Revenue (19) 12.3 46.1 33.8 +275.0%
Subtotal: Revenue Adjustments (109.3) (112.8) (3.4) +3.1%
Credit Card Fees (21) (92.9) (75.1) 17.9 –19.2%
Toll Collection O&M (22) (853.4) (832.6) 20.8 –2.4%
Customer Service Center (CSC) (456.9) (426.1) 30.8 –6.7%
Roadway Toll Sytems (RTS) (34.9) (42.4) (7.5) +21.4%
State Costs for Toll Bill Printing, Postage, and LES (158.6) (134.0) 24.6 –15.5%
State Operations (167.9) (204.8) (36.9) +21.9%
Transponder Purchase and Inventory Costs (35.2) (25.4) 9.8 –27.9%
Routine Facility O&M Costs (23) (167.8) (202.1) (34.3) +20.5%
Bridge Insurance Premiums (24) (139.6) (140.1) (0.5) +0.4%
Subtotal: O&M Costs (1,253.8) (1,249.9) 3.8 –0.3%
Net Toll Revenue before R&R (25) 3,480.8 3,421.1 (59.7) –1.7%
Deferred Sales Tax (26) (159.4) * (159.4) ‐ ‐
Periodic Facility R&R (27) (270.1) (261.8) 8.3 –3.1%
Periodic Toll Equipment and CSC R&R (28) (47.4) (51.5) (4.1) +8.6%
Net Revenue after Deferred Sales Tax and R&R (29) 3,003.9 2,948.5 (55.5) –1.8%* Original October 2013 value was revised 3/21/2014 & documented in the SR 520 Bridge Net Toll Revenue Report – 2013 Update
SR 520 Bridge Net Toll Revenue Report 2014 Update — January 30, 2015
CHANGES TO REVENUE ADJUSTMENTS 15
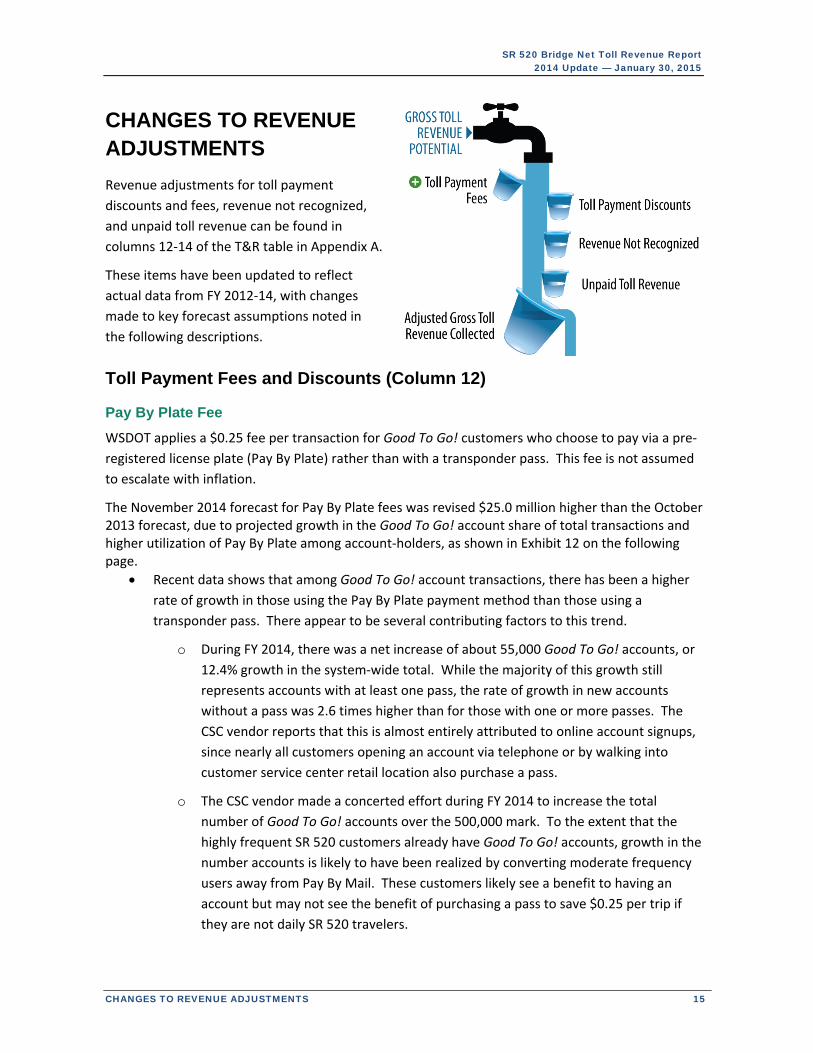
CHANGES TO REVENUE ADJUSTMENTS
Revenue adjustments for toll payment
discounts and fees, revenue not recognized,
and unpaid toll revenue can be found in
columns 12‐14 of the T&R table in Appendix A.
These items have been updated to reflect
actual data from FY 2012‐14, with changes
made to key forecast assumptions noted in
the following descriptions.
Toll Payment Fees and Discounts (Column 12)
Pay By Plate Fee
WSDOT applies a $0.25 fee per transaction for Good To Go! customers who choose to pay via a pre‐
registered license plate (Pay By Plate) rather than with a transponder pass. This fee is not assumed
to escalate with inflation.
The November 2014 forecast for Pay By Plate fees was revised $25.0 million higher than the October 2013 forecast, due to projected growth in the Good To Go! account share of total transactions and higher utilization of Pay By Plate among account‐holders, as shown in Exhibit 12 on the following page.
Recent data shows that among Good To Go! account transactions, there has been a higher
rate of growth in those using the Pay By Plate payment method than those using a
transponder pass. There appear to be several contributing factors to this trend.
o During FY 2014, there was a net increase of about 55,000 Good To Go! accounts, or
12.4% growth in the system‐wide total. While the majority of this growth still
represents accounts with at least one pass, the rate of growth in new accounts
without a pass was 2.6 times higher than for those with one or more passes. The
CSC vendor reports that this is almost entirely attributed to online account signups,
since nearly all customers opening an account via telephone or by walking into
customer service center retail location also purchase a pass.
o The CSC vendor made a concerted effort during FY 2014 to increase the total
number of Good To Go! accounts over the 500,000 mark. To the extent that the
highly frequent SR 520 customers already have Good To Go! accounts, growth in the
number accounts is likely to have been realized by converting moderate frequency
users away from Pay By Mail. These customers likely see a benefit to having an
account but may not see the benefit of purchasing a pass to save $0.25 per trip if
they are not daily SR 520 travelers.

SR 520 Bridge Net Toll Revenue Report 2014 Update — January 30, 2015
16 CHANGES TO REVENUE ADJUSTMENTS
o While there has not been a significant increase in the number of fleet (commercial)
accounts, the CSC vendor did report that toll transactions by fleet customers were
up 5 percent in FY 2014. Because the majority of fleet owners, including rental car
agencies, find it more convenient to register license plates than to purchase and
equip every vehicle with a pass, the increase in fleet transactions also contributes to
the increase in Pay By Plate use.
o Analysis by WSDOT also suggests that as existing Good To Go! customers become
more acquainted with how the system works, they are opting to register second or
third vehicles without acquiring transponder passes for them.
Exhibit 12 shows that the share of customers using Pay By Plate is expected to decline from a
peak of 13.5 percent in FY 2015 to slightly less than 9 percent by FY 2025 as more existing
and new account customers acquire transponders, in part due to a requirement for a new
switchable transponder (Flex Pass) in order to receive an HOV exemption on the I‐405
Express Toll Lanes.
Nonetheless, Pay By Plate use is projected to remain significantly higher over the forecast
horizon than projected in October 2013.
EXHIBIT 12: ANNUAL SHARES OF TOTAL TRANSACTIONS BY PAYMENT METHOD (SELECTED FISCAL YEARS)
Pay By Plate fee revenue estimates are provided in column 12 of the Exhibit 26 T&R table provided
in Appendix A, combined with the toll payment discounts described below. Virtually all of the $25.1
Good To Go! Account Transactions
Transponder (Pass) Pay By Plate Total
Oct 2013
Forecast
Nov 2014
Forecast
Oct 2013
Forecast
Nov 2014
Forecast
Oct 2013
Forecast
Nov 2014
Forecast
Oct 2013
Forecast
Nov 2014
Forecast
2012 72.9%* 10.0%* 82.9%* 17.1%*
2013 69.9%* 13.9%* 83.7%* 16.3%*
2014 70.1% 67.7%* 12.1% 16.5%* 82.2% 84.2%* 17.8% 15.8%*
2015 72.7% 71.1% 10.0% 13.5% 82.7% 84.6% 17.3% 15.4%
2016 75.3% 72.1% 7.9% 12.7% 83.1% 84.8% 16.9% 15.2%
2017 76.4% 73.1% 8.0% 11.9% 84.4% 85.1% 15.7% 14.9%
2018 76.9% 74.4% 7.6% 11.1% 84.5% 85.5% 15.5% 14.5%
2019 77.5% 75.5% 7.3% 10.3% 84.8% 85.8% 15.2% 14.2%
2020 78.0% 76.7% 7.0% 9.5% 85.0% 86.2% 15.0% 13.8%
2025 80.6% 78.7% 5.2% 8.7% 85.8% 87.4% 14.2% 12.6%
2030 82.5% 78.9% 3.4% 8.8% 85.9% 87.7% 14.1% 12.3%
2035 82.9% 79.0% 3.0% 8.8% 85.8% 87.7% 14.2% 12.3%
2040 82.9% 79.0% 2.9% 8.8% 85.7% 87.7% 14.3% 12.3%
2045 82.9% 78.9% 2.8% 8.8% 85.6% 87.7% 14.4% 12.3%
2050 82.9% 78.9% 2.7% 8.8% 85.5% 87.7% 14.5% 12.3%
2055 82.9% 78.9% 2.6% 8.8% 85.4% 87.7% 14.6% 12.3%
* Actual va lues for the Good To Go! / Non‐Account Transaction spl i t are ca lculated from CSC data analys is for ca lendar years 2012‐13
and Tol l Bus iness Report data for ca lendar year 2014. Actual va lues for the Good To Go! Transponder and Pay By Plate percentages are
ca lculated us ing 16J‐TRAINS Pay By Plate fee revenue divided by the $0.25 fee to yield the number of transactions .
** Includes short term account transactions where customers ini tiate payment before receiving a bi l l ; represents 0.02% of tota l transactions .
Fiscal
Year
Non‐Account / Pay By
Mail Transactions**

SR 520 Bridge Net Toll Revenue Report 2014 Update — January 30, 2015
CHANGES TO REVENUE ADJUSTMENTS 17
million forecast period increase in the combined toll payment fees and discounts shown in Exhibit 11
is attributed to the increase in Pay By Plate use, with less than $0.1 million resulting from reduced
discounts.
Short-Term Account Discounts
WSDOT offers a $0.50 discount per transaction from the higher Pay By Mail toll rate to non‐account
customers who set up a Short‐Term Account by self‐initiating payment prior to or within 72 hours of
traveling on SR 520. The reason for offering this discount is to incentivize prompt payment, thereby
reducing the number of Pay By Mail transactions and the delay in receiving revenue. The short‐term
account discount is not assumed to escalate with inflation.
The November 2014 forecast of Short‐Term Account discounts has been revised slightly
lower, from $0.23 to $0.17 million over the FY 2015‐56 forecast horizon, thereby increasing
the combined Toll Payment Fees and Discounts forecast by less than $0.1 million.
o The forecast adjustment is attributable to a reduction in overall non‐account
customers in CDM Smith’s traffic projections, combined with a reduction in the
share of non‐account users opting for a Short‐Term Account based on recent
experience.
o The forecast assumes that less than 0.2 percent of non‐account customers are taking
advantage of the Short‐Term Account discount, or about 0.02 percent of total
forecasted transactions.
Annual forecast values for these discounts are part of column 12 of Exhibit 26 in Appendix A.
Other Fees and Discounts
In addition to the fees described above, WSDOT is authorized to charge miscellaneous customer fees
that are not included in the net revenue projections herein, including inactive account and paper
statement/reprinting fees. Revenues from these items are not expected to have a material impact
on net revenues, and are simply intended to offset administration and processing costs incurred by
the state. However, actual revenues from these other fees are shown in column 12 of the T&R table
for FY 2012‐14. These revenues are not included in future year forecasts.
In 2012, WSDOT offered a one‐time incentive program to further encourage local residents and
frequent users to establish a prepaid Good To Go! tolling account. The incentives provided $10
worth of free travel to Good To Go! customers for each pass (transponder) purchased prior to April
15, 2011. This incentive is non‐recurring and the effect of this discount is also captured as actual
costs in column 12 of Exhibit 26 in Appendix A for FY 2012‐13.
Uncollectible Revenue (Columns 13 & 14)
Uncollectible revenue, or “gross” revenue leakage before delinquent toll bill recovery, is divided into
two T&R table categories: Revenue Not Recognized and Unpaid Toll Revenue. Revenue Not
Recognized occurs when a license plate is unreadable, or when the vehicle owner and address from

SR 520 Bridge Net Toll Revenue Report 2014 Update — January 30, 2015
18 CHANGES TO REVENUE ADJUSTMENTS
a readable license plate cannot be identified. Unpaid Toll Revenue results from the non‐payment of
toll bills after two invoices within 80 days of travel. Note that uncollectible revenue effectively gets
reduced to a “net” revenue leakage measure in the overall net revenue projections after accounting
for a small portion of unpaid toll revenue recovered through the civil penalty adjudication from toll
bills more than 80 days past due, as shown in column 19 of Exhibit 26.
Forecasts for uncollectible revenue are based on an activity workflow model which is refined
annually based upon the accumulation of new data. The activity workflow model estimates the
probability that a toll transaction will become uncollectible under a variety of scenarios and points in
the toll transaction workflow process. Exhibit 27 in Appendix B illustrates the toll transaction
workflow and the points in the process where leakage occurs. For the November 2014 forecast, the
average revenue loss per uncollectible transaction has been revised higher to better reflect the
actual mix of intended payment methods among leakage transactions. Other refinements made
since the October 2013 forecast partially offset the above noted change; however, the overall
uncollectible revenue forecasts for the November 2014 forecast are higher than for the October
2013 forecast.
Revenue Not Recognized (Column 13)
Unreadable License Plates
Recent data continues to indicate that the previous forecasts underestimated the ability to obtain
readable license plate images. The assumed share of total image‐based (non‐account plus Good To
Go! Pay By Plate) transactions with readable license plates after manual review has been revised
upward to 95.5 percent in the November 2014 forecast, with the remaining 4.5 percent unreadable.
This change is based on recent data from 2014 which shows that actual unreadable license plates
average 4.1 percent of all image based transactions. Plate readability is expected to improve slightly
when the toll collection equipment is moved to its permanent location once the new bridge is
completed; however, the forecasts do not rely on any further improvement in readability.
Unidentifiable Owner
After a license plate number is read, the system checks to see if the customer has a Good To Go!
account, and if so, the account is debited for the toll. If the plate number is not associated with a
Good To Go! account, then further processing is initiated to obtain a valid owner name and address
for the vehicle from the Department of Licensing (DOL) for in‐state plates. For out‐of‐state plates, a
contracted vendor provides license plate lookup services, with the exception of Iowa and Arizona
plates, which are handled by the Washington State Patrol.
Pay By Mail transactions for which the owner cannot be identified from the license plate are deemed
as revenue not recognized, and include Canadian and all other out of country license plates (Canada
stopped providing vehicle owner information as part of their response to the U.S. Patriot Act in
2001).
The October 2013 forecast assumed that 4 percent of readable license plates would not
yield a valid owner name and address.

SR 520 Bridge Net Toll Revenue Report 2014 Update — January 30, 2015
CHANGES TO REVENUE ADJUSTMENTS 19
The November 2014 forecast has revised this share down to 3.6 percent unidentifiable,
based on actual experience averaging 3 percent.
The above revisions lowering the assumed rates of unreadable license plates and unidentified
owners from readable plates, in combination with minor updates to the activity workflow process,
do not fully offset the aforementioned increase in the average revenue loss per uncollectible
transaction. As a result, revenue not recognized in the November 2014 forecast is projected to be
$5.4 million or 6.1 percent higher than the previous forecast over the FY 2015‐56 forecast horizon,
as shown in Exhibit 11.
The combined revenues not recognized from unreadable plates and from readable plates with
unidentified owners are shown in column 13 of Exhibit 26 in Appendix A.
Unpaid Toll Revenue (Column 14)
Unpaid Toll Revenue is a measure of the Pay By Mail revenue from toll transactions with readable
license plates and identified owner addresses not collected within two billing cycles or 80 days.
The November 2014 forecast maintains the same assumptions as the previous October 2013
forecast, that 75 percent of transactions for which toll bills are mailed to Pay By Mail
customers will be paid on the first or second invoice inside of 80 days.
o This means that 25 percent of transactions for which toll bills are mailed to Pay By
Mail customers will go unpaid after 80 days, contributing to unpaid toll revenue.
o Actual experience continues to corroborate this assumption, with unpaid toll bills
ranging between 20 and 25 percent of those mailed.
With no change in the rate of toll bill non‐payment, the aforementioned refinements to the
average revenue loss per uncollectible transaction accounts for the $24 million or 12.5
percent increase in unpaid toll revenue over the forecast horizon, as shown in Exhibit 11.
Upon non‐payment of the two invoices, a notice of civil penalty is sent to the customer and the
unpaid revenue is considered uncollectible, as projected in column 14 of Exhibit 26. The small
portion of unpaid toll revenue anticipated to be subsequently recovered through the civil penalty
adjudication process is described in “Recovered Toll Revenues (column 19)” below.
Overall Changes in Uncollectible Revenue (Columns 13 & 14)
Overall uncollectible revenue is slightly more than 10 percent higher in the current November 2014
forecast than projected in the October 2013 forecast. About 82 percent of the $29.5 million increase
over the forecast horizon comes from higher estimated unpaid toll revenues, with the remainder
coming from higher revenue not recognized

SR 520 Bridge Net Toll Revenue Report 2014 Update — January 30, 2015
20 CHANGES TO REVENUE ADJUSTMENTS
Miscellaneous Pledged Revenues (Column 16)
Column 16 of the November 2014 forecast T&R table in Appendix
A provides actual “Miscellaneous Pledged Revenues” received in
FYs 2012‐14. Miscellaneous pledged revenues include operating
account interest earnings, liquidated damages, and cash over and
short. While these revenues are not forecasted, actual receipts
are considered revenues pledged towards debt service in the
Master Bond Resolution number 1117 governing SR 520 toll
revenues.
Transponder Sales Revenue (Column 17)
WSDOT purchases, retains, and sells Good To Go! transponders directly to customers and through
third‐party retailers and walk‐in centers. Future transponder sales revenues are assumed to equal
transponder purchase and inventory costs in every forecast year.
The November 2014 forecast, like the previous October 2013 forecast, places transponder
sales revenue in column 17, upstream of the “Adjusted Gross Toll Revenue & Fees” subtotal
in column 20, whereas the equally offsetting transponder purchase and inventory costs are
embedded in column 22, “Toll Collection O&M Costs.”
SR 520 is allocated a share of the system‐wide transponder sales revenue (and costs) on a
proportional transaction basis.
o The November 2014 forecast allocates system‐wide transponder revenues across
two additional toll facilities beginning in FY 2018 with the assumed addition of the
SR 99 Tunnel and the I‐405 Express Toll Lanes (actual opening dates are expected to
be sooner than FY 2018). The October 2013 forecast allocated transponder revenues
only among the existing three toll facilities.
The 28 percent reduction (nearly $10 million) in transponder sales revenue over the forecast
horizon, as shown in Exhibit 11, is attributed to the economies of scale from distributing the
revenues across the two additional toll facilities, net of the steady state increase in
transponder sales volumes and change in transponder type mix with the two additional
facilities.
o Note that SR 520 does not share in the revenues or costs expected with the initial
surge in transponder sales during the opening of the two new facilities.
The reduction in transponder sales revenue allocated to SR 520 has an equal offsetting
reduction in toll collection O&M costs, such that these changes have no effect on the net
revenue projections.

SR 520 Bridge Net Toll Revenue Report 2014 Update — January 30, 2015
CHANGES TO REVENUE ADJUSTMENTS 21
Pay By Mail Rebilling Fees (Column 18)
Pay By Mail customers who do not pay their first invoice are subject to a rebilling fee of $5.00 with
the second invoice. The fee is applied on a per invoice basis when an invoice includes any toll
transactions being billed for a second time, and the fee amount does not escalate with inflation.
Rebilling revenue is primarily driven by the forecasted volume of Pay By Mail transactions and
assumed number of transactions per invoice, with secondary effects coming from potential changes
in the rate of payment of first and second toll invoices.
The projections for Pay By Mail rebilling fees include the $5.00 fee per unpaid first invoice that is
successfully collected on the second invoice before 80 days have elapsed plus a portion of the
delinquent rebilling fees on the unpaid second invoices that are later assumed to be recovered from
the civil penalty adjudication process with an assumed six month average lag.
The November 2014 forecast assumptions regarding toll bill payment rates remain
unchanged from October 2013 as follows.
o 46 percent of first toll invoices are assumed to go unpaid, and are thus subject to a
rebilling fee on the second invoice.
o 45 percent of the above unpaid first invoices are assumed to be paid on the second
invoice inside of 80 days from the date of travel, thus contributing to rebilling fee
revenue.
For the November 2014 forecast, the portion of the delinquent rebilling fees assumed to be
recovered after 80 days through the civil penalty adjudication process or subsequent
collection efforts has been increased to 20 percent, up from approximately 7 percent in the
October 2013 forecast.
o This change was made based upon actual data where these fees are being recovered
at rates averaging between 23 and 25 percent.
The November 2014 forecast assumption for number of transactions per mailed invoice was
revised upward to 2.8 from 2.4 in the October 2013 forecast, which all else equal, lowers the
forecasted rebilling fee revenue.
The CDM Smith forecast for Pay By Mail transactions has been revised downward from the
October 2013 forecast levels across the forecast horizon. This also lowers the forecasted
rebilling fee revenue.
Overall, a lower forecast for Pay By Mail transactions, combined with a higher assumption
for the number of transactions per second mailed invoice, more than offsets the effect of
increasing the recovery rate on rebilling fees from delinquent toll bills. The November 2014
forecast for Pay By Mail rebilling fees is $23 million or 21 percent lower over the forecast
horizon, as shown in Exhibit 11.

SR 520 Bridge Net Toll Revenue Report 2014 Update — January 30, 2015
22 CHANGES TO REVENUE ADJUSTMENTS
Annual projections of late payment fees are provided in column 18 of Exhibit 26 in Appendix A, and
the toll bill payment process is illustrated in the transaction workflow diagram as Exhibit 27 in
Appendix B.
Recovered Toll Revenues (Column 19)
Customers who fail to pay their tolls through the regular two invoice / 80‐day billing cycle will
receive a notice of civil penalty (NOCP) equal to $40 for each delinquent toll due. These customers
will have the opportunity to remit payment for tolls and fees, or request a hearing to avoid having
their motor vehicle registration withheld from renewal and/or have the amount due sent to
collections. As with the rebilling fees noted above, the net revenue projections assume that the toll
is recovered from 20 percent of the delinquent toll transactions that go unpaid for 80 days before
becoming NOCP transactions.
The 20 percent delinquent toll bill recovery rate assumed for the November 2014 forecast
represents an increase from the previous October 2013 assumption of about 7 percent.
o This change was made based upon actual data where unpaid tolls are being
recovered at rates averaging between 23 and 25 percent through the civil penalty
adjudication process.
o As with the recovered rebilling fees, delinquent toll bills are assumed to be
recovered with an average lag of six months from the date of travel.
For the November 2014 forecast, recovered toll revenues were projected to increase by
nearly 34 million over the forecast horizon compared to the October 2013 forecast, as
shown in Exhibit 11.
o This is primarily due to the higher, 20 percent recovery rate assumption.
o The aforementioned refinement to the average revenue loss per uncollectible
transaction also increase the average revenue per recovered transaction.
Annual revenue projections for recovered toll revenues are provided in column 19 of Exhibit 26 in
Appendix A. The transaction workflow diagram shown in Exhibit 27 in Appendix B also illustrates the
process by which toll bills go unpaid after two invoices and 80 days.

SR 520 Bridge Net Toll Revenue Report 2014 Update — January 30, 2015
CHANGES TO OPERATING AND MAINTENANCE COSTS 23
CHANGES TO OPERATING AND MAINTENANCE COSTS
This section documents the anticipated uses of Adjusted Gross Revenues Collected, or those
operating expenses that would be paid from toll revenues upstream of debt service. As shown in the
waterfall below, the SR 520 operational expenditures include: credit card fees; toll collection O&M
costs; facility O&M costs; and insurance premiums. Additional details regarding each of these
deductions are provided below, with the annual projections provided in columns 21‐24 of the T&R
table, Exhibit 26 in Appendix A.
Some of the assumptions have been
updated to reflect actual experience for FY
2012 through FY 2014. Changes to these
assumptions are noted in the descriptions
of each cost category below. All costs are in
year of expenditure dollars (YOE $).
WSDOT Toll Division and GTC staff provided
near term (FYs 2015‐21) agency cost values
for consideration.
The IBI Group Inc. was retained by WSDOT
as the “Consulting Engineer.” Master Bond
Resolution number 1117 requires the Consulting Engineer to review and prepare a certificate
regarding the reasonableness of the assumptions and methods underlying the toll collection and
facility O&M, as documented in a consolidated memorandum entitled: 2014 Updated Facility and
Toll Collection O&M and R&R Assumptions and Costs for the SR 520 Bridge Replacement and HOV
Program, dated December 17, 2014. A description of each of the costs reviewed by the Consulting
Engineer is provided below.
Credit Card / Banking Fees (Column 21)
As a convenience to customers and to facilitate electronic toll collection, WSDOT accepts credit and
debit cards for the payment of tolls on SR 520. For Good To Go! pre‐paid accounts, credit card fees
are tied to periodic account replenishment payments rather than individual toll transactions. Since
customers can use any Washington State toll facility with the same Good To Go! account, the total
credit card receipts resulting in bank fees paid by the state are allocated back to the individual toll
facilities based on each facility’s share of system‐wide toll revenues.
Credit card transactions are processed by a third party vendor which charges a set fee for the
service. These banking fees typically involve a fixed amount and a variable component as a
percentage of the transaction amount. For forecasting purposes, the two fee components were
collectively assumed to equate to 2.0 percent of applicable toll revenues in the November 2014
forecast. The October 2013 forecast assumed credit card fees of 2.29 percent of applicable
revenues; however, a reduction was warranted based upon actual experience indicating an effective

SR 520 Bridge Net Toll Revenue Report 2014 Update — January 30, 2015
24 CHANGES TO OPERATING AND MAINTENANCE COSTS
rate of 1.68 percent, with additional margin assumed to account for forthcoming changes to the
rates charged to the state. A recent finding concluded that toll transactions are not eligible to
receive the discounted government rate that was previously applied to credit card transactions.
Throughout the forecast period, it is anticipated that account balance refunds will be requested by a
small share of account‐holders closing out their accounts. An allowance for this is handled by
assuming that credit card fees will also apply to account refunds (assumed to amount to slightly less
than 2 percent of the applicable toll revenues), effectively raising the credit card fee rate to 2.04
percent of applicable toll revenues.
Toll revenues subject to credit card fees include Adjusted Gross Toll Revenue Collected, or the tolls
actually received after adjusting for short‐term account discounts, Good To Go! Pay By Plate fees,
and uncollectible revenue, plus the addition of delinquent toll bills recovered through the civil
penalty adjudication process.
The October 2013 forecast assumed a toll revenue share subject to credit card fees of 80 percent in
FY 2014, increasing by 0.3 percent annually until reaching 85 percent in FY 2031, with no change
thereafter. Based on reported information in FY 2012‐14 it was not apparent that the associated
percentage share of payments was increasing above the 75‐80 percent range, and the assumed 0.3
percent annual growth in the October 2013 forecast was removed in the November 2014 forecast,
resulting in the latter assuming a flat payment rate of 80 percent throughout the forecast horizon.
WSDOT also accepts automated clearing house (ACH) payments directly from a customer bank
account as an alternative means of account replenishment that does not carry the credit card fee.
Some customers have opted for this account replenishment method, which contributes to the
November 2014 forecast’s reduced assumption for the projected increase in the toll and fee revenue
share subject to credit card fees.
In previous forecasts, the banking fees paid by WSDOT associated with SR 520’s share of system‐
wide transponder purchases made with a credit card were included in the credit card fee amounts
shown in column 22 of the Exhibit 26. For the November 2014 forecast, these credit card fee costs
were removed from the credit card fees in column 21 and were instead added to the transponder
purchase and inventory costs, which are a component of the toll collection O&M costs in column 22.
This minor change was made to be consistent with the forecast assumption that projected
transponder sales revenues in column 17 exactly equal transponder purchase and inventory costs.
Exhibit 13 illustrates the projected credit card fees by fiscal year over the forecast horizon for the
two forecasts. Annual expenditure projections for credit card fees can also be found in column 21 of
Exhibit 26 in Appendix A.

SR 520 Bridge Net Toll Revenue Report 2014 Update — January 30, 2015
CHANGES TO OPERATING AND MAINTENANCE COSTS 25
EXHIBIT 13: PROJECTED CREDIT CARD FEES IN YOE $ (FY 2015-56)
Toll Collection Operations and Maintenance (Column 22)
Toll collection O&M expenditures include all administrative and technical functions required for
processing toll transactions and collecting revenue from customers. Beginning with the task of
identifying a transaction on the roadway, to recording the transaction, to ultimately collecting
payment, the toll collection process requires involvement and coordination by various distinct
parties across multiple functions:
WSDOT Toll Division / WSDOT Accounting and Financial Services (State Operations) ;
CSC operations and system software vendor(s);
Roadway Toll System vendor; and
Transponder purchase, inventory, and sales, including the coordination with transponder
pass manufacturers and third party (non‐CSC) resellers.
Costs associated with the operating functions noted above can be found in the Appendix A T&R table
in the toll collection O&M cost column (column 22). As previously mentioned, credit card fees
associated with direct transponder sales to customers using a credit card are now included in the
transponder purchase and inventory costs embedded in column 22.
The comparison table Exhibit 4 provided on page 4 shows an adjusted presentation of the October
2013 forecast values to be consistent with the changed categorization of transponder credit card
fees in the November 2014 forecast.
‐
0.5
1.0
1.5
2.0
2.5
3.0
2015 2019 2023 2027 2031 2035 2039 2043 2047 2051 2055
October 2013 Net Revenue Forecast
November 2014 Net Revenue Forecast
$ millions
Fiscal Year

SR 520 Bridge Net Toll Revenue Report 2014 Update — January 30, 2015
26 CHANGES TO OPERATING AND MAINTENANCE COSTS
Further detail regarding the toll collection cost activities and changes in their cost assumptions are
provided below by subcategory. In addition, the total toll O&M cost annual forecast values are
provided in column 22 of Exhibit 26 in Appendix A.
WSDOT Toll Division / WSDOT Accounting and Financial Services (State Operations)
The Washington State Toll Division currently operates three toll facilities: the SR 520 Bridge; the SR
16 Tacoma Narrows Bridge (TNB); and the SR 167 high occupancy toll lanes, with the I‐405 Express
Toll Lanes and the SR 99 Tunnel opening in the near future. The Toll Division is responsible for
general management, vendor oversight, marketing, information technology (IT), out‐of‐state license
plate lookup costs, and also payment of the printing and postage costs associated with Pay By Mail
transactions.
Normal salary and benefits associated with state full time equivalent employees (FTEs) include
finance and program management, government relations, CSC operations, RTS operations, and
WSDOT Headquarters Accounting and Financial Services (AFS) group support. The costs for these
FTEs are allocated to existing and proposed facilities using two separate methodologies, one for the
near term period (FY 2015‐17) and one for the longer term forecast period (FY 2018‐56). Budget
period FTEs are based on actual experience using the percentage share of time each employee
charges to the toll program, the total of which is then allocated based on each facility’s share of total
transactions. Starting with FY 2018, state FTE assumptions are based on a set 15.5 FTEs attributed to
the existing three toll facilities and an incremental 4 FTEs associated with each of the two new
facilities, SR 99 and I‐405 Express Toll Lanes. In addition to facility‐specific FTEs, the post FY 2017
forecast assumed 12 FTEs for central state operations that are allocated by facility based on
transaction share and include program management (3 FTEs), communications (3 FTEs), and
accounting, audit, and contracting (6 FTEs). In both the near and longer term forecasts, current
salaries and wages are escalated by 2.5 percent per year to account for increases in compensation.
In addition to the above salaries and benefits, the November 2014 forecasts include centralized toll
operation, management, and administrative expenses (strategic direction and planning, additional
government relations, financial compliance and budgeting, traffic and revenue analysis, toll rate
setting, and payroll and human resource management). These additional cost items were previously
excluded as they were assumed to be funded from non‐toll sources. Capital programs for the toll
facilities being constructed paid for these general management and administrative items. However,
as these projects transition to operations, the management and administration costs are now
assumed to be paid by toll revenues, with costs allocated to each individual toll facility based on
transaction levels. Specifically, the November 2014 cost forecast assumptions now include the
allocation of 6.5 FTEs distributed across the tolled facilities based on each facility’s forecasted share
of total system‐wide transactions. Costs for two additional FTEs — the WSDOT Toll Division
Assistant Secretary and executive assistant — are assumed to be paid for from non‐toll funding
sources within the state’s toll program oversight budget. In the future, the Toll Division will
transition these two positions to also be paid from toll revenues.

SR 520 Bridge Net Toll Revenue Report 2014 Update — January 30, 2015
CHANGES TO OPERATING AND MAINTENANCE COSTS 27
Because these collective state operations services are provided on a system‐wide basis, costs are
allocated according to the projected share of total toll transactions for each facility, which varies
slightly year to year due to differences in each facility’s traffic forecasts. SR 520’s share of estimated
system‐wide transactions is calculated based upon CDM Smith’s toll traffic volume forecasts. Both
the October 2013 and November 2014 forecasts allocate system‐wide Toll Division staff and related
costs by each facility’s percentage share of the total number of toll paying transactions.
However, the October 2013 forecast assumed the existing three facilities — SR 520, Tacoma
Narrows Bridge, and SR 167 Express Toll Lanes — were the only operational facilities through the full
forecast period. In contrast, the November 2014 forecasts include the two additional facilities
currently under construction — the northern segment of the I‐405 Express Toll Lanes from Bellevue
to Lynnwood, and the SR 99 Tunnel in downtown Seattle. These two facilities are not assumed in
the cost allocation process until FY 2018, even though the I‐405 Express Toll lanes are scheduled to
open in FY 2016. Inclusion of the two additional facilities in the system‐wide allocation increases the
total number of system‐wide FTEs, but reduces the share of costs allocated to SR 520 from 60
percent before FY 2018 to 38 percent in FY 2018 with the additional facilities.
Absent the addition of new general management and administrative system‐wide costs to be funded
from tolls as noted above, the two new facilities would be expected to yield economies of scale
benefits to the existing three facilities, thereby lowering the dollar amount in addition to the share
overall state / Toll Division O&M costs allocated to SR 520. However the additional general
management and administrative cost items to be paid from tolls and the economies of scale from
sharing system‐wide costs across two additional facilities in FY 2018 have approximately offsetting
cost impacts for SR 520.
Toll collection costs associated with state / Toll Division operations and activities in the November
2014 forecast are provided in Exhibit 14 with escalation assumptions provided in Exhibit 15.

SR 520 Bridge Net Toll Revenue Report 2014 Update — January 30, 2015
28 CHANGES TO OPERATING AND MAINTENANCE COSTS
EXHIBIT 14: STATE OPERATIONS ASSUMPTIONS IN THE NOVEMBER 2014 FORECAST – SR 520 VALUES
Note: FTE = full time equivalent employee
Cost Item Key Assumptions
Salaries & Wages Near term (through FY 2017) ‐ Standard Cost of 13.6 FTEs @ job classifications in
FY 2015 increasing to approximately 34 FTEs by FY 2017 with inclusion of
roadway & structures maintenance (17‐18 FTEs). Centralized general
administration and management costs associated to 6.5 FTEs, previously covered
under the MS program, are assumed to be allocated to the individual tol l
facil ities (3.5 FTEs).
Forecast Period (after FY 2017) ‐ Values based on SR 520s share of set operations
costs for the existing three faci l ities (15.5 FTEs), and centralized state operations
costs (12 FTEs) allocated accross all active facil ities by transaction share.
Benefits 30% of salaries and wages
Personal Services / Consulting Toll operations, technical oversight, and forecasting/certificate consultant
contracts.
Office Supplies / Materials Standard cost of $245 per year, per FTE
Rent $23 per square foot per year, assumes 153 square feet per FTE in forecast years.
Printing and Postage Cost of $0.57 per mailing in FY 2014 (includes cost of $0.03 per envelope,
printing costs of $0.084 first page + $0.025 additional pages, assuming 2.8
sheets per mail ing, bulk postage rate of $0.402 per mailing. Consumable and
other mailing costs were added to the current forecast estimates to account for
mail ings not associated with toll bil ls. Similar cost per mail ing of $0.57
assumed with an additional cost of $0.02 per mail ing for consumables. Total
costs are based on sending 0.007 mailings per total annual toll transactions.
Out of State License Plate Lookup Cost Assumes that 10.5% of readable l icense plates with valid registration and owner
information will require an out of state l icense plate lookup at a fixed cost of
$1.25 per plate inquiry (mailed invoice). The assumption is revised to a lower
rate of $0.75 per plate plus inflationary escalation starting in FY 2019 in
conjunction with assumed CSC vendor re‐procurement. The revised lower value is
stil l conservative in comparison to industry norms of about $0.50 per plate
charge incurred by other tol l agencies for similar services.
Additional l icense plate vehicle owner address lookup costs required for the
states of Arizona (AZ) and Iowa (IA) have been included in the 2014 forecast to
account for Washington State Patrol (WSP) inquiry costs for these two states,
since they do not provide ownership name and address information to for resale
by third party vendors, therefore requiring direct contact by WSP. The cost of
WSP services is projected to be $63,000 in FY 2014, escalating by the growth in
forecasted Pay By Mail transactions with readable l icense plate in future years.
Computers and Equipment Standard cost of $5,000 per year, per FTE, in addition to facil ity specific
equipment costs.
Phone and Communications Standard cost of $511 per year, per FTE
Vehicles Operations Cost for the operations and maintenance of 2 vehicles of approximately $14,000
per year.
Record Retention Includes WSDOT time to copy, catalog, and prepare documents for archiving,
coordination with staff to get fi les, organization of fi les once received, paper and
organizational supplies, etc. Standard cost of approximately $14,000 per year.
Miscellaneous Goods and Services Other goods/services costs incurred from SR 520 operations.
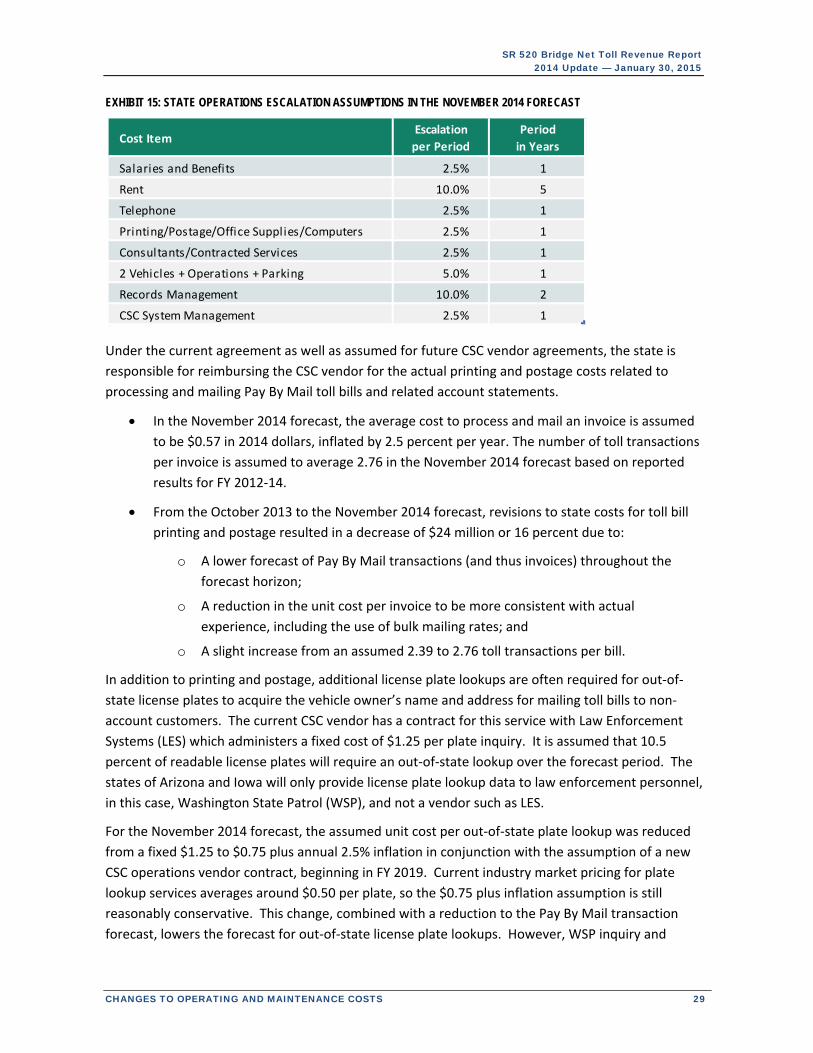
SR 520 Bridge Net Toll Revenue Report 2014 Update — January 30, 2015
CHANGES TO OPERATING AND MAINTENANCE COSTS 29
EXHIBIT 15: STATE OPERATIONS ESCALATION ASSUMPTIONS IN THE NOVEMBER 2014 FORECAST
Under the current agreement as well as assumed for future CSC vendor agreements, the state is
responsible for reimbursing the CSC vendor for the actual printing and postage costs related to
processing and mailing Pay By Mail toll bills and related account statements.
In the November 2014 forecast, the average cost to process and mail an invoice is assumed
to be $0.57 in 2014 dollars, inflated by 2.5 percent per year. The number of toll transactions
per invoice is assumed to average 2.76 in the November 2014 forecast based on reported
results for FY 2012‐14.
From the October 2013 to the November 2014 forecast, revisions to state costs for toll bill
printing and postage resulted in a decrease of $24 million or 16 percent due to:
o A lower forecast of Pay By Mail transactions (and thus invoices) throughout the
forecast horizon;
o A reduction in the unit cost per invoice to be more consistent with actual
experience, including the use of bulk mailing rates; and
o A slight increase from an assumed 2.39 to 2.76 toll transactions per bill.
In addition to printing and postage, additional license plate lookups are often required for out‐of‐
state license plates to acquire the vehicle owner’s name and address for mailing toll bills to non‐
account customers. The current CSC vendor has a contract for this service with Law Enforcement
Systems (LES) which administers a fixed cost of $1.25 per plate inquiry. It is assumed that 10.5
percent of readable license plates will require an out‐of‐state lookup over the forecast period. The
states of Arizona and Iowa will only provide license plate lookup data to law enforcement personnel,
in this case, Washington State Patrol (WSP), and not a vendor such as LES.
For the November 2014 forecast, the assumed unit cost per out‐of‐state plate lookup was reduced
from a fixed $1.25 to $0.75 plus annual 2.5% inflation in conjunction with the assumption of a new
CSC operations vendor contract, beginning in FY 2019. Current industry market pricing for plate
lookup services averages around $0.50 per plate, so the $0.75 plus inflation assumption is still
reasonably conservative. This change, combined with a reduction to the Pay By Mail transaction
forecast, lowers the forecast for out‐of‐state license plate lookups. However, WSP inquiry and
Cost ItemEscalation
per Period
Period
in Years
Salaries and Benefits 2.5% 1
Rent 10.0% 5
Telephone 2.5% 1
Printing/Postage/Office Supplies/Computers 2.5% 1
Consultants/Contracted Services 2.5% 1
2 Vehicles + Operations + Parking 5.0% 1
Records Management 10.0% 2
CSC System Management 2.5% 1

SR 520 Bridge Net Toll Revenue Report 2014 Update — January 30, 2015
30 CHANGES TO OPERATING AND MAINTENANCE COSTS
coordination in Arizona and Iowa plate lookups cost $63,000 in FY 2014, higher than anticipated.
The November 2014 forecast maintains this higher value with inflationary escalation in the forecast
period, which tends to offset most of the other factors lowering costs. Overall, license plate lookup
costs are $0.8 million or 7 percent lower over the forecast horizon, compared to the October 2013
forecast.
Excluding printing and postage and license plate lookup costs, state operations costs increased by
$37 million or 22 percent over the forecast horizon from the October 2013 to November 2014
forecasts. The changes in the November 2014 forecast are primarily due to the aforementioned
inclusion of additional FTEs and associated costs related to centralized general administration and
management costs.
State toll collection costs are included as part of column 22 in Exhibit 26 within Appendix A.
Customer Service Center
Customer service center vendor contract costs have been forecasted for both the CSC software
systems and operations components, and these system‐wide costs are allocated to SR 520 based on
its share of total transactions. The CSC is responsible for processing toll transactions, collecting toll
revenue, maintaining customer accounts, and interfacing with customers via telephone and at Good
To Go! walk‐in centers. Currently, the CSC vendor, Electronic Transaction Consultants Corporation
(ETCC), is responsible for providing the system that processes toll transactions for payment and
providing customer service center operations. ETCC’s contract expired at the end of FY 2014 but was
renewed through FY 2016, with an additional contract extension assumed through the end of FY
2018. The previous October 2013 forecast assumed the ETCC contract would not be renewed after
the contract expiration in FY 2014. In both the current and previous forecasts, once the existing
contract expires, subsequent years’ CSC cost forecast values are based on a new, higher projection
employing a bottom‐up system‐wide estimate at current market rates to provide the various CSC
systems software and operating functions, consistent with having separate vendors for these
functions, plus the addition of a five percent risk contingency.
In addition to the assumed extension of the current ETCC contract through FY 2018, the November
2014 forecast also differs from the October 2013 forecast as a result of adjustments to the system
CSC cost allocation methodology. Previous cost allocation formulas assumed that the TNB would
become an all electronic facility by the time that a new CSC vendor contract was procured, phasing
out the cash payment option. The November 2014 forecast assumes a more conservative approach
in which TNB will continue to have a cash payment option, and that cash transactions previously
assumed to be electronic would now be excluded from the allocation of CSC vendor contract costs.
Absent the addition of the two new facilities in FY 2018, this change in assumption results in slightly
lower total CSC costs, but increases costs for SR 520 since SR 520 becomes a larger share, and TNB a
smaller share, of remaining total electronic (non‐cash) toll transactions. Over the forecast horizon,
the shares of TNB and SR 520 electronic toll transactions increase from an average 36 and 61
percent, respectively, to an average 30 and 67 percent, respectively, under the revised assumption

SR 520 Bridge Net Toll Revenue Report 2014 Update — January 30, 2015
CHANGES TO OPERATING AND MAINTENANCE COSTS 31
that TNB does not transition to a cashless, all electronic toll (AET) collection system. If at a future
point TNB were to go cashless, the CSC costs for all of the other toll facilities would decrease slightly.
As previously noted, the November 2014 forecast assumes that the legislatively approved Bellevue
to Lynnwood section of the I‐405 Express Toll Lanes and the SR 99 Tunnel, both under construction,
are included in the allocation of system‐wide costs, including CSC vendor costs, starting in FY 2018.
The inclusion of the two additional facilities increases total system costs but reduces the allocated
cost per transaction to each facility, primarily through the allocation of fixed costs over an increased
number of toll paying transactions. The addition of SR 99 and I‐405 in FY 2018 reduces the cost per
transaction by an average of 8.7 percent over the forecast horizon compared to the October 2013
forecast.
The revised November 2014 CSC vendor contract cost projections are $2.8 million lower through FY
2018 than the October 2013 forecast as a result of the favorable pricing under the existing vendor
contract extension. Over the full forecast horizon, CSC vendor contract costs are forecasted to be
$31 million or 7 percent lower, primarily due to the economies of scale from the addition of the I‐
405 Express Toll Lanes and the SR 99 Tunnel.
Exhibit 16 illustrates the forecast horizon CSC costs for the November 2014 and October 2013
forecasts. CSC costs are included as part of the toll collection costs in column 22 of Exhibit 26 in
Appendix A.
EXHIBIT 16: SR 520 SHARE OF CSC COST PROJECTION IN YOE $ (FY 2015-56)
‐
2
4
6
8
10
12
14
16
18
20
2015 2019 2023 2027 2031 2035 2039 2043 2047 2051 2055
October 2013 Net Revenue Forecast
November 2014 Net Revenue Forecast
$ millions $ millions $ millions $ millions
Fiscal Year

SR 520 Bridge Net Toll Revenue Report 2014 Update — January 30, 2015
32 CHANGES TO OPERATING AND MAINTENANCE COSTS
Roadway Toll Systems
Roadway Toll Systems (RTS) include all equipment and software required to identify a toll
transaction and transmit data about that transaction to the customer service center for processing.
Sometimes referred to as “lane systems,” this equipment includes transponder readers, cameras,
and other communication devices that need regular maintenance to ensure the system is
functioning properly.
RTS operations and maintenance activities are performed by a private contractor, Schneider Electric
(formerly known as Telvent at the time of contracting), in conjunction with WSDOT maintenance
staff. The vendor contract specifies that Schneider Electric will provide ongoing maintenance of the
toll collection equipment through the contract period. There are actually two contracts, an SR 520‐
specific contract until the permanent toll collection system is installed on the new bridge, and a 10‐
year system‐wide RTS contract. WSDOT will perform any necessary maintenance to equipment
gantries or other roadside equipment. After the RTS system‐wide vendor contract expires, the state
will have the option to re‐bid the contract or assume responsibility for all RTS maintenance
functions. Examples of these duties include:
Realigning / recalibrating cameras and transponder readers;
Cleaning camera lenses;
Maintaining equipment data connections; and
Monitoring / auditing equipment performance.
Because tolling of the existing bridge will only be in place until completion of the new facility, RTS
equipment will need to be installed before the traffic switches over to the replacement bridge in FY
2015. All costs associated with this transition are included in the projected RTS vendor costs.
For the November 2014 forecast, RTS costs have been revised upward by $7 million or 21 percent
over the full forecast horizon compared to the October 2013 forecast. The revision in the November
2014 forecast reflects changes in two areas:
WSDOT and Consultant Provided Services
o The October 2013 forecast estimates included internet service provider (ISP) costs,
refined system enhancement costs, and refined emergency response costs, inclusive
of 2.5 percent annual escalation for inflation.
o For the November 2014 forecast, these 2013 cost estimates remain unchanged;
however, additional, new cost items have been included for network equipment
replacement, spare parts replacement, Northwest Region Traffic Management
Center (TMC) services, and Northwest Region Signals Shop services. These
additional costs include parts and materials in addition to WSDOT staff time.
Vendor Provided Services
o The October 2013 forecast estimates were based on toll systems vendor contract
pricing for FY 2014‐2026 for routine annual operations, maintenance, and annual
performance testing.

SR 520 Bridge Net Toll Revenue Report 2014 Update — January 30, 2015
CHANGES TO OPERATING AND MAINTENANCE COSTS 33
o For the November 2014 forecast, the previous estimates were revised to account for
a delay in the installation of the temporary toll collection point, which prolongs the
existing SR 520‐only vendor contract and, thus, delays the permanent toll collection
system implementation.
o The November 2014 RTS O&M cost forecast also includes network equipment
vendor costs and an allocated portion of the costs associated with minor system
enhancements and emergency response that were not included in the October 2013
forecast.
The RTS cost projections are also included within the annual toll collection costs in column 22 of the
Exhibit 26 T&R table. In addition to routine maintenance, periodic capital rehabilitation and
replacement of RTS / tolling equipment will be required. These costs are detailed in a later section.
Exhibit 17: ROADWAY TOLL SYSTEMS O&M COSTS IN YOE $ (FY 2015-56)
Transponder Sales and Inventory Costs
WSDOT purchases, retains, and sells Good To Go! transponders directly to customers via online/mail
orders, at CSC walk‐in locations, and through third‐party retailers. Transponder sales revenues are
expected to directly offset all transponder purchase and inventory costs in every forecast year. This
includes any credit card fees associated with WSDOT direct sales not involving a third party retailer.
‐
0.2
0.4
0.6
0.8
1.0
1.2
1.4
1.6
1.8
2015 2019 2023 2027 2031 2035 2039 2043 2047 2051 2055
October 2013 Net Revenue Forecast
November 2014 Net Revenue Forecast
$ millions $ millions
Fiscal Year

SR 520 Bridge Net Toll Revenue Report 2014 Update — January 30, 2015
34 CHANGES TO OPERATING AND MAINTENANCE COSTS
Transponder purchase and inventory costs, as well as associated revenues, are tallied at a system
level and allocated to the individual facilities based on the number of Good To Go! account
transponder transactions generated by each facility. Forecasted transponder sales volume amounts
assume the availability new Flex Pass transponders (declarable tags), which will allow users to switch
the transponder to HOV exemption status for use on the I‐405 and SR 167 Express Toll Lane facilities.
Incentives may be offered for Flex Pass transponder purchases and these transponders will be valid
in the non‐carpool setting on all existing facilities. The transponder inventory purchase cost and
offsetting sales revenue forecasts assume that the higher priced Flex Pass transponders will increase
the weighted‐average unit cost of all transponders sold, and thus, the SR 520 share of those costs
(Flex Passes will be purchased by some existing SR 520 users who may occasionally want to use an
express toll lane facility as an exempt carpool). As such it is anticipated that as vehicles (or
windshields) are replaced, or vehicle titles transferred, that some of the existing sticker tag
transponders will be replaced with the declarable transponders.
However, the additional surge in transponders sold during the first year ramp‐up periods for the I‐
405 Express Toll Lane and SR 99 Tunnel facilities are assumed to be purchased by users of the new
facilities. These first year incremental costs are directly charged to these new facilities, and are thus
excluded from the system‐wide cost allocation until the second year of each facility’s operations.
This means that the estimated SR 520 share of transponder demand volumes, purchase and
inventory costs, and associated sales revenues are estimated in such a way as to hold SR 520
“harmless” from the initial surge in transponder inventory purchases attributed specifically to the
addition of I‐405 and SR 99, in a manner consistent with how those costs are expected to be
allocated after the fact.
While all other system‐wide costs that are allocated to the individual facilities do not include the
economies of scale from adding I‐405 and SR 99 until FY 2018, the projected SR 520 transponder
costs do reflect the higher average unit price and the post ramp‐up share of transponder volumes
based upon currently anticipated schedules. This has transponder sales for the I‐405 Express Toll
Lanes commencing in late FY 2015, with the facility opening in early FY 2016. As previously noted,
transponders sold prior to FY 2017 that are attributed specifically to I‐405 users have been excluded
from the costs allocated to SR 520; however, the high average unit price in the costs allocated to SR
520 reflects the assumption that users of all existing facilities, including SR 520, will also begin to
purchase Flex Pass transponders as early as late FY 2015. Similar assumptions are applied for the
sales of transponders that are attributed to SR 99 users in late FY 2017 and during the first year of SR
99 operations in FY 2018 to exclude these costs from being allocated to all facilities. As such, FY
2019 represents the first year when all system‐wide transponder purchase and inventory costs and
associated offsetting sales revenue are allocated across all five then active facilities.
Total transponder costs and associated packaging, mailing, inventory management, CSC processing,
and contingency range from $2.11 for a sticker tag sold through a retail partner to $15.26 for a Flex
Pass sold through a CSC location. The weighted‐average transponder unit retail price is forecast to
be $6.36 as of FY 2016, when including the various transponder types and sales channels. After FY
2016 costs, related to packaging, mailing, and inventory management are assumed to escalate by 2.5

SR 520 Bridge Net Toll Revenue Report 2014 Update — January 30, 2015
CHANGES TO OPERATING AND MAINTENANCE COSTS 35
percent per year, consistent with other cost escalation assumptions. The portion of the retail price
that represents the weighted‐average unit cost from the manufacturer is assumed to increase by 1.0
percent per year to account for an anticipated gradual increase in the number of higher price Flex
Pass purchases as a share of total sales going forward. This will raise the weighted‐average unit
selling price for a mix of hardware, for which the cost of each individual transponder type has
typically remained flat or decreased over time, rather than increasing with general inflation. The
declining real cost of transponder technology is the result of improvements in technology and
reductions in production costs as the volume of production increases with the growth in toll facilities
nationally and worldwide.
As transponder sales revenues are expected to exactly offset transponder purchase and inventory
costs, net transponder revenues are expected to be zero in both cases, with no impact on net toll
revenues.
Compared to the October 2013 forecast, transponder sales projections in the November 2014
forecast have been revised upwards in FY 2015 due to revised Toll Division projections for Flex Pass
transponders sales associated with the opening events for I‐405, and downwards in all subsequent
years of the forecast horizon due to the reduced SR 520 share of total system‐wide transponder
costs with the addition of I‐405 and SR 99. The previous October 2013 forecast assumed a set
number of transponders sold in FY 2014 and FY 2015 based on historical values which were
escalated by 2.5 percent per year going forward without consideration of new facilities or a changing
mix of transponder types sold at different prices. Specifically, the previous weighted‐average unit
price did not include the higher Flex Pass transponders, which have been taken into consideration in
the revised November 2014 forecast. The November 2014 forecast values also assume growth in
transponder sales based on growth in projected transponder transactions in addition selectively
applied inflation, as opposed to a simple annual growth rate used in the October 2013 forecast;
however, SR 520 net costs are lower after FY 2018 as transponder purchase and inventory costs are
shared among I‐405 and SR 99 in addition to the three existing facilities.
The October 2013 forecast for transponder costs did not include credit card fees, which were
captured with the credit card fees on tolls instead. The October 2013 forecast also assumed a higher
credit card payment rate of 85 percent and higher per transaction fees of 2.29 percent. For
November 2014, the credit card fee rate has been reduced to 2.0 percent to match the revised
assumption applied to toll revenues collected from credit cards. Recognizing that transponder sales
are roughly equally split between WSDOT CSC locations (including online) and third party retailers
(such as Safeway stores), the share of transponder revenues subject to credit card fees by WSDOT
has been revised downward to 50 percent to include only WSDOT direct sales at a CSC location or
online. Third party retailers absorb any credit card fees in their markup from the wholesale to retail
sales prices.
The transponder sales and inventory costs are also included within the toll collection costs shown in
column 22 of the Exhibit 26 T&R table, in an amount that directly offsets the transponder sales
revenue forecast provided in column 17 over the forecast horizon.

SR 520 Bridge Net Toll Revenue Report 2014 Update — January 30, 2015
36 CHANGES TO OPERATING AND MAINTENANCE COSTS
EXHIBIT 18: TRANSPONDER SALES AND INVENTORY COSTS IN YOE $ (FY 2015-56)
Routine Facility Operations and Maintenance (Column 23)
Routine operation and maintenance of the SR 520 physical assets are critical to providing
continuous, uninterrupted toll revenue generation. Proper maintenance of the facility also ensures
that the expected level of service is provided to motorists. Typically, facility O&M activities include
lane restriping, lighting maintenance, routine bridge repairs, pothole and pavement repair, traffic
operations, signage, litter pickup, etc. These activities help to preserve safety and travel reliability
along the corridor. A more detailed list of facility maintenance activities is provided in Appendix C as
Exhibit 28.
All O&M costs are provided in year of expenditure dollars, with no change to the previous
assumption for annual escalation at 2.5 percent.
After the selection of a preferred design alternative in 2010, WSDOT established a Maintenance Task
Force (MTF) of engineering, maintenance, and design staff to conduct a full review the Program’s
projected facility O&M costs. The findings from this initial MTF were the basis for the September
2011 forecast. Since the September 2011 forecast the MTF has been reconvened on an annual basis.
SR 520 Maintenance Task Force
In the summer of 2014, the WSDOT SR 520 Project Team—in collaboration with the WSDOT Toll
Division and Northwest Region maintenance staff—reconvened the facility MTF to review, revise,
prepare, and report updated facility O&M cost estimates. The task force findings refined the
previous estimates by using the latest design and construction information from the funded
construction segments along the SR 520 corridor. The revised O&M (and R&R) cost estimates from
‐
0.2
0.4
0.6
0.8
1.0
1.2
1.4
2015 2019 2023 2027 2031 2035 2039 2043 2047 2051 2055
October 2013 Net Revenue Forecast
November 2014 Net Revenue Forecast
$ millions $ millions
Fiscal Year

SR 520 Bridge Net Toll Revenue Report 2014 Update — January 30, 2015
CHANGES TO OPERATING AND MAINTENANCE COSTS 37
the facility MTF are documented in the consolidated memorandum entitled 2014 Updated Facility
and Toll Collection O&M and R&R Assumptions and Costs for the SR 520 Bridge Replacement and
HOV Program, dated December 17, 2014.
The scope of the funded project elements for which toll revenues would pay facility O&M costs
increased for the November 2014 forecast by $34.3 million over the FY 2015‐2056 forecast period.
The largest single increase in O&M costs resulted from a revised methodology for estimating under‐
lid lighting and power costs which accounted for $32.7 million of the change in O&M costs over the
October 2013 forecast. The October 2013 forecast for under‐lid lighting and power costs used pro‐
rated historical data based on I‐90 Tunnel lighting in Seattle. This tunnel is significantly longer than
the three SR 520 Eastside lids. Standard tunnel lighting practice requires high lighting levels at the
two portals, tapering to lower lighting levels in the middle sections, which allows time for drivers’
eyes to adjust to lower levels. As a result, a longer tunnel reduces the overall average energy cost
per unit length. The shorter lengths of the three SR 520 lids require the high lighting levels at their
portals but are insufficient in length to allow for lower lighting levels in the middle. The November
2014 revisions have resulted in a higher energy cost per unit length of lid.
For the November 2014 forecasts, the SR 520 Program obtained or prepared three estimates for
under‐lid power costs based on the specific lighting requirements from: WSDOT NW Region, SR 520
Program, and Puget Sound Energy. All of these estimates were similar with the average power cost
for the three lids on the Eastside totaling $449,000 per year before adjustments for inflation. For
the November 2014 forecast, the revised energy consumption estimates also accounted for power
consumption costs associated with the permanent toll infrastructure. These costs are very small, at
less than $10,000 per year, in comparison to other increases. Toll infrastructure power costs are
included with the roadway lighting as facility O&M costs since they will be drawn from the same
sources and billed to the same account.
The West Approach Bridge North Project plans, specifications, and estimates for construction were
completed subsequent to the October 2013 forecast for facility O&M and R&R costs. In order to
capture the completed design in the November 2014 forecast, the SR 520 MTF revisited and refined
the quantities accordingly. Refinements to the cost estimates increased the quantity of items
required, thereby increasing O&M costs by a total of $2.2 million over the forecast horizon.
The SR 520 MTF also re‐evaluated the level of routine inspection that would be required for the new
floating bridge, maintenance facility and dock. Inspection of the maintenance facility generator,
elevators, and dock are new items in the November 2014 forecast. The cost of inspecting these
items is not included in the cost of inspecting equipment and systems within the new bridge
maintenance facility. The new inspection items, which typically fall under Program D, are an additive
cost, resulting in an increase of $0.9 million over the forecast horizon.
The Maintenance Accountability Process (MAP) cost increased more than anticipated and accounted
for $0.7 million of the O&M cost difference over the October 2013 forecast. For the current 2013‐
2015 biennium budget, the Service Level Commitment and System Addition level of service (LOS)

SR 520 Bridge Net Toll Revenue Report 2014 Update — January 30, 2015
38 CHANGES TO OPERATING AND MAINTENANCE COSTS
remained relatively high in comparison to the Area 5 2013 MAP Attainment, requiring more
maintenance money to “catch up” to the service level commitment established by the Washington
State Legislature.
Annual facility O&M cost projections are provided in column 23 of Exhibit 26 in Appendix A.
EXHIBIT 19: PROJECTED FACILITY O&M COSTS FOR THE $2.90 BILLION PROGRAM IN YOE $ (FY 2015-56)
Bridge Insurance (Column 24)
Bridge insurance premium quotes are provided by the Department of Enterprise Services Office of
Risk Management (DES/ORM) with annual coverage commencing on July 1 of each year. The current
FY 2015 pre‐completion premium forecast estimates were based on WSDOT’s discussions with
DES/ORM and the State’s broker, augmented with the initial three years of premium experience for
the SR 520 corridor. Coverage includes business interruption insurance for up to one year with no
deductible, as well as coverage for property damage losses caused by forces of nature, component
failure, or acts of terrorism. In the case of an earthquake there is a $100 million sublimit on damage.
Current insurance coverage during corridor construction includes property damage on the west
approach, Portage Bay bridge structures, east approach, the floating bridge, and business
interruption coverage for the total insured value of $679 million with a $400 million all risk limit. FY
2016’s pre‐completion premium is based on the FY 2015 value with a growth factor tied to the
projected increase in gross toll revenues.
‐
1
2
3
4
5
6
7
8
9
2015 2019 2023 2027 2031 2035 2039 2043 2047 2051 2055
October 2013 Net Revenue Forecast
November 2014 Net Revenue Forecast
$ millions $ millions
Fiscal Year

SR 520 Bridge Net Toll Revenue Report 2014 Update — January 30, 2015
CHANGES TO OPERATING AND MAINTENANCE COSTS 39
Post‐completion coverage from FY 2017 forward is assumed to include business interruption as well
as property damage on all SR 520 bridges and structures between I‐5 and I‐405. As it is still too early
to obtain a detailed premium estimate for the post‐completion conditions, the post‐completion
values are placeholder estimates prepared by WSDOT with input from risk management staff, and
are assumed to be inclusive of any brokerage fees.
Current and future insurance policies cover various risks, including earthquake, flood, and boiler and
machinery failure, as well as sub‐limits on coverage for increased cost of construction, course of
construction, business interruption, service interruption, and terrorism. Forecasted premiums are
also assumed to include SR 520’s share of brokerage fees to obtain insurance policies covering other
facilities and assets. SR 520’s share of the total state brokerage fee in FY 2015 is 42.2 percent, based
on SR 520’s premium as a percentage share of the total state premiums paid in FY 2014, and may be
subject to change when all FY 2015 premiums have been tabulated for allocation of brokerage costs.
Bridge insurance premiums are forecasted to increase at the rate of annual growth in gross toll
revenue potential as provided in the investment grade traffic and revenue forecast, since that is a
measure of the revenue that would need to be replaced by business interruption insurance. Future
post‐completion annual premium growth rates range from a high of 2.3 percent in FY 2032 to a low
of 0.5 percent in FY 2045.
The November 2014 premium estimates for the pre‐completion period were revised downwards
from the 2013 values based on reduced premium pricing provided by the insurance underwriter,
though the decreases were partially offset by the addition of brokerage fees to the costs, which
were excluded from the previous estimates. The 2013 insurance premium forecasts held the FY
2015 rate of $2.75 million constant through FY 2021, thereafter increasing it by the growth in gross
toll revenues. In the 2014 update, FY 2015 insurance costs were revised downward by $528,000 or
slightly more than 19 percent to align with the quoted new premium from the insurance
underwriter, and escalated for FY 2016 by the rate of growth in gross toll revenues. No changes
were made to the post‐completion insurance premium estimates through FY 2023, as no additional
information was available to justify revisions to the immediate post‐completion values. In the outer
years of the forecast, post FY 2023, insurance costs are adjusted based on the rate of growth in
projected gross toll revenue potential as provided in the November 2014 investment‐grade forecast.
The updated revenue forecast results in insurance costs that are $0.5 million or 0.4 percent higher
over the full forecast horizon.
Annual insurance premium forecasts are provided in column 24 of Exhibit 26 in Appendix A.
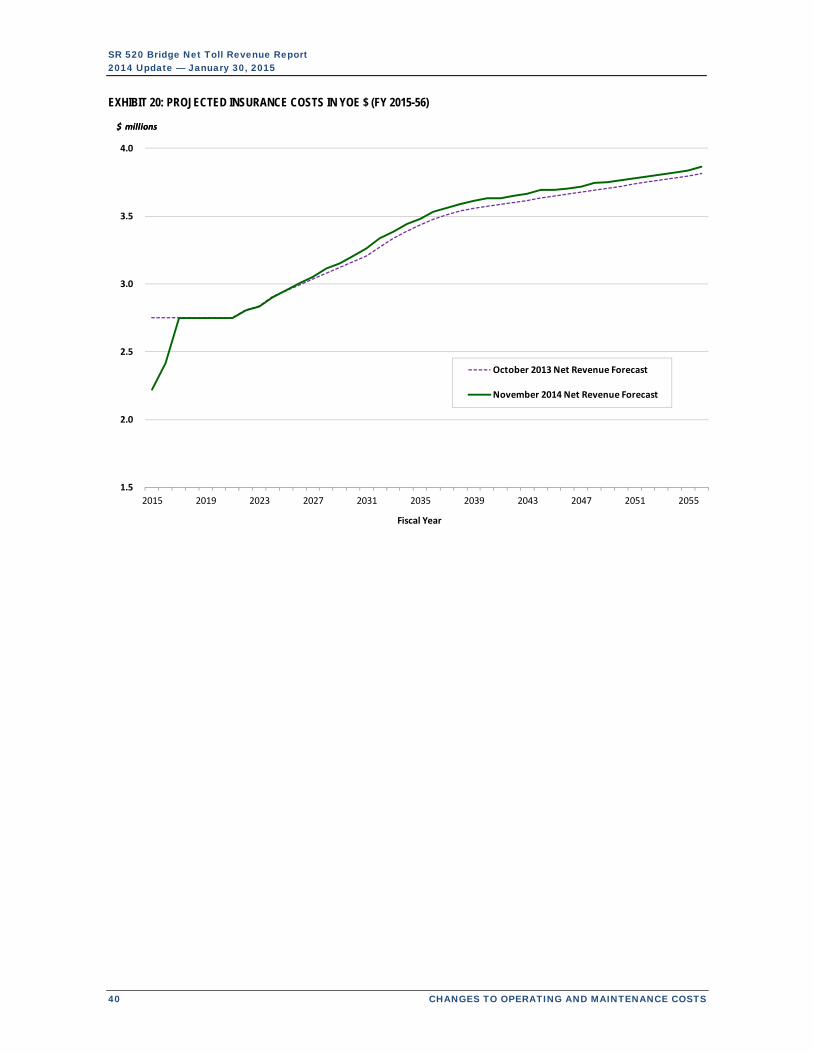
SR 520 Bridge Net Toll Revenue Report 2014 Update — January 30, 2015
40 CHANGES TO OPERATING AND MAINTENANCE COSTS
EXHIBIT 20: PROJECTED INSURANCE COSTS IN YOE $ (FY 2015-56)
1.5
2.0
2.5
3.0
3.5
4.0
2015 2019 2023 2027 2031 2035 2039 2043 2047 2051 2055
October 2013 Net Revenue Forecast
November 2014 Net Revenue Forecast
$ millions $ millions
Fiscal Year

SR 520 Bridge Net Toll Revenue Report 2014 Update — January 30, 2015
CHANGES TO OTHER PROJECT USES OF TOLL REVENUES 41
CHANGES TO OTHER PROJECT USES OF TOLL REVENUES
Total Net Revenue Before R&R (Column 25)
Starting with CDM Smith’s Gross Toll Revenue
Potential in the T&R table column 11, the
addition and subtraction of the various revenue
adjustments in columns 12‐19 and the O&M
expenditures in columns 21‐24 results in the total
net revenue available to support financing and
other project uses. The annual net revenue
projections can be found in column 25 of the T&R
table in Appendix A.
Exhibit 21 illustrates the spreads between the gross and net revenue over the forecast horizon for
the October 2013 and November 2014 forecasts. The differences in the sums of the annual values
over the forecast horizon are shown in Exhibit 11 on page 14.
EXHIBIT 21: PROJECTED GROSS AND NET TOLL REVENUES (FY 2015-56)
‐
20
40
60
80
100
120
140
160
2015 2019 2023 2027 2031 2035 2039 2043 2047 2051 2055
October 2013 Net Revenue Forecast
November 2014 Net Revenue Forecast
Gross Toll Revenue Potential
Net Toll Revenues Before R&R
Fiscal Year
$ millions

SR 520 Bridge Net Toll Revenue Report 2014 Update — January 30, 2015
42 CHANGES TO OTHER PROJECT USES OF TOLL REVENUES
Other downstream uses of net revenues include deferred sales tax, periodic facility R&R, and
periodic toll‐related R&R as shown in the waterfall on the previous page. In accordance with the SR
520 financial plan flow of funds, net revenues before R&R are used to pay debt service first, with
annual reserve account contributions for deferred sales tax and R&R coming downstream from
coverage revenues. Descriptions for these other uses of tolls are provided below.
Deferred Sales Tax on Construction (Column 26)
The 2008 Washington State Legislature, through ESHB 3096 codified as RCW 47.01.412, granted the
SR 520 Program the ability to defer a portion of the state and local sales tax payable on construction
until five years after the replacement bridge is constructed and open to traffic. At this future date,
the sales tax must be paid in 10 equal annual installments. The timing is based upon the expected
completion of the overall $2.90 billion funded program components, which currently puts the first
payment in FY 2022. Toll revenues are assumed to be used to make the 10 annual payments
through fiscal year 2031.
The State is deferring sales tax on almost the entire construction program, with the exception of
sales tax paid in Grays Harbor County that applies to the floating bridge pontoon construction site
development. The November 2014 forecast, shown in column 26 of Exhibit 26, is unchanged from
the October 2013 forecast of $159.4 million over the forecast horizon.
Periodic Facility Repair and Replacement Costs (Column 27)
Master Bond Resolution number 1117 requires that WSDOT’s Consulting Engineer, the IBI Group
Inc., review and prepare a certificate including the reasonableness of the assumptions and methods
underlying the facility R&R costs described below.
Costs associated with periodic facility R&R activities are assumed to be funded in the WSDOT
preservation program (“P program”) using toll revenues and other non‐toll sources. Periodic facility
costs typically involve major capital upgrades and improvements. Major costs include replacement
of anchor cables, replacement of strip seal expansion joints, surface rehabilitation, painting, and
related capital rehabilitation. Cost estimates for periodic R&R are dependent upon several design
characteristics of the facility, including the type of construction materials and structural attributes.
The aforementioned 2014 SR 520 Maintenance Task Force also reviewed and revised the costs for
R&R activities. Similar to O&M costs, R&R projections were prepared by roadway segment and cost
category. A map illustrating the roadway segments in the SR 520 corridor is provided in Exhibit 2 on
page 3.
For the purpose of these projections, it was previously determined that toll revenues would be used
to fund all facility R&R expenditures for the bridge structures within the $2.90 billion funded
program components, for items such as replacement of expansion joints, bridge decking, and anchor
cables. In contrast, WSDOT’s non‐toll funding from the preservation program would be used for the
funded program at‐grade highway section between the floating bridge and I‐405, for items such as
SR 520 Bridge Net Toll Revenue Report 2014 Update — January 30, 2015
CHANGES TO OTHER PROJECT USES OF TOLL REVENUES 43
pavement grinding and resurfacing and roadway lighting. In addition, toll revenues would pay for
the traffic management and data systems R&R costs throughout the SR 520 corridor.
Revisions in the November 2014 forecast are based on results provided by the 2014 SR 520 MTF.
The Task Force’s revised estimates represent a net decrease of 3 percent, or $8.3 million in
the toll‐funded R&R costs over the forecast horizon, bringing the toll‐funded facility R&R
estimate to $262 million (68 percent). Decreases in the toll‐funded R&R cost projections can
be attributed to refinements in the cost estimates for the West Approach Bridge North upon
confirmation of the work contract. Reductions in costs were partially offset by increases
associated with further refinements in bridge inspection cost estimates that are classified as
R&R.
Per the estimates of the SR 520 MTF, non‐toll funding sources are projected to cover the
remaining $122 million (32 percent) of the total facility R&R expenses of $384 million over
the forecast horizon.
Facility R&R costs funded by toll revenues are shown in column 27 of the Exhibit 26 T&R table for the
November 2014 forecast. Annual amounts for all three forecasts are depicted in Exhibit 22 on the
following page.

SR 520 Bridge Net Toll Revenue Report 2014 Update — January 30, 2015
44 CHANGES TO OTHER PROJECT USES OF TOLL REVENUES
EXHIBIT 22: TOLL-FUNDED FACILITY REPAIR AND REPLACEMENT COST ESTIMATES BY FORECAST IN YOE $ (FY 2015-56)
‐
5
10
15
20
25
30
35
40
45
2015 2019 2023 2027 2031 2035 2039 2043 2047 2051 2055
October 2013 Net Revenue Forecast
November 2014 Net Revenue Forecast
$ millions
Fiscal Year
$ millions
Fiscal Year
$ millions

SR 520 Bridge Net Toll Revenue Report 2014 Update — January 30, 2015
CHANGES TO OTHER PROJECT USES OF TOLL REVENUES 45
Toll-Related Repair and Replacement Costs (Column 28)
Toll‐related R&R costs include the periodic repair, rehabilitation, and replacement of the RTS
hardware and equipment. In addition to hardware and equipment, the R&R cost forecast includes
SR 520’s share of the system‐wide administrative and technical‐related costs incurred by WSDOT to
periodically re‐procure both the RTS and CSC vendor contracts as well as implement and test new
systems and hardware.
Additional detail on toll‐related R&R and vendor re‐procurement costs is provided below, and the
annual cost projections in year of expenditure dollars are provided in column 28 of the T&R table in
Appendix A.
Roadway Toll Systems Repair and Replacement Costs
RTS vendor R&R costs include upgrades to, or replacement of, cameras and transponder readers,
networking equipment, and fiber optic communication lines. While it may be possible to get more
than 10 years out of some hardware components and/or for WSDOT to extend the contract for an
established RTS vendor, the cost projections conservatively assume that the RTS vendor and entire
RTS system will be replaced every 10 years. This periodic re‐procurement is next scheduled to
commence in FY 2024, and includes up to one year for procurement of a state‐wide vendor to
provide the entire roadway toll system, followed by implementation and testing of each facility to
allow for a smooth transition to a new vendor and/or new equipment.
Unlike other system costs in the October 2013 forecast, RTS and CSC vendor re‐procurement costs
were the only items distributed across all five facilities, including I‐405 and SR 99 under construction.
In that previous forecast, RTS vendor re‐procurement costs were allocated to each facility based on
their share of total system‐wide transactions. For the November 2014 forecast, this assumption was
revised based on concerns of over‐allocation of primarily fixed costs to express toll lane facilities
with multiple toll points and higher numbers of transactions. The revised forecast assumes an equal
distribution of RTS re‐procurement costs across facilities, with one‐third of the total system‐wide re‐
procurement costs allocated to SR 520 through FY 2017, dropping to one‐fifth or 20 percent in FY
2018 with the inclusion of the I‐405 Express Toll Lanes between Bellevue and Lynnwood and the SR
99 Tunnel.
In addition to revisions to the re‐procurement cost allocation, methodology adjustments were made
to the RTS vendor re‐procurement, implementation and testing schedule cycle to incorporate a per
year advancement over previous estimates. The advancement in the RTS vendor and equipment
replacement cycle for SR 520 was made to align it with the replacement schedule on the other two
existing facilities, since the RTS R&R items are provided system‐wide by one vendor.
Previous network replacement costs included those items within the centralized Dayton facility, and
did not consider associated costs for field equipment replacement. Previous network equipment
costs also excluded annual escalation, as it was assumed that prices would remain constant due to
advancements in technology and productivity. Recent estimates provided for equipment
replacement indicate that costs have increased in line with general inflation, and a more
SR 520 Bridge Net Toll Revenue Report 2014 Update — January 30, 2015
46 CHANGES TO OTHER PROJECT USES OF TOLL REVENUES
conservative approach of including cost escalation was adopted for the 2014 estimates. The
addition of vendor costs and escalation in the November 2014 forecast more than doubled the
network replacement cost estimate provided in the October 2013 forecast.
Overall, the November 2014 RTS R&R cost forecast is lower than estimated in October 2013 forecast
primarily due to the revision in methodology for allocating centralized system‐wide re‐procurement
costs and removal of the last system replacement cycle in FYs 2055‐56. The resulting downward
revisions more than compensated for the increases due to the inclusion of network equipment cost
component costs that were excluded from previous forecasts.
In summary, the November 2014 forecast for RTS R&R items, inclusive of additional cost items and revisions to existing cost estimates and allocation methods, results in a total decrease of 5.3 percent over the forecast horizon in comparison to the October 2013 forecast estimates.
Customer Service Center Repair and Replacement Costs
In addition to costs related to RTS vendor re‐procurement, implementation, and testing, periodic
costs to re‐procure the CSC systems software and operations vendor(s) along with implementation
and testing are included in the toll equipment and CSC R&R cost forecast. System‐wide CSC
vendor(s) re‐procurement costs are allocated across the three existing facilities, plus the I‐405
Express Lanes and the SR 99 Tunnel, which are assumed to be included in the allocation of system‐
wide costs starting in FY 2018. Re‐procurement costs are allocated based on each facility’s
forecasted toll transactions in the years the costs are projected to be incurred. Re‐procurement
costs are estimated in a manner consistent with the possibility that the CSC systems software and
operations functions may be provided by the same or two different vendors.
Both the vendor and WSDOT incur costs associated with procurement, implementation, and testing.
During procurement, WSDOT drafts the RFP document, solicits it to potential bidders, and negotiates
the final contract. During implementation and testing, WSDOT facilitates the transition between
vendors and performs user acceptance testing. The vendor incurs costs associated with
implementation and testing, including data migration, factory acceptance testing, and the drafting of
business plans and standard operating procedures.
Previous cost allocation formulas used in the October 2013 forecast assumed that TNB would
become an all electronic facility by the time that a new CSC vendor contract was procured, phasing
out the cash payment option. The November 2014 forecast now assumes a more conservative
approach in which TNB will continue to have a cash payment option, and that transactions
previously assumed to be electronic and covered under the CSC contract agreement would not be
included. This change in assumption results in slightly lower total CSC costs, but increases costs for
SR 520 since SR 520 becomes a larger share, and TNB a smaller share, of remaining total non‐cash
electronic toll transactions. Over the forecast horizon, the shares of TNB and SR 520 toll transactions
with cash payment eliminated on TNB average 36 and 61 percent, respectively. However, with cash
collection maintained on TNB, the TNB and SR 520 shares of the remaining electronic toll

SR 520 Bridge Net Toll Revenue Report 2014 Update — January 30, 2015
CHANGES TO OTHER PROJECT USES OF TOLL REVENUES 47
transactions average 30 and 67 percent, respectively. If TNB were to transition to a cashless, AET
collection system, SR 520’s share of CSC costs would be expected to decrease.
The October 2013 CSC R&R cost estimates assumed that system‐wide re‐procurement,
implementation and testing costs would be allocated across the three existing facilities plus two
additional facilities: the SR 99 Tunnel (assumed to open in FY 2017) and the northern segment of the
I‐405 Express Toll Lanes between Bellevue and Lynnwood (assumed to open in FY 2016) plus the
southern segment of the I‐405 Express Toll Lanes between Bellevue and Renton and extended SR
167 Express Toll Lanes (previously assumed to be completed in FY 2022). These CSC vendor contract
re‐procurement costs (like the similar RTS re‐procurement costs) were the only shared cost items
distributed across all five existing and forthcoming facilities in the October 2013 forecast, under the
assumption that the procurement of completely new customer service center vendor systems and
operations contract(s) would be required for and contingent upon the significant implementation
and system testing to add new facilities to the system.
The updated November 2014 forecast incorporates the same approach in which the two additional
facilities are assumed to come online this decade; however, the unfunded Renton to Bellevue
segment of I‐405 and associated SR 167 improvements are not included in the forecast, and the
Bellevue to Lynnwood segment of I‐405 and SR 99 Tunnel are not included until FY 2018 for
purposes of the SR 520 cost estimates. The centralized re‐procurement, implementation, and
testing costs are assumed to remain constant regardless of how many facilities are in the system. As
such, the updated and more conservative approach results in a higher SR 520 share of total
transactions, and thus, CSC vendor contract re‐procurement, implementation, and testing costs,
which when combined with cost revisions, are 33 percent higher than in the October 2013 forecast
when totaled over the forecast horizon.
Exhibit 23 illustrates the total toll‐related R&R costs for each of the three forecasts. Exhibit 24
further illustrates these changes by showing the composition of the November 2014 forecast divided
by the facility and toll collection R&R cost components.

SR 520 Bridge Net Toll Revenue Report 2014 Update — January 30, 2015
48 CHANGES TO OTHER PROJECT USES OF TOLL REVENUES
EXHIBIT 23: TOLL COLLECTION REPAIR AND REPLACEMENT COST ESTIMATES BY FORECAST IN YOE $ (FY 2015-56)
‐
1
2
3
4
5
6
7
2015 2019 2023 2027 2031 2035 2039 2043 2047 2051 2055
October 2013 Net Revenue Forecast
November 2014 Net Revenue Forecast
$ millions
Fiscal Year
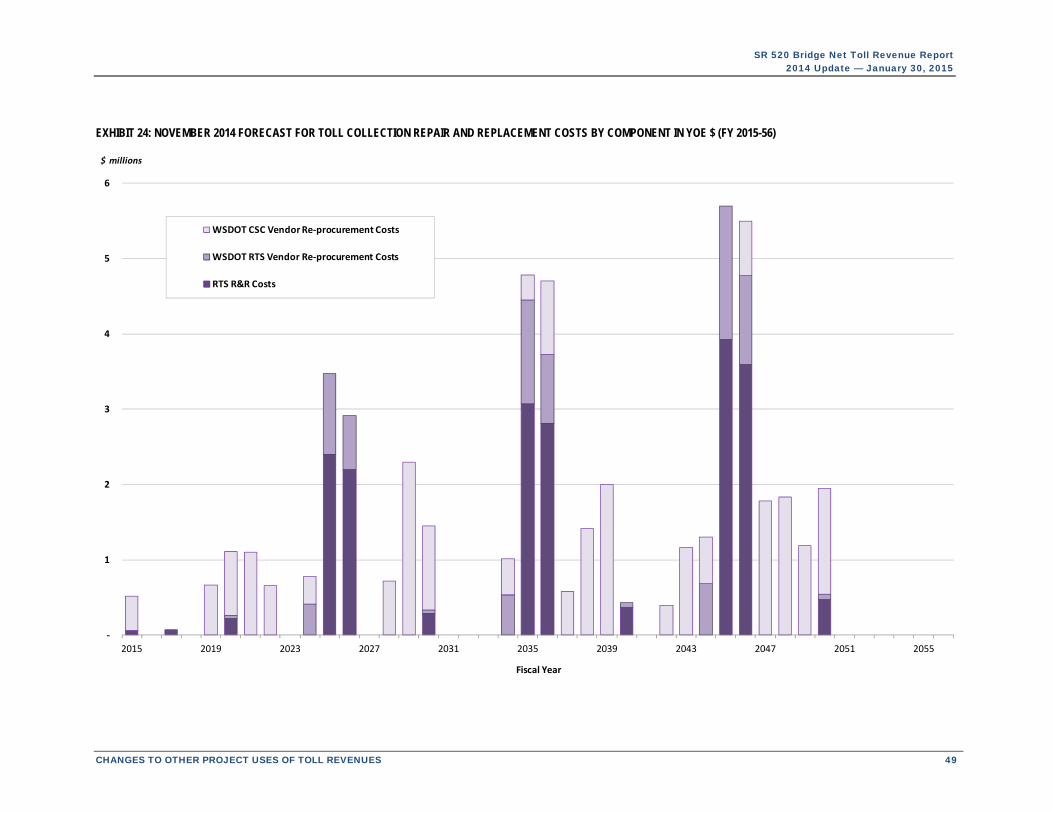
SR 520 Bridge Net Toll Revenue Report 2014 Update — January 30, 2015
CHANGES TO OTHER PROJECT USES OF TOLL REVENUES 49
EXHIBIT 24: NOVEMBER 2014 FORECAST FOR TOLL COLLECTION REPAIR AND REPLACEMENT COSTS BY COMPONENT IN YOE $ (FY 2015-56)
‐
1
2
3
4
5
6
2015 2019 2023 2027 2031 2035 2039 2043 2047 2051 2055
WSDOT CSC Vendor Re‐procurement Costs
WSDOT RTS Vendor Re‐procurement Costs
RTS R&R Costs
$ millions
Fiscal Year

SR 520 Bridge Net Toll Revenue Report 2014 Update — January 30, 2015
50 CHANGES TO OTHER PROJECT USES OF TOLL REVENUES

SR 520 Bridge Net Toll Revenue Report 2014 Update — January 30, 2015
APPENDIX A 51
Appendix A: Annual Toll Traffic & Revenue Projections

SR 520 Bridge Net Toll Revenue Report 2014 Update — January 30, 2015
52 APPENDIX A
The T&R table provided on the following page as Exhibit 26 shows the adjustments, additions, and
reductions to CDM Smith’s Gross Toll Revenue Potential forecast that yield the net toll revenue cash
flow available for debt service and other downstream uses. While some aspects of the table format
and column order have been revised since the initial September 2011 forecast, the table format for
the November 2014 forecast matches that of the previous October 2013 forecast.
Key changes and additions to T&R table columns by forecast are shown in Exhibit 25 below with (#)
representing the column number.
EXHIBIT 25: CHANGES IN THE T&R TABLE FORMAT ACROSS THE FOUR ANNUAL NET REVENUE FORECASTS
SEPTEMBER 2011 SEPTEMBER 2012* OCTOBER 2013 AND NOVEMBER 2014
Gross Toll Revenue (11) Gross Toll Revenue Potential (11) No change
Free Trip Incentive (12) No Change Included in actuals for Toll Payment Discounts & Fees (12)
Self‐Initiated Payment Incentives (13) No Change Included in Toll Payment Discounts & Fees (12)
Good To Go! Pay By Plate Fees (14) Good To Go! Pay By Plate Surcharge (14) Included in Toll Payment Discounts & Fees (12)
Late Payment Fees (15) No change Pay By Mail Rebilling Fees (18)
N/A N/A Gross Toll Revenue Collected (15)
Uncollectible Transactions/Leakage (16) Uncollectible Accounts (16) Revenue Not Recognized (13), Unpaid Toll Revenue (14)
N/A N/A Misc. Pledged Revenues (16)
Recovered Toll & Fee Revenue (17) No change Recovered Toll Revenue (19), recovered fees included in Pay By Mail Rebilling Fees (18)
Adjusted Gross Toll Revenues (18) No change Adjusted Gross Toll Revenue & Fees (20)
Transponder Sales Revenue (19) No change Transponder Sales Revenue (17)
Transponder Purchase & Inventory Cost (20)
No change Included in Toll Collection O&M (22)
Routine Toll Collection O&M Costs (22) Toll Collection O&M Costs (22) Toll Collection O&M Costs (22), now includes Transponder Purchase & Inventory Cost
N/A N/A Periodic Toll Equipment and CSC Repair & Replacement Costs (28)
Remaining Net Toll Revenues After R&R/ Deferred Sales Tax (28)
Net Toll Revenue After Deferred Sales Tax and Periodic R&R (28)
Total Net Toll Revenue After Deferred Sales Tax and Periodic R&R (29)
* Forecast values correspond to the September 2012 Net Revenue forecast update, modified to incorporate nickel rounding of toll rates in fiscal years 2014‐16, as adopted by the Washington State Transportation Commission in May 2013.

APPENDIX A Forecasts Updated 12/17/2014 • Actuals Documented 11/25/2014 53
EXHIBIT 26: SR 520 TRAFFIC AND REVENUE TABLE – NOVEMBER 2014 FORECASTAnnual Transactions, Gross Revenue, and Net Revenue FY 2012-56 — Revised Net Revenue Projections based on Updated Investment Grade Traffic and Revenue Forecasts
1 2 3 4 5 6 7 8 9 10 11 12 13 14 15 16 17 18 19 20 21 22 23 24 25 26 27 28 29
Good To Go! Accounts Pay By Mail / No Account Toll Revenue Potential Plus (Less): Less: Less: Plus (Less): Plus: Plus: Plus: Less: Less: Less: Less: Less: Less: Less:Wtd. Average
Tollper PCE
Transaction
(one-way)1
AnnualBridge Toll
Transactions
(millions)2
PCEBridge
Volumes
(millions)3
Wtd. Average Toll
per PCE Transaction
(one-way)1
AnnualBridge Toll
Transactions
(millions)2
PCEBridge
Volumes
(millions)3
Good To Go! Pre-Paid Accounts
($ millions)5
Pay By Mail / No Account
($ millions)6
Toll Payment Discounts and
Fees($ millions)
7, 8, 9
Revenue Not Recognized($ millions)
10
Unpaid Toll Revenue
($ millions)11
Misc. Pledged
Revenues($ millions)
12
Transponder Sales Revenue
($ millions)13
Pay By Mail Rebilling Fees (2nd Invoice & Later Recovery)
($ millions)14, 15
Recovered Toll
Revenue ($ millions)
16
CreditCardFees
($ millions)17
TollCollection
O&M Costs($ millions)
18
Routine Facility
O&M Costs($ millions)
19
Bridge Insurance Premium
($ millions)20
Payment of Deferred Sales Tax
($ millions)21
Periodic Facility Repair
& Replacement (R&R) Costs
($ millions)22
Periodic Toll Equipment
and CSC Repair &
Replacement (R&R) Costs
($ millions)23
2012 $2.66 7.95 8.05 $3.96 1.66 1.69 9.61 21.39 6.67 28.06 (0.21) (0.69) (1.05) 26.10 2.00 1.32 0.83 - 30.25 (0.43) (6.97) - (1.64) 21.22 - - - 21.22
2013 $2.78 16.92 17.01 $4.19 3.30 3.35 20.22 47.28 14.02 61.30 0.67 (1.52) (5.01) 55.44 0.24 0.47 1.38 - 57.53 (0.91) (7.16) - (2.43) 47.02 - - - 47.02
2014 $2.85 17.69 17.77 $4.22 3.27 3.31 20.96 50.63 13.96 64.59 0.86 (1.68) (3.27) 60.50 0.21 0.50 1.51 - 62.72 (1.08) (7.98) - (2.52) 51.14 - - - 51.14
2015 $2.91 18.52 18.66 $4.34 3.36 3.39 21.88 54.27 14.73 69.00 0.81 (1.70) (3.68) 64.42 - 0.58 1.61 1.64 68.26 (1.08) (9.84) - (2.22) 55.12 - - (0.52) 54.60
2016 $2.96 19.65 19.78 $4.43 3.53 3.56 23.18 58.62 15.76 74.38 0.81 (1.79) (3.95) 69.45 - 0.50 1.69 0.80 72.44 (1.16) (10.75) (1.27) (2.42) 56.84 - (0.01) - 56.83
2017 $3.22 20.56 20.73 $4.78 3.61 3.64 24.18 66.80 17.41 84.21 0.80 (1.97) (4.26) 78.79 - 0.45 1.74 0.87 81.85 (1.31) (10.23) (2.97) (2.75) 64.59 - (0.12) (0.07) 64.40
2018 $3.20 21.24 21.43 $4.75 3.61 3.64 24.85 68.65 17.31 85.96 0.78 (1.94) (4.42) 80.38 - 0.32 1.75 0.92 83.36 (1.34) (9.73) (3.05) (2.75) 66.49 - (0.13) - 66.37
2019 $3.18 22.19 22.40 $4.72 3.67 3.71 25.86 71.16 17.48 88.64 0.77 (1.94) (4.48) 82.99 - 0.34 1.78 0.92 86.03 (1.38) (10.50) (3.13) (2.75) 68.26 - (0.13) (0.67) 67.47
2020 $3.16 23.10 23.33 $4.69 3.71 3.74 26.80 73.78 17.56 91.34 0.74 (1.94) (4.50) 85.65 - 0.33 1.80 0.93 88.72 (1.43) (11.01) (3.21) (2.75) 70.32 - (0.13) (1.11) 69.08
2021 $3.15 23.83 24.08 $4.67 3.72 3.76 27.55 75.75 17.53 93.27 0.71 (1.91) (4.50) 87.57 - 0.34 1.82 0.94 90.66 (1.46) (11.36) (3.29) (2.75) 71.80 - (0.14) (1.10) 70.56
2022 $3.13 24.64 24.91 $4.64 3.74 3.78 28.38 77.96 17.55 95.51 0.74 (1.93) (4.52) 89.79 - 0.35 1.83 0.94 92.92 (1.50) (11.96) (3.37) (2.81) 73.29 (15.94) (0.14) (0.66) 56.55
2023 $3.12 25.45 25.74 $4.61 3.77 3.81 29.22 80.18 17.57 97.74 0.76 (1.95) (4.54) 92.02 - 0.37 1.85 0.94 95.19 (1.53) (12.40) (3.46) (2.83) 74.96 (15.94) (0.14) - 58.88
2024 $3.10 26.27 26.58 $4.58 3.81 3.85 30.08 82.32 17.64 99.95 0.78 (1.97) (4.57) 94.20 - 0.39 1.88 0.95 97.42 (1.57) (12.90) (3.54) (2.90) 76.51 (15.94) (0.15) (0.78) 59.64
2025 $3.10 26.71 27.05 $4.59 3.84 3.88 30.55 83.95 17.81 101.76 0.80 (1.99) (4.60) 95.97 - 0.40 1.89 0.96 99.22 (1.60) (13.33) (3.63) (2.95) 77.71 (15.94) (0.15) (3.47) 58.15
2026 $3.10 27.17 27.54 $4.59 3.88 3.93 31.05 85.50 18.04 103.54 0.81 (2.02) (4.66) 97.67 - 0.42 1.92 0.97 100.97 (1.63) (13.63) (3.72) (3.00) 79.00 (15.94) (0.15) (2.91) 59.99
2027 $3.11 27.63 28.03 $4.60 3.92 3.97 31.55 87.06 18.26 105.32 0.83 (2.05) (4.72) 99.37 - 0.43 1.94 0.98 102.73 (1.65) (14.13) (3.82) (3.05) 80.08 (15.94) (0.16) - 63.98
2028 $3.11 28.17 28.60 $4.60 3.98 4.03 32.15 88.91 18.54 107.45 0.84 (2.08) (4.79) 101.41 - 0.45 1.97 1.00 104.83 (1.69) (14.59) (3.91) (3.12) 81.52 (15.94) (0.16) (0.72) 64.70
2029 $3.11 28.51 28.96 $4.60 4.02 4.07 32.52 89.97 18.71 108.68 0.85 (2.10) (4.85) 102.58 - 0.47 1.99 1.01 106.04 (1.71) (15.03) (4.01) (3.15) 82.15 (15.94) (0.16) (2.29) 63.75
2030 $3.11 28.97 29.45 $4.60 4.06 4.12 33.03 91.52 18.94 110.46 0.87 (2.13) (4.90) 104.29 - 0.48 2.01 1.02 107.80 (1.73) (15.77) (4.11) (3.20) 82.98 (15.94) (4.01) (1.45) 61.57
2031 $3.11 29.46 29.97 $4.60 4.10 4.16 33.56 93.27 19.16 112.44 0.88 (2.16) (4.96) 106.19 - 0.50 2.03 1.03 109.76 (1.77) (16.26) (4.21) (3.26) 84.26 (15.94) (15.81) - 52.51
2032 $3.11 30.15 30.68 $4.60 4.19 4.26 34.34 95.46 19.61 115.07 0.90 (2.21) (5.08) 108.67 - 0.52 2.08 1.05 112.32 (1.81) (16.89) (4.32) (3.34) 85.97 - (10.34) - 75.63
2033 $3.11 30.60 31.14 $4.60 4.26 4.33 34.86 96.84 19.92 116.75 0.91 (2.25) (5.16) 110.26 - 0.54 2.11 1.07 113.98 (1.83) (17.47) (4.42) (3.39) 86.87 - (0.18) - 86.69
2034 $3.11 31.09 31.64 $4.60 4.33 4.40 35.42 98.36 20.24 118.60 0.93 (2.28) (5.25) 112.00 - 0.56 2.15 1.09 115.80 (1.86) (18.17) (4.53) (3.44) 87.79 - (0.19) (1.01) 86.59
2035 $3.10 31.48 32.05 $4.59 4.40 4.47 35.88 99.50 20.53 120.02 0.94 (2.31) (5.32) 113.33 - 0.57 2.18 1.11 117.19 (1.89) (18.79) (4.65) (3.48) 88.38 - (2.29) (4.78) 81.31
2036 $3.10 31.96 32.54 $4.59 4.46 4.54 36.42 101.00 20.83 121.83 0.95 (2.35) (5.40) 115.04 - 0.59 2.21 1.12 118.96 (1.91) (19.43) (4.76) (3.53) 89.32 - (2.52) (4.70) 82.10
2037 $3.10 32.21 32.80 $4.60 4.49 4.57 36.71 101.84 20.99 122.83 0.96 (2.37) (5.44) 115.99 - 0.61 2.23 1.14 119.96 (1.93) (19.99) (4.88) (3.56) 89.59 - (0.66) (0.58) 88.35
2038 $3.10 32.46 33.06 $4.59 4.53 4.61 37.00 102.62 21.16 123.78 0.97 (2.38) (5.48) 116.88 - 0.63 2.25 1.14 120.89 (1.94) (20.58) (5.01) (3.59) 89.78 - (0.21) (1.42) 88.15
2039 $3.10 32.66 33.26 $4.59 4.56 4.64 37.22 103.20 21.29 124.49 0.98 (2.40) (5.52) 117.55 - 0.64 2.26 1.15 121.60 (1.96) (21.16) (5.13) (3.61) 89.75 - (0.21) (2.00) 87.54
2040 $3.10 32.85 33.46 $4.59 4.60 4.67 37.44 103.71 21.44 125.15 0.98 (2.41) (5.56) 118.16 - 0.66 2.28 1.16 122.25 (1.97) (21.76) (5.26) (3.63) 89.64 - (0.57) (0.43) 88.65
2041 $3.10 32.87 33.49 $4.59 4.61 4.68 37.48 103.74 21.47 125.21 0.98 (2.42) (5.56) 118.21 - 0.67 2.28 1.16 122.33 (1.97) (22.30) (5.39) (3.63) 89.04 - (43.81) - 45.23
2042 $3.10 33.04 33.67 $4.59 4.62 4.70 37.66 104.35 21.56 125.91 0.99 (2.43) (5.58) 118.88 - 0.69 2.29 1.17 123.03 (1.98) (22.90) (5.53) (3.65) 88.98 - (33.28) (0.40) 55.29
2043 $3.10 33.17 33.81 $4.59 4.64 4.72 37.81 104.74 21.65 126.39 0.99 (2.44) (5.61) 119.33 - 0.70 2.30 1.17 123.51 (1.98) (23.69) (5.66) (3.67) 88.50 - (0.23) (1.17) 87.10
2044 $3.10 33.41 34.05 $4.59 4.67 4.75 38.08 105.48 21.80 127.28 1.00 (2.45) (5.65) 120.17 - 0.72 2.32 1.18 124.39 (2.00) (24.37) (5.81) (3.69) 88.53 - (0.24) (1.30) 86.99
2045 $3.10 33.43 34.09 $4.58 4.68 4.76 38.12 105.52 21.83 127.35 1.00 (2.46) (5.66) 120.23 - 0.74 2.32 1.18 124.47 (2.00) (25.01) (5.95) (3.69) 87.82 - (42.01) (5.69) 40.12
2046 $3.09 33.53 34.18 $4.58 4.71 4.79 38.23 105.68 21.92 127.61 1.00 (2.47) (5.68) 120.46 - 0.75 2.33 1.19 124.73 (2.00) (25.72) (6.10) (3.70) 87.21 - (45.21) (5.50) 36.50
2047 $3.09 33.66 34.32 $4.58 4.73 4.81 38.39 106.08 22.02 128.09 1.01 (2.48) (5.70) 120.92 - 0.77 2.34 1.19 125.22 (2.01) (26.41) (6.25) (3.71) 86.84 - (39.57) (1.78) 45.48
2048 $3.09 33.93 34.61 $4.58 4.76 4.84 38.69 107.06 22.17 129.22 1.01 (2.50) (5.74) 122.00 - 0.79 2.36 1.20 126.35 (2.03) (27.22) (6.41) (3.75) 86.94 - (0.26) (1.83) 84.85
2049 $3.09 33.96 34.65 $4.58 4.77 4.85 38.73 107.09 22.20 129.29 1.01 (2.50) (5.75) 122.06 - 0.81 2.36 1.20 126.43 (2.03) (27.96) (6.57) (3.75) 86.13 - (0.27) (1.18) 84.67
2050 $3.09 34.10 34.79 $4.58 4.79 4.87 38.88 107.49 22.30 129.79 1.02 (2.51) (5.77) 122.52 - 0.83 2.37 1.21 126.93 (2.04) (28.77) (6.73) (3.76) 85.63 - (0.28) (1.94) 83.41
2051 $3.09 34.23 34.93 $4.58 4.81 4.89 39.04 107.89 22.39 130.28 1.02 (2.52) (5.80) 122.98 - 0.85 2.38 1.21 127.43 (2.05) (29.54) (6.90) (3.78) 85.16 - (0.28) - 84.88
2052 $3.08 34.39 35.10 $4.57 4.85 4.94 39.24 108.20 22.55 130.75 1.03 (2.53) (5.84) 123.40 - 0.87 2.40 1.22 127.89 (2.05) (30.44) (7.07) (3.79) 84.53 - (0.29) - 84.24
2053 $3.09 34.50 35.22 $4.57 4.85 4.94 39.35 108.69 22.58 131.27 1.03 (2.54) (5.84) 123.92 - 0.89 2.40 1.22 128.44 (2.06) (31.23) (7.25) (3.81) 84.08 - (0.30) - 83.79
2054 $3.09 34.64 35.36 $4.57 4.87 4.96 39.51 109.10 22.67 131.77 1.03 (2.55) (5.87) 124.39 - 0.91 2.41 1.23 128.94 (2.07) (32.15) (7.43) (3.82) 83.46 - (0.31) - 83.16
2055 $3.08 34.78 35.51 $4.57 4.89 4.98 39.67 109.50 22.77 132.27 1.04 (2.56) (5.90) 124.86 - 0.93 2.42 1.23 129.45 (2.08) (33.09) (7.62) (3.84) 82.82 - (9.84) - 72.98
2056 $3.08 35.02 35.76 $4.57 4.93 5.02 39.95 110.28 22.93 133.21 1.05 (2.58) (5.94) 125.74 - 0.96 2.44 1.24 130.38 (2.09) (34.13) (7.81) (3.86) 82.49 - (6.73) - 75.76
Totals FY 2012-16 80.73 81.28 15.12 15.29 95.85 232.18 65.14 297.32 2.95 (7.39) (16.97) 275.91 2.44 3.37 7.03 2.44 291.19 (4.67) (42.70) (1.27) (11.22) 231.34 - (0.01) (0.52) 230.81
Totals FY 2017-46 868.80 882.72 125.20 126.97 994.00 2,748.80 585.69 3,334.49 26.44 (65.70) (151.21) 3,144.02 - 15.65 61.76 31.48 3,252.92 (52.32) (511.06) (130.83) (97.63) 2,461.07 (159.40) (203.62) (44.22) 2,053.84
Totals FY 2015-56 1,250.18 1,271.41 180.32 183.01 1,430.50 3,943.07 840.75 4,783.82 38.31 (94.45) (217.00) 4,510.68 - 25.36 88.95 46.08 4,671.06 (75.07) (832.61) (202.14) (140.14) 3,421.12 (159.40) (261.76) (51.48) 2,948.48
Footnotes 12 Actual miscellaneous pledged revenues include contractual damages, interest earned in the toll collection account, and surplus property sales. These items are not forecasted. General Notes1 Reflects the average revenue per passenger car equivalent (PCE) based on time-of-day variable weekday and weekend toll structures. 13 Anticipated revenues from transponder sales; forecast values are set equal to transponder inventory purchase costs and credit card fees w/in column 22. – Traffic and Gross Revenue Projections prepared 2 Estimate prepared by CDMS; annual volume of vehicles subject to tolls in each travel direction; includes autos and trucks. 14 Late payment rebilling fee of $5 per invoice assessed to Pay By Mail customers who fail to pay first invoice; includes fees recovered through civil penalty process; six-month average recovery lag assumed; by CDM Smith (CDMS), dated 11/14/2014.3 Estimate prepared by CDMS; converts trucks w/3+ axles and vehicles w/trailers to their passenger car equivalent (PCE) based on an axle-count multiple of the auto toll (e.g., 4 axles = 2x toll). no annual escalation assumed. – Tolling started December 29, 2011 (mid FY 2012).4 Total toll traffic and gross toll revenue potential projections (and components by payment method) are inclusive of proposed closures for construction and toll equipment 15 Actual values also include statement and $30 NSF fees (not forecasted), and exclude misc. pledged revenues, which are shown in column 16. – Weekday and weekend toll rates are assumed to
installation in the corridor (FY 2015-18); actual gross toll revenue potential for FY 2014 may be subject to change with final audited financial statements. 16 Toll revenues recovered through Notice of Civil Penalty process; six-month average recovery lag assumed. FY 2015 includes an anticipated transfer of accumulated recovered tolls from previous years. escalate at 2.5% per year through FY 2016, including 5 Estimate prepared by CDMS; gross toll revenue potential from pre-paid Good To Go! accounts before any adjustments for uncollectible revenue, fees, and credits. 17 Credit card fees estimated at 2% of applicable gross toll revenues collected via bank card; additional factor included for fees related to account refunds. nickel rounding of all toll rates starting with FY 2014. 6 Estimate prepared by CDMS; gross toll revenue potential from customers without established accounts before adjustments for uncollectible revenue, fees, and credits. 18 Includes CSC and RTS vendor costs, State operations costs for toll bill printing/postage, accounting, marketing, vendor oversight, and transponder purchase/inventory costs. A step increase averaging 15% for weekdays is 7 Actual values include one-time toll incentive credits for FY 2012 with a carry-over amount into FY 2013 19 Facility O&M costs are partialy paid from tolls in FY 2016 and fully paid from tolls thereafter. Facility O&M costs covered by the existing maintenance program prior to FY 2017 are not shown. assumed in FY 2017.8 Includes $0.50 short-term account discount for non-account customers who self-initiate payment without waiting to receive a bill; no escalation assumed for discount. 20 Insurance coverage includes property damage on all bridge structures and business interruption coverage (for lost revenues). – FY 2016-21 O&M and R&R cost values may differ from 9 Includes $0.25 per transaction fee charged for pre-paid Good To Go! Pay By Plate transactions; fee assumed to be constant with no annual escalation. 21 Reflects the payment of construction sales tax on the Floating Bridge and Eastside plus West Approach Bridge projects deferred during construction. the WSDOT proposed decision package
10 Revenue recognition policies require each toll transaction to be associated with an identifiable vehicle owner. For instances in which this is not possible, including an 22 Includes facility R&R costs for the floating bridge structures, ATM equipment, federal required bridge inspections, and other periodic activities and excludes amounts for typical highway budget requested amounts due to updated T&R
inability to read the vehicle license plate, this unbillable revenue will not be recognized. costs on the at-grade portion of the corridor from the east bridge landing to I-405 (i.e., roadway repaving), which would be funded from the WSDOT Preservation ("P") Program. forecasts and cost allocation assumptions.11 Recognized revenue for toll bills that are unpaid within 80 days (two billing cycles) of travel and prior to any recovery after 80 days via the Civil Penalty adjudication process. 23 Includes periodic vendor re-procurement, system testing and acceptance, and toll equipment replacement costs; amounts assumed to be fully funded by tolls. – Table values include more precision than displayed.
TotalNet Toll
Revenue After Deferred
Sales Tax and Periodic R&R($ millions)
Pre-
Com
plet
ion
Post
-Com
plet
ion
— F
ull R
even
ue O
pera
tion
s
FiscalYear
Total Toll
Transactions
(millions)4
Total Gross Toll Revenue Potential
($ millions)4
Subtotal: Adjusted Gross Toll Revenue Collected
($ millions)
Subtotal:Adjusted Gross Toll
Revenue & Fees
($ millions)
Total Net Toll Revenue
Before R&R($ millions)
Revised 12/17/2014

.

SR 520 Bridge Net Toll Revenue Report 2014 Update — January 30, 2015
APPENDIX B 55
Appendix B: Toll Payment Activity Workflow

SR 520 Bridge Net Toll Revenue Report 2014 Update — January 30, 2015
56 APPENDIX B
EXHIBIT 27: SR 520 TOLL TRANSACTION ACTIVITY WORKFLOW – NOVEMBER 2014 FORECAST
1 Includes small amount of transactions transferred from “Transponder Not Properly Detected”
NOTES:
• Revenue leakage (before delinquent toll bill recovery) results from uncollectible transactions at the Unreadable License Plates, Unidentifiable Owner / No Address, and Second Invoice Unpaid stages. Uncollectible transactions as a percentage share of total transactions varies slightly over time due to the changing shares of Good To Go! and Pay By Mail payment methods. In FY 2017, 5.8% of total transactions are expected to be uncollectible, with that share decreasing to 4.9% by FY 2031.
• A portion of unpaid toll revenue after 80 days is expected to be subsequently recovered via the civil penalty adjudication process, resulting in slightly lower shares for uncollectible transactions net of delinquent toll bills.
• For FY 2017, the forecasts assume that 85% of customer intend to pay using a Good To Go! account, with the remaining 15% representing Pay By Mail customers. In FY 2031, these shares are expected to be 88% and 12%, respectively.
Trip on SR520 Bridge Initiated
Vehicle has Transponder
No Transponder / License Plate Photo 1
Transponder Detected in Toll Paying Status
Transponder Not Properly Detected
Good To Go! Sufficient Balance
Good To Go!Insufficient Balance
Unreadable License Plate (Revenue Not Recognized)
Readable License Plate
Plate Good To Go! Pay By Mail
Customer Initiated Payment
Unidentifiable Owner / No Address(Revenue Not Recognized)
Valid Address
First Invoice Paid
First Invoice Unpaid,Send Second Invoice
Second Invoice Paid
Second Invoice Unpaid(Unpaid Tolls after 80 Days)
Payment or Exemption
Revenue Leakage
Legend
Notice of Civil Penalty Process*
Paid Toll via NOCP Process * (Recovered Toll Revenue)
NOCP Unpaid
Plate Good To Go! Paid
Plate Insufficient Balance
Pay By Mail + Others

SR 520 Bridge Net Toll Revenue Report 2014 Update — January 30, 2015
APPENDIX C 57
Appendix C: List of Facility Maintenance Activities
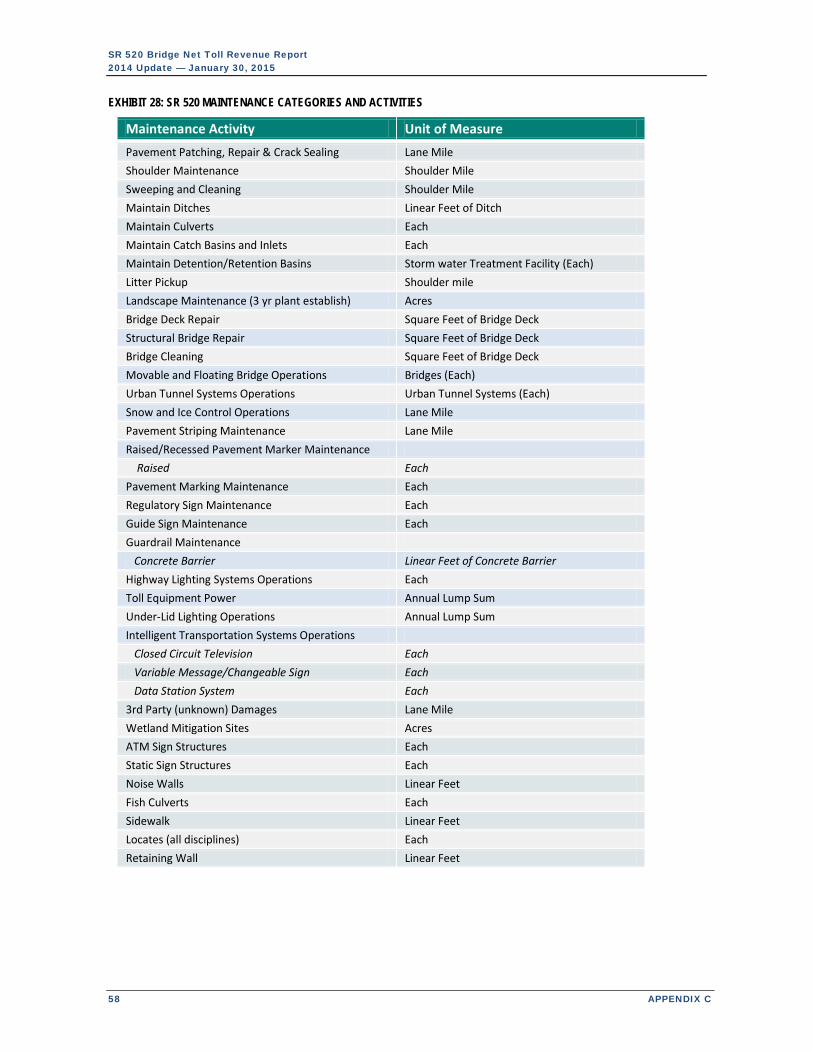
SR 520 Bridge Net Toll Revenue Report 2014 Update — January 30, 2015
58 APPENDIX C
EXHIBIT 28: SR 520 MAINTENANCE CATEGORIES AND ACTIVITIES
Maintenance Activity Unit of Measure
Pavement Patching, Repair & Crack Sealing Lane Mile
Shoulder Maintenance Shoulder Mile
Sweeping and Cleaning Shoulder Mile
Maintain Ditches Linear Feet of Ditch
Maintain Culverts Each
Maintain Catch Basins and Inlets Each
Maintain Detention/Retention Basins Storm water Treatment Facility (Each)
Litter Pickup Shoulder mile
Landscape Maintenance (3 yr plant establish) Acres
Bridge Deck Repair Square Feet of Bridge Deck
Structural Bridge Repair Square Feet of Bridge Deck
Bridge Cleaning Square Feet of Bridge Deck
Movable and Floating Bridge Operations Bridges (Each)
Urban Tunnel Systems Operations Urban Tunnel Systems (Each)
Snow and Ice Control Operations Lane Mile
Pavement Striping Maintenance Lane Mile
Raised/Recessed Pavement Marker Maintenance
Raised Each
Pavement Marking Maintenance Each
Regulatory Sign Maintenance Each
Guide Sign Maintenance Each
Guardrail Maintenance
Concrete Barrier Linear Feet of Concrete Barrier
Highway Lighting Systems Operations Each
Toll Equipment Power Annual Lump Sum
Under‐Lid Lighting Operations Annual Lump Sum
Intelligent Transportation Systems Operations
Closed Circuit Television Each
Variable Message/Changeable Sign Each
Data Station System Each
3rd Party (unknown) Damages Lane Mile
Wetland Mitigation Sites Acres
ATM Sign Structures Each
Static Sign Structures Each
Noise Walls Linear Feet
Fish Culverts Each
Sidewalk Linear Feet
Locates (all disciplines) Each
Retaining Wall Linear Feet