
Spreadsheet Modeling for Insight - Oregon State...
22
International Workshop on the Foundations of Spreadsheets Rome, Italy September 30, 2004 Spreadsheet Modeling for Insight Stephen G. Powell 1,2 Tuck School of Business Dartmouth College Hanover, NH 03755 USA Abstract It is widely recognized that spreadsheets are error-filled, their creators are over- confident, and the process by which they are developed is chaotic. It is less well- understood that spreadsheet users generally lack the skills needed to derive practical insights from their models. Modeling for insight requires skills in establishing a base case, performing sensitivity analysis, using back-solving, and (when necessary) car- rying out optimization and simulation. Some of these tasks are made possible only with specialized add-ins to Excel. In this paper we present an overview of the skills and software tools needed to model for insight. Key words: sensitivity analysis, software engineering, spreadsheet engineering 1 Introduction There is ample evidence that spreadsheets as actually used in industry are highly problematic [1]. Many, if not most, spreadsheets harbor serious bugs. The end-users who typically design and use spreadsheets are under-trained and overconfident in the accuracy of their models. The process that most spreadsheet developers use is chaotic, leading to time wasted in rework and in high error rates. Few spreadsheets are tested in any formal manner. Finally, many organizations fail to follow standard procedures for documentation or version control, which leads to errors in use even if the spreadsheets themselves are correct. While these problems are well known to a few researchers, and widely suspected by many managers, few companies recognize the risks that spreadsheet errors pose. This paper is concerned with a much less well understood problem, involv- ing missed opportunities to extract useful business insights from spreadsheet 1 Thanks are due to Ken Baker at Tuck School of Business, Dartmouth College, who co- developed most of the ideas in this paper. 2 Email: [email protected] c 2004 Published by Elsevier Science B. V.
Transcript of Spreadsheet Modeling for Insight - Oregon State...

International Workshop on the Foundations of SpreadsheetsRome, ItalySeptember 30, 2004
Spreadsheet Modeling for Insight
Stephen G. Powell 1,2
Tuck School of Business
Dartmouth College
Hanover, NH 03755 USA
Abstract
It is widely recognized that spreadsheets are error-filled, their creators are over-confident, and the process by which they are developed is chaotic. It is less well-understood that spreadsheet users generally lack the skills needed to derive practical
insights from their models. Modeling for insight requires skills in establishing a basecase, performing sensitivity analysis, using back-solving, and (when necessary) car-rying out optimization and simulation. Some of these tasks are made possible onlywith specialized add-ins to Excel. In this paper we present an overview of the skillsand software tools needed to model for insight.
Key words: sensitivity analysis, software engineering, spreadsheetengineering
1 Introduction
There is ample evidence that spreadsheets as actually used in industry arehighly problematic [1]. Many, if not most, spreadsheets harbor serious bugs.The end-users who typically design and use spreadsheets are under-trainedand overconfident in the accuracy of their models. The process that mostspreadsheet developers use is chaotic, leading to time wasted in rework and inhigh error rates. Few spreadsheets are tested in any formal manner. Finally,many organizations fail to follow standard procedures for documentation orversion control, which leads to errors in use even if the spreadsheets themselvesare correct. While these problems are well known to a few researchers, andwidely suspected by many managers, few companies recognize the risks thatspreadsheet errors pose.
This paper is concerned with a much less well understood problem, involv-ing missed opportunities to extract useful business insights from spreadsheet
1 Thanks are due to Ken Baker at Tuck School of Business, Dartmouth College, who co-developed most of the ideas in this paper.2 Email: [email protected]
c©2004 Published by Elsevier Science B. V.

Stephen G. Powell
models. Many spreadsheet developers have extensive skills in Excel itself butfar fewer have a disciplined approach to using a model to inform a decision orshed light on a business problem. We advocate an engineering approach to theprocess of designing and building a spreadsheet. In the same spirit, the analy-sis process itself can be improved by providing structure and specific softwaretools. We will discuss in particular four analytic tools that are contained inthe Sensitivity Toolkit, a publicly-available Excel add-in we built.
2 Elements of Spreasheet Engineering
Spreadsheet modeling is a form of computer programming, although it is usu-ally carried out by people who do not think of themselves as programmers.Moreover, few spreadsheet developers are trained in software engineering. Inorder to improve this situation we have undertaken the task of translating theprinciples of software engineering into a form that end-users in business canactually use. We call the resulting discipline spreadsheet engineering. Ourmotivation is to improve both the efficiency and the effectiveness with whichspreadsheets are created. An efficient design process uses the minimum timeand effort to achieve results. An effective process achieves results that meetthe users’ requirements. Although spreadsheet modeling is a creative pro-cess, and thus cannot be reduced to a simple recipe, every spreadsheet passesthrough a predictable series of four stages: designing, building, testing, andanalysis. Some of the principles in each of the first three phases are givenbelow:
• designing· sketch the spreadsheet· organize the spreadsheet into modules· start small· isolate input parameters· design for use· keep it simple· design for understanding· document important data and formulas
• building· follow a plan· build one module at a time· predict the outcome of each formula· Copy and Paste formulas carefully· use relative and absolute addresses to simplify copying· use the Function Wizard to ensure correct syntax· use range names to make formulas easy to read
• testing· check that numerical results look plausible
2
Stephen G. Powell
· check that formulas are correct· test that model performance is plausible
Since the focus of this paper is on improving the analysis phase, we will notdiscuss the first three phases of spreadsheet engineering further in this paper.These are described in more detail in [2].
3 Insight: The Goal of Spreadsheet Modeling
In many business applications, the ultimate goal of a spreadsheet modelingeffort is not numerical at all; rather, it is an insight into a problem or situation,often a decision facing the organization. In our minds, an insight is never anumber but can be expressed in natural language that managers understand,often in the form of a graph. Insights often arise from surprises. For example,Option A looks better than Option B on first glance, but our analysis showswhy B actually is a better choice. Many insights involve trade-offs. Forexample, as we add capacity we find at first that service improves faster thancost increases, but eventually increasing costs swamp improvements in service.
If we accept the notion that the purpose of many spreadsheet models isto identify insights, it follows that the spreadsheet itself is not a particularlygood vehicle for the purpose. As convenient as the spreadsheet format is, itdoes not display the relationships involved in a model, but hides them behinda mass of numbers. Nor does it show how changes in inputs affect outputs,which is where insight begins. Users of spreadsheets need to be taught how tomake the row-and-column format work for them to generate insights. Thereare several powerful but obscure features built into Excel (like Goal Seekand Data Table) that can assist in this process. To augment these tools wehave built a Visual Basic add-in called the Sensitivity Toolkit that automatessome of the most powerful sensitivity analysis tools. (This add-in is publiclyavailable at http://mba.tuck.dartmouth.edu/toolkit/)
Although Excel itself has thousands of features, most of the analysis donewith spreadsheets falls into one of the following five categories:
• base-case analysis
• what-if analysis
• breakeven analysis
• optimization analysis
• risk analysis
Within each of these categories, there are specific Excel tools, such as theGoal Seek tool, and add-ins, such as Solver [3] and Crystal Ball [4], which canbe used either to automate tedious calculations or to find powerful businessinsights that cannot be found any other way. Some of these tools, such asSolver, are quite complex and can be given only a cursory treatment here. Bycontrast, some of the other tools we describe are extremely simple, yet are
3
Stephen G. Powell
underutilized by the majority of spreadsheet users.
We will use the spreadsheet model Advertising Budget (see Figure 1) toillustrate each of these five categories of analysis. This model takes various in-puts, including the price and unit costs of a product, and calculates revenues,total costs, and profit over the coming year by quarters. The essential rela-tionship in the model is a sales response to advertising function characterizedby diminishing returns. The fundamental question the model will be used toanswer is how we should allocate a fixed advertising budget across quarters.
3.1 Base-case analysis
Almost every spreadsheet analysis involves measuring outcomes relative tosome common point of comparison, or base case. Therefore, it is worthgiving some thought to how the base case is chosen. A base case is oftendrawn from current policy or common practice, but there are many otheralternatives. Where there is considerable uncertainty in the decision problem,it may be appropriate for the base case to depict the most likely scenario; inother circumstances, the worst case or the best case might be a good choice.
Sometimes, several base cases are used. For example, we might start theanalysis with a version of the model that takes last year’s results as the basecase. Later in the analysis, we might develop another base case using a pro-posed plan for the coming year. At either stage, the base case is the startingpoint from which an analyst can explore the model using the tools described inthis paper, and thereby gain insights into the corresponding business situation.
In the Advertising Budget example, most of the input parameters such asprice and cost are forecasts for the coming year. These inputs would typi-cally be based on previous experience, modified by our hunches as to whatwill be different in the coming year. But what values should we assume forthe decision variables, the four quarterly advertising allocations, in the basecase? Our ultimate goal is to find the best values for these decisions, butthat is premature at this point. A natural alternative is to take last year’sadvertising expenditures ($10, 000 in each quarter) as the base-case decisions,both because this is a simple plan and because initial indications point to arepeat for this year’s decisions.
3.2 What-if analysis
Once a base case has been specified, the next step in analysis often involvesnothing more sophisticated than varying one of the inputs to determine howthe key outputs change. Assessing the change in outputs associated witha given change in inputs is called what-if analysis. The inputs may beparameters, in which case we are asking how sensitive our base-case resultsare to forecasting errors or other changes in those values. Alternatively, theinputs we vary may be decision variables, in which case we are exploringwhether changes in our decisions might improve our results, for a given set
4

Stephen G. Powell
of input parameters. Finally, there is another type of what-if analysis, inwhich we test the effect on the results of changing some aspect of our model’sstructure. For example, we might replace a linear relationship between priceand sales with a nonlinear one. In all three of these forms of analysis, thegeneral idea is to alter an assumption and then trace the effect on the model’soutputs.
We use the term sensitivity analysis interchangeably with the termwhat-if analysis. However, we are aware that sensitivity analysis sometimesconveys a distinct meaning. In optimization models, where optimal decisionvariables themselves depend on parameters, we use the term sensitivity anal-ysis specifically to mean the effect of changing a parameter on the optimal
outcome. (In optimization models, the term what-if analysis is seldom used.)
When we vary a parameter, we are implicitly asking what would happen ifthe given information were different. That is, what if we had made a differentnumerical assumption at the outset, but everything else remained unchanged?This kind of questioning is important because the parameters of our modelrepresent assumptions or forecasts about the environment for decision mak-ing. If the environment turns out to be different than we had assumed, thenit stands to reason that the results will also be different. What-if analysismeasures that difference and helps us appreciate the potential importance ofeach numerical assumption.
In the Advertising Budget example, if unit cost rises to $26 from $25, thenannual profit drops to $53, 700. In other words, an increase of 4 percent in theunit cost will reduce profit by nearly 23 percent. Thus, it would appear thatprofits are quite sensitive to unit cost, and, in light of this insight, we maydecide we should monitor the market conditions that influence the materialand labor components of cost.
When we vary a decision variable, we are exploring outcomes that we caninfluence. First, we’d like to know whether changing the value of a decisionvariable would lead to an improvement in the results. If we locate an improve-ment, we can then try to determine what value of the decision variable wouldresult in the best improvement. This kind of questioning is a little differentfrom asking about a parameter, because we can act directly on what we learn.What-if analysis can thus lead us to better decisions.
In the Advertising Budget example, if we spend an additional $1, 000 onadvertising in the first quarter, then annual profit rises to $69, 882. In otherwords, an increase of 10 percent in the advertising expenditure during Q1 willtranslate into an increase of roughly 0.3 percent in annual profit. Thus, profitsdo not seem very sensitive to small changes in advertising expenditures in Q1,all else being equal. Nevertheless, we have identified a way to increase profits.We might guess that the small percentage change in profit reflects the factthat expenditures in the neighborhood of $10, 000 are close to optimal, but wewill have to gather more information before we are ready to draw conclusionsabout optimality.
5

Stephen G. Powell
In addition to testing the sensitivity of results to parameters and decisionvariables, there are situations in which we want to test the impact of someelement of model structure. For example, we may have assumed that thereis a linear relationship between price and sales. As part of what-if analy-sis, we might then ask whether a nonlinear demand-price relationship wouldmaterially alter our conclusions. As another example, we may have assumedthat our competitors will not change their prices in the coming year. If wethen determine that our own prices should increase substantially over thattime, we might ask how our results would change if our competitors were toreact to our pricing decisions by matching our price increases. These what-ifquestions are more complex than simple changes to a parameter or a decisionvariable because they involve alterations in the underlying structure of themodel. Nonetheless, an important aspect of successful modeling is testing thesensitivity of results to key assumptions in the structure of the model.
In the Advertising Budget example, the relationship between advertisingand sales is given by the nonlinear function:
Sales = 35 × Seasonal Factor ×√
Advertising + 3000. (1)
In the spirit of structural sensitivity analysis, we can ask how different ourresults would be if we were to replace this relationship with a linear one. Forexample, the linear relationship
Sales = 3, 000 + 0.1(Advertising × Seasonal Factor) (2)
lies close to the nonlinear curve for advertising levels around $10, 000. Whenwe substitute this relationship into the base-case model, holding advertisingconstant at $10, 000 each quarter, we find that profit changes only slightly, to$70, 000. But in this model, if we then increase Q1 advertising by $1, 000, wefind that profit decreases, while in the base-case model it increases. Evidently,this structural assumption does have a significant impact on the desired levelsof advertising.
We have illustrated what we might call a “one-at-a-time” form of what-ifanalysis, where we vary one input at a time, keeping other inputs unchanged.We could, of course, vary two or more inputs simultaneously, but these morecomplex experiments become increasingly difficult to interpret. In many cases,we can gain the necessary insights by varying the inputs one at a time.
It is important not to underestimate the power of this first step in analysis.Simple what-if exploration is one of the most effective ways to develop a deeperunderstanding of the model and the system it represents. It is also part of thedebugging process. When what-if analysis reveals something unexpected, wehave either found a useful insight or perhaps discovered a bug.
Predicting the outcome of a what-if test is an important part of the learningprocess. For example, in the Advertising Budget example, what would be theresult of doubling the selling price? Would profits double as well? In the base
6
Stephen G. Powell
case, with a price of $40, profits total $69, 662. If we double the price, we findthat profits increase to $612, 386. Profits increase by much more than a factorof two when prices double. After a little thought, we should see the reasons.For one, costs do not increase in proportion to volume; for another, demandis not influenced by price in this model. Thus, the sensitivity test helps us tounderstand the nature of the cost structure — that it’s not proportional —as well as one limitation of the model — that no link exists between demandand price.
3.2.1 Data Sensitivity
The Data Sensitivity tool automates certain kinds of what-if analysis. Itsimply recalculates the spreadsheet for a series of values of an input cell andtabulates the resulting values of an output cell. This allows the analyst toperform several related what-if tests in one pass rather than entering eachinput value and recording each corresponding output.
The Data Sensitivity tool is one module in the Sensitivity Toolkit, which isan add-in to Excel (available at http://mba.tuck.dartmouth.edu/toolkit).Once the Toolkit is installed, the Sensitivity Toolkit option will appear on thefar right of the menu bar (see Figure 1). Data Sensitivity and the othermodules can be accessed from this menu. (An equivalent tool called DataTable is built into Excel.)
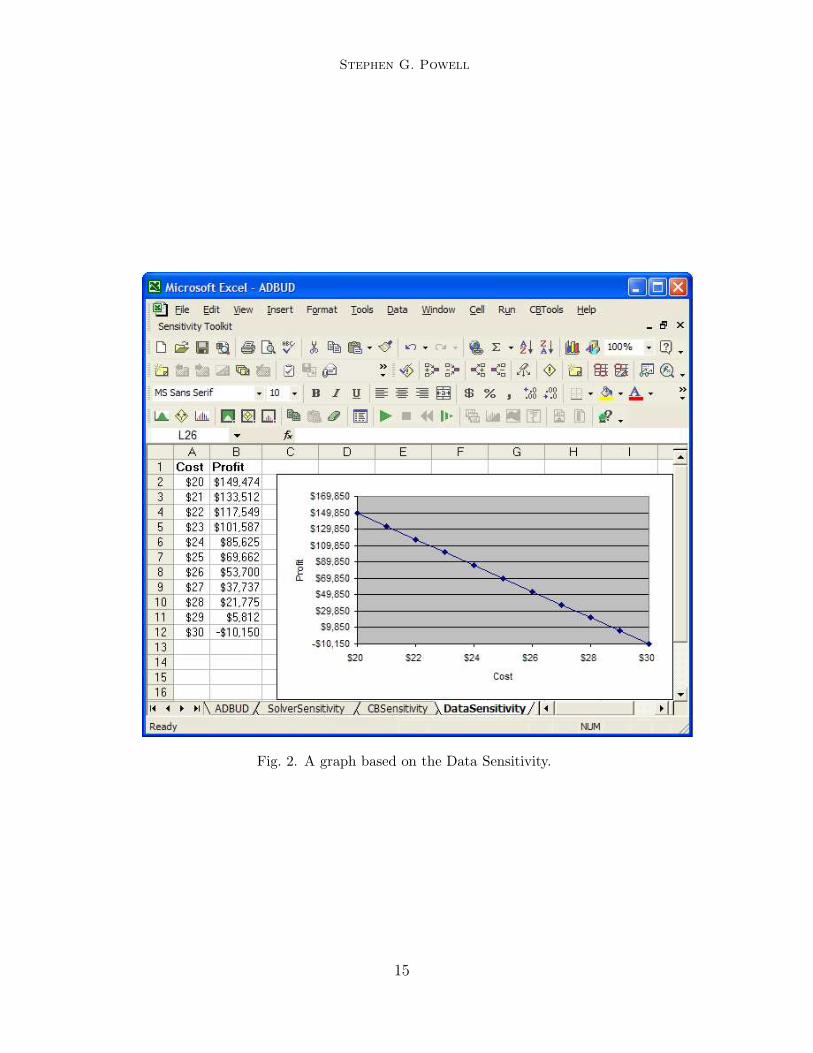
We illustrate the use of the Data Sensitivity tool in the Advertising Budgetmodel by showing how variations in unit cost from a low of $20 to a high of$30 affect profit. (Note: we will not describe the specific steps required to runany of the tools in the Toolkit in this paper: details can be found in [2] or inthe Help Facility in the Toolkit itself).
Figure 2 shows the output generated by the Data Sensitivity tool. Aworksheet has been added to the workbook, and the first two columns onthe sheet contain the table of what-if values. In effect, the what-if test hasbeen repeated for each unit-cost value from $20 to $30 in steps of $1, and theresults have been recorded in the table. In addition, the table is automaticallyconverted to a graph. As the table and graph both show, annual profits dropas the unit cost increases, and the cost-profit relationship is linear. We canalso see that the breakeven value of the unit cost falls between $29 and $30,since profits cross from positive values to negative values somewhere in thisinterval.
Note that the Data Sensitivity tool requires that we provide a single celladdress to reference the input being varied in a one-way table. The tool willwork correctly only if the input has been placed in a single location. Bycontrast, if an input parameter had been embedded in several cells, the toolwould have given incorrect answers when we tried to vary the input. Thus, theuse of single and separate locations for parameters (or for decisions), which isa fundamental principle of spreadsheet engineering, makes it possible to takeadvantage of the tool’s capability.
7

Stephen G. Powell
We can also use the Data Sensitivity tool to analyze the sensitivity of anoutput to two inputs. This option gives rise to a two-way table, in contrast tothe one-way sensitivity table illustrated above. To demonstrate this feature,we can build a table showing how profits are affected by both Q1 advertisingand Q2 advertising. By studying the results in Figure 3, we can make a quickcomparison between the effect of additional spending in Q1 and the effect ofthe same spending in Q2. As we can observe in the table, moving across a rowgenerates more profit than moving the same distance down a column. Thispattern tells us that we can gain more from spending additional dollars in Q2than from the same additional dollars in Q1. This observation suggests that,starting with the base case, we could improve profits by shifting dollars fromQ1 to Q2. We can also note from the table, or from the three-dimensionalchart that automatically accompanies it, that the relationship between profitsand advertising expenditures is not linear. Instead, profits show diminishingreturns to advertising.
3.2.2 Tornado charts
Another useful tool for sensitivity analysis is the tornado chart. In contrastto the information produced by the Data Sensitivity tool, which shows howsensitive an output is to one or perhaps two inputs, a tornado chart shows howsensitive the output is to several different inputs. Consequently, it shows uswhich parameters have a major impact on the results and which have minorimpact.
Tornado charts are created by changing input values one at a time andrecording the variations in the output. The simplest approach is to vary eachinput by a fixed percentage, such as ±10 percent, of its base-case value. Foreach parameter in turn, we increase the base-case value by 10 percent andrecord the output, then decrease the base-case value by 10 percent and recordthe output. Next, we calculate the absolute difference between these twooutcomes and depict the results in the order of these differences.
The Sensitivity Toolkit contains a tool for generating tornado charts. TheTornado Chart tool provides a choice of three options:
• Constant Percentage
• Variable Percentage
• Percentiles
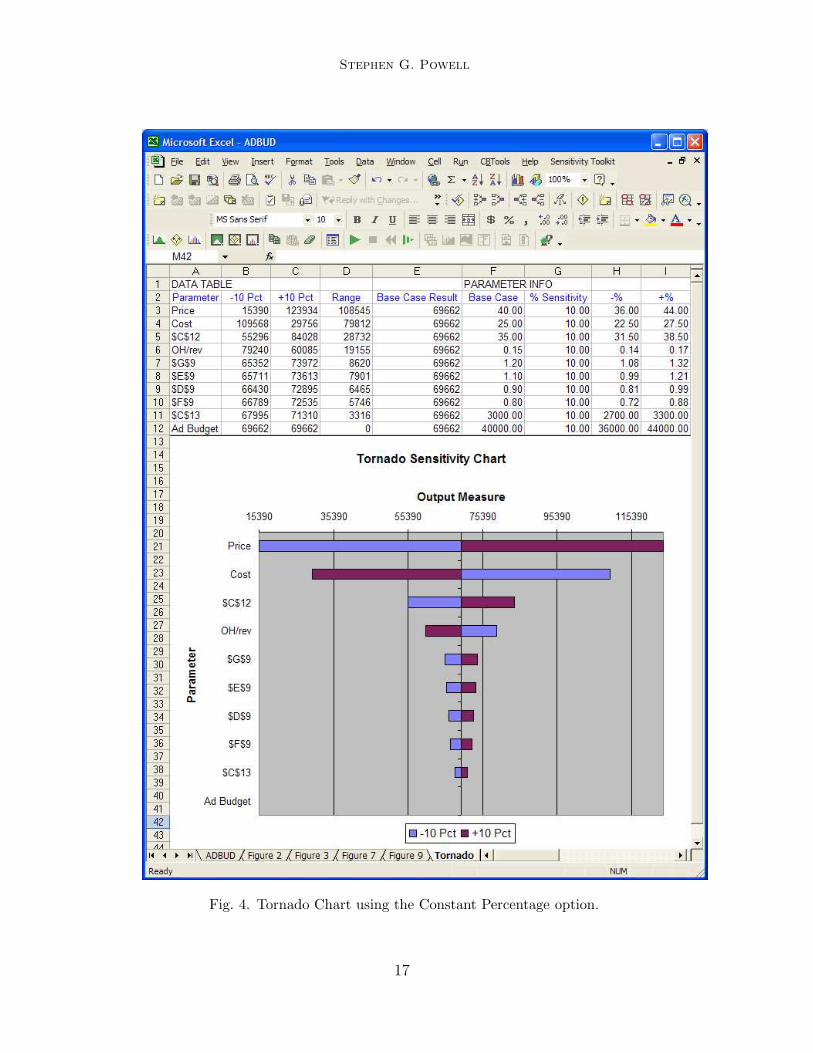
We will illustrate the Constant Percentage case first. The tornado chartappears on a newly inserted worksheet, as shown in Figure 4. The horizontalaxis at the top of the chart shows profits; the bars in the chart show thechanges in profit resulting from ±10 percent changes in each input. Aftercalculating the values (which are recorded in the accompanying table on thesame worksheet), the bars are sorted from largest to smallest for display in thediagram. Thus, the most sensitive inputs appear at the top, with the largesthorizontal spans. The least sensitive inputs appear toward the bottom, with
8

Stephen G. Powell
the smallest horizontal spans. Drawing the chart using horizontal bars, withthe largest span at the top and the smallest at the bottom, suggests theshape of a tornado, hence the name. If some of the information in the chartseems unclear, details can usually be found in the accompanying table, whichis constructed on the same worksheet by the Tornado Chart tool. In ourexample, we can see in the table that price has the biggest impact (a rangeof more than $108, 000), with unit cost next (a range of nearly $80, 000), andthe other inputs far behind in impact on profit.
The standardization achieved by using a common percentage for the changein inputs (10 percent in our example) makes it easy to compare the resultsfrom one input to another, but it may also be misleading. A 10 percent rangemay be realistic for one parameter, while 20 percent is realistic for another,and 5 percent for a third. The critical factor is the size of the forecast errorfor each parameter. If these ranges are significantly different, we should assigndifferent percentages to different inputs. This can be accomplished using theVariable Percentage option in the Tornado Chart tool.
To illustrate the Variable Percentage option in the Advertising Budgetexample, suppose we limit ourselves to seven parameters: price, cost, fourseasonal factors, and overhead rate. Suppose that, based on a detailed as-sessment of the uncertainty in these parameters, we choose to vary price by 5percent, cost by 12 percent, seasonal factors by 8 percent, and overhead rateby 3 percent. The resulting tornado chart is shown in Figure 5. As the resultsshow, cost now has the biggest impact on profits, partly because it has a largerrange of uncertainty than price.
3.3 Breakeven analysis
Many managers and analysts throw up their hands in the face of uncertaintyabout critical parameters. If we ask a manager to directly estimate marketshare for a new product, the reply may be: “I have no idea what market sharewe’ll capture”. A powerful strategy in this situation is to reverse the sense ofthe question and ask not, “What will our market share be?” but rather, “Howhigh does our market share have to get before we turn a profit?” The trick hereis to look for a breakeven, or cutoff, level for a parameter — that is, a targetvalue of the parameter at which some particularly interesting event occurs,such as reaching zero profits or making a 15 percent return on invested assets.Managers who cannot predict market share can often determine whether aparticular breakeven share is likely to occur. This is why breakeven analysisis so powerful.
Even if we have no idea of the market share for the new product, weshould be able to build a model that calculates profit given some assumption
about market share. Once market share takes the role of a parameter in ourmodel, we can use the Data Sensitivity tool to construct a graph of profit asa function of market share. Then, from the graph, we can find the breakeven
9

Stephen G. Powell
market share quite accurately.
New capital investments are usually evaluated in terms of their net presentvalue, but the appropriate discount rate to use is not always obvious. Ratherthan attempting to determine the appropriate discount rate precisely, we cantake the breakeven approach and ask how high would the discount rate haveto be in order for this project to have an NPV of zero? (The answer to thisquestion is generally known as the internal rate of return.) If the answer is28 percent, we can be confident that the project is a good investment. Onthe other hand, if breakeven occurs at 9 percent, we may want to do furtherresearch to establish whether the appropriate discount rate is clearly belowthis level.
Breakeven values for parameters can be determined manually, by repeat-edly changing input values until the output reaches the desired target. Thiscan often be done fairly quickly by an intelligent trial-and-error search in Ex-cel. In the Advertising Budget example, suppose we want to find the breakevencost to the nearest penny. Recall our example earlier, where we noted thatprofit goes to zero between a unit cost of $29 and a unit cost of $30. Byrepeating the search between these two costs in steps of $0.10, we can findthe breakeven cost to the nearest dime. If we repeat the search once more, insteps of $0.01, we will obtain the value at the precision we seek.
However, Excel also provides a specialized tool called Goal Seek (in theTools menu) for performing this type of search. The tool locates the desiredunit cost as $29.36, and the corresponding calculations will be displayed onthe spreadsheet.
Note that the Goal Seek tool searches for a prescribed level in the relationbetween a single output and a single input. Thus, it requires the parameteror decision being varied to reside in a single location, reinforcing one of ourdesign principles.
3.4 Optimization analysis
Another fundamental type of managerial question takes the form of findinga set of decision variables that achieves the best possible value of an output.In fact, we might claim that the fundamental management task is to makechoices that result in optimal outputs. Solver is an important tool for thispurpose. Solver is an add-in for Excel that makes it possible to optimizemodels with multiple decision variables and possibly constraints on the choiceof decision variables. Optimization is a complex subject, and we can onlyprovide a glimpse of its power here by demonstrating a simple application inthe Advertising Budget example.
Suppose we wish to maximize total profits with an advertising budget of$40, 000. We already know that, with equal expenditures in every quarter,annual profits come to $69, 662. The question now is whether we can achievea higher level of annual profits. The answer is that a higher level is, in fact,
10

Stephen G. Powell
attainable. An optimal reallocation of the budget produces annual profitsof $71, 447. The chart in Figure 6 compares the allocation of the budgetin the base case with the optimal allocation. As we can see, the optimalallocation calls for greater expenditures in quarters Q2 and Q4 and for smallerexpenditures in Q1 and Q3.
This is just one illustration of Solver’s power. Among the many questionswe could answer with Solver in the Advertising Budget example are these:
• What would be the impact of a requirement to spend at least $8, 000 eachquarter?
• What would be the marginal impact of increasing the budget?
• What is the optimal budget size?
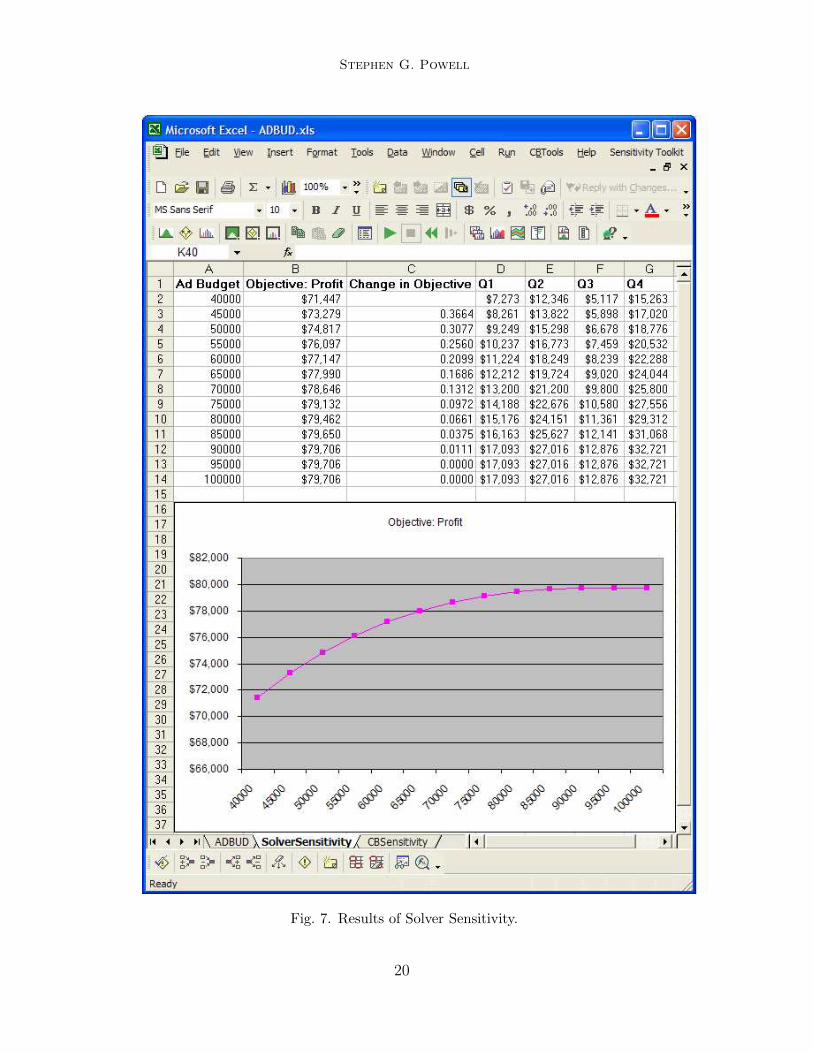
One way to answer this last question would be to run Solver with increasingbudgets and trace out the impact on profit. We could do this manually, onerun at a time, but it would be more convenient to be able to accomplishthis task in one step. The Sensitivity Toolkit contains a tool called Solver
Sensitivity that does just this: it runs Solver in a loop while varying one(or two) input parameters. Figure 7 shows the results of running Solver foradvertising budgets from $40, 000 to $100, 000 in increments of $5, 000. Thetable shows that profit increases at a decreasing rate as the budget increases,and beyond about $90, 000 there is no discernible impact from additionalbudget. It also shows how the four decision variables (Q1–Q4 advertising)change as the budget changes.
3.5 Simulation and risk analysis
Uncertainty often plays an important role in analyzing a decision, because withuncertainty comes risk. Until now, we have been exploring the relationshipbetween the inputs and outputs of a spreadsheet model as if uncertainty werenot an issue. However, risk is an inherent feature of all managerial decisions,so it is frequently an important aspect of spreadsheet models. In particular,we might want to recognize that some of the inputs are subject to uncertainty.In other words, we might want to associate probability models with some ofthe parameters. When we take that step, it makes sense to look at outputsthe same way — with probability models. The use of probability models inthis context is known as risk analysis.
One tool for risk analysis in spreadsheets is Crystal Ball, an add-in forMonte Carlo simulation (another is @Risk [5]). This tool allows us to gen-erate a probability distribution for any output cell in a spreadsheet, givenprobability assumptions about some of the input cells. Simulation and riskanalysis are complex subjects. Here, we simply illustrate how Crystal Ball canhelp us answer an important question about risk.
In the Advertising Budget example, we return to the base case, with equalexpenditures of $10, 000 on advertising each quarter. Our base-case analysis,
11
Stephen G. Powell
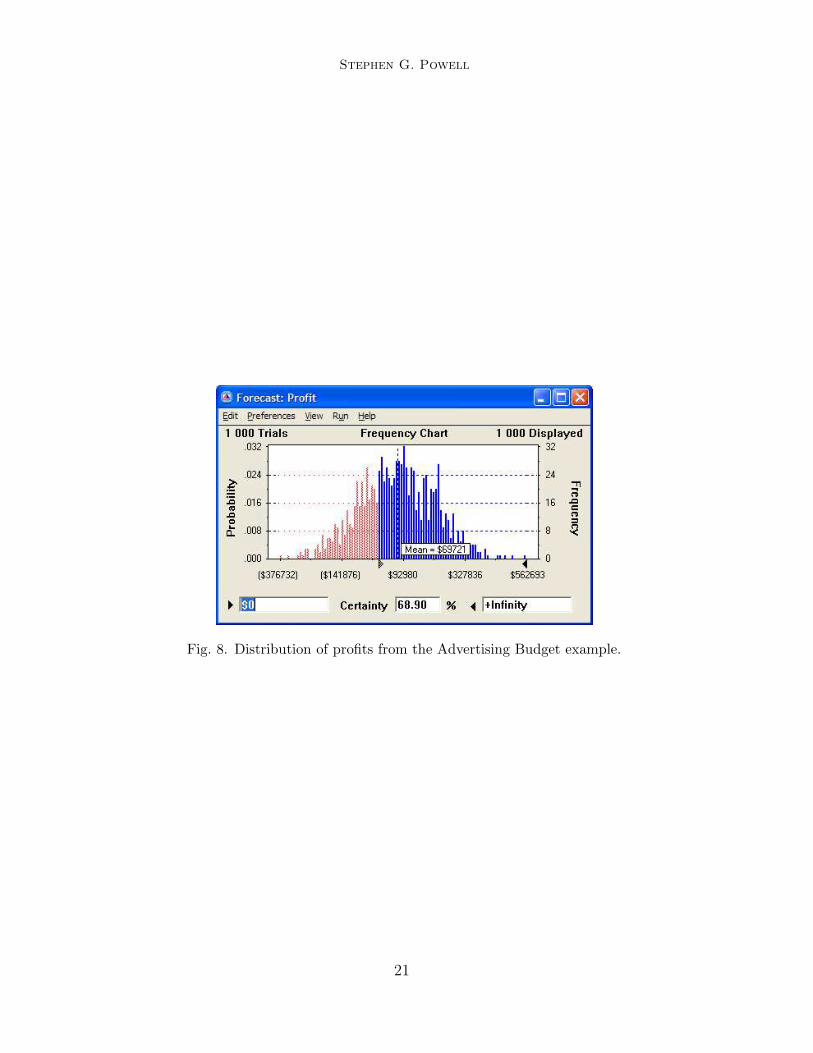
which assumed that all parameters are known exactly, showed an annual profitof $69, 662. However, we might wonder about the distribution of profits ifthere is uncertainty about the unit price and the unit cost. Future pricesdepend on the number of competitors in our market, and future costs dependon the availability of raw materials. Since both level of competition and rawmaterial supply are uncertain, so, too, are the parameters for our price andcost. Suppose we assume that price is normally distributed with a mean of$40 and a standard deviation of $10, and that unit cost is equally likely tofall anywhere between $20 and $30. Given these assumptions, what is theprobability distribution of annual profits? And how likely is it that profitswill be negative?
Figure 8 shows the probability distribution for profits in the form of ahistogram, derived from the assumptions we made about price and cost. Thegraph shows us that the estimated average profit is $69, 721 under our as-sumptions. It also shows that the probability is about 30 percent that we willlose money. This exposure may cause us to reevaluate the desirability of thebase-case plan.
Once again, we often wish to know how sensitive our simulation results areto one or more input parameters. This suggests running Crystal Ball in a loopwhile we vary the inputs, and to do so we have included the appropriate tool,called CB Sensitivity, in the Sensitivity Toolkit. Figure 9 shows the resultsof running Crystal Ball while we vary the budget from $40, 000 to $100, 000 inincrements of $5, 000, keepting advertising spending equal across the quarters.We plot here not only the mean profit, but the maximum and minimum valuesfrom each of the simulations, to give an idea of the range of outcomes likelyat each step.
4 Research Issues
In contrast to software engineering, which has seen decades of development,spreadsheet engineering is in its infancy. Most of the ideas in this paperhave been adapted from software engineering and tested informally in variousinstructional settings. However, there is little laboratory or field researchto support claims that one or another spreadsheet engineering principle iseffective in actual practice.
Spreadsheet engineers are fundamentally different from software engineers.Most of them would not describe themselves as programmers and most are notaware that they are under-trained for the spreadsheet design and analysis tasksthey perform. Few recognize the risks they and their companies run when theyuse chaotic development processes or fail to use the powerful analytic toolsdescribed here.
The research needs are clear, although how best to carry out this kind of re-search is not. We need to know much more than we do about how spreadsheetsare designed and used in industry. We also need to test various interventions,
12

Stephen G. Powell
including training programs and software add-ins, to see which really improvepractice and which do not. We also need to study how corporate standardsfor training and use of spreadsheets influence the culture and performance ofend-users. While spreadsheet programming has little cache in the computerscience profession, it is likely that more computer programs are written bythe millions of spreadsheet end-users than all professional programmers com-bined. The positive impacts of improving this aspect of programming practiceare correspondingly high.
References
[1] Panko, Ray, What We Know About Spreadsheet Errors, Journal of End User
Computing, Special issue on Scaling Up End User Development, Volume 10, No2. Spring 1998, pp. 15-21.
[2] Powell, Stephen G. and Kenneth Baker, The Art of Modeling with Spreadsheets,New York: John Wiley, 2004.
[3] Solver: http://www.solver.com/
[4] Crystal Ball: http://www.decisioneering.com/crystal ball/index.html/
[5] @Risk: http://www.palisade.com/html/risk.asp
13

Stephen G. Powell
Fig. 1. The advertising budget spreadsheet.
14
Stephen G. Powell
Fig. 2. A graph based on the Data Sensitivity.
15

Stephen G. Powell
Fig. 3. Two-way Data Sensitivity: profit as a function of Q1 and Q2 advertising.
16
Stephen G. Powell
Fig. 4. Tornado Chart using the Constant Percentage option.
17

Stephen G. Powell
Fig. 5. Tornado Chart using the Variable Percentage option.
18

Stephen G. Powell
Fig. 6. Comparison of base-case and optimal allocations.
19
Stephen G. Powell
Fig. 7. Results of Solver Sensitivity.
20
Stephen G. Powell
Fig. 8. Distribution of profits from the Advertising Budget example.
21

Stephen G. Powell
Fig. 9. Results of CB Sensitivity.
22


![Literatur- und Quellenverzeichnissundoc.bibliothek.uni-halle.de/diss-online/04/04H163/t7.pdfAnhang Literaturverzeichnis [ERWIG 1994] ERWIG, M. (1994): Graphs in Spatial Databases.Doktorarbeit,](https://static.fdocuments.net/doc/165x107/5f8f848ab9e14120e86abc62/literatur-und-quel-anhang-literaturverzeichnis-erwig-1994-erwig-m-1994-graphs.jpg)


