
Spps Solution
15
Q1. Collect the data from your class mates regarding height and classify the gender by assigning values to it. Also collect the marks of all the students in the class and sort them as to know who stands first in the class? SOLUTION WITH GRAPH-: gender Frequency Percent Valid Percent Cumulative Percent Valid male 3390 65.2 65.2 65.2 female 1813 34.8 34.8 100.0 Total 5203 100.0 100.0
Transcript of Spps Solution

8/2/2019 Spps Solution
http://slidepdf.com/reader/full/spps-solution 1/15
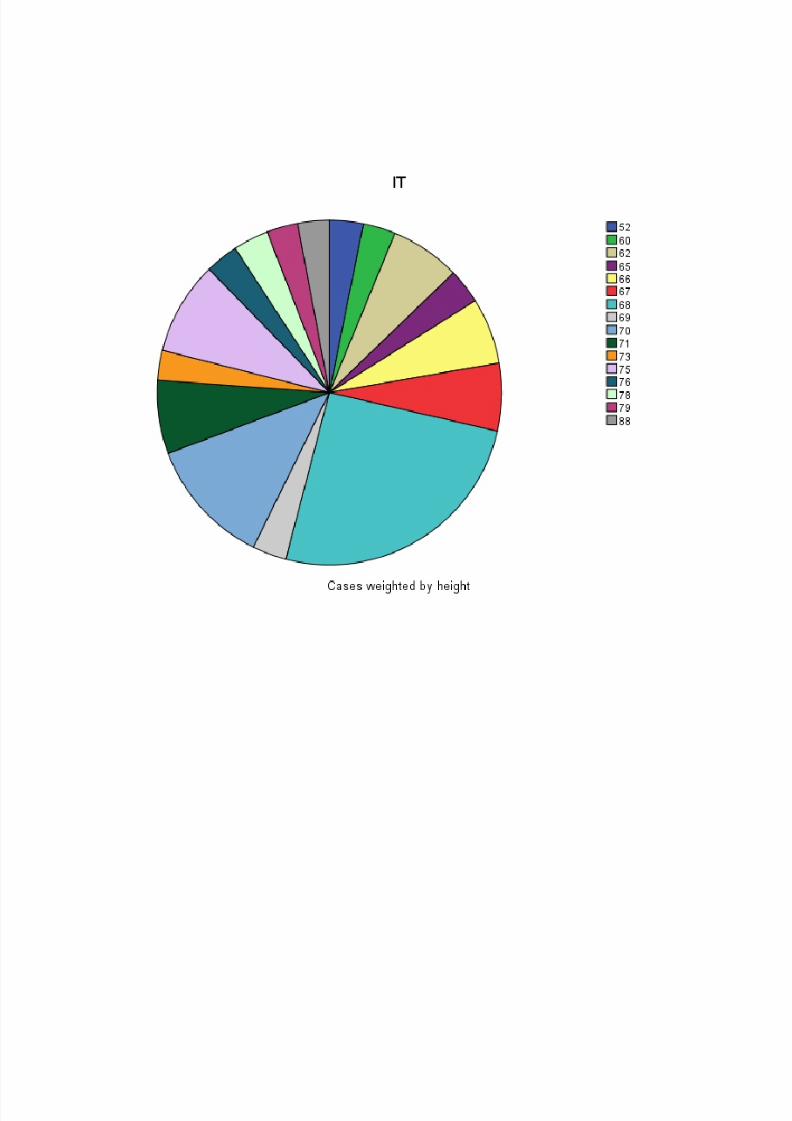
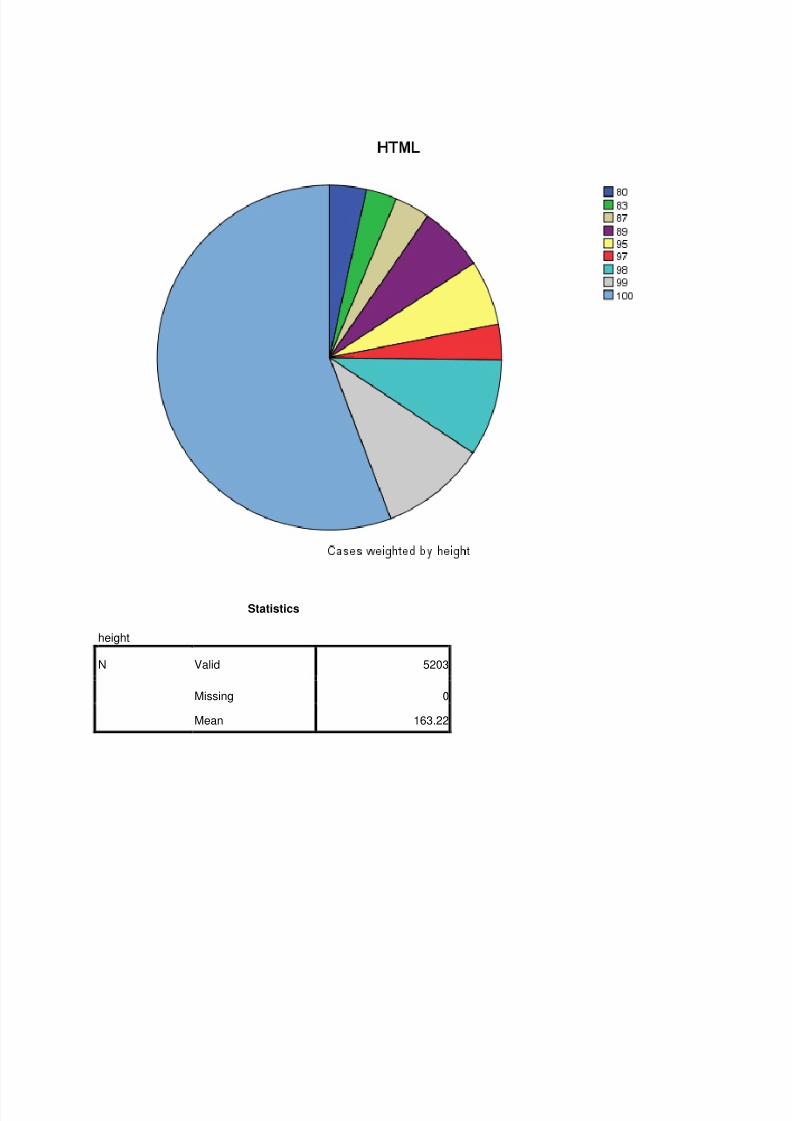
Q1. Collect the data from your class mates regarding height and classify the gender
by assigning values to it. Also collect the marks of all the students in the class and
sort them as to know who stands first in the class?
SOLUTION WITH GRAPH-:
gender
Frequency Percent Valid Percent
Cumulative
Percent
Valid male 3390 65.2 65.2 65.2
female 1813 34.8 34.8 100.0
Total 5203 100.0 100.0
8/2/2019 Spps Solution
http://slidepdf.com/reader/full/spps-solution 2/15
8/2/2019 Spps Solution
http://slidepdf.com/reader/full/spps-solution 3/15
Statistics
height
N Valid 5203
Missing 0
Mean 163.22

8/2/2019 Spps Solution
http://slidepdf.com/reader/full/spps-solution 4/15
Q2. Calculate co-efficient of correlation X series & Y series using karl pearson’smethod?
X series Y series
14 13
12 11
14 10
16 15
16 15
17 9
16 14
15 17
SOLUTION-:
Correlations
x series y series
x series Pearson Correlation 1 .192
Sig. (2-tailed) .648
N 8 8
y series Pearson Correlation .192 1
Sig. (2-tailed) .648
N 8 8

8/2/2019 Spps Solution
http://slidepdf.com/reader/full/spps-solution 5/15
Q3. Calculate co-efficient of correlation of karl pearson’s method from thefollowing:
Marks in Economics Marks in statistics65 67
66 68
67 65
67 68
68 72
69 72
70 69
72 71
SOLUTION-:
Correlations
marks in eco marks in statics
marks in eco Pearson Correlation 1 .603
Sig. (2-tailed) .114
N 8 8
marks in statics Pearson Correlation .603 1
Sig. (2-tailed) .114
N 8 8
8/2/2019 Spps Solution
http://slidepdf.com/reader/full/spps-solution 6/15
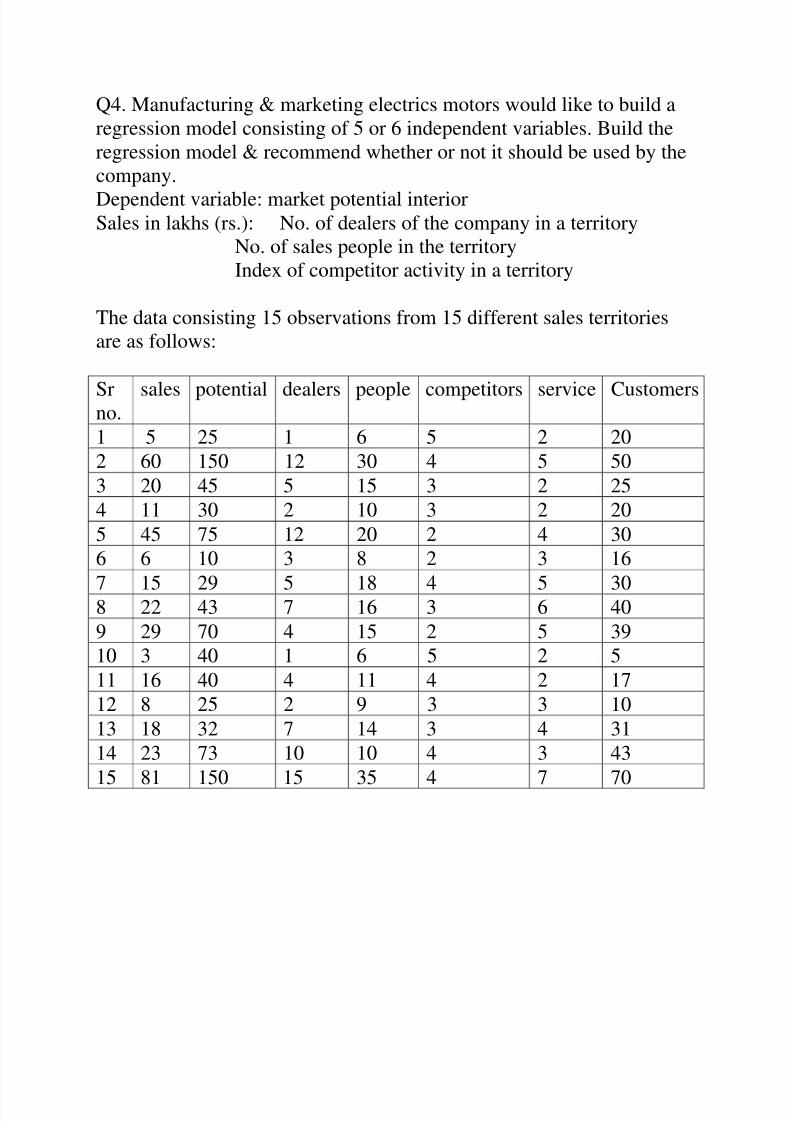
Q4. Manufacturing & marketing electrics motors would like to build a
regression model consisting of 5 or 6 independent variables. Build the
regression model & recommend whether or not it should be used by the
company.
Dependent variable: market potential interiorSales in lakhs (rs.): No. of dealers of the company in a territory
No. of sales people in the territory
Index of competitor activity in a territory
The data consisting 15 observations from 15 different sales territories
are as follows:
Srno.
sales potential dealers people competitors service Customers
1 5 25 1 6 5 2 20
2 60 150 12 30 4 5 50
3 20 45 5 15 3 2 25
4 11 30 2 10 3 2 20
5 45 75 12 20 2 4 30
6 6 10 3 8 2 3 16
7 15 29 5 18 4 5 308 22 43 7 16 3 6 40
9 29 70 4 15 2 5 39
10 3 40 1 6 5 2 5
11 16 40 4 11 4 2 17
12 8 25 2 9 3 3 10
13 18 32 7 14 3 4 31
14 23 73 10 10 4 3 43
15 81 150 15 35 4 7 70

8/2/2019 Spps Solution
http://slidepdf.com/reader/full/spps-solution 7/15
SOLUTION-:
Coefficientsa
Model
Unstandardized
Coefficients
Standardize
d
Coefficients
B Std. Error Beta t Sig.
1 (Constant) -3.173 5.813 -.546 .600
Potential in territory
(Rs.in lacs)
.227 .075 .439 3.040 .016
No of dealers .819 .631 .164 1.298 .230
No of sales people 1.091 .418 .414 2.609 .031
Index of competitors
activity
-1.893 1.340 -.085 -1.413 .195
No of service people -.549 1.568 -.041 -.350 .735
No of existing
customers
.066 .195 .050 .338 .744
a. Dependent Variable: Sales in territory(Rs.lacs)
8/2/2019 Spps Solution
http://slidepdf.com/reader/full/spps-solution 8/15
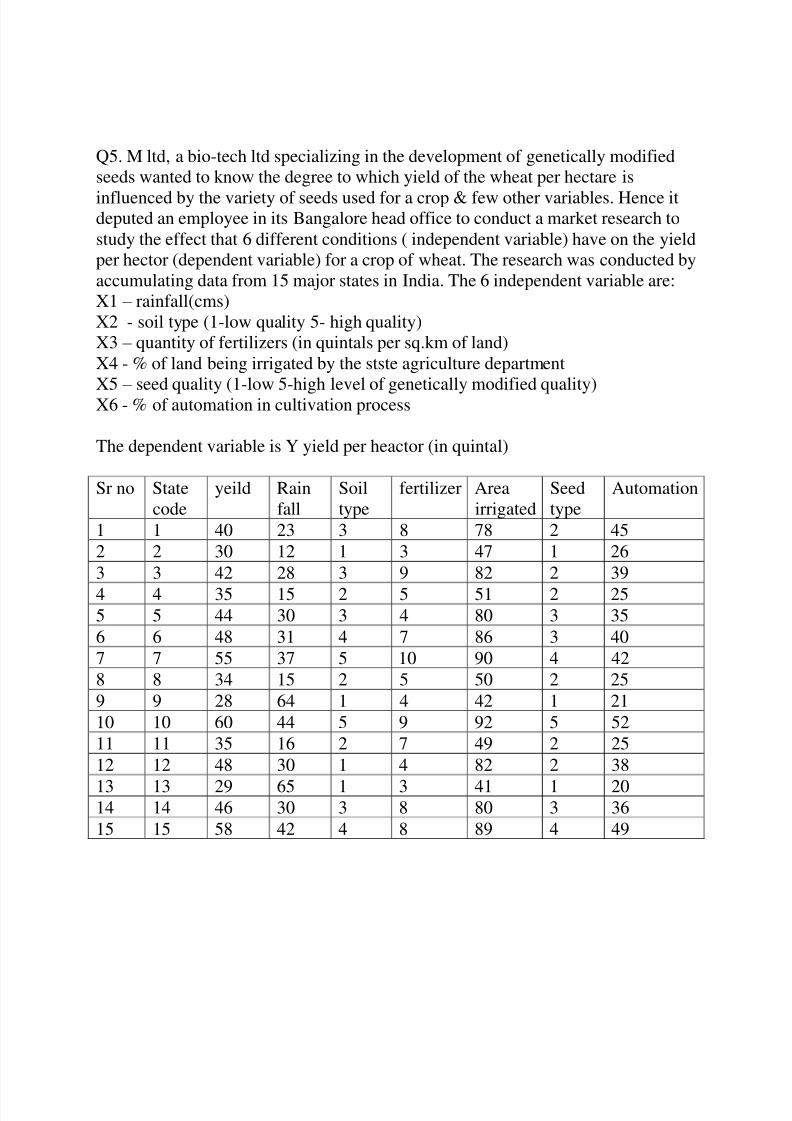
Q5. M ltd, a bio-tech ltd specializing in the development of genetically modified
seeds wanted to know the degree to which yield of the wheat per hectare is
influenced by the variety of seeds used for a crop & few other variables. Hence itdeputed an employee in its Bangalore head office to conduct a market research to
study the effect that 6 different conditions ( independent variable) have on the yield
per hector (dependent variable) for a crop of wheat. The research was conducted by
accumulating data from 15 major states in India. The 6 independent variable are:
X1 – rainfall(cms)
X2 - soil type (1-low quality 5- high quality)
X3 – quantity of fertilizers (in quintals per sq.km of land)
X4 - % of land being irrigated by the stste agriculture department
X5 – seed quality (1-low 5-high level of genetically modified quality)X6 - % of automation in cultivation process
The dependent variable is Y yield per heactor (in quintal)
Sr no State
code
yeild Rain
fall
Soil
type
fertilizer Area
irrigated
Seed
type
Automation
1 1 40 23 3 8 78 2 45
2 2 30 12 1 3 47 1 26
3 3 42 28 3 9 82 2 39
4 4 35 15 2 5 51 2 255 5 44 30 3 4 80 3 35
6 6 48 31 4 7 86 3 40
7 7 55 37 5 10 90 4 42
8 8 34 15 2 5 50 2 25
9 9 28 64 1 4 42 1 21
10 10 60 44 5 9 92 5 52
11 11 35 16 2 7 49 2 25
12 12 48 30 1 4 82 2 38
13 13 29 65 1 3 41 1 2014 14 46 30 3 8 80 3 36
15 15 58 42 4 8 89 4 49

8/2/2019 Spps Solution
http://slidepdf.com/reader/full/spps-solution 9/15
SOLUTION-:
Correlations
yeild produced
Fertilizer in
quintal
Fertilizers used
in the state
yeild produced Pearson Correlation 1 .848**
.701**
Sig. (2-tailed) .000 .004
N 15 15 15
Fertilizer in quintal Pearson Correlation .848
**
1 .847
**
Sig. (2-tailed) .000 .000
N 15 15 15
Fertilizers used in the
state
Pearson Correlation .701**
.847**
1
Sig. (2-tailed) .004 .000
N 15 15 15
irrigation carried in the
area
Pearson Correlation .930**
.813**
.707**
Sig. (2-tailed) .000 .000 .003
N 15 15 15
seed quality Pearson Correlation .937**
.919**
.713**
Sig. (2-tailed) .000 .000 .003
N 15 15 15
Automation Pearson Correlation .916**
.818**
.736**
Sig. (2-tailed) .000 .000 .002
N 15 15 15
Rain fall in cm Pearson Correlation .067 .024 -.067
Sig. (2-tailed) .813 .932 .811
N 15 15 15
**. Correlation is significant at the 0.01 level (2-tailed).

8/2/2019 Spps Solution
http://slidepdf.com/reader/full/spps-solution 10/15
Q6. Data is available for 15 customers of the brand each in Mumbai &
delhi. The customer were asked to rate the brand on a 7 point scale. The
response of all 30 customers is in column labeled rating in the table
The column city indicates – city from where the rating came
1 – Mumbai
2 - Delhi
Present the output from the independent sample ‘t’ test performed on the
data.
Sr no. Ratings City
1 2 12 3 1
3 3 1
4 4 1
5 5 1
6 4 1
7 4 1
8 5 1
9 3 110 4 1
11 5 1
12 4 1
13 3 1
14 3 1
15 4 1
16 3 2
17 4 218 5 2
19 6 2
20 5 2
21 5 2
22 5 2

8/2/2019 Spps Solution
http://slidepdf.com/reader/full/spps-solution 11/15
23 4 2
24 3 2
25 3 2
26 5 2
27 6 228 6 2
29 6 2
30 5 2
SOLUTION-:
Independent Samples Test
t-test for Equality of Means
df Sig. (2-tailed) Mean Difference
Ratings by customers Equal variances assumed 28 .010 -1.000
Equal variances not assumed 26.759 .011 -1.000

8/2/2019 Spps Solution
http://slidepdf.com/reader/full/spps-solution 12/15
Q7. Assume that the sample of 18 respondents whom were asked to rate on a 10
point interval scale. Their attitude towards a brand of garments before and after an
ad campaign was released for the brand.
Ratings:
1 – brand highly disliked
10 – brand is highly disliked
With other ratings having appropriate meaning, the first column contains ratings
given by respondent before this of ad campaign & column 2 represents the rating
after they saw the ad campaign.
Sr no Before ad campaign After ad campaign
1 3 5
2 4 6
3 2 6
4 5 75 3 8
6 4 4
7 5 6
8 3 7
9 4 5
10 2 4
11 2 6
12 4 7
13 1 414 3 6
15 6 8
16 3 4
17 2 5
18 3 6

8/2/2019 Spps Solution
http://slidepdf.com/reader/full/spps-solution 13/15
SOLUTION-:
Paired Samples Test
Paired Differences
t df Sig. (2-tailed)Mean
Std.
Deviation
Std. Error
Mean
95% Confidence Interval of
the Difference
Lower Upper
Pair 1 preference
before campaign
- preference
after campaign
-2.500 1.295 .305 -3.144 -1.856 -8.192 17 .0

8/2/2019 Spps Solution
http://slidepdf.com/reader/full/spps-solution 14/15
Q8. A sample of 18 observations assumes that the magazines in which
the ad copy appears may have an impact on ratings. The hypothesis to be
tested using the data the variables bring rating as the dependent variable,
add copy as a factor and magazine as the block, the magazine appears
could be influenced the ratings given to the ad copy by the respondent.
Sr no. Ad copy ratings
1 1 6.00
2 1 7.00
3 1 5.00
4 1 8.00
5 1 8.00
6 1 8.00
7 2 4.00
8 2 4.00
9 2 5.00
10 2 7.00
11 2 7.00
12 2 6.00
13 3 5.00
14 3 5.00
15 3 4.00
16 3 7.00
17 3 8.00
18 3 7.00

8/2/2019 Spps Solution
http://slidepdf.com/reader/full/spps-solution 15/15
Versions of the ad copy are of 3 different versions which has been
created by an advertising agency for the campaign the ad agency wants
to test which of these 3 version of this advertising copy is preferred bythis target population before the campaign at random. 18 respondents are
assigned to the 3 versions of which are shown to 6 of the respondent.
The respondents are asked to rate the like to show to their on preference
1 – do not like at all
10 - like a lot
SOLUTION-:
ratings by customers
Sum of Squares df Mean Square F Sig.
Between Groups 7.000 2 3.500 1.780 .203
Within Groups 29.500 15 1.967
Total 36.500 17


![Overview - Learning · file:////Ds01/spps/90_Bearbeitung/help/en/lernen/01_grundlagen/01_tut_02_02_installation_en.html[24.01.2017 09:56:00] After login in XENTRY Portal, SPPS is](https://static.fdocuments.net/doc/165x107/5b9fb02009d3f267388b9d27/overview-learning-fileds01spps90bearbeitunghelpenlernen01grundlagen01tut0202installationenhtml24012017.jpg)


![ROBUST SOLUTION OF SINGULARLY PERTURBED PROBLEMS …niall/Research/MultiGrid_RD_300812.pdf · Robust solution of SPPs using multigrid methods 3 We shall assume that ε∈ (0,1] and](https://static.fdocuments.net/doc/165x107/5e9752b1f4f00c1b8905ec86/robust-solution-of-singularly-perturbed-problems-niallresearchmultigridrd300812pdf.jpg)


