SPICOSA Science and Policy Integration for COastal System Assesment
31
Science and Policy Integration for COastal Systems Assessment SPICOSA Science and Policy Integration for COastal System Assesment <Lecturer’s name here>
-
Upload
avram-carrillo -
Category
Documents
-
view
19 -
download
1
description
SPICOSA Science and Policy Integration for COastal System Assesment . SPICOSA – using the Systems Approach in the Coastal Zone. Course structure. Coastal zones and the system approach An overview of SPICOSA Working with stakeholders - PowerPoint PPT Presentation
Transcript of SPICOSA Science and Policy Integration for COastal System Assesment

Science and Policy Integration for COastal Systems Assessment
SPICOSA
Science and Policy Integration
for COastal System Assesment
<Lecturer’s name here>

Science and Policy Integration for COastal Systems Assessment
SPICOSA – using the Systems Approach in the Coastal Zone

Science and Policy Integration for COastal Systems Assessment
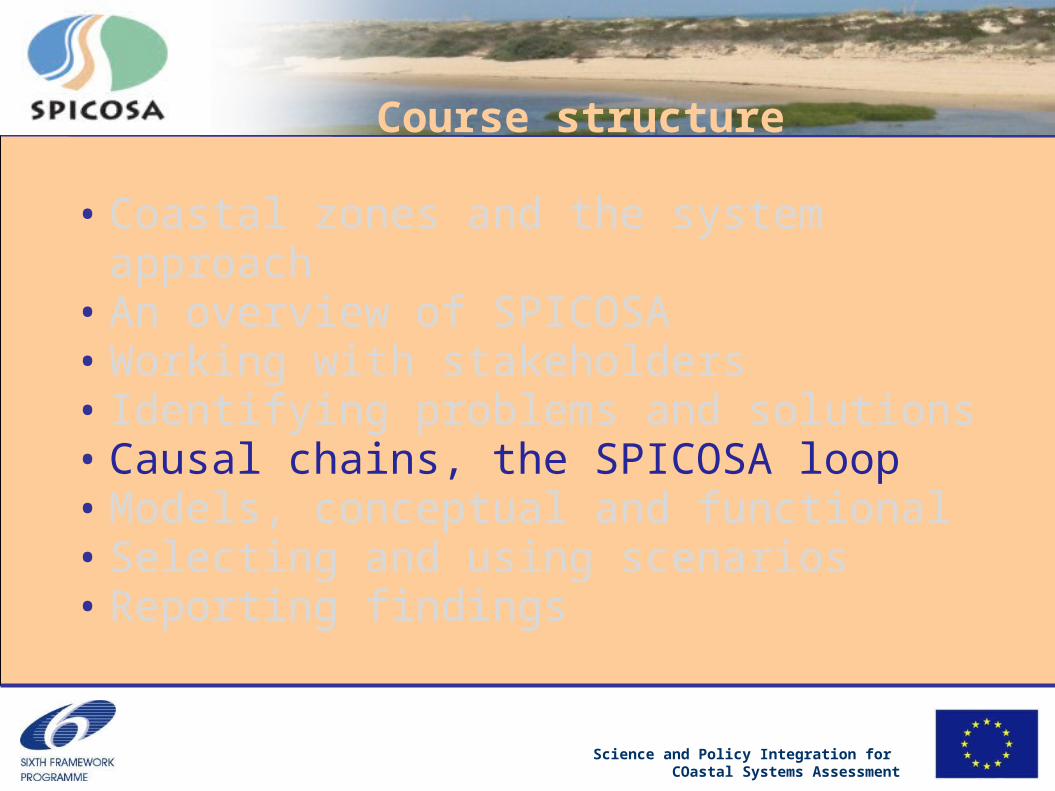
• Coastal zones and the system approach• An overview of SPICOSA• Working with stakeholders• Identifying problems and solutions• Causal chains, the SPICOSA loop• Models, conceptual and functional• Selecting and using scenarios• Reporting findings
Course structure
Science and Policy Integration for COastal Systems Assessment
• Coastal zones and the system approach• An overview of SPICOSA• Working with stakeholders• Identifying problems and solutions• Causal chains, the SPICOSA loop• Models, conceptual and functional• Selecting and using scenarios• Reporting findings
Course structure

Science and Policy Integration for COastal Systems Assessment
The
SPICOSA
loopImpact
How response influences HAs
System State
The state at a given time
Response
How the state is changing
Policy Change
Society’s reaction to the impact
Forcing
What an HA does to the system
Human Activity
What humans do

Science and Policy Integration for COastal Systems Assessment
Example:
<Insert site name and issue>
INSERT PICTURE

Science and Policy Integration for COastal Systems Assessment
Human Activity <insert example
of HA>
<Insert example> is an Human Activity (HA). The term HA refers to human intervention in the function and structure of natural systems.
INSERT PICTURE

Science and Policy Integration for COastal Systems Assessment
Forcing <insert example>
Physical pressure is a force per unit area. `Nutrient loading' implies an increase in nutrients over what was a `normal' level.
INSERT PICTURE

Science and Policy Integration for COastal Systems Assessment
System state <insert example>
where `State' or `Status' represent the situation at a specific time.
INSERT PICTURE

Science and Policy Integration for COastal Systems Assessment
Response <insert example>
A forced rate of change in the ecosystem. Eutrophication would be seen as part of this.
INSERT PICTURE

Science and Policy Integration for COastal Systems Assessment
Impact <insert example>
SPICOSA takes `Impact' as the end-result in a cause-&-effect chain, with direct consequences for ecosystem users, such as those involving harm to a fishery from deep-water anoxia.
INSERT PICTURE

Science and Policy Integration for COastal Systems Assessment
Policy change <insert example>
SPICOSA does not pre-suppose what type of Policy decision should be made. It provides scenarios to show policy makers what will occur, given certain management choices.
INSERT PICTURE

Science and Policy Integration for COastal Systems Assessment
The
SPICOSA
loopImpact
<Insert example here>
System State
<Insert example here>
Response
<Insert example here>
Policy Change
<Insert example here>
Forcing
<Insert example here>
Human Activity
<Insert example here>

Science and Policy Integration for COastal Systems Assessment
Course structure
• Coastal zones and the system approach
• An overview of SPICOSA
• Working with stakeholders
• Identifying problems and solutions
• Causal chains, the SPICOSA loop
• Models, conceptual and functional
• Selecting and using scenarios
• Reporting findings

Science and Policy Integration for COastal Systems Assessment
Models
• A tool to represent the real world in a way that can be used to understand how the system works and make forecasts.
• Can be used to give an idea of the effect of different management options.
• Models may be conceptual, mathematical or numerical.

Science and Policy Integration for COastal Systems Assessment
Types of models
• Conceptual Model- a pictorial or verbal description of selected features of a system, usually made inductively and capable of qualitative predictions by deduction
• Mathematical Model- a formal mathematical representation of selected features of a system
• Numerical Model- a tool based on a mathematical model; a transformation machine that takes data from an input and converts it to a prognostic or diagnostic output; often implemented as, or using, a computer program.

Science and Policy Integration for COastal Systems Assessment
Data requirements• What metric will you
use for each variable?
• Clear link with your issue of interest.
• Time series
• Common collection method throughout
• Apples with apples
• Same time steps
• Modelled data
Year
P fertilizer application
[MT]
N fertiliser application
[MT]1992 2827187 7983891993 2710551 7286091994 2928473 7467211995 2896038 7246711996 2964283 7306621997 2907004 7105561998 2916792 6879741999 2972749 6584342000 2743716 5769832001 2763493 555800
FAO North Sea fertilizer use data http://faostat.fao.org

Science and Policy Integration for COastal Systems Assessment
Nitrate fertiliser use
Nitrate concentration
Verification
Calibration
X 2
X 1.6
SensitivitySewage discharge X 1.1
X 2
X 7
Is the response logical?Make the model realisticDo input parameters balance correctly?
?

Science and Policy Integration for COastal Systems Assessment
Build ESE
component modelsA set of simple ESE models Associated with fishereies

Science and Policy Integration for COastal Systems Assessment
Linking variables
A variable which can be linked to components of components to allow them to interact
Science and Policy Integration for COastal Systems Assessment
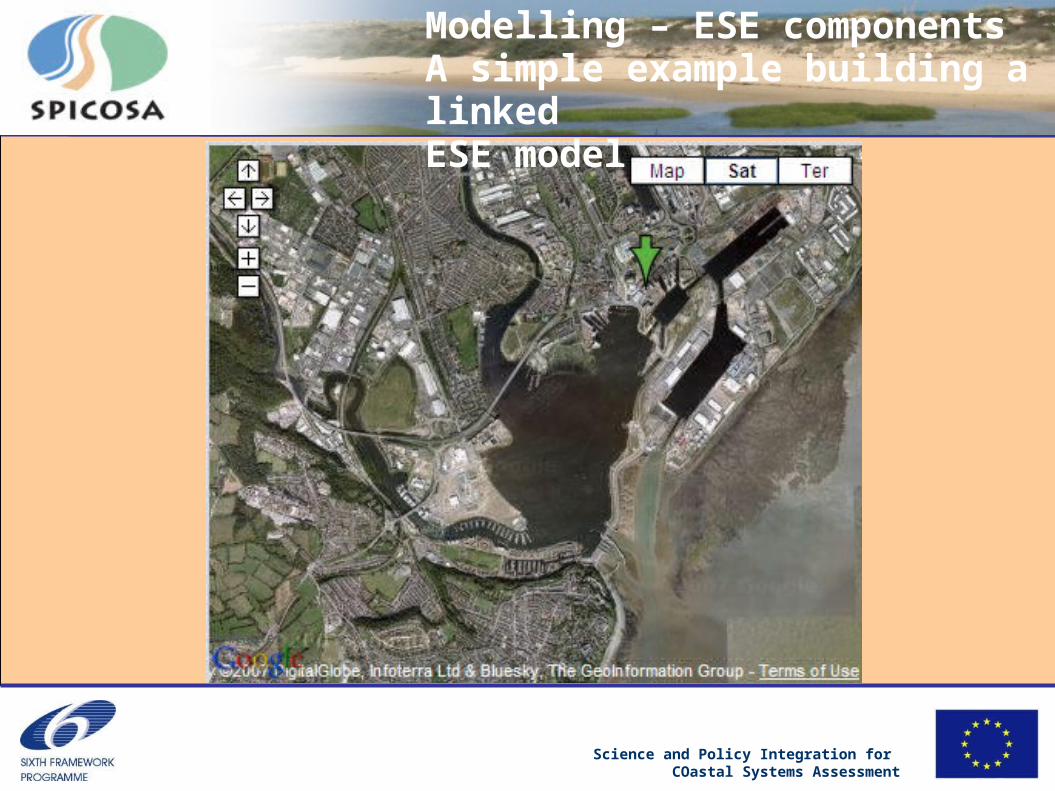
Modelling – ESE componentsA simple example building a linked ESE model

Science and Policy Integration for COastal Systems Assessment
Conceptual models
Rain and riverine inputsRain and riverine inputs
Water level
Pollution level
IndustryIndustry
WeirWeir
EvaporationEvaporation
TourismTourism
HydroelectricityHydroelectricityIrrigationIrrigation
€
Water treatmentWater treatment

Science and Policy Integration for COastal Systems Assessment
Water levels in the Bay
o Influence:
Rainfall
Evaporation - 0.003 m-3/day.
Water loss from the weirs in the barrage which takes 100000m3 water/day when the bay level is greater than 500 000 000 m3.

Science and Policy Integration for COastal Systems Assessment

Science and Policy Integration for COastal Systems Assessment
Pollution inputs
o Industry – 200 businesses in the area abstract water from the bay as coolant; these return with heavy metals at a rate of 0.0001 Kg/day.
o Pollution amount is reduced by outflow from the weir into the Bristol Channel at concentration level.
oAmount not reduced by evaporation.

Science and Policy Integration for COastal Systems Assessment

Science and Policy Integration for COastal Systems Assessment
Economics
o The port authority is paid £0.15 per factory/day abstracting coolant from the bay.
o Tourists visit the Bay and spend an average of £20 a day.
o Tourists will only come if the concentration of heavy metals is below 3 x 10⁻⁷ kgm-3 where signs will be posted on the beaches warning of pollution.
o Money is available to develop a treatment plant to remove heavy metals at a cost of £0.01 per m3 of water.

Science and Policy Integration for COastal Systems Assessment

Science and Policy Integration for COastal Systems Assessment
Model created for
<case study name>
Rain and riverine inputs
Rain and riverine inputs
Water level
Pollution level
IndustryIndustry
WeirWeir
EvaporationEvaporation
TourismTourism
HydroelectricityHydroelectricity
IrrigationIrrigation
€
Water treatmentWater treatment
INSERT MODEL DIAGRAM
INSERT MODEL DIAGRAM

Science and Policy Integration for COastal Systems Assessment
Exercise 3Conceptual
model

Science and Policy Integration for COastal Systems Assessment
Tomorrow:Scenarios and
reporting to stakeholders