SPEN Initiation Report July 10 2013
41
Sri Lanka | Diversified Holdings EQUITY RESEARCH Initiation of coverage 10 July 2013 Aitken Spence PLC (SPEN) 1 A capital marke t development initiative by the Colombo Stock Exchange in a ssociation with Amba Research A play on tourism and power Aitken Spence PLC (SPEN), the third-largest conglomerate listed on the Colombo Stock Exchange (CSE) by market cap, has operations in the tourism, power, logistics and services industries, as well as smaller interests in a number of other businesses. We forecast SPEN to post a revenue CAGR of 3.4% over FY14E-FY16E. This modest revenue growth partly reflects the company’s significant exposure to the power sector, where the potential non- renewal of power purchasing agreements (PPAs) could hurt SPEN’s growth prospects. However, growth in SPEN’s tourism segment should offset the decline in its power operations. Our DCF valuation analysis and P/E analysis suggest a valuation range of LKR110-157, compared with the share price of LKR124 as of 9 July 2013. We expect SPEN’s revenues to increase at a 3.4% CAGR over FY14E-FY16E. The group’s top-line growth should be fuelled mainly by the tourism segment, which comprises hotels in Sri Lanka, the Maldives, Oman and India. A 13.8% addition to room inventory, a 430bps increase in blended occupancy levels and rising average room rates (ARRs) should boost the segment’s revenue over the forecast period. This, together with a modest 5.3% revenue CAGR over FY14E-FY16E from the cargo logistics and services segments, should help compensate for the anticipated 4.8% CAGR decline in the strategic investments segment revenue over the forecast period. We expect SPEN’s EBITDA margin to rise 290bps to 21.6% in FY16E. SPEN’s tourism segment accounted for 38% of overall firm revenue but 62% of EBITDA in FY13. Accordingly, the 150bps margin expansion in the tourism segment to 31.5% in FY16E will have a significant impact on SPEN’s overall EBITDA margin. The strategic investments segment’s EBITDA margin should increase marginally from its FY13 level to 10.8% in FY16E. Downside risk to margins comes from the possible renewal of the PPAs for the Matara and Horana thermal power plants, since the revised prices are likely to be below the original contract prices. In our view, the cargo logistics segment’s EBITDA margin should remain at its FY13 level of 13.0%, as new businesses in Fiji and in Bangladesh should compensate for the loss of contracts in Africa. Low net debt and stable cash generation should allow for further investment. SPEN has been able to maintain a low net debt position compared to its close local peers, despite new projects typically being funded by debt. A long-term debt-to- capital ratio of less than 30% and stable free cash flow (FCF) generation over the past few years (the company’s FCF has ranged from LKR1.2bn to LKR4.1bn over the past five years, with negative FCF posted only in FY12) reflects SPEN’s financial flexibility to reduce leverage further or pursue new growth opportunities should it choose to do so. We establish a share price range of LKR110-157 in FY14E, compared with the current share price of LKR124. We used DCF analysis and P/E analysis to arrive at a valuation range for the company. SPEN currently trades at a 12-month forward P/E of 13.0x FY14E; this has ranged between 10.6x-18.6x since July 2011. We have also used scenario analysis to arrive at the valuation range. Our bull-case scenario assumes a more positive tourism segment performance, with higher occupancies and ARRs, and renewal of operations at the Matara and Horana power plants, albeit a t a lower tariff rate. Our bear case assumes lower occupancies and lower ARR growth in tourism, and renewal of the PPA for the Embilipitiy a plant, upon its expiry in FY15E at a lower tariff rate. In the coming quarters, we will track SPEN’s performance across a number of key areas (see page 19) and update our valuation range in future earnings updates. Also see page 16 for potential upside/downside risks to our valuation range. Key statistics CSE/Bloomberg tickers Share price (9 July 2013) No. of issued shares (m) Market cap (USDm) Enterprise value (USDm) Free float (%) 52-week range (H/L) Avg. daily vol (shares, 1yr) Avg. daily turnover (USD ‘000) SPEN.N0000/SP EN SL LKR124 406 384 458 40% LKR139/108 324,148 301 Source: CSE, Bloomberg Note: USD/LKR = 128.7 (avg. for the 1 year ended 9 July 2013) Share price movement Source: CSE, Bloomberg Share price performance 3m 6m 12m SPEN 3% 2% 8% S&P SL 20 1% 7% 20% All Share P rice Index 3% 4% 22% Source: CSE, Bloomberg Summary financials LKRm (year end 31 March) 2013 2014E 2015E Revenue 36,606 36,042 38,015 EBITDA 6,840 6,954 7,829 EBIT 5,490 5,584 6,391 Net profit 3,267 3,875 4,486 Recurrent EPS 8.0 9.5 11.0 ROE (%) 12.3 13.1 13.6 P/E (x) 14.9 13.0 11.2 Source: SPEN, Amba estimates 80% 100% 120% 140% Jul-12 Sep-12 Nov- 12 Jan- 13 Mar-13 May-13 SPEN ASPI S&P SL 20
-
Upload
randora-lk -
Category
Documents
-
view
214 -
download
0
Transcript of SPEN Initiation Report July 10 2013

8/22/2019 SPEN Initiation Report July 10 2013
http://slidepdf.com/reader/full/spen-initiation-report-july-10-2013 1/41
Sri Lanka | Diversified Holdings EQUITY RESEARCH
Initiation of coverage 10 July 2013
Aitken Spence PLC (SPEN)
1
A capital market development initiative by the Colombo Stock Exchange in association with Amba Research
A play on tourism and powerAitken Spence PLC (SPEN), the third-largest conglomerate listed on theColombo Stock Exchange (CSE) by market cap, has operations in the tourism,power, logistics and services industries, as well as smaller interests in anumber of other businesses. We forecast SPEN to post a revenue CAGR of 3.4% over FY14E-FY16E. This modest revenue growth partly reflects thecompany’s significant exposure to the power sector, where the potential non-renewal of power purchasing agreements (PPAs) could hurt SPEN’s growthprospects. However, growth in SPEN’s tourism segment should offset thedecline in its power operations. Our DCF valuation analysis and P/E analysissuggest a valuation range of LKR110-157, compared with the share price of LKR124 as of 9 July 2013.
We expect SPEN’s revenues to increase at a 3.4% CAGR over FY14E-FY16E.The group’s top-line growth should be fuelled mainly by the tourism segment, which
comprises hotels in Sri Lanka, the Maldives, Oman and India. A 13.8% addition toroom inventory, a 430bps increase in blended occupancy levels and rising averageroom rates (ARRs) should boost the segment’s revenue over the forecast period.This, together with a modest 5.3% revenue CAGR over FY14E-FY16E from the cargologistics and services segments, should help compensate for the anticipated 4.8%CAGR decline in the strategic investments segment revenue over the forecast period.
We expect SPEN’s EBITDA margin to rise 290bps to 21.6% in FY16E. SPEN’stourism segment accounted for 38% of overall firm revenue but 62% of EBITDA inFY13. Accordingly, the 150bps margin expansion in the tourism segment to 31.5% inFY16E will have a significant impact on SPEN’s overall EBITDA margin. The strategicinvestments segment’s EBITDA margin should increase marginally from its FY13level to 10.8% in FY16E. Downside risk to margins comes from the possible renewalof the PPAs for the Matara and Horana thermal power plants, since the revised pricesare likely to be below the original contract prices. In our view, the cargo logistics
segment’s EBITDA margin should remain at its FY13 level of 13.0%, as newbusinesses in Fiji and in Bangladesh should compensate for the loss of contracts in
Africa.
Low net debt and stable cash generation should allow for further investment.SPEN has been able to maintain a low net debt position compared to its close localpeers, despite new projects typically being funded by debt. A long-term debt-to-capital ratio of less than 30% and stable free cash flow (FCF) generation over thepast few years (the company’s FCF has ranged from LKR1.2bn to LKR4.1bn over thepast five years, with negative FCF posted only in FY12) reflects SPEN’s financial flexibility to reduce leverage further or pursue new growth opportunities should itchoose to do so.
We establish a share price range of LKR110-157 in FY14E, compared with thecurrent share price of LKR124. We used DCF analysis and P/E analysis to arrive ata valuation range for the company. SPEN currently trades at a 12-month forward P/E
of 13.0x FY14E; this has ranged between 10.6x-18.6x since July 2011. We have alsoused scenario analysis to arrive at the valuation range. Our bull-case scenarioassumes a more positive tourism segment performance, with higher occupancies and
ARRs, and renewal of operations at the Matara and Horana power plants, albeit at alower tariff rate. Our bear case assumes lower occupancies and lower ARR growth intourism, and renewal of the PPA for the Embilipitiya plant, upon its expiry in FY15E ata lower tariff rate. In the coming quarters, we will track SPEN’s performance across anumber of key areas (see page 19) and update our valuation range in future earningsupdates. Also see page 16 for potential upside/downside risks to our valuation range.
Key statistics CSE/Bloomberg tickers
Share price (9 July 2013)
No. of issued shares (m)
Market cap (USDm)
Enterprise value (USDm)
Free float (%)
52-week range (H/L)
Avg. daily vol (shares, 1yr)
Avg. daily turnover (USD
‘000)
SPEN.N0000/SPEN SL
LKR124
406
384
458
40%
LKR139/108
324,148
301
Source: CSE, BloombergNote: USD/LKR = 128.7 (avg. for the 1 year ended 9 July2013)
Share price movement
Source: CSE, Bloomberg
Share price performance
3m 6m 12m
SPEN 3% 2% 8%
S&P SL 20 1% 7% 20%
All Share Price Index 3% 4% 22%
Source: CSE, Bloomberg
Summary financials
LKRm (year end31 March) 2013 2014E 2015E
Revenue 36,606 36,042 38,015
EBITDA 6,840 6,954 7,829
EBIT 5,490 5,584 6,391
Net profit 3,267 3,875 4,486
Recurrent EPS 8.0 9.5 11.0
ROE (%) 12.3 13.1 13.6
P/E (x) 14.9 13.0 11.2
Source: SPEN, Amba estimates
80%
100%
120%
140%
Jul-12 Sep-12 Nov-12 Jan-13 Mar-13 May-13
SPEN ASPI S&P SL 20

8/22/2019 SPEN Initiation Report July 10 2013
http://slidepdf.com/reader/full/spen-initiation-report-july-10-2013 2/41
Aitken Spence PLC
Table of Contents
SPEN’s revenue should grow at a 3.4% CAGR over FY14E -FY16E .................................................................................. 3 Higher room count, occupancy levels and ARRs to drive tourism revenue CAGR of 12.7% through FY16E ....................................... 3 Strategic investments segment revenue to decline at a CAGR of 4.8% over FY14E-FY16E ............................................................... 6 Cargo logistics and services segments to make a sizeable contribution to top-line growth .................................................................. 9
We anticipate a 290bps increase in EBITDA margin to 21.6% over FY14E-FY16E ......................................................... 10 Tourism segment EBITDA margin to expand 150bps over FY14E-FY16E ......................................................................................... 11 Strategic investments segment EBITDA margin likely to increase slightly to 10.8% in FY16E ........................................................... 11 Cargo logistics and services segments together make a noteworthy contribution to SPEN’s margin................................................. 11
Relatively low net debt and stable liquidity position should allow for further borrowing for new projects .......................... 12 We expect shares to trade in the range of LKR110-157 per share ................................................................................... 13
DCF valuation gives a range of LKR111-157 per share ..................................................................................................................... 13 P/E analysis yields a valuation range of LKR110-135 per share ........................................................................................................ 15 Where is additional potential upside? ................................................................................................................................................. 16 Share price performance .................................................................................................................................................................... 17
Earnings release focus areas ............................................................................................................................................. 19 Appendix 1: Company overview......................................................................................................................................... 20
SPEN’s key businesses...................................................................................................................................................................... 21 Management strategy and transparency ............................................................................................................................................ 22 Shareholding structure ....................................................................................................................................................................... 23 Board of directors ............................................................................................................................................................................... 24
Appendix 2: Key financial data ........................................................................................................................................... 26 Summary group financials (LKRm) ..................................................................................................................................................... 26 Key ratios............................................................................................................................................................................................ 27 Segmental summary ........................................................................................................................................................................... 28
Appendix 3: Industry analysis using Porter’s framework ................................................................................................... 30 Hotels ................................................................................................................................................................................................. 30
Appendix 4: SWOT analysis .............................................................................................................................................. 32 Appendix 5: Diversified sector overview ............................................................................................................................ 33 Appendix 6: Sri Lanka power sector overview ................................................................................................................... 36 Fact Sheet .......................................................................................................................................................................... 39
Sri Lanka investment environment overview ...................................................................................................................................... 39

8/22/2019 SPEN Initiation Report July 10 2013
http://slidepdf.com/reader/full/spen-initiation-report-july-10-2013 3/41
Aitken Spence PLC
3
A capital market development initiative by the Colombo Stock Exchange in association with Amba Research
SPEN’s revenue should grow at a 3.4% CAGR over FY14E-
FY16E
SPEN’s revenue growth is likely to be fuelled primarily by the tourism segment (38% of FY13revenue), which should, in turn, be driven by increasing occupancy levels, room inventory and
ARRs. The strategic investments segment (49% of FY13 revenue) should remain a key contributor to the top line, although its relative share is likely to decline through FY16E (refer to Appendix 1 for a detailed discussion on SPEN’s revenue composition).
Higher room count, occupancy levels and ARRs to drive tourism
revenue CAGR of 12.7% through FY16E
We expect revenue from the tourism segment to post a CAGR of 12.7% over FY14E-FY16E,reaching LKR20.2bn and accounting for 50% of total revenue, in FY16E. Aitken Spence HotelHoldings PLC (AHUN), a subsidiary in which SPEN owns 71.20%, is likely to account for approximately 85% of the segment’s revenue over the forecast period. The company’s other tourism businesses – inbound and outbound travel services as well as an airline general salesagency (GSA) – should account for the balance of segment revenue.
We forecast AHUN, which holds SPEN’s hotel portfolio, to post a revenue CAGR of 12.4% over FY14E-FY16E. The addition of 274 hotel rooms, a 13.8% increase from the current room count of
1,979, is likely to fuel this growth. Additionally, a 4.3ppt increase in blended occupancy levels (to73% in FY16E from 69% in FY13) and a blended ARR growth of about 5.5% annually throughFY16E should aid AHUN’s revenue growth. This includes our conservative assumption of a 1.5%annual depreciation of the rupee.
SPEN room inventory to increase 13.8% over FY14E-FY16E
SPEN stated that it plans to increase its total room count by 13.8% to 2,253 in Sri Lanka, theMaldives, Oman and India over FY14E-16E. The company’s room count o f 743 in Sri Lanka(roughly 5% of total room inventory in the country) is likely to increase by 32.3% to 983 by end-FY16E, with the addition of 150 rooms at the new Heritance hotel on the former Browns Beachproperty in Negombo (a beach town 40km north of Colombo) and 90 rooms at The Sands inKalutara (roughly 40km south of Colombo). SPEN plans to expand its presence in the Maldives andhas already confirmed the addition of 34 water villas. In the absence of other concrete plans, weconservatively assume that the room count of 191 in India and 440 in Oman will remain flat over the forecast period.
Figure [1]: SPEN’s room inventory to increase 13.8% by FY16E
Source: SPEN, Amba estimates
-5%
0%
5%
10%
15%
0
500
1,000
1,500
2,000
2,500
FY2010 FY2011 FY2012 FY2013 FY2014E FY2015E FY2016E
YoY growthNo. of hotel rooms
Sri Lanka Maldives Oman India YoY growth in room count
Tourism segment to primarily drive total revenue growth
8/22/2019 SPEN Initiation Report July 10 2013
http://slidepdf.com/reader/full/spen-initiation-report-july-10-2013 4/41
Aitken Spence PLC
4
A capital market development initiative by the Colombo Stock Exchange in association with Amba Research
Historically, SPEN has increased its exposure in the hotel industry through acquisitions andmanagement contracts. AHUN is well positioned to continue to do so given its healthy financialposition, with a long-term debt-to-equity ratio of under 20%, and strong cash balance position – cash and cash equivalents, and short-term deposits make up approximately 19% of total assets.
Figure [2]: SPEN’s tourism segment has grown in part through acquisitions
Year Investment
1994 Invested in Brown’s Beach Hotel in Negombo (around 40km north of Colombo) and Hotel Hilltop in Kandy (roughly 120km fromColombo)
1995 Acquired a majority stake in Hethersett Hotels Ltd, which owns The Tea Factory, a four-star hotel in Nuwara Eliya (180km fromColombo)
2007 Entered the Indian hospitality industry by securing management contracts for four resorts
2008 Acquired Vadoo Island Resort in the Maldives and entered the Omani market by securing management contracts for four hotels
2009 Secured management contract of a luxury desert camp in Oman
2010 Acquired the owning company of the Ramada Resort, Kalutara (about 50km south of Colombo – the resort was later refurbished and
rebranded as The Sands by Aitken Spence Hotels in 2012)
2012 Acquired Hotel Hilltop
Source: SPEN
Room occupancy to reach 73% and ARRs to post a CAGR of 5.5% through
FY16E
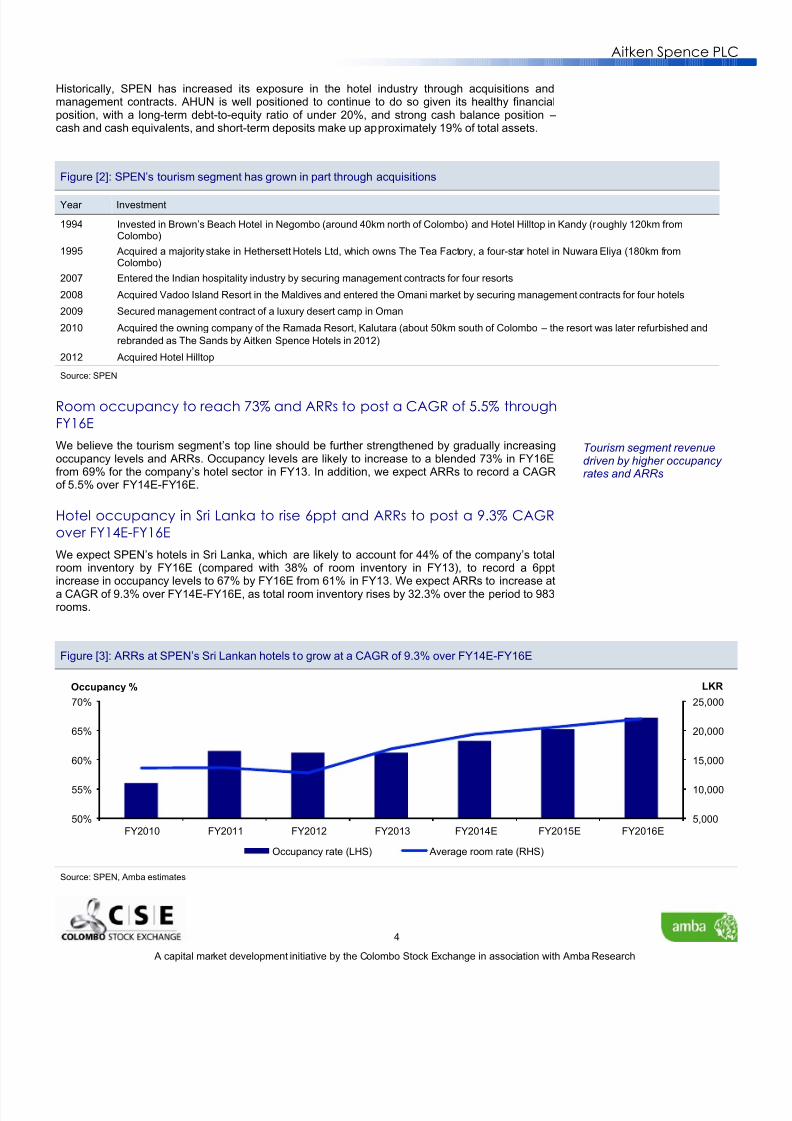
We believe the tourism segment’s top line should be further strengthened by gradually increasingoccupancy levels and ARRs. Occupancy levels are likely to increase to a blended 73% in FY16Efrom 69% for the company’s hotel sector in FY13. In addition, we expect ARRs to record a CAGRof 5.5% over FY14E-FY16E.
Hotel occupancy in Sri Lanka to rise 6ppt and ARRs to post a 9.3% CAGR
over FY14E-FY16E
We expect SPEN’s hotels in Sri Lanka, which are likely to account for 44% of the company’s totalroom inventory by FY16E (compared with 38% of room inventory in FY13), to record a 6ppt
increase in occupancy levels to 67% by FY16E from 61% in FY13. We expect ARRs to increase ata CAGR of 9.3% over FY14E-FY16E, as total room inventory rises by 32.3% over the period to 983rooms.
Figure [3]: ARRs at SPEN’s Sri Lankan hotels to grow at a CAGR of 9.3% over FY14E-FY16E
Source: SPEN, Amba estimates
5,000
10,000
15,000
20,000
25,000
50%
55%
60%
65%
70%
FY2010 FY2011 FY2012 FY2013 FY2014E FY2015E FY2016E
LKROccupancy %
Occupancy rate (LHS) Average room rate (RHS)
Tourism segment revenuedriven by higher occupancy rates and ARRs
8/22/2019 SPEN Initiation Report July 10 2013
http://slidepdf.com/reader/full/spen-initiation-report-july-10-2013 5/41
Aitken Spence PLC
5
A capital market development initiative by the Colombo Stock Exchange in association with Amba Research
However, growth in both occupancy levels and ARRs could be capped by competitive forcesbecause of the increasing number of new hotels. Local chains Jetwing, Chaaya, Amaya, and thenumerous boutique hotels would add to the room inventory in the country, while hotels and resortscurrently under construction by international chains Marriott, Shangri-La, Hyatt and Sheraton are alldue to start operations over the next three years. Furthermore, the expanding informal sector including unregistered hotels, guest houses and home stays, which are now being promoted by thegovernment, will also provide alternative lodging facilities.
Sri Lanka’s tourism industry has challenges to overcome
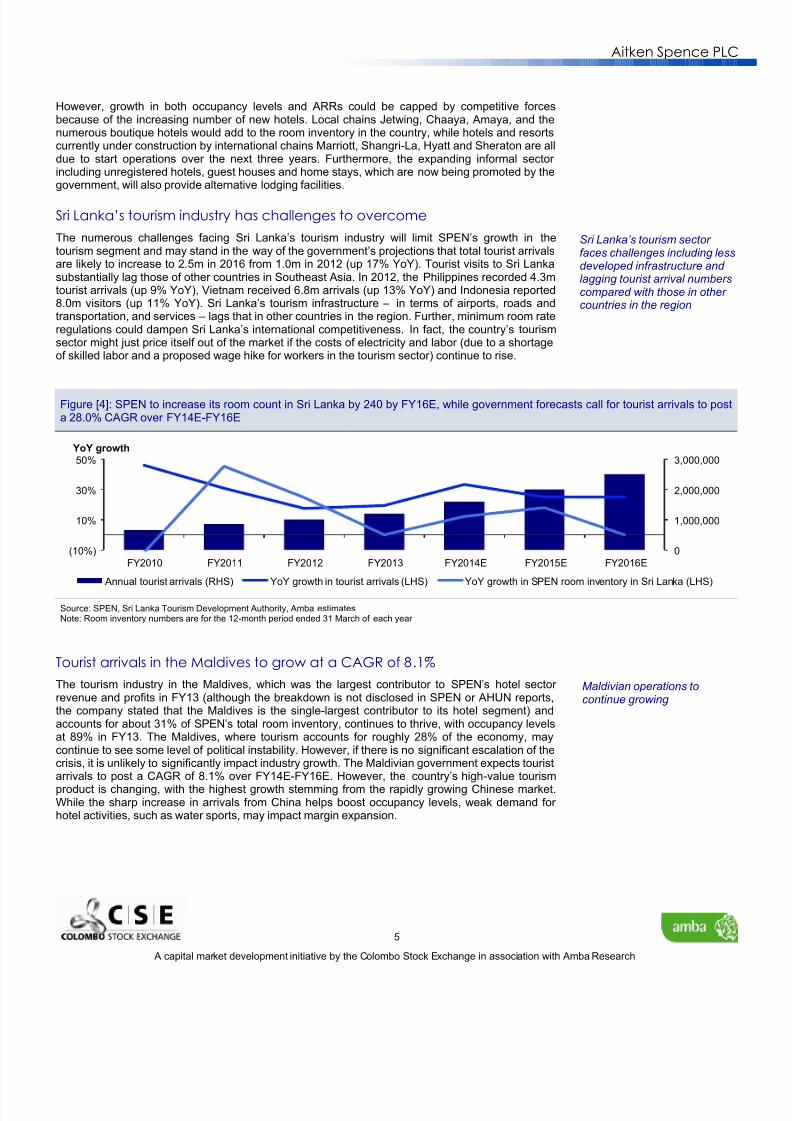
The numerous challenges facing Sri Lanka’s tourism industry will limit SPEN’s growth in thetourism segment and may stand in the way of the government’s projections that total tourist arrivalsare likely to increase to 2.5m in 2016 from 1.0m in 2012 (up 17% YoY). Tourist visits to Sri Lankasubstantially lag those of other countries in Southeast Asia. In 2012, the Philippines recorded 4.3mtourist arrivals (up 9% YoY), Vietnam received 6.8m arrivals (up 13% YoY) and Indonesia reported8.0m visitors (up 11% YoY). Sri Lanka’s tourism infrastructure – in terms of airports, roads andtransportation, and services – lags that in other countries in the region. Further, minimum room rateregulations could dampen Sri Lanka’s international competitiveness. In fact, the country’s tourismsector might just price itself out of the market if the costs of electricity and labor (due to a shortageof skilled labor and a proposed wage hike for workers in the tourism sector) continue to rise.
Figure [4]: SPEN to increase its room count in Sri Lanka by 240 by FY16E, while government forecasts call for tourist arrivals to posta 28.0% CAGR over FY14E-FY16E
Source: SPEN, Sri Lanka Tourism Development Authority, Amba estimatesNote: Room inventory numbers are for the 12-month period ended 31 March of each year
Tourist arrivals in the Maldives to grow at a CAGR of 8.1%
The tourism industry in the Maldives, which was the largest contributor to SPEN’s hotel sector revenue and profits in FY13 (although the breakdown is not disclosed in SPEN or AHUN reports,the company stated that the Maldives is the single-largest contributor to its hotel segment) andaccounts for about 31% of SPEN’s total room inventory, continues to thrive, with occupancy levelsat 89% in FY13. The Maldives, where tourism accounts for roughly 28% of the economy, maycontinue to see some level of political instability. However, if there is no significant escalation of thecrisis, it is unlikely to significantly impact industry growth. The Maldivian government expects tourist
arrivals to post a CAGR of 8.1% over FY14E-FY16E. However, the country’s high-value tourismproduct is changing, with the highest growth stemming from the rapidly growing Chinese market.While the sharp increase in arrivals from China helps boost occupancy levels, weak demand for hotel activities, such as water sports, may impact margin expansion.
0
1,000,000
2,000,000
3,000,000
(10%)
10%
30%
50%
FY2010 FY2011 FY2012 FY2013 FY2014E FY2015E FY2016E
YoY growth
Annual tourist arrivals (RHS) YoY growth in tourist arrivals (LHS) YoY growth in SPEN room inventory in Sri Lanka (LHS)
Sri Lanka’s tourism sector faces challenges including lessdeveloped infrastructure and lagging tourist arrival numberscompared with those in other countries in the region
Maldivian operations tocontinue growing

8/22/2019 SPEN Initiation Report July 10 2013
http://slidepdf.com/reader/full/spen-initiation-report-july-10-2013 6/41
Aitken Spence PLC
6
A capital market development initiative by the Colombo Stock Exchange in association with Amba Research
Figure [5]: The Maldivian government expects tourist arrivals to post a CAGR of 8.1% over FY14E-FY16E
Source: Maldivian Ministry of Tourism Arts and Culture
Omani operations to contribute to tourism revenue growth
Oman’s emergence as a tourist destination – the country saw a record 2.6m inbound tourists in2012 – and new infrastructure in the form of an international airport and a large-scale conventionand exhibition center, bode well for SPEN’s 440-room operations in the country. On the back of improved occupancy rates and higher room rates, the company reported 34% YoY revenue growthin Oman in FY13. We expect this trend to continue owing to the country’s growing popularity as atourist destination and the government’s ambitious target of 12.0m tourist arrivals by 2020, as wellas growth in disposable income in the region.
SPEN has indicated that the company plans to restructure its Indian operations, as its investmentsin the country have not been performing as well as expected.
Strategic investments segment revenue to decline at a CAGR of
4.8% over FY14E-FY16E
The strategic investments segment comprises the group’s power, plantation, printing and garmentmanufacturing operations. It generated close to 49% of total revenue in FY13. We believe thepower sector accounted for the majority (83% in FY13) of the segment’s revenue.
We expect segment revenue to decline at a CAGR of 4.8% to around LKR15.5bn by FY16E,assuming the Ceylon Electricity Board (CEB) does not renew the expired PPAs for SPEN’s power plants in Horana and Matara. We also assume that the 100MW Embilipitiya plant should continueuntil the end of FY16. This segment’s revenue growth will stem entirely from printing, garmentmanufacturing and plantation operations since we have very conservatively assumed decreasingrevenues in the power sub-segment.
Power sector revenue to decline at a 6.9% CAGR over FY14E-FY16E
We forecast that SPEN’s power sector revenue will decrease at a CAGR of 6.9% over the forecastperiod. Without the renewal of the PPAs, the power sector’s contribution to the strategicinvestments segment’s revenue will likely erode to 78% by FY16E from 83% in FY13.
0
400,000
800,000
1,200,000
1,600,000
0%
5%
10%
15%
20%
2010 2011 2012 2013 2014E 2015E 2016E
No. of tourists YoY
Annual tourist arrivals (RHS) YoY growth in tourist arrivals (LHS)

8/22/2019 SPEN Initiation Report July 10 2013
http://slidepdf.com/reader/full/spen-initiation-report-july-10-2013 7/41
Aitken Spence PLC
7
A capital market development initiative by the Colombo Stock Exchange in association with Amba Research
Figure [6]: Power sector contribution to strategic investments segment revenue to decline to 78% in FY16E from 83% in FY13
Source: SPEN, Amba estimates
SPEN has five completed power plants and three planned ones in its portfolio
SPEN is a large independent power producer (IPP) and owns three thermal power plants in SriLanka that have a combined installed power-generating capacity of 148MW. The three thermalplants together account for about 18% of the country’s total IPP capacity and 5% of the totalnational installed generating capacity. However, the company’s plants in Horana and Matara arecurrently not operational, as their 10-year power purchase agreements (PPAs) expired in FY13.The CEB has decided not to renew the PPAs, and, as a result, SPEN has put both units, which weestimate accounted for roughly 20% of total revenue in FY12 (the last full year that both were fullyoperational), up for sale.
The 10-year PPA for the Embilipitiya plant (which accounted for approximately 32% of total SPENrevenue in FY13) is due to expire at the end of FY15. In light of the challenging industry dynamicsfor thermal power plants in Sri Lanka, SPEN is also focusing on developing renewable energypower plants. The group commissioned a 3MW wind power plant in Ambewela and a 2.5MW mini-hydro power plant in Matale in FY13. However, revenue from these operations should be quite low,accounting for less than 1% of total revenue in FY16E.
We believe that in order to compensate for the closure of the two Sri Lankan plants, the companyhas ventured into Bangladesh and hopes to open two thermal power plants there, with capacities of 150MW and 50MW. SPEN is currently finalizing the land agreement for the smaller plant, while thestartup of the larger plant is less certain, with the company awaiting the outcome of its initial bid.Given the limited visibility on these two plants, we have not factored them in to our forecasts.
SPEN is also proposing a 10MW waste-to-energy power project in Meethotamulla, a Colombosuburb, to supply electricity to the national grid by converting municipal solid waste. The project isfacing several protests from residents in the surrounding cities and will be able to proceed only if these issues are resolved. Therefore, we have not considered it in our forecasts.
0%
20%
40%
60%
80%
100%
0
5,000
10,000
15,000
20,000
FY09 FY10 FY11 FY12 FY13 FY14E FY15E FY16E
LKRm
Strategic investments segment revenue - Other (RHS) Strategic investment segment revenue - Power (RHS)
Power segment revenue as a % of total segment revenue (LHS)
SPEN has installed capacity of 153.5MW, of which thermal power accounts for 148MW.However, the Matara and Horana plants (24MW each)are currently not operational

8/22/2019 SPEN Initiation Report July 10 2013
http://slidepdf.com/reader/full/spen-initiation-report-july-10-2013 8/41
Aitken Spence PLC
8
A capital market development initiative by the Colombo Stock Exchange in association with Amba Research
Figure [7]: SPEN power plant portfolio
Location Status Source Capacity
Embilipitiya Operational Thermal 100MW
Horana Dormant Thermal 24MW
Matara Dormant Thermal 24MW
Ambewela Operational Wind 3MW
Matale Operational Mini-hydro 2.5MW
Bangladesh 1 Awaiting outcome of initial bid Thermal 150MW
Bangladesh 2 Finalizing land agreement Thermal 50MW
Meethotamulla Pending approval Biomass 10MW
Source: SPEN
However, 31% of SPEN capacity is idle due to the non-renewal of PPAs
As discussed above, of SPEN’s three thermal power plants, only the 100MW Embilipitiya plant iscurrently part of the national grid. The Horana and Matara power plants (24MW each) are notoperational, because the CEB has decided not to renew the expired PPAs of private power
producers. PPAs are the contracts that set out the terms and conditions of sale of power to theCEB, the state-owned power transmitter (please refer to Appendix 6 of this report for industrycontext and background).
In March 2013, the government made a policy decision not to renew the expired PPAs with IPPs,according to a press article, as the price point in many of these agreements was deemed to beunsustainably high. The 11 thermal IPPs in Sri Lanka account for about 26% of total power capacity; the balance is controlled directly by the CEB and, to a much lesser extent, small power producers (SPP). The Matara and Horana power plants have been lying idle since the PPAs withthe state-owned CEB expired in March and December 2012, respectively. Currently, these twoplants do not contribute revenue to the group.
If at all, the expired PPAs may be renewed under a competitive bidding process
We are not optimistic that these contracts will be renewed soon, even though IPPs are important inthe country’s power generation scheme and considering Sri Lanka’s need for additional power, to
help stave off additional escalating price hikes. At present, 11 thermal IPPs account for about 26%of the country’s total installed power -generation capacity. The IPPs are likely to maintain their industry relevance at least until the CEB-sponsored power plants that are in the pipeline arecommissioned over the next few years, increasing power-generation capacity by 37% over 2016.
If the government does decide to go ahead with the renewal of the PPAs, we expect it to happenunder a competitive bidding process, whereby IPPs that are vying for approval or renewal of PPAswould be forced to be more efficient, build cheaper plants and produce energy at a lower cost thancompeting power plant operators. The new PPAs for the Matara and Horana plants are likely to beat substantially lower rates than those in the original agreements. We believe the capacity charge,which represents a fixed charge to cover the cost of building the plant, maintenance and a profitshare, will definitely be low, as the two plants are now fully depreciated. The energy charge, whichis a pass-through based on the power delivered, should also be a competitive quote. However, wehave assumed that the two PPAs will not be renewed. A renewal will bring definite upside to our revenue forecasts, although overall margins may decline slightly compared to when all three plants
were fully operational, given the likely lower tariff levels.Significantly, though, we have made only approximate forecasts of total revenue stemming from thecompany’s power activities. While SPEN’s annual report states that revenue for the power generation segment grew 24.9% YoY in FY13, there is no significant breakdown of supporting datarelating to individual plants.
Government may overhaul thecurrent procedure for awarding PPAs and may opt for acompetitive bidding processinstead

8/22/2019 SPEN Initiation Report July 10 2013
http://slidepdf.com/reader/full/spen-initiation-report-july-10-2013 9/41
Aitken Spence PLC
9
A capital market development initiative by the Colombo Stock Exchange in association with Amba Research
Printing, garment manufacturing and plantation sub-segments to post
revenue CAGR of 5.0% through FY16E
Since SPEN does not divulge revenue, or any specific financial performance data, by sub-segment,it is difficult to assess historical performance or make projections. We estimate that the other (non-power) operations of SPEN’s strategic investments segment generated 17% of segment revenue(or 8% of overall revenue) in FY13. Going forward, we expect this contribution to grow to 22% inFY16E, driven by investments in improving capacity and efficiency in printing and garment
manufacturing operations, as well as the plantation sub-segment’s diversification into the profitablepalm oil sector and an uptake in tea prices. We project these three sub-segments combined willgrow at a CAGR of 5.0% over FY14E-FY16E.
Cargo logistics and services segments to make a sizeable
contribution to top-line growth
Though smaller in comparison to the main segments discussed above, the cargo logistics segmentstill contributes around 16% of SPEN’s top line, which we expect to be maintained through FY16E.We forecast the segment to grow at a 4.7% CAGR over FY14E-FY16E to reach LKR6.6bn, withrevenue initially taking a slight hit from the expiry of contracts in Africa. However, we expect the topline to pick up from the latter half of FY14E as SPEN’s cargo handling operations in Fiji and itsshipping agency in Bangladesh increase top-line contribution.
The services segment will likely record a revenue CAGR of 11.4% over FY14E-FY16E toLKR0.7bn, as money transfers, the largest sub-segment, will be driven by the continuing growth of foreign remittances and the increased use of formal inward money transfer channels.
While their exact contribution isnot disclosed, SPEN’s printing,garment manufacturing and
plantation operations should alcontribute to the strategic
investments segment ’s revenue growth

8/22/2019 SPEN Initiation Report July 10 2013
http://slidepdf.com/reader/full/spen-initiation-report-july-10-2013 10/41
Aitken Spence PLC
10
A capital market development initiative by the Colombo Stock Exchange in association with Amba Research
We anticipate a 290bps increase in EBITDA margin to
21.6% over FY14E-FY16E
We expect SPEN’s EBITDA to grow at a CAGR of 8.5% and the margin to expand to 21.6% inFY16E from 18.7% in FY13. This 290bps expansion in the EBITDA margin should come mainlyfrom the tourism segment; we forecast the margin in this segment to grow to 31.5% in FY16E from30.0% in FY13. SPEN’s margin should also be aided by a slightly higher margin of 10.8% in FY16E
– from 10.2% in FY13 – in the strategic investments segment.
Figure [8]: SPEN’s EBITDA margin to grow 290bps over FY14E-FY16E
Source: SPEN, Amba estimates
The tourism segment is the primary driver of SPEN’s forecasted EBITDA margin growth. Thesegment reports EBITDA margins that are above the group level (we do not consider the servicessegment in this instance as its contribution to total margin is marginal) and is also the highestcontributor to SPEN’s margin – growing to 70% in FY16E from 62% in FY13. Accordingly, arelatively modest growth in the tourism segment’s EBITDA margin results in a disproportionately
higher growth in the total group’s EBITDA margin, as illustrated in Figure 9 and Figure 10 below.
Figure [9]: Tourism segment’s contribution to EBITDA to reach 70% in FY16E
FY11 FY12 FY13 FY14E FY15E FY16E
Tourism 39.5% 48.1% 61.6% 64.9% 67.6% 69.9%
Strategic investments 33.5% 33.4% 24.3% 20.6% 18.6% 16.9%
Cargo logistics 11.7% 15.1% 10.9% 10.9% 10.3% 9.8%
Services 15.3% 3.4% 3.2% 3.6% 3.5% 3.4%
Total 100.0% 100.0% 100.0% 100.0% 100.0% 100.0%
Figure [10]: Tourism segment posts EBITDA margins above group level
FY11 FY12 FY13 FY14E FY15E FY16E
Tourism 24.8% 27.9% 30.0% 28.1% 30.3% 31.5%
Strategic investments 21.4% 16.6% 10.2% 10.5% 10.7% 10.8%
Cargo logistics 17.2% 17.5% 13.0% 13.1% 13.0% 13.0%
Services 62.2% 45.8% 40.9% 41.9% 41.2% 40.5%
SPEN 24.4% 17.9% 18.7% 19.3% 20.6% 21.6%
Source: SPEN, Amba estimates
0%
20%
40%
60%
80%
FY09 FY10 FY11 FY12 FY13 FY14E FY15E FY16E
EBITDA margin
Tourism Cargo logistics Strategic investments Services SPEN

8/22/2019 SPEN Initiation Report July 10 2013
http://slidepdf.com/reader/full/spen-initiation-report-july-10-2013 11/41
Aitken Spence PLC
11
A capital market development initiative by the Colombo Stock Exchange in association with Amba Research
Tourism segment EBITDA margin to expand 150bps over FY14E-FY16E
We expect higher tourism revenue to result in an increase in the EBITDA margin to 31.5% from30.0% over FY14E-FY16E. We expect to see some margin pressure from growth in energy pricesand the increasing cost of labor, stemming in part from the shortage of skilled labor in the industry.However, we still believe that revenue growth, through increased occupancy rates and higher
ARRs, should offset these increased costs and lead to a slight margin expansion.
Strategic investments segment EBITDA margin likely to increase
slightly to 10.8% in FY16E
We expect the strategic investment segment’s EBITDA margin to remain in the 10.5-10.8% rangeover FY14E-FY16E. However, there could be a slight margin contraction, compared with FY12levels when all three plants were last operational, if the Matara and Horana plant PPAs arerenewed with the CEB, as new contract prices will almost certainly be lower than the originalcontracts.
The company’s three power plants are old, and therefore, fully depreciated. As such, if the PPAsare renewed, the new capacity charge, which is the fixed charge that incorporates a profit portion(please refer to the discussion of the Sri Lankan power industry in Appendix 6 of this report), islikely to be low. Furthermore, the energy charge may be opened up for market bidding. Additionally,maintenance costs are bound to increase as the plants age, and would be a slight strain on
margins.
Cargo logistics and services segments together make a noteworthy
contribution to SPEN’s margin
The cargo logistics segment’s EBITDA margin should come in at 13.0% in FY16E, flat comparedwith FY13; the dip in FY13 was due to the cessation of some African port management contracts.SPEN has lined up new businesses, such as the foray into Fijian port operations and managing ashipping agency in Bangladesh, which should help margins stabilize in this segment. However, wedo not have any visibility on when these projects will begin operations and their impact on revenueand profitability.
The services segment has generally enjoyed sound EBITDA margins, improving consistently to62.2% in FY11 from 38.6% in FY09, but dipped to 40.9% in FY13 (the reason for the decline is notprovided in company reports). We assume margins to remain at the FY13 level of about 40.0%over the forecast period.
SPEN’s EBITDA margin to bedriven by the tourism segment

8/22/2019 SPEN Initiation Report July 10 2013
http://slidepdf.com/reader/full/spen-initiation-report-july-10-2013 12/41
Aitken Spence PLC
12
A capital market development initiative by the Colombo Stock Exchange in association with Amba Research
Relatively low net debt and stable liquidity position should
allow for further borrowing for new projects
SPEN has a fairly low net debt position compared to that of its largest local peers (with theexception of John Keells Holdings PLC, which has a net cash position). SPEN tends to avoid equityfinancing, and instead uses debt to launch new projects. The company had an interest cover (EBIT/interest expense) of 3.8x in FY13, compared to a peer average of 4.4x.
Figure [11]: SPEN’s net debt position is smaller than that of the biggest local conglomerates, with the exception of JKH
Source: SPEN, BloombergNote: All data as of FY13
SPEN has maintained a long-term debt-to-capital ratio of less than 30% over the past few years,and its FY13 ratio of 15.7% is marginally above the domestic peer average of 13.9%. The companyhas taken on some additional debt over the past few years to finance new investments, such asthose in its printing and packaging sub-segment. Although this results in an increase in its financeexpense burden, we believe SPEN’s strong FCF generation should allow for further borrowing, if necessary, to finance new growth projects. As shown in Figure 13, SPEN has generated positiveFCF ranging from LKR1.0bn-4.1bn, with the exception of FY12 – in which the company postednegative FCF of LKR1.4bn.
Figure [12]: SPEN’s long-term debt-to-capital ratio is higher thanthe peer average
Figure [13]: SPEN regularly generates positive free cash flows
Source: SPEN, Bloomberg Source: SPEN, Bloomberg
-50,000
-40,000
-30,000
-20,000
-10,000
0
10,000
20,000
Aitken Spence John Keells Holdings Carson Cumberbatch CT Holdings Hayleys
LKRm
0%
5%
10%
15%
20%
25%
AitkenSpence
John KeellsHoldings
CarsonCumberbatch
CT Holdings Hayleys
LT debt tocapital
-2,000
-1,000
0
1,000
2,000
3,000
4,000
5,000
FY08 FY09 FY10 FY11 FY12 FY1
LKRm
SPEN maintains a relatively low net debt position and hasstable cash inflows

8/22/2019 SPEN Initiation Report July 10 2013
http://slidepdf.com/reader/full/spen-initiation-report-july-10-2013 13/41
Aitken Spence PLC
13
A capital market development initiative by the Colombo Stock Exchange in association with Amba Research
We expect shares to trade in the range of LKR110-157 per
share
We forecast a 12-month price range for SPEN shares of LKR110-157, compared with the currentshare price of LKR124. Our valuation range is based on DCF and P/E-based relative valuationmethods. For comparison, we also assess SPEN’s valuation levels relative to a group of peers.
Figure [14]: Valuation range analysis provides a range of LKR110-157 per share (current share price LKR124)
Source: Amba estimates, SPEN, Bloomberg
DCF valuation gives a range of LKR111-157 per share
In valuing SPEN shares, we made an explicit combined EBIT forecast for all four of the company’sbusiness segments. The combined EBIT was adjusted for non-cash items to arrive at the free cashflow to the firm (FCFF). We were unable to value the company’s segments separately, as thecompany’s level of segmental disclosure is insufficient to make defensible assumptions on asegmental basis.
SPEN’s current capital structure is roughly 20% debt and 80% equity. We have assumed a
balanced capital structure of 50/50 debt to equity and a terminal growth rate of 3%. For our base-case scenario, we have also assumed a risk-free rate of 9.5% and a market risk premium of 5.0%.Figure 15 sets out our DCF assumptions in detail.
110
111
139
135
157
124
50 100 150 200
52-Week Range
P/E analysis
DCF
108
Our base-case assumptions
include a risk-free rate of 9.5%and a market risk premium of 5.0%

8/22/2019 SPEN Initiation Report July 10 2013
http://slidepdf.com/reader/full/spen-initiation-report-july-10-2013 14/41
Aitken Spence PLC
14
A capital market development initiative by the Colombo Stock Exchange in association with Amba Research
Figure [15]: SPEN DCF assumptions
Explicit forecast period 3 years
Fade period 7 years
WACC 12.4%
Effective tax rate 15.0%
Terminal growth rate 3.0%
Risk free rate 9.5%
Equity risk premium 5.0%
Beta 1.0
Cost of equity 14.5%
Cost of debt 12.0%
Debt/Capital 50.0%
Equity/Capital 50.0%
Source: Amba estimates
Our base-case scenario yields a share price of LKR126. We have also constructed bull- and bear-case scenarios to supplement our base-case DCF valuation. The key distinguishing factors of these are as follows:
Bull case: Under this scenario, we assume that the tourism segment will perform better than our expectations, with blended occupancy rates rising to 75% (vs. our base caseassumption of 73%) by FY16E. Further, we assume that ARRs will grow at a CAGR of 6.2% (vs. our base case of 5.5%) over FY14E-FY16E. These factors would likely push therevenue CAGR to 14.1% through FY16E, compared to our base case projection of 12.7%.EBIT margins for the segment are also likely to rise to 31.3% in FY16E, compared to27.0% in our base case, due mainly to the improvement in Maldivian operations, typicallya higher-margin market.
For the strategic investments segments, we assume that the Matara and Horana plantswill resume operations in FY14E, although at a lower tariff, in accordance with thegovernment’s policy to renegotiate IPP tariffs. Revenue is likely to grow at an 8.1% CAGRthrough FY16E (vs. our base case of a decline of 4.8%). We expect margins to improve to10%, slightly lower than the historical average when all three plants were operational, dueto the lower tariff rates. This leads to a share price of LKR157.
Bear case: Here we assume that the tourism segment will perform below expectations,and that blended ARRs will rise only at a 4.5% CAGR (vs. our base case of 5.5%) andoccupancy levels will increase marginally to 70% by FY16E (vs. our base-caseassumption of 73%). Margins are also likely to suffer, falling to 24.9% in FY16E. We alsoassume that the tariff rate for the Embilipitiya plant will be revised for FY16E, following theexpiration of the PPA, and the lower tariff will affect the strategic investment segment’srevenue, which will then decline at a 5.5% CAGR over FY14E-FY16E, and margins will fall60bps to 7.5% in FY16E (vs. our base case of a 10bps decline to 8.0%). This yields ashare price of LKR111.
Figure [16]: Revenue growth assumptions
Base case Bull case Bear case
2014E 2015E 2016E 2014E 2015E 2016E 2014E 2015E 2016E
Tourism 14.1% 9.1% 10.8% 15.7% 10.1% 12.2% 11.9% 7.0% 8.7%
Strategic investments -16.5% 0.6% 0.8% 21.8% 4.5% 0.5% -16.5% 0.6% -1.6%
Cargo logistics 1.4% 6.4% 6.4% 1.4% 6.4% 6.4% 1.4% 6.4% 6.4%
Services 11.4% 11.4% 11.4% 11.4% 11.4% 11.4% 11.4% 11.4% 11.4%
SPEN -1.5% 5.5% 6.5% 16.1% 7.0% 6.1% -2.4% 4.5% 4.6%
Source: SPEN, Amba estimates

8/22/2019 SPEN Initiation Report July 10 2013
http://slidepdf.com/reader/full/spen-initiation-report-july-10-2013 15/41
Aitken Spence PLC
15
A capital market development initiative by the Colombo Stock Exchange in association with Amba Research
Figure [17]: EBIT margin assumptions
Base case Bull case Bear case
2014E 2015E 2016E 2014E 2015E 2016E 2014E 2015E 2016E
Tourism 23.2% 25.5% 27.0% 26.7% 30.4% 31.3% 22.8% 24.1% 24.9%
Strategic investments 8.0% 8.0% 8.0% 10.0% 10.0% 10.0% 7.5% 7.5% 7.5%
Cargo logistics 10.2% 10.2% 10.2% 10.2% 10.2% 10.2% 10.2% 10.2% 10.2%
Services 29.8% 29.8% 29.8% 29.8% 29.8% 29.8% 29.8% 29.8% 29.8%
SPEN 15.5% 16.8% 17.9% 16.7% 18.4% 19.2% 15.0% 15.8% 16.5%
Source: SPEN, Amba estimates
P/E analysis yields a valuation range of LKR110-135 per share
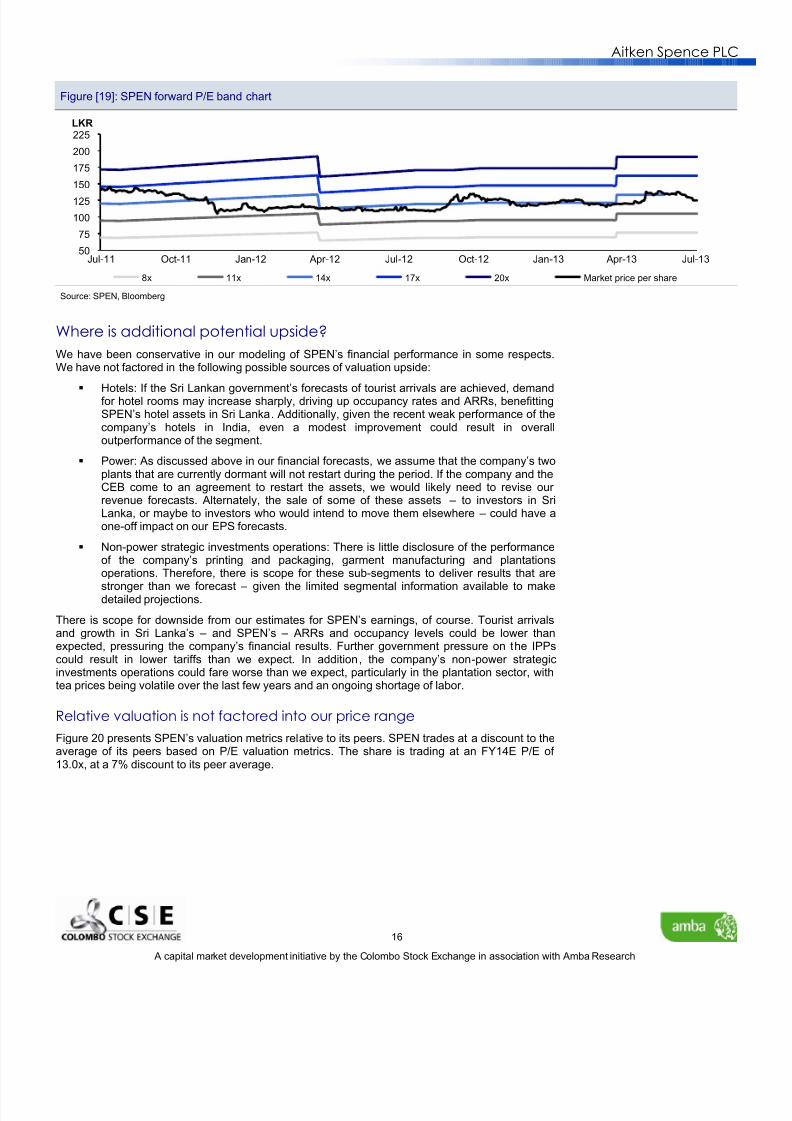
SPEN’s 12-month forward P/E has ranged between 10.6x and 18.6x since July 2011. The share’s12-month historical forward P/E averaged 12.8x during this period. The stock currently trades at13.0x its 12-month forward EPS (based on our forecasts), 2% above its historical average.
Figure [18]: SPEN has historically traded at an average forward P/E of 12.8x
Source: Bloomberg
In determining our P/E valuation range, we apply two scenarios:
Optimistic scenario: Here we expect shares to trade at a 14.1x forward multiple, at anapproximately 10% premium to the historical average. This improved valuation outlookcould stem from a number of positive developments, such as continued strength in touristarrivals and improved sentiment towards companies that are highly levered toimprovements in occupancy rates and ARRs. Alternately, or perphaps additionally, theCEB’s approach towards the power sector could become more amenable to IPPs; even if this would impact SPEN’s assets specifically, it could result in a more upbeat attitude onthe part of portfolio investors towards the sector, to the benefit of valuations assigned tothe company’s shares. The continuing level of EPS growth could justify this premium. We
applied the 14.1x forward P/E to our FY14E EPS estimate of LKR9.5 to arrive at a fair value of LKR135 per share.
Conservative scenario: In this scenario, investors may be concerned by the volatility anduncertainty in SPEN’s power business and the lack of visibility in the cargo logistics andservices segments, and apply a discount to the historical average valuation of the shares.By assigning a 10% discount to its 12-month forward P/E, implying an 11.6x multipleapplied to FY14E EPS, we arrive at a share price of LKR110.
0
4
8
12
16
20
Jul-11 Sep-11 Nov-11 Jan-12 Mar-12 May-12 Jul-12 Sep-12 Nov-12 Jan-13 Mar-13 May-13 Jul-13
P/E (x)
12-month forward P/E Average 12-month forward P/E
Our optimistic scenarioassumes a 10% premium,while our conservative scenarioapplies a 10% discount to therecent historical average
8/22/2019 SPEN Initiation Report July 10 2013
http://slidepdf.com/reader/full/spen-initiation-report-july-10-2013 16/41
Aitken Spence PLC
16
A capital market development initiative by the Colombo Stock Exchange in association with Amba Research
Figure [19]: SPEN forward P/E band chart
Source: SPEN, Bloomberg
Where is additional potential upside?
We have been conservative in our modeling of SPEN’s financial performance in some respects.We have not factored in the following possible sources of valuation upside:
Hotels: If the Sri Lankan government’s forecasts of tourist arrivals are achieved, demandfor hotel rooms may increase sharply, driving up occupancy rates and ARRs, benefittingSPEN’s hotel assets in Sri Lanka. Additionally, given the recent weak performance of thecompany’s hotels in India, even a modest improvement could result in overalloutperformance of the segment.
Power: As discussed above in our financial forecasts, we assume that the company’s twoplants that are currently dormant will not restart during the period. If the company and theCEB come to an agreement to restart the assets, we would likely need to revise our revenue forecasts. Alternately, the sale of some of these assets – to investors in SriLanka, or maybe to investors who would intend to move them elsewhere – could have aone-off impact on our EPS forecasts.
Non-power strategic investments operations: There is little disclosure of the performanceof the company’s printing and packaging, garment manufacturing and plantations
operations. Therefore, there is scope for these sub-segments to deliver results that arestronger than we forecast – given the limited segmental information available to makedetailed projections.
There is scope for downside from our estimates for SPEN’s earnings, of course. Tourist arrivalsand growth in Sri Lanka’s – and SPEN’s – ARRs and occupancy levels could be lower thanexpected, pressuring the company’s financial results. Further government pressure on the IPPscould result in lower tariffs than we expect. In addition, the company’s non-power strategicinvestments operations could fare worse than we expect, particularly in the plantation sector, withtea prices being volatile over the last few years and an ongoing shortage of labor.
Relative valuation is not factored into our price range
Figure 20 presents SPEN’s valuation metrics relative to its peers. SPEN trades at a discount to theaverage of its peers based on P/E valuation metrics. The share is trading at an FY14E P/E of 13.0x, at a 7% discount to its peer average.
50
75
100
125
150
175
200
225
Jul-11 Oct-11 Jan-12 Apr-12 Jul-12 Oct-12 Jan-13 Apr-13 Jul-13
LKR
8x 11x 14x 17x 20x Market price per share

8/22/2019 SPEN Initiation Report July 10 2013
http://slidepdf.com/reader/full/spen-initiation-report-july-10-2013 17/41
Aitken Spence PLC
17
A capital market development initiative by the Colombo Stock Exchange in association with Amba Research
Figure [20]: SPEN vs. domestic and international peers
Company name
P/E EPS CAGR FCF yield
FY11 FY12 FY13 FY14E FY15E FY14E-FY15E FY12 FY13
Aitken Spence PLC 26.0x 13.1x 14.9x 13.0x 11.2x 11.2% -3.0% 3.4%
Domestic peers
John Keells Holdings PLC 21.6x 17.9x 17.2x 17.6x 14.1x 9.3% 6.3% 4.5%
Hemas Holdings PLC 19.5x 11.6x 8.4x 9.8x 9.0x 7.9% -0.6% 4.4%
Hayleys PLC 41.8x 26.0x 12.1x NA NA NM -13.8% 0.9%
Richard Pieris& Co. PLC 15.4x 5.6x 6.7x 6.9x 6.3x 5.9% 4.6% NA
CT Holdings PLC 39.5x 23.5x 19.9x NA NA NM -12.8% -15.9%
International peers
Astra International – Indonesia 16.8x 15.8x 13.2x 11.6x 10.4x NM 1.3% 0.5%
Vingroup Inc.- Vietnam 46.9x 35.2x 10.6x 11.7x NA NM -9.2% NA
ITC Limited – India 28.0x 28.2x 31.9x 30.6x 25.8x 17.9% 2.3% NA
Larsen & Toubro Ltd. – India 23.0x 17.0x 16.1x 16.1x 13.9x 10.8% -18.9% NA
Cheung Kong Holdings – China 4.7x 8.6x 8.8x 7.9x 7.4x NM 2.4% NA
Hutchison Whampoa – China 5.0x 13.2x 12.5x 11.1x 9.7x 13.6% 2.0% NA
Genting Group – Malaysia 15.4x 17.7x 16.5x 14.5x 13.3x NM 7.4% NA
Sime Darby Berhad – Malaysia 15.1x 14.1x 17.1x 15.9x 14.5x NM 1.6% NA
Siam Cement - Thailand 13.8x 22.4x 15.3x 13.0x 11.0x NM 2.4% NA
Mean 21.9x 18.3x 14.7x 13.9x 12.3x 10.1% -1.8% -1.1%
Median 18.2x 17.4x 14.3x 12.3x 11.0x 9.7% 1.8% 0.9%
High 46.9x 35.2x 31.9x 30.6x 25.8x 17.9% 7.4% 4.5%
Low 4.7x 5.6x 6.7x 6.9x 6.3x 5.4% -18.9% -15.9%
Source: SPEN, Bloomberg, Amba estimatesNote: SPEN multiples are based on Amba estimates. Peer multiples are Bloomberg estimates. FY13 P/E multiples for all international peers (except for ITC Limited andLarsen & Toubro Ltd.) are Bloomberg estimates, and not actuals
Selecting an adequate peer group for a conglomerate is challenging. No potential peer has anidentical slate of business segments. However, while the companies in Figure 20 are imperfect – atbest – points of comparison, we have included this data to provide some measure of comparisonwith other regional conglomerates.
Share price performance
SPEN shares closed at LKR124 on 9 July 2013, LKR9 higher than 12 months earlier, for anappreciation of 8%, compared to a 20% increase in the S&P SL20 and a 22% jump in the All SharePrice Index (ASPI) over the same period.

8/22/2019 SPEN Initiation Report July 10 2013
http://slidepdf.com/reader/full/spen-initiation-report-july-10-2013 18/41
Aitken Spence PLC
18
A capital market development initiative by the Colombo Stock Exchange in association with Amba Research
Figure [21]: SPEN has recently performed in line with the S&P SL20 and ASPI
Source: CSE, Bloomberg
The following table shows that SPEN has recently performed in line with the indices, but has
lagged over longer time periods.
Figure [22]: SPEN vs. key indices
3 months 6 months 1 year 2 years 3
SPEN 3% 2% 8% -13%
S&P SL 20 1% 7% 20% -7%
ASPI 3% 4% 22% -13%
Source: CSE, Bloomberg
2,000
4,000
6,000
8,000
50
100
150
200
250
Jul-10 Dec-10 May-11 Oct-11 Mar-12 Aug-12 Jan-13 Jun-13
Index valuesShare price (LKR)
SPEN ASPI S&P SL 20

8/22/2019 SPEN Initiation Report July 10 2013
http://slidepdf.com/reader/full/spen-initiation-report-july-10-2013 19/41
Aitken Spence PLC
19
A capital market development initiative by the Colombo Stock Exchange in association with Amba Research
Earnings release focus areas
What follows is a checklist of items that investors should track in the next – and subsequent – quarterly earnings release. We will closely track SPEN’s performance across these key areas andrevise our forecasts and update our valuation range in earnings update notes. Please refer to thecompany profile for the context of these questions.
For SPEN as a whole
1. Has there been a change in the segmental revenue contribution mix now that the strategicinvestments segment’s contribution to overall revenue has come down due to the non-renewalof the PPAs for Horana and Matara?
2. Has there been an increase in borrowing levels? Increased gearing could potentially put a capon expansion activities as SPEN has not raised equity finance over the past several years.
Tourism segment
1. Have the opening dates been confirmed for the Heritance property in Negombo (former Brown’s Beach property) and the new wing at The Sands, Kalutara?
2. Are there any plans of further expansion or acquisitions in the Maldives?
3. How have actual tourist arrivals compared to government projections? For 2013, the SriLankan government is targeting 1.2m tourist arrivals, compared with just over 1m arrivals in2012.
4. What have been the occupancy rates at star-class hotels? One source of concern in recentmonths has been declining occupancy at higher-end hotels despite rising tourist arrivals.
5. What is the trend in minimum average room rates?
Strategic investments segment
1. Have there been any further developments in the negotiations for the two PPAs?
2. If the two power plants in Matara and Horana are sold, what does the company aim to do withthe proceeds?
3. What is the status of the plans for the two new thermal plants in Bangladesh?
4. Has there been any progress on the proposed Meetotamulla plant?
Cargo logistics segment
1. Did the company sign any new port operation agreements?
2. Have the operations in Fiji and Bangladesh commenced, and what sort of revenue impacthave they had?

8/22/2019 SPEN Initiation Report July 10 2013
http://slidepdf.com/reader/full/spen-initiation-report-july-10-2013 20/41
Aitken Spence PLC
20
A capital market development initiative by the Colombo Stock Exchange in association with Amba Research
Appendix 1: Company overview
Aitken Spence PLC (SPEN) is the tenth-largest publicly traded company on the Colombo StockExchange (CSE) by market cap, which stood at LKR50bn (USD384m) as of 9 July 2013, and thesecond most-traded conglomerate stock on the CSE in terms of turnover over the past 12 months,with an average daily trading value of USD300,827 per day. The stock has a free float of 40.1%.
Established in 1868 as a company focused on trading and maritime services, SPEN has evolvedinto a diversified conglomerate. The company currently operates in four segments: tourism,strategic investments, cargo logistics and services. The tourism and strategic investmentssegments are the largest contributors to the company’s top line and prof it, generatingapproximately 87% of revenue and nearly 86% of EBITDA in FY13.
Figure [23]: Strategic investments and tourism account for 87%of FY13 revenue
Figure [24]: Strategic investments and tourism are also thelargest contributors to EBITDA
Source: SPEN
Note: Individual segmental revenues are inclusive of inter-segmental revenue
Source: SPEN
SPEN’s revenue grew at a 6.1% CAGR over FY09-FY13 to LKR36.6bn (year ending 31 March2013). However, revenue remains volatile – down 18%YoY in FY10 and up 20%YoY in FY13. Thegroup generated EBITDA at a 7.7% CAGR over FY09-FY13 to LKR6.8bn. SPEN’s profit trajectoryreflects sharp volatility – rising just 5.5% in FY10, declining 9.3% in FY12 and again rising 25.2% inFY13. The company’s EBITDA margins reflect this volatility – reaching 24.4% in FY11 before fallingto 18.7% in FY13.
-
10,000
20,000
30,000
40,000
FY08 FY09 FY10 FY11 FY12 FY13
LKRm
Strategic investments Tourism Cargo logistics Services
-
2,000
4,000
6,000
8,000
FY08 FY09 FY10 FY11 FY12 FY13
LKRm
Strategic investments Tourism Cargo logistics Services

8/22/2019 SPEN Initiation Report July 10 2013
http://slidepdf.com/reader/full/spen-initiation-report-july-10-2013 21/41
Aitken Spence PLC
21
A capital market development initiative by the Colombo Stock Exchange in association with Amba Research
SPEN’s key businesses
The strategic investments segment – the largest contributor to SPEN’s top line (49% of FY13
revenue) – engages in power generation, printing and packaging, garment manufacture andplantation management. The segment’s activities are as follows:
Power generation – SPEN operates one 100MW thermal power plant (Ace Embilipitiya), a2.5MW hydropower plant and a 3MW wind power plant, which supply power to thenational grid. The company has invited proposals from prospective buyers for its two24MW thermal power plants (Ace Horana and Ace Matara). These plants are not inoperation since their power purchasing agreements with the CEB, the state-owned power supplier and transmitter, expired in March and December 2012, respectively. SPEN isfocusing on investing in the power sector outside Sri Lanka and in renewable energysources. The company reports that it is in talks to build two power plants in Bangladeshwith a combined capacity of 200MW; the prospects and schedule of these efforts areunclear, though, and we do not include them in our forecasts. The power generationdivision has historically been the largest revenue contributor to the strategic investmentssegment. SPEN does not release the breakdown of revenue contribution from businesses
within each segment. Based on our estimates of tariff and capacity utilization, we believepower generation accounted for 41% of the company’s total revenue in FY13 and 83% of the strategic investments segment’s revenue.
Printing and packaging – SPEN has been in this business for five decades, servicing theFMCG, tea, confectionary, cosmetics, pharmaceuticals and apparel industries.
Garment manufacturing – This division has been operational since 1979 and producesgarments for a number of clothing labels, including Columbia Sportswear, Marks &Spencer, Tesco and Sainsbury. The division’s revenue grew 17.5% YoY in FY13 on theback of increased production efficiency and a full order book during the year.
Plantation management – SPEN owns and manages 13 plantations through investmentassociates Aitken Spence Plantations Managements Ltd. These plantations, whichprimarily focus on tea, are now being diversified to include rubber and palm oil cultivation,as well as hydropower projects, in order to offset the volatility in the tea market. Aitken
Spence Plantations listed 21.3m ordinary voting shares on the stock exchange ’s Diri SaviBoard, the market for smaller, high-growth companies, in May 2013.
SPEN’s tourism segment (38% of FY13 group revenue) includes a range of hotels in Sri Lanka(Heritance and Aitken Spence brands), the Maldives (Adaaran brand), India and Oman, as well asinbound and outbound travel services and an airline general sales agency (GSA).
Sri Lankan hotels – SPEN has nine Sri Lankan hotels in its portfolio, all of which arelocated outside Colombo. The company owns six of these hotels, including Heritance
Figure [25]: Revenue grew at a 6.1% CAGR over FY09-FY13 Figure [26]: EBITDA grew at a 7.7% CAGR over FY09-FY13
Source: SPEN Source: SPEN
(30%)
(10%)
10%
30%
50%
0
10,000
20,000
30,000
40,000
FY08 FY09 FY10 FY11 FY12 FY13
LKRm
Revenue (LHS) YoY growth (RHS)
YoY growth
-10%
0%
10%
20%
30%
-
2,000
4,000
6,000
8,000
FY08 FY09 FY10 FY11 FY12 FY13
YoYgrowth
LKRm
EBITDA (LHS) YoY growth (RHS)

8/22/2019 SPEN Initiation Report July 10 2013
http://slidepdf.com/reader/full/spen-initiation-report-july-10-2013 22/41
Aitken Spence PLC
22
A capital market development initiative by the Colombo Stock Exchange in association with Amba Research
Kandalama and Heritance Tea Factory, and has management contracts on two hotels,Earl’s Regency and Bandarawela Hotel. Besides, Brown’s Beach, in which SPEN holds aminority stake, is being rebuilt and is due to open for business in late-FY14. Occupancyrates at the company’s Sri Lankan hotels average around 65%, with average r oom ratesof approximately USD110-130 per day.
Maldivian hotels – This division has six hotels operating under the Adaaran brand. Thesehotels record occupancy rates of about 85% and are the largest contributors to the
company’s leisure segment. Oman hotels – The company operates four hotels and a desert camp in Oman.
Occupancy averages around 59%.
Indian hotels – SPEN operates five hotels in India, with occupancy levels of around 60%.Management has indicated that it plans to restructure the Indian hotel operations toimprove performance.
Travel services – A joint venture between SPEN and TUI Travel PLC, this divisionprovides services such as airline ticketing, aircraft handling and supervision, inlandtransport and tour packages.
Airline GSA – SPEN is the general sales agent for Singapore Airlines.
The company’s cargo logistics segment contributed 16% to the group’s FY13 revenue and is
involved in integrated logistics, cargo aviation, freight forwarding, maritime services, and mail andcourier services.
Maritime services – SPEN provides container-handling and cargo-consolidation services.In FY13, it entered into a 15-year agreement to manage the cargo-handling operations atthe ports of Suva and Lautoka in Fiji.
Integrated logistics – This division includes SPEN’s land-based logistics operations,including warehousing, container freight station operations and bulk liquid transportationservices.
Freight forwarding and courier services – The company is the GSA for Singapore AirlinesCargo and Qatar Airways, and has been the agent for TNT Express, a global courier company, for over three decades.
The services segment is a small contributor to SPEN’s total revenue (2% of FY13 revenue and
about 3% of total EBITDA). This segment is an amalgamation of a number of businesses, includingthe distribution agency for OTIS elevators, the primary agency for Western Union Money Transfer,the insurance agency for Lloyds of London and financial accounting outsourcing.
Management strategy and transparency
As a practice, SPEN does not release a detailed presentation of its strategy and businessapproach. We believe improved articulation regarding the company’s business strategy andsegmental financial disclosure could help investors (particularly institutional investors) better understand the company. This could ultimately benefit SPEN through enhanced capital raisingopportunities should the company decide to approach equity investors.
We see room for improvement in the following areas:
Revenue composition within segments is not disclosed. The strategic investments
segment, for example, is made up of four very diverse businesses: power generation,printing and packaging, garment manufacturing and plantation management. However,the company does not provide any indication of revenue contributions (or margins) fromthese sub-segments.
SPEN discloses only the segment EBIT and not the margins of businesses within eachsegment.
Quarterly reports do not include any management comments to shed light on the figures.

8/22/2019 SPEN Initiation Report July 10 2013
http://slidepdf.com/reader/full/spen-initiation-report-july-10-2013 23/41
Aitken Spence PLC
23
A capital market development initiative by the Colombo Stock Exchange in association with Amba Research
Shareholding structure
International investors (including companies and funds incorporated abroad) hold just under half of SPEN’s shar es, and institutional investors (both domestic and international) hold 90% overall.Management holds a 4% stake in the company. However, we estimate that through a range of structures, SPEN chairman Harry Jayawardena controls around 60% (or more) of total sharesoutstanding.
Figure [27]: SPEN’s domestic investor base is approximately 55%Figure [28]: Local individual shareholders form 9% of totalshareholding
Source: SPEN, as of March 2013 Source: SPEN, as of March 2013
The top five shareholders as of March 2013 are presented below. Just over 87% of SPEN’s sharesare held by the top 20 shareholders.
Name of shareholder Description Stake
Melstacorp Limited A 100%-owned subsidiary of Distilleries Company of Sri Lanka
PLC, in which the SPEN chairman holds a sizeable stake39.8%
Rubicond Enterprises Limited An offshore investment company in which the SPEN chairman isbelieved to have a considerable shareholding
16.3%
HSBC International Nominees Limited-BPSS LUX-Aberdeen
Global-Asian Smaller Companies Fund
A global fund manager 8.1%
HSBC International Nominees Ltd-BPSS LDN- Aberdeen Asia
Pacific Fund
A global fund manager 4.2%
HSBC International Nominees Ltd-BPSS Lux-Aberdeen Global-
Emerging Markets Smaller Companies Fund
A global fund manager 2.9%
Source: SPEN
Mgmt &connected
parties4%
Other domestic
investors51%
Internationalinvestors
45%
Mgmt &connected
parties4%
Local retailinvestors
5%
Institutional
investors91%

8/22/2019 SPEN Initiation Report July 10 2013
http://slidepdf.com/reader/full/spen-initiation-report-july-10-2013 24/41
Aitken Spence PLC
24
A capital market development initiative by the Colombo Stock Exchange in association with Amba Research
Board of directors
As of March 2013, SPEN’s board comprised nine directors. Their details are provided below.
Name of director Description
Mr. Harry Jayawardena Chairman. He has been a member of the board since April 2000 and the chairman since April 2003. He is a leading
businessman with interests in many industries including distilleries, tea, banking and telecommunications.
Mr. Rajan Brito Deputy chairman and managing director. He was appointed to the board of directors in April 2000 and has been the
company’s managing director since January 2002.
Dr. Rohan Fernando Executive director. He heads the company’s plantations and business development functions. A veteran in the
country’s plantation sector, he played a key role in the plantations privatization program. Appointed to the board in
April 2005.
Dr. Parakrama Dissanayake Executive director. He heads the group’s maritime, logistics and cargo division. He is a former chairman/CEO of the
Sri Lanka Ports Authority. He was appointed to the board in September 2009.
Mr. G.C. Wickramasinghe Independent non-executive director. He has been with SPEN since 1954 and holds 40 years of continuous service
on the board of directors.
Mr. Charles Gomez Independent non-executive director. He is an investment banker with over 20 years of experience in the finance
industry. Appointed to the board in May 2002.
Mr. N.J. de Silva Deva Aditya Independent non-executive director. He was appointed to the board in September 2006 and is a member of theConservative Party of the European Parliament elected from South East England.
Mr. Manilal Fernando Independent non-executive director. He is an attorney-at-law. Appointed to the board in May 2008.
Mr. Rajan Asirwatham Independent non-executive director. He was a senior partner and country head of KPMG from 2001 to 2008.
Appointed to the board in September 2009.
Mr. Chitta Rajan de Silva Independent non-executive director. He was the former Attorney General and Solicitor General of Sri Lanka and
was appointed to the SPEN board in April 2013.
Source: SPEN

8/22/2019 SPEN Initiation Report July 10 2013
http://slidepdf.com/reader/full/spen-initiation-report-july-10-2013 25/41
Aitken Spence PLC
25
A capital market development initiative by the Colombo Stock Exchange in association with Amba Research
Figure [29]: SPEN Corporate Holding Structure
Source: SPEN
Of SPEN’s subsidiaries, only Aitken Spence Hotel Holdings PLC is listed on the CSE. Thecompany also has two listed associates in its group structure, namely Aitken Spence PlantationManagements PLC (38.97%) and Browns Beach Hotels PLC (27.96%).
Aitken Spence PLC
Tourism
Cargologistics
Strategicinvestments
Services
Aitken Spence Cargo (Pvt) Ltd. (100%)
Aitken Spence Exports (Pvt) Ltd. (100%)
Ace Freight Management (Pvt) Ltd.
(100%)
Aitken Spence Maritime Ltd. (100%)
Ace Power Generation (Pvt) Ltd. -Embilipitiya (74%), Horana (51%), Matara(51%)
Aitken Spence Plantation ManagementsPLC (38.97%)
Aitken Spence Printing & Packaging (Pvt)Ltd. (100%)
Aitken Spence Apparels (Pvt) Ltd. (100%)
Browns Beach Hotels PLC (27.96%)
Aitken Spence Hotel Managements (Pvt)Ltd. (100%)
Aitken Spence Hotel Holdings PLC(71.20%)
Aitken Spence Insurance (Pvt) Ltd. (100%)
Aitken Spence Technologies (Pvt) Ltd.(100%)
Aitken Spence Property Developments(Pvt) Ltd. (100%)

8/22/2019 SPEN Initiation Report July 10 2013
http://slidepdf.com/reader/full/spen-initiation-report-july-10-2013 26/41
Aitken Spence PLC
26
A capital market development initiative by the Colombo Stock Exchange in association with Amba Research
Appendix 2: Key financial data
Summary group financials (LKRm)
INCOME STATEMENT 2011 2012 2013 2014E 2015E 2016E
(For the year ended 31 March)
Revenue 24,729 30,543 36,606 36,042 38,015 40,479EBITDA 6,022 5,461 6,840 6,954 7,829 8,748
Operating income (EBIT) 3,952 4,316 5,490 5,584 6,391 7,238
Interest expense (660) (776) (1,444) (950) (940) (962)
Associate/JV income/(expense) 95 86 182 232 255 257
Earnings before tax (EBT) 3,811 5,183 5,001 5,934 6,874 7,904
Net profit 2,532 3,488 3,267 3,875 4,486 5,151
BALANCE SHEET 2011 2012 2013 2014E 2015E 2016E
(As at 31 March)
Current assets
Cash and cash equivalents 736 2,177 2,218 3,057 4,344 5,126
Short-term investments 5,309 4,597 6,764 6,764 6,764 6,764
Accounts receivable 4,129 8,948 9,941 9,381 9,894 10,536
Inventories 1,608 1,783 1,825 2,243 2,366 2,519
Total current assets 12,676 18,658 22,408 22,839 24,809 26,444
Non-current assets
Property, plant and equipment 23,926 22,586 24,042 25,231 26,492 27,856
Intangible assets 134 644 654 654 654 654
Investments in associates/JVs 1,335 1,770 1,931 2,124 2,337 2,570
Total non-current assets 27,469 32,327 33,743 35,125 36,598 38,196
Total assets 40,145 50,985 56,151 57,963 61,407 64,640
Curren t liabil it ies
Short-term debt 4,630 7,003 6,959 7,071 6,860 6,860
Accounts payable 3,939 6,716 7,708 6,960 7,341 7,817
Income tax payable 180 287 501 501 501 501
Total current liabilities 8,753 14,558 15,451 14,815 14,985 15,461
Non-current l iabi l i t ies
Long-term debt 4,144 5,743 6,245 6,042 6,121 6,287
Post-retirement benefit obligation 336 391 447 447 447 447
Total non-current liabilities 4,746 6,563 7,197 6,195 5,473 3,639
Equity
Common share capital 2,135 2,135 2,135 2,135 2,135 2,135Retained profit 8,309 10,565 13,222 16,322 19,911 24,032
Minority interest 5,130 4,709 5,449 5,800 6,207 6,678
Total equity 26,646 29,863 33,503 36,953 40,949 45,540
Total liabilities and equity 40,145 50,985 56,151 57,963 61,407 64,640

8/22/2019 SPEN Initiation Report July 10 2013
http://slidepdf.com/reader/full/spen-initiation-report-july-10-2013 27/41
Aitken Spence PLC
27
A capital market development initiative by the Colombo Stock Exchange in association with Amba Research
CASH FLOW STATEMENT 2011 2012 2013 2014E 2015E 2016E
(For the year ended 31 March)
Operat ing act iv i t ies
Net cash flow from operating activities 6,148 2,258 4,325 6,085 6,876 7,589
Invest ing act iv i t ies
Purchase of PPE and intangible assets (2,013) (3,609) (2,665) (2,559) (2,699) (2,874)
Dividends received from associates/JVs 34 - 26 - - -
Net cash flow from investing activities (2,404) (4,246) (4,906) (1,812) (1,868) (1,884)
Financing act iv i t ies
Debt issuance/(repayment) (647) 1,484 (248) (91) (133) 166
Common share issuance/(repurchase) 618 - (11) - - -
Interest paid (660) (639) (1,328) (950) (940) (962)
Dividends paid to common shareholders 797 (405) (567) (775) (897) (1,030)
Net cash flow from financing activities (960) 1,568 (134) (3,434) (3,720) (4,923)
Net increase/(decrease) in cash and cash equivalents 2,785 (421) (715) 839 1,287 781
Key ratios
2011 2012 2013 2014E 2015E 2016E
Growth
Revenue growth (%) 3.9 23.5 19.9 (1.5) 5.5 6.5
EBITDA growth (%) 6.0 (9.3) 25.2 1.7 12.6 11.7
EBT growth (%) 13.8 36.0 (3.5) 18.6 15.8 15.0
Net profit growth (%) 23.2 37.8 (6.3) 18.6 15.8 14.8
Recurrent diluted EPS growth (%) 23.2 37.8 (6.3) 18.6 15.8 14.8
Margins
EBITDA margin (%) 24.4 17.9 18.7 19.3 20.6 21.6
EBT margin (%) 15.4 17.0 13.7 16.5 18.1 19.5
Net profit margin (%) 10.2 11.4 8.9 10.8 11.8 12.7
ROE (%) 12.5 14.9 12.3 13.1 13.6 14.0
Liquid i ty and eff ic iency
Current ratio (x) 1.4 1.3 1.5 1.5 1.7 1.7
Total asset turnover (x) 0.6 0.6 0.7 0.6 0.6 0.6
Gearing and cash Flow
Debt/Capital (%) 24.8 29.9 28.3 26.2 24.1 22.4
Interest cover (x) 6.0 5.6 3.8 5.9 6.8 7.5
Free cash flow (FCF) yield (%) 6.3 (3.0) 3.4 7.0 8.3 9.4
Net debt/FCF (x) (0.7) 4.4 (2.5) (0.9) (0.4) (0.3)
Valuat ion
P/E (x) 26.0 13.1 14.9 13.0 11.2 9.7
P/BV (x) 3.1 1.8 1.7 1.6 1.4 1.3
EV/Sales (x) 3.0 1.8 1.6 1.7 1.6 1.5
EV/EBITDA (x) 12.2 10.3 8.5 8.6 7.6 6.8
EV/EBIT (x) 18.7 13.1 10.6 10.7 9.4 8.3
EV/FCF (x) 17.8 (41.8) 35.1 17.0 14.3 12.7Dividend yield (%) 0.6 1.2 1.3 1.5 1.8 2.1
Dividend cover (x) 6.2 6.1 5.4 5.0 5.0 5.0

8/22/2019 SPEN Initiation Report July 10 2013
http://slidepdf.com/reader/full/spen-initiation-report-july-10-2013 28/41
Aitken Spence PLC
28
A capital market development initiative by the Colombo Stock Exchange in association with Amba Research
PER SHARE DATA 2011 2012 2013 2014E 2015E 2016E
Recurrent basic EPS (LKR) 6.2 8.6 8.0 9.5 11.0 12.7
Recurrent diluted EPS (LKR) 6.2 8.6 8.0 9.5 11.0 12.7
Common dividend per share (LKR) 1.0 1.4 1.5 1.9 2.2 2.5
Book value per share (BVPS) 53.0 62.0 69.1 76.7 85.6 95.7
Net operating cash flow per share 15.1 5.6 10.7 15.0 16.9 18.7
Net cash flow per share 6.9 (1.0) (1.8) 2.1 3.2 1.9
Source: SPEN, Amba estimates
Segmental summary
(For the year ended 31 March)
Tourism 2011 2012 2013 2014E 2015E 2016E
Revenue 9,967 11,262 14,063 16,046 18,203 20,154
EBITDA 2,388 3,147 4,219 4,513 5,295 6,110
EBIT 1,602 2,628 3,443 3,725 4,468 5,242
YoY growth
Revenue 17.1% 13.0% 24.9% 14.1% 13.4% 10.7%
EBITDA 23.7% 31.8% 34.1% 7.0% 17.3% 15.4%
EBIT 36.6% 64.0% 31.0% 8.2% 19.9% 17.3%
Margins
EBITDA 24.8% 27.9% 30.0% 28.1% 30.3% 31.5%
EBIT 16.1% 23.3% 24.5% 23.2% 25.5% 27.0%
Cargo logistics 2011 2012 2013 2014E 2015E 2016E
Revenue 4,128 5,663 5,743 5,825 6,199 6,597
EBITDA 710 989 749 760 807 856
EBIT 602 852 587 595 633 674
YoY growth
Revenue 15.9% 37.2% 1.4% 1.4% 6.4% 6.4%
EBITDA -4.8% 39.2% -24.3% 1.4% 6.1% 6.1%
EBIT -3.5% 41.6% -31.1% 1.4% 6.4% 6.4%
Margins
EBITDA 17.2% 17.5% 13.0% 13.1% 13.0% 13.0%
EBIT 14.6% 15.0% 10.2% 10.2% 10.2% 10.2%
Strategic investments 2011 2012 2013 2014E 2015E 2016E
Revenue 10,723 14,581 17,908 15,105 15,258 15,452
EBITDA 2,028 2,190 1,664 1,431 1,454 1,480
EBIT 961 1,768 1,324 1,086 1,092 1,100
YoY growth
Revenue -9.4% 36.0% 22.8% -15.7% 1.0% 1.3%
EBITDA -2.9% 8.0% -24.0% -14.0% 1.6% 1.8%
EBIT -33.9% 84.0% -25.1% -18.0% 0.6% 0.8%
Margins
EBITDA 21.4% 16.6% 10.2% 10.5% 10.7% 10.8%
EBIT 9.0% 12.1% 7.4% 8.0% 8.0% 8.0%

8/22/2019 SPEN Initiation Report July 10 2013
http://slidepdf.com/reader/full/spen-initiation-report-july-10-2013 29/41
Aitken Spence PLC
29
A capital market development initiative by the Colombo Stock Exchange in association with Amba Research
Services 2011 2012 2013 2014E 2015E 2016E
Revenue 1,487 482 537 599 667 743
EBITDA 924 221 220 251 274 301
EBIT 792 154 148 178 199 221
YoY growth
Revenue -15.5% -67.6% 11.4% 11.4% 11.4% 11.4%
EBITDA -1.4% -76.1% -0.6% 14.0% 9.5% 9.6%
EBIT 1.2% -80.6% -3.5% 20.0% 11.4% 11.4%
Margins
EBITDA 62.2% 45.8% 40.9% 41.9% 41.2% 40.5%
EBIT 53.2% 31.9% 27.6% 29.8% 29.8% 29.8%
Source: SPEN, Amba estimates
FX rates (LKR/USD): Y/E 31 March 2013 = 129.59
Y/E 31 March 2012 = 112.64
Y/E 31March 2011 = 112.12

8/22/2019 SPEN Initiation Report July 10 2013
http://slidepdf.com/reader/full/spen-initiation-report-july-10-2013 30/41
Aitken Spence PLC
30
A capital market development initiative by the Colombo Stock Exchange in association with Amba Research
Appendix 3: Industry analysis using Porter’s framework
Porter’s analysis – named after its creator, Harvard Business School professor, Michael Porter – isan analytical tool used for industry and competitive analysis. To assess overall industryattractiveness, the tool uses seven elements: barriers to entry, barriers to exit, rivalry amongcompetitors, power of buyers, power of suppliers, availability of substitutes and government action.Based on a range of specific analytical points for each element, the industry and/or company
subject to analysis are rated on a spectrum of highly unattractive to highly attractive. Each rating isthen used to arrive at an overall industry rating. Below, we briefly present some key points of theseven elements for the key industry in which SPEN operates.
Hotels
Conclusion: the industry should remain mildly attractive through 2016
The Sri-Lankan government’s target to increase tourist arrivals in the country by approximately150% by 2016 to 2.5m highlights its plans to make Sri Lanka a prime tourist destination over themedium term. According to the Sri Lanka Tourism Development Authority’s (SLTDA) statistics andforecasts, the country will require additional room inventory to meet the anticipated increase intourist arrivals. This substantial potential demand is likely to attract new entrants to this highlycompetitive industry. Switching costs for customers is low and will remain low as the number of industry participants increases.
However, the industry may be threatened by its overdependence on destination managementcompanies (DMC, which are local firms offering services to help attract and bring in tourists to SriLanka) and a labor shortage. Furthermore, regulations relating to the proposed wage hike andminimum room rates could dampen industry growth.
Threat of new entrants – moderate
Customer brand loyalty is low, as are switching costs, as customers can easily get distracted whenchoosing a holiday destination, which makes it easier to create a niche in this industry. The highcapital requirements for property development and periodical refurbishments may be less of achallenge for international hospitality companies, as they may have better access to funding thandomestic firms. Larger hotel chains, as well as international brands entering Sri Lanka’s hotelsector (including Shangri-La, Hyatt and Sheraton), should enjoy economies of scale.
Barriers to exit – moderate
The one-time exit cost may be considered moderate. As Sri Lanka is poised to become a major tourist hub over the medium term, any hotel wishing to dispose of its operations could be takenover by a larger competitor/firm that would view this as an attractive opportunity toconsolidate/diversify.
Rivalry among competitors – moderate to high
At present, there are many local and international hotel operators (e.g., JKH, Aitken Spence,Jetwing, Taj Hotels, Hilton and others) in Sri Lanka. The industry is poised for growth, as thegovernment is targeting a significant increase in tourist arrivals over the next few years, whichcreates a need for additional room inventory in the country. Each hotel operator also competes ona different niche (based on star class, services offered, quality of customer service, etc.) and allthese factors collectively create an evenly balanced platform, allowing all competitors to benefitfrom the potential industry growth.
Bargaining power of buyers – highTourists and holiday-makers are generally highly price sensitive; they seek value for money, even if it is at a star-class hotel. Visitors to Sri Lanka have a range of options to choose from, andswitching costs for buyers is low. Furthermore, the strategic importance of the product/serviceoffering is low, as holidays are a luxury (non-essential) expense borne by individuals, depending ontheir levels of disposable income.

8/22/2019 SPEN Initiation Report July 10 2013
http://slidepdf.com/reader/full/spen-initiation-report-july-10-2013 31/41
Aitken Spence PLC
31
A capital market development initiative by the Colombo Stock Exchange in association with Amba Research
Bargaining power of suppliers – high
There are two key suppliers to the hotel industry: DMCs and employees. There are a few well-established DMCs in Sri Lanka, such as Walkers Tours, Aitken Spence Travels and JetwingTravels, and roughly over 60% of inbound travels are secured through these intermediaries. Thereare few alternatives for hotels to using the services of DMCs, other than for hotels to launch their own destination management efforts. Occupancy levels at hotels depend largely on the relationshipbetween the hotel and the DMC. Some of the large established local hotel chains already have
DMCs that operate as their sole agents. Even so, the DMC’s services are strategically important tothe hoteliers, which make switching costs high. This leaves DMCs in a strong position to negotiatetheir rates with hotels.
There is also a severe shortage of skilled labor in the industry, and there is no substitute to hiringemployees, as a personalized service is critical to the success of the hotel sector. Therefore,employees in the sector generally enjoy strong bargaining power, which reduces industryattractiveness.
Threat of substitutes – high
Holidays offer customers leisure, entertainment and relaxation. Therefore, there are severalsubstitutes, particularly tourist destinations in other regions that can compete for a share of thecustomer’s wallet, particularly other regional tourist destinations. Brand loyalty is limited and thecustomers can easily change their minds. There may also not be a significant price differential;therefore, switching costs are low.
Government action – moderate
While the government is investing to promote Sri Lanka’s image as a global tourist hub, industryplayers believe that the government could do more to put the country on the tourism world map. Onthe positive side, the tax on foreign leases of land for business ventures is down to approximately10%, which could drive foreign investment into Sri Lanka. However, the country is still in theprocess of developing the infrastructure required to support the anticipated 2.5m tourists in 2016.The tourism sector remains highly regulated, which could be counter-productive to industry growth.Higher minimum average room rates, while increasing hotel sector revenues, could reduce SriLanka’s regional and international competitiveness. Higher electricity tariffs and the proposed wagehike in the tourism sector could also hurt industry attractiveness.

8/22/2019 SPEN Initiation Report July 10 2013
http://slidepdf.com/reader/full/spen-initiation-report-july-10-2013 32/41
Aitken Spence PLC
32
A capital market development initiative by the Colombo Stock Exchange in association with Amba Research
Appendix 4: SWOT analysis
Strengths Weaknesses
Strong brand recognition
Experienced management team
Long-standing representation and partnership with manyreputed global brands ( OTIS, Tui, Western Union MoneyTransfer, Singapore Airlines, Qatar Airways, TNT, etc.)
Strong focus on delivering shareholder value
Uncertainty in the power sector
Inadequate disclosure of segmental performace
breakdown
Opportunities Threats
Strong anticipated growth in tourist visits
Rising GDP/capita and disposable income in Sri Lanka
Foreign investments through JVs, partnershipagreements, etc.
Increased diversification into international markets
Continued challenges in the Sri Lankan power sector
Domestic infrastructure not up to international standards
Proposed legislation (for example, on minimum room ratesand tourism industry wages), which could negatively affectthe growth of the tourism segment
Rupee appreciation could affect sectors that earnrevenues in USD
Risk of political instability and social unrest

8/22/2019 SPEN Initiation Report July 10 2013
http://slidepdf.com/reader/full/spen-initiation-report-july-10-2013 33/41
Aitken Spence PLC
33
A capital market development initiative by the Colombo Stock Exchange in association with Amba Research
Appendix 5: Diversified sector overview
As of 9 July 2013, the diversified sector accounted for 22% of the CSE’s total market capitalizationof USD17.6bn. It is the second-largest sector on the stock market, after financial services.
Figure [30]: Top five sectors on the CSE by market capitalization
Sector name
Market cap
(USDbn)
% of total CSE
market cap Two largest companies
Banks, finance and insurance 3.9 22% Commercial Bank of Ceylon PLC
Hatton National Bank PLC
Diversified 3.8 22% John Keells Holdings PLC
Carsons Cumberbatch PLC
Beverage, food and tobacco 3.6 21% Ceylon Tobacco Company PLC
Nestle Lanka PLC
Hotels and travels 1.1 7% Asian Hotels & Properties PLC
Aitken Spence Hotel Holdings PLC
Telecommunication 1.1 6% Sri Lanka Telecom PLC
Dialog Axiata PLC
Source: CSENote: Data as of 9 July 2013

8/22/2019 SPEN Initiation Report July 10 2013
http://slidepdf.com/reader/full/spen-initiation-report-july-10-2013 34/41
Aitken Spence PLC
34
A capital market development initiative by the Colombo Stock Exchange in association with Amba Research
There are 18 listed diversified companies trading on the CSE, 13 of which are listed on the MainBoard, and 5 are listed on the Diri Savi Board. We have listed the top 10 companies in thediversified sector based on market capitalization as of 9 July 2013, along with a brief description of their main businesses.
Figure 31: Details of conglomerates listed on the Main Board of the CSE
Company name Bloomberg/CSE tickers
Market cap
(USDm)
Free float
(%) Top three businesses by revenue contribution
John Keells Holdings PLC JKH SL/ JKH.N0000 1,587 88.4% Consumer food (manufacturing) and retail
Tourism (hotels, destination management)
Transportation (oil bunkering, container handling)
Carsons Cumberbatch PLC CARS SL/ CARS.N0000 632 23.8% Oil palm plantations (palm oil, palm kernel, fresh fruit)
Oils and fats (refined oils, cooking oil, specialty fats)
Beverages (breweries)
Aitken Spence PLC SPEN SL/ SPEN.N0000 384 40.1% Power generation
Tourism (hotels, destination management)
Logistics (freight forwarding, courier services,
integrated logistics, maritime transport)
CT Holdings PLC CTHR SL/ CTHR.N0000 202 38.7% Retail and wholesale Distribution (FMCG)Ceramics and tiles (manufacturing and distribution)*
Food processing (consumer foods)
Hayleys PLC HAYL SL/ HAYL.N0000 175 40.0% Hand protection (rubber gloves)
Transportation and logistics (warehousing and
distribution, freight, chartering and port operations)
Purification products (carbon granular, fines, powders
and pellets)
Vallibel One PLC VONE SL/ VONE.N0000 146 19.4% Finance (banking)
Apparel
Tiles
Hemas Holdings PLC HEMS SL/ HHL.N0000 133 28.3% Healthcare (pharmaceuticals, diagnostic and surgical
services, hospitals)
FMCGPower generation
Richard Pieris & Co. PLC RICH SL/ RICH.N0000 103 45.0% Retail
Plantations (tea, rubber, palm oil)
Plastics (water tanks and pumps, foam mattresses,
bulbs, molded plastics)
Expolanka Holdings PLC EXPO SL/ EXPO.N0000 102 26.9% Freight and logistics (air and sea freight, logistics,
warehousing)
International trading and manufacturing (agricultural,
paper, plastic, metal pharmaceutical products)
Investments and services (airline general sales agent,
business process outsourcing, education,
investments, corporate services)
Finlays Colombo PLC JFIN SL/ JFIN.N0000 74 3.5% Tea exports
Services (environmental services, insurance
brokering, marine cargo surveying, airline general
sales agent)
Logistics (tea warehousing, temperature-controlled
logistics, air freight)
Source: CSE, Bloomberg, Company annual reports
Note: Market capitalization and free float data as of 9 July 2013. Revenue contribution based on FY13 data.
*CT Holdings PLC disposed their stake in Lanka Wall Tiles during May 2013

8/22/2019 SPEN Initiation Report July 10 2013
http://slidepdf.com/reader/full/spen-initiation-report-july-10-2013 35/41
Aitken Spence PLC
35
A capital market development initiative by the Colombo Stock Exchange in association with Amba Research
The shareholding structures of the conglomerates listed above are shown in Figure 32. Four companies have significant international shareholding, and management hold large stakes in four issuers.
Figure [32]: Shareholding structure – by investor type and geographical location
Investor type Geographical location
Management Other retail Institutional Management Other domestic International
John Keells Holdings PLC 5.0% 23.3% 71.7% 5.0% 28.4% 66.6%
Carson Cumberbatch PLC 0.3% 3.9% 95.9% 0.3% 81.7% 18.0%
Aitken Spence PLC 1.9% 7.5% 90.7% 1.9% 52.8% 45.3%
CT Holdings PLC* 19.5% 21.2% 59.3% 19.5% 66.5% 14.0%
Hayleys PLC 48.5% 36.0% 15.6% 48.5% 48.0% 3.5%
Vallibel One PLC* 63.3% 8.0% 28.7% 63.3% 36.0% 0.7%
Hemas Holdings PLC 4.0% 6.1% 89.9% 4.0% 89.2% 6.8%
Richard Pieris & Company PLC 0.4% 15.9% 83.8% 0.4% 40.1% 59.5%
Expolanka Holdings PLC 72.8% 10.7% 16.6% 72.8% 23.2% 4.1%
Finlays Colombo PLC* 0.0% 1.6% 98.4% 0.0% 2.5% 97.5%
Source: Company annual reports*Note: Data as of FY12 (31st March 2012). For Finlays PLC, the FY12 data is as of 31st December 2012
Below are key financial statistics for these conglomerates.
Figure [33]: Key financial data
Company name Revenue EBIT Net income EBIT margin (%) Net income margin (%)
John Keells Holdings PLC 661 55 94 8.3% 14.3%
Carson Cumberbatch PLC 588 84 35 14.2% 6.0%
Aitken Spence PLC 283 43 25 15.0% 8.9%
CT Holdings PLC 527 34 9 6.5% 1.7%
Hayleys PLC 572 51 14 9.0% 2.5%
Vallibel One PLC 254 39 11 15.3% 4.3%
Hemas Holdings PLC 202 19 13 9.3% 6.4%
Richard Pieris & Co. PLC 268 29 15 10.7% 5.5%
Expolanka Holdings PLC 387 15 8 3.8% 2.1%
Finlays Colombo PLC 40 2 3 6.1% 7.2%
Source: BloombergNote: All data as of FY13, except for Finlays Colombo PLC (data as of December 2012). All figures are in USDm, unless stated otherwise

8/22/2019 SPEN Initiation Report July 10 2013
http://slidepdf.com/reader/full/spen-initiation-report-july-10-2013 36/41
Aitken Spence PLC
36
A capital market development initiative by the Colombo Stock Exchange in association with Amba Research
Appendix 6: Sri Lanka power sector overview
The following is a brief overview on the Sri Lankan power sector, based mainly on information anddata from the CEB and the Public Utilities Commission of Sri Lanka (PUCSL).
Sri Lanka generates electricity from thermal (oil and coal), hydropower and other renewablesources. The generation mix varies depending on weather patterns. In 1H12, thermal, hydropower and other renewable sources accounted for 78%, 18% and 4% of total power generated in SriLanka, respectively. We used the figures from the June 2012 PUCSL report since it was morecomprehensive than the latest release.
The CEB, the state-run power producer and distributor, controls approximately 66% of the countr y’sgenerating capacity. The private sector, consisting of a few independent thermal power producers(IPPs) and a host of small renewable energy power producers (SPP), accounts for the rest.
Significant private-sector participation in the country’s power sector started with the connection of the privately owned Lakdhanavi (22.5MW) thermal power plant to the national grid in 1996. Thiswas followed by the connection of another 10 privately owned thermal power plants to the grid. Theowners of these plants are generally referred to as IPPs. SPEN is a noteworthy IPP – its threethermal power plants have a combined installed power generating capacity of 148MW, accountingfor about 18% of the country’s total IPP capacity and 5% of the total installed generating capacityas at June 2012.
The CEB buys power from IPPs as per the terms of the PPAs it has signed with each individualproducer. The CEB then transmits this power to end-consumers and bills them. The price at whichthe CEB bills the customers must be approved by the PUCSL, the state electricity regulator. TheCEB has been making losses for many years, because it has been selling power for less than itsgeneration/buying costs (see Figure 37 for generation/buying costs). In a bid to reverse thissituation, the CEB increased electricity prices by about 60% (approved by the PUCSL) in April2013.
The higher tariff has been met with a great deal of public displeasure, and there is now closescrutiny of the associated costs, including the PPAs. Many sector experts are of the opinion thatthe PPAs are inequitable. Therefore, the PUCSL has refused the CEB the license to renew anyPPAs that expire. Currently, two of SPEN’s power plants are inactive, as their PPAs have expired.
Installed power generation capacity of 3,277MW
Sri Lanka has a total installed power generating capacity of 3,277MW (as of June 2012, according
to the PUCSL) from 145 power plants.
Figure [34]: Power plants by producer and sourceFigure [35]: Installed power generation capacity mix – thermalaccounts for 51%
Producer No.
CEB – thermal 7
CEB – hydro 17
CEB – wind 1
IPPs – thermal 11
Small power producers (SPPs) – renewable 109
Total 145
Source: PUCSL, June 2012 Source: PUCSL, June 2012
CEB Hydro41%
CEBThermal -
Oil16%
CEBThermal -
Coal9%
IPPThermal
26%
SPPRenewable
8%

8/22/2019 SPEN Initiation Report July 10 2013
http://slidepdf.com/reader/full/spen-initiation-report-july-10-2013 37/41
Aitken Spence PLC
37
A capital market development initiative by the Colombo Stock Exchange in association with Amba Research
The maximum electricity demand in Sri Lanka is about 2,150MW per day, according to CEBSystem Control records. The reserve margin (excess capacity over peak demand) is 30-35%. Thecountry requires a significant reserve margin, as weather plays an important role in power generation from hydro and other renewable sources (49% of installed capacity).
All grid-connected power plants sell their power to the CEB and Lanka Electricity Company (LECO,a government-owned private company that distributes electricity in the Western Province), whichdeliver power to consumers via transmission networks.
Demand for electricity to grow at a peak rate of 6.6% YoY up to 2025
As per the CEB’s Long-Term Generation Expansion Plan (2011-2025), the country’s electricitydemand is likely to increase at a peak rate of 6.6% YoY up to 2025. At this rate, peak demand islikely to be approximately 2,292MW in 2013 and 2,776MW by 2016. Currently, the reserve marginat peak demand, excluding capacity from non-conventional renewable energy (NCRE) sources, isabout 30%.
If a reserve margin of 30% (excluding NCRE) is to be maintained, installed capacity will have toincrease by approximately 670MW, or about 223MW on average per year over 2013-2016.
CEB projects in the pipeline to add 1,220MW of capacity by 2016
If the three major projects in the CEB’s pipeline are commissioned on schedule, the requirement of 670MW of additional capacity will be met with relative ease.
Figure [36]: CEB projects in the pipeline to add 1,220MW of generating capacity
Project Planned capacity (MW) Status Target completion year
Norochcholai coal power plant (Phase II and III) 600 Under construction 2014
Uma Oya hydro power plant 120 Under construction 2015
Trincomalee coal power plant 500 Under construction 2016
Source: CEB
The CEB will, in fact, have about 550MW of excess installed capacity by 2016, which it could use to
replace the purchases it makes from the costlier IPPs (refer to Figure 37 for the cost breakdown).It costs the CEB LKR16.99 to generate a kilo watt hour (kWh) of thermal power compared with theLKR21.79/kWh it has to pay to IPPs on average. As a result, the CEB runs a loss, as it subsidizesboth IPPs and consumers.
Figure [37]: Power generation cost to the CEB
Plant Average unit cost to the CEB (LKR/kWh)
All hydro 4.65
All CEB thermal 16.99
All IPP thermal 21.79
NCRE 13.77
All plants (average) 16.72
Source: PUCSL, June 2012
Role of IPPs in Sri Lanka’s power sector
IPPs are important players in the country’s power sector. They have helped the CEB meet theshortfall in generation capacity, especially during drought seasons when hydropower plantreservoirs are running low.

8/22/2019 SPEN Initiation Report July 10 2013
http://slidepdf.com/reader/full/spen-initiation-report-july-10-2013 38/41
Aitken Spence PLC
38
A capital market development initiative by the Colombo Stock Exchange in association with Amba Research
Figure [38]: Power generation mix – IPPs have increased their share from 15% to 43% over 2000-11
Source: CEB
IPPs’ contribution to the generation mix dropped to 43% in 2011 from 45% in 2010 due to thecommissioning of Phase I of the CEB’s Norochcholai coal power plant in 2011. We expect thecontribution to decline further once the three major projects in the CEB’s p ipeline (see Figure 36)are operational.
IPPs provide power to the grid through the CEB
The CEB purchases power from IPPs as per the PPAs it has signed with each of them andtransmits it to end-consumers.
The power purchase tariff structure includes two key components: a capacity charge and an energycharge.
The capacity charge is a fixed charge and includes funds to repay loans, a profitcomponent, and a fixed operation and maintenance charge. The CEB has to pay this
capacity charge, irrespective of whether it buys power from an IPP or not. The energy charge includes a portion for variable operations and maintenance costs, and
a pass-through fuel cost.
0%
20%
40%
60%
80%
100%
2000 2001 2002 2003 2004 2005 2006 2007 2008 2009 2010 2011
Private CEB
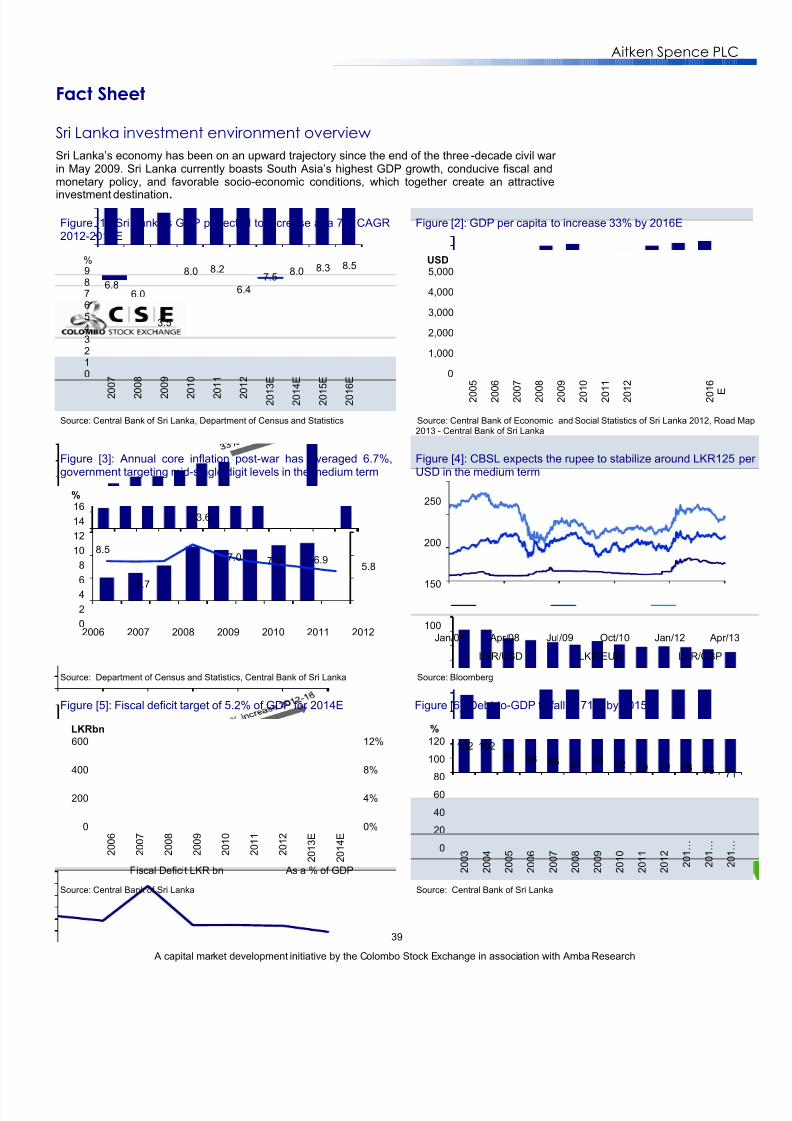
8/22/2019 SPEN Initiation Report July 10 2013
http://slidepdf.com/reader/full/spen-initiation-report-july-10-2013 39/41
Aitken Spence PLC
39
A capital market development initiative by the Colombo Stock Exchange in association with Amba Research
Fact Sheet
Sri Lanka investment environment overview
Sri Lanka’s economy has been on an upward trajectory since the end of the three -decade civil war in May 2009. Sri Lanka currently boasts South Asia’s highest GDP growth, conducive fiscal andmonetary policy, and favorable socio-economic conditions, which together create an attractive
investment destination.
Figure [1]: Sri Lanka's GDP projected to increase at a 7% CAGR2012-2016E
Figure [2]: GDP per capita to increase 33% by 2016E
Source: Central Bank of Sri Lanka, Department of Census and Statistics Source: Central Bank of Economic and Social Statistics of Sri Lanka 2012, Road 2013 - Central Bank of Sri Lanka
Figure [3]: Annual core inflation post-war has averaged 6.7%,government targeting mid-single digit levels in the medium term
Figure [4]: CBSL expects the rupee to stabilize around LKR125USD in the medium term
Source: Department of Census and Statistics, Central Bank of Sri Lanka Source: Bloomberg
Figure [5]: Fiscal deficit target of 5.2% of GDP for 2014E Figure [6]: Debt-to-GDP to fall to 71% by 2015E
Source: Central Bank of Sri Lanka Source: Central Bank of Sri Lanka
6.86.0
3.5
8.0 8.2
6.4
7.58.0 8.3 8.5
0123456789
2 0 0
7
2 0 0
8
2 0 0
9
2 0 1
0
2 0 1
1
2 0 1
2
2 0 1 3
E
2 0 1 4
E
2 0 1 5
E
2 0 1 6
E
%
0
1,000
2,000
3,000
4,000
5,000
2 0 0 5
2 0 0 6
2 0 0 7
2 0 0 8
2 0 0 9
2 0 1 0
2 0 1 1
2 0 1 2
2 0 1 6
E
USD
8.5
7.7
13.6
7.0 7.0 6.95.8
0
2
46
8
10
12
14
16
2006 2007 2008 2009 2010 2011 2012
%
100
150
200
250
Jan/07 Apr/08 Jul/09 Oct/10 Jan/12 Apr/1
LKR/USD LKR/EUR LKR/GBP
0%
4%
8%
12%
0
200
400
600
2 0 0 6
2 0 0 7
2 0 0 8
2 0 0 9
2 0 1 0
2 0 1 1
2 0 1 2
2 0 1 3 E
2 0 1 4 E
LKRbn
Fiscal Deficit LKR bn As a % of GDP
102 10291 88 85 81 86 82
79 79 78 75 71
0
20
40
60
80
100
120
2 0 0 3
2 0 0 4
2 0 0 5
2 0 0 6
2 0 0 7
2 0 0 8
2 0 0 9
2 0 1 0
2 0 1 1
2 0 1 2
2 0 1 …
2 0 1 …
2 0 1 …
%

8/22/2019 SPEN Initiation Report July 10 2013
http://slidepdf.com/reader/full/spen-initiation-report-july-10-2013 40/41
Aitken Spence PLC
40
A capital market development initiative by the Colombo Stock Exchange in association with Amba Research
The Sri Lankan equity market offers a rare and attractive alternative to investors in an investment era impacted by economic growthworries. Backed by the country’s robust economic growth, the Sri Lankan capital market is well set to offer attractive returns to investorswho are keen to be a part of this emerging market success story. There are several strong incentives for entering the Sri Lankan capitamarket.
Figure [7]: Post war, the ASPI has significantly outperformedglobal and developed market indices
Figure [8]: Post war, the ASPI has also outperformed some of tbest-performing regional indices
Source: Bloomberg*Note: All figures re-based to 1 July 2009
Source: Bloomberg*Note: All figures re-based to 1 July 2009
Figure [9]: The CSE’s market capitalization has doubled since2009
Figure [10]: The government anticipates FDI inflows to reaUSD2bn in 2013, a 19% CAGR 2009-2013E
Source: Bloomberg, Central Bank of Sri Lanka Source: Ministry of Finance and Planning, Board of Investment of Sri Lanka
Figure [11]: Most sector P/Es are below market average andhistorical valuations
Figure [12]: Trend is similar on a P/BV value
Source: Colombo Stock Exchange Source: Colombo Stock Exchange
04080
120160200240280320360400
Jul-09 Feb-10 Oct-10 May-11 Jan-12 Aug-12 Apr-13 ASPI Dow Jones FTSE 100
MSCI World DAX
0
100
200
300
400
Jun-09 Dec-09 Jul-10 Mar-11 Sep-11 Apr-12 Nov-12
ASPI Bombay (BSE 500)
Jakarta (JCI) Philippines (PASHR)
Thailand (SET) Hanoi (VNINDEX)
MSCI Emerging Market Index
1,092
2,211 2,214 2,1682,351
0
500
1,000
1,500
2,000
2,500
2009 2010 2011 2012 2013 (June)
LKRbn
827601 516
1,066
1,338
2,000
0
500
1,000
1,500
2,000
2,500
2008 2009 2010 2011 2012 2013E
USDm
0
30
60
90
120
B a n k s , F i n a n c e &
I n s u r a n c e
B e v e r a g e , F o o d &
T o b a c c o
C h e m i c a l s &
P h a r m a c e u t i c a l s
C o n s t r u c t i o n &
E n g i n e e r i n g
D i v e r s i f i e d
H o t e l s & t r a v e l s
I n v e s t m e n t T r u s t s
L a n d & P r o p e r t y
M a n u f a c t u r i n g
P l a n t a t i o n s
P o w e r & E n e r g y
S e r v i c e s
T e l e c o m m u n i c a t i o n
T r a d i n g
2010 2011 2012 Average market P/E 2010-2012
0
2
4
6
B a n k s , F i n a n c e &
I n s u r a n c e
B e v e r a g e , F o o d &
T o b a c c o
C h e m i c a l s &
P h a r m a c e u t i c a l s
C o n s t r u c t i o n &
E n g i n e e r i n g
D i v e r s i f i e d
H o t e l s & t r a v e l s
I n v e s t m e n t T r u s t s
L a n d & P r o p e r t y
M a n u f a c t u r i n g
P l a n t a t i o n s
P o w e r & E n e r g y
S e r v i c e s
T e l e c o m m u n i c a t i o n
T r a d i n g
2010 2011 2012 Average market P/BV 2010-2012

8/22/2019 SPEN Initiation Report July 10 2013
http://slidepdf.com/reader/full/spen-initiation-report-july-10-2013 41/41
Aitken Spence PLC
IMPORTANT DISCLAIMER
This document has been prepared on behalf of the Colombo Stock Exchange (“CSE”) by Amba Research Lanka Private Limited (“Amba”) and issponsored by the CSE. The views expressed in this document are those of the authors based on available and accessible information from the publicdomain and do not represent those of the CSE. Please note, inter alia, that with the publication of this document on the CSE website, www.cse.lkneither Amba , as author, nor CSE (as sponsor) intend to assume and are not assuming any responsibility or liability (including under contract, commonlaw or tort) to any party arising out of or with respect to this document. This document is not intended to, and does not form part of any contract withanyone (including a contract between author and reader/recipient) and no one shall have any right (contractual or otherwise) to enforce any claim inrelation to the document either directly or indirectly.
Except as otherwise indicated, you may only view and print one copy of the document for your own personal, non-commercial use. You may not copy,
store [either in hardcopy or in an electronic retrieval system] transmit, transfer, broadcast, publish, reproduce, create a derivative work from, display,distribute, sell, license, rent, lease or otherwise transfer any of the contents to any third person ( including, without limitation, to others in your company oorganization) whether for direct or indirect commercial or monetary gain or otherwise without the prior written permission of Amba and CSE.
This document does not contain any investment advice nor does it constitute an offer to buy, sell or hold any of the investment product(s)/asset class(esmentioned herein. Prospective investors are required to possess sufficient knowledge when evaluating the advantages and risks inherent to suchinvestment product(s)/asset class(es) mentioned herein and to take into consideration their circumstances and financial position when assessing thesuitability of such investments.. Prior to making an investment decision, prospective investors are strongly advised to obtain independent advice fromcompetent legal, financial, tax, accounting and other professionals. Amba and CSE shall not be held liable in any manner for any direct, indirect orconsequential loss that may arise as a result of investing in the investment product(s)/asset class(es) mentioned herein. Amba and CSE expresslydisclaim any fiduciary responsibility or liability for any consequences, financial or otherwise from any reliance placed on the information in this documentThe investment product(s)/asset class(es) described in this document may not be eligible for sale or subscription within a particular jurisdiction or toparticular categories of investors. This document is not intended for distribution to a person or, within a jurisdiction where such distribution would berestricted or illegal. It is the responsibility of any person reading this document to observe all applicable laws and regulation of the relevant jurisdictionNeither Amba, nor CSE, shall be responsible for any error which may have occurred at the time of printing of this document. The information set out inthis document is subject to change without notice.
The information contained herein has been obtained from sources believed to be reliable and Amba and CSE make no warranty, expressed or impliedas to the accuracy, timeliness, completeness or correct sequencing of the information.
This document does not purport to list all of the terms and conditions, nor to identify or define all or any of the risks that would be associated with thepurchase or sale of the investment product(s)/asset class(es) described herein. Please note that any price levels, rates, simulations, illustrations, termsor conditions contained herein are indicative only, and may vary in accordance with changes in market conditions. All the information included in thisdocument is current at the time of preparing this document and subject to change at any time. Any forecast, projection or forward looking statemenmade in this document embodies assumptions and predictions about future events that by their nature cannot be verified as facts. They are nonecessarily indicative of future or likely performance, of investment product(s)/asset class(es), countries, markets or companies. Any past markeconditions or product performances may not be representative of future market conditions or product performances.