The knowns, known unknowns and unknowns of sequestration of ...
Upload
briana-halbertCategory
view
26download
0description

Experiment K-1Spectroscopy Unknowns
CHE 302-79
Dr. Ndip
Briana Halbert
Co-Authors: Darren Morgan, Isys Erbin, and Joyce Newson

A. Physical Characteristics
Empirical Formula/Molecular Formula Determination:
Based on the provided information with the unknown compound, the molecular formula
of the compound was determined based on the calculations below. Since nitrogen and bromine
were not identified in the compound, it could be assumed that the missing percentages in the
compound were oxygen. Based on the given percentages, it was assumed that the total mass was
100.0 g and the empirical formula units were determined by dividing the molar mass by the
smallest molar mass of the given elements. The molecular formula was determined by dividing
the molecular weight by the empirical formula units.
The molecular formula, density and boiling point were determined for unknown sample
AS. The molecular formula was determined to be C8H8O (See calculations below).
M.W. 120.6
M.W. 120.6
%C 79.97%
%H 6.71%
%O 13.32%
%N 0.00
%Br 0.00
Percent Composition
%C = 79.97g
%H= 6.71g
79.97g+6.71g=86.68g
%O= 100g – 86.68g = 13.32g
Molecular formula

C 79.97%= 79.97/12.011= 6.65 moles
H 12.08%= 6.71g/1.0079= 6.65 moles
O 15.97%= 13.32g/15.9994= .83 moles
C 6.65 moles/.83 moles ≈ 8.01 = 8
H 6.65 moles/.83 moles ≈ 8.01 = 8
O .83 moles/.83 moles= 1
Molecular Formula: C8H8OPurification:The unknown liquid was distilled using simple distillation, the observations are shown in table 1. Despite the determined peak temperature, it was informed that the boiling point estimate was off by about 7°C.
ObservationsTemperature (°C)
First Drop: 190Peak
Temperature: 198Table 1: Simple distillation observations
Density Determination:
The density was determined by measure the mass of an empty graduated cylinder, then the mass of the unknown compound and graduated cylinder was determined. With those observations, the mass of the unknown compound was determined and the volume was determined with the graduated lines. The calculations and observations are shown below in table 2.
Mass of 10 mL graduated cylinder 39.94 g
Mass of graduated cylinder and unknown 48.02 g
Mass of Unknown 8.08gVolume of Unknown 8.10 mLTable 2: Density determination
Density= massv olume
Density= 8.08 g8.10 mL
Density=0.9975g
mL

Solubility Classification:Five test tubes were labeled and the solubility of the compound was determined in distilled water, sodium hydroxide, hydrochloric acid, sodium bicarbonate and sulfuric acid. The observations are shown below in table 4.
Solvent Observations ConclusionDistilled Water Two separate labels were visible Not Soluble
Sodium Hydroxide Two separate labels were visible Not SolubleSodium
Bicarbonate Two separate labels were visible Not SolubleHydrochloric Acid Two separate labels were visible Not Soluble
Sulfuric AcidOne layer was visible greasy
yellow SolubleTable 4: Solubility classification observations
The solubility of compound O in sulfuric acid suggests the presence of an alkene, alcohol, aldehyde, or a ketone group.
B. Elemental Composition
Phenylacetaldehyde1,3-Dihydroisobenzofuranm-tolualdehyde
C. Functional Group Analysis
During the experiment a solubility test was conducted with five different to solutions in order to
determine if the soluble or insoluble. This also gave a preliminary look at what functional groups
were present in the compound. The purified unknown was insoluble in water and all other
solvents 5% NaOH, 5% NaHCO3, 10% HCl except H2SO4 . A thick clear oil layer appeared on
top of all the solutions except H2SO4 which appeared as a greasy yellow.

D. Litera Spectra
Figure 1: Infrared Spectroscopy
Figure 2: Infrared Spectroscopy – labeled functional groups
The functional groups were identified based on the wave number length as provided by literature IR absorptions. The wavenumber peak at 3062.24 cm-1 was identified as a carbon—hydrogen single bond aromatic, which is generally found in the 3150-3000 cm-1 range. The wavenumber peak at 1680.26 cm-1 was identified as a carbonyl compound (carbon

double bonded to an oxygen), which is generally found in the 1740-1660 cm -1 range. The solubility tests suggested the presence of a carbonyl group, which correlates with the IR spectroscopy peak at 1680.26 cm-1.
NMR Spectroscopy:Preparation of Sample: The purified sample was taken in a larger pipette. Two drops of the sample were placed in the NMR tube. The NMR tube was handled at the top in order to prevent fingerprints from disrupting the reading. With the smaller pipette, which was graduated, 0.75 ml of CDCl3 was added to the NMR tube. Since CDCl3 can absorb moisture, it remained closed, except for when in use. The NMR tube was covered with a plastic cap. The prepared tube was placed in the NMR instrument and the slot number was recorded and analyzed at a later date.
Before anazlyzing any spectrum, the program was Ghostcripted so that it could be properly saved to a .pdf file. JEOL Delta Software was used to analyze the spectrum.
PMR Spectrum: It was ensured that the 1H button was clicked, so that the proper nucleus was being observed. The data was transferred to a data slate and the reference peak 7.26 ppm was selected. The small peak at this area was expanded and set as the reference peak. Peaks were automatically picked after designating a peak threshold and modified for misreadings. The integration of the peaks were determined and the spectrum was properly annotated, results are summarized in figure 3 and table 5.
Figure 3: Proton-NMR Spectrum
Signal Identifier Chemical Shift ( )δ Multiplicity Integral Number of ProtonsA 7.961 Triplet 0.33 2B 7.559 Quartet 0.64 4C 7.464 Quintet 1.00 6D 2.605
Total= 1.97Table 5: Proton-NMR Spectroscopy
Number of proton calculations:
Number of ProtonsIntegration Interval
=HydrogenTotal
IntegrationTotal
Proton number for signal identifier 1:Number of Protons1
0.33= 12
1.97Number of Protons1=2
Proton number for signal identifier 2:

Number of Protons2
0.64=12
2Number of Protons2=1.97
Proton number for signal identifier 3:Number of Protons3
1.00=12
2Number of Protons3=1.97
CMR Spectrum: The procedure was similar to that of PMR spectrum, except the 13C button was selected and the designated reference peak was 77.2 ppm and no intergration was found, results are shown in figure 4 and table 6.
Figure 4: Carbon-NMR Spectrum
DEPT-135 Spectrum: Processing for the 13C nucleus was selected and the processed data was moved to the data slate. The 13C and DEPT-135 data slate were overlaid for carbon comparisons, results are summarized in figure 5 and table 6.

Figure 5: DEPT-135 NMR Spectrum
Signal Identifier Chemical Shift ( )δ +/0/- AssignmentA 197.85 + C=O/CB 137.23 + C=O/C
C 133.09 + CH2
D 128.52 _ CH/CH3
E 128.29 _ CH/CH3
F 26.47 0 CH/CH3
Table 6: DEPT-135 NMR Spectroscopy
COSY Spectrum: This spectrum plotted the proton spectrum on the x and y axis, so the ppm was indicated on both sides, the lines are were drawn between the visible points and a diagonal line was drawn through the respective lines, as shown in figure 6 and table 8.

Figure 6: COSY NMR Spectrum
Signal Identifier Chemical Shift ( )δ MultiplicityIdentifier of Coupled
ProtonChemical Shift ( )δ Multiplicity
1 2.90 1 2 2.50 (1,2) 12 2.08 1 1 2.25 (2,1) 13 0.88 2 --- --- ---
Table 8: COSY NMR Spectroscopy
HECTOR Spectrum: This spectrum plotted the CMR and PMR spectrums on the x and y-axis, respectively, the results are summarized in figure 7 and table 9.

Figure 7: HECTOR NMR Spectrum
Carbon Identifier
Chemical Shift ( ) x-axisδ
Proton Identifier
Chemical Shift ( ) y-axisδ
C 52.91 1 2.25D 30.48 2 2.08F 22.66 3 0.88
Table 9: HECTOR NMR Spectroscopy
Based on the above NMR spectra the proposed structure of the unknown compound O with the labeled carbon identifiers (A-F) and the hydrogen identifiers (1-3) are shown below.
Mass Spectroscopy:The mass spectrum is shown below, figure 8 shows the spectrum with the broken fragments. The assignments of the respective peaks are shown in table 10 below.
PeakLocation
(m/z) Structure
M+ 101
Additional Peak
84

Parent Peak
42
Table 10: Mass Spectroscopy Peak Locations
Figure 8: Mass Spectroscopy of Unknown Compound O
It is proposed that the structure of unknown O is:
3,3-dimethybutanal
Confirmation of Structure:
Physical Characterization:The literature comparison of 3,3-dimethybutanal and the unknown compound O are shown below in table 11. The sources are cited at the end of the report.
Physical Characterization 3,3-Dimethylbutanal Unknown OMolecular Weight (g/mol) 100.16 100.16
Boiling Point (°C) 104-106 109Density (g/mL) 0.798 0.794
Table 11: Literature comparison of unknown and prospective compound
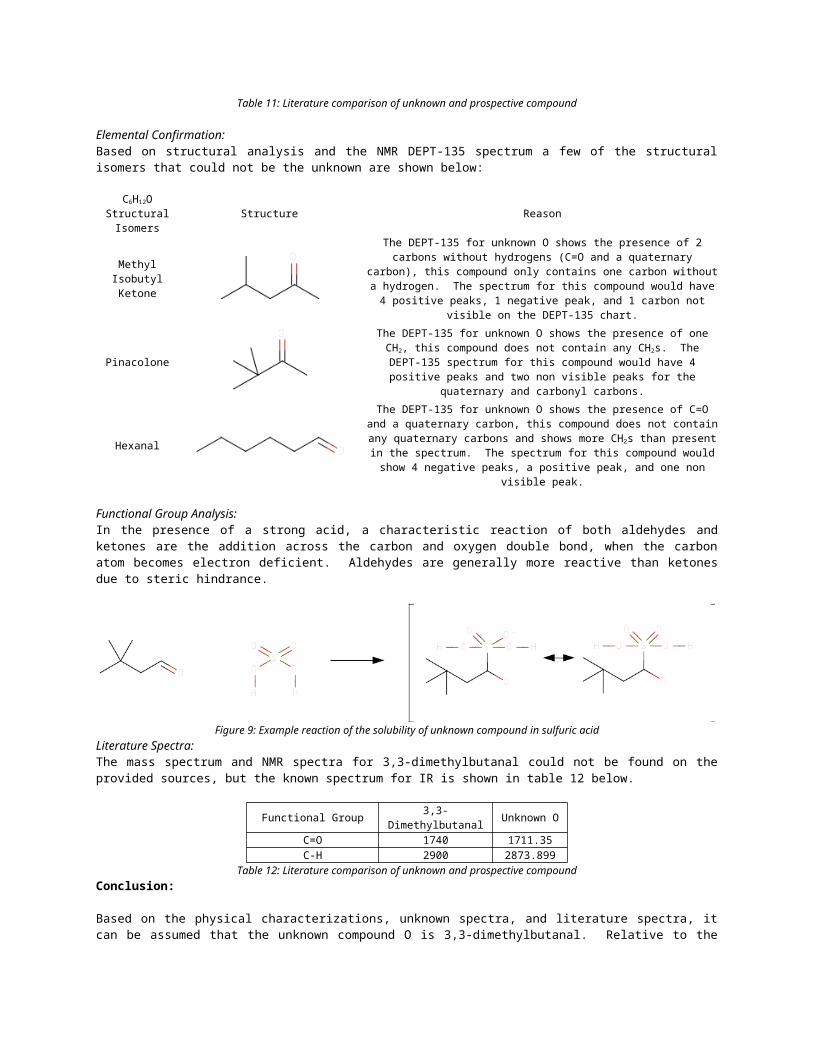
Elemental Confirmation:Based on structural analysis and the NMR DEPT-135 spectrum a few of the structural isomers that could not be the unknown are shown below:

C6H12O Structural Isomers
Structure Reason
Methyl Isobutyl Ketone
The DEPT-135 for unknown O shows the presence of 2 carbons without hydrogens (C=O and a quaternary carbon), this compound only contains one carbon without a hydrogen. The spectrum for this compound would have 4 positive peaks, 1 negative peak, and 1 carbon not visible on the DEPT-135
chart.
Pinacolone
The DEPT-135 for unknown O shows the presence of one CH2, this compound does not contain any CH2s. The DEPT-135 spectrum for this compound
would have 4 positive peaks and two non visible peaks for the quaternary and carbonyl carbons.
Hexanal
The DEPT-135 for unknown O shows the presence of C=O and a quaternary carbon, this compound does not contain any quaternary carbons and shows more CH2s than present in the spectrum. The spectrum for this compound
would show 4 negative peaks, a positive peak, and one non visible peak.
Functional Group Analysis:In the presence of a strong acid, a characteristic reaction of both aldehydes and ketones are the addition across the carbon and oxygen double bond, when the carbon atom becomes electron deficient. Aldehydes are generally more reactive than ketones due to steric hindrance.
Figure 9: Example reaction of the solubility of unknown compound in sulfuric acidLiterature Spectra:The mass spectrum and NMR spectra for 3,3-dimethylbutanal could not be found on the provided sources, but the known spectrum for IR is shown in table 12 below.
Functional Group 3,3-Dimethylbutanal Unknown OC=O 1740 1711.35C-H 2900 2873.899
Table 12: Literature comparison of unknown and prospective compoundConclusion:
Based on the physical characterizations, unknown spectra, and literature spectra, it can be assumed that the unknown compound O is 3,3-dimethylbutanal. Relative to the physical characterization, the boiling point determined experimentally was incorrect by about 7°C, but whether that number was higher or lower than the experimental temperature was not determined. Supposing the boiling point was about 116°C it was proposed that the compound was methyl isobutyl ketone, but the structure did not match the NMR spectra. Although the IR spectra of 3,3-dimethybutanal had longer peaks than the unknown compound, they were still shown in the same region. The physical characterization of the unknown compound O and 3,3-dimethylbutanal were very similar. The NRM spectra were extremely helpful in determining the structure of the unknown, and were the most useful identification technique after the functional groups were identified. This lab was successful in providing methods for the identification of unknown compounds.
References: BIBLIOGRAPHY 3,3-Dimethylbutanal MSDS. (2010 29-July). Retrieved 2012 11-March from Sigma йил йилAldrich: http://www.sigmaaldrich.com/catalog/DisplayMSDSContent.do
McMurry, J. (2008). Organic Chemistry (7th ed.). Belmont: Thomson: Brooks/Cole.