Spectral Band Selection for the Advanced Baseline...
50
Spectral Band Selection for the Advanced Baseline Imager (ABI) Tim Schmit Paul Menzel, Hal Woolf, Mat Gunshor, Bryan Baum, Chris Sisko, Allen Huang, Gary Wade, Scott Bachmeier, Liam Gumley, Kathy Strabala etc. February 2000 National Oceanic and Atmospheric Administration NESDIS/ORA Advanced Satellite Products Team Cooperative Institute for Meteorological Satellite Studies University of Wisconsin - Madison
Transcript of Spectral Band Selection for the Advanced Baseline...

Spectral Band Selection for theAdvanced Baseline Imager (ABI)
Tim Schmit
Paul Menzel, Hal Woolf, Mat Gunshor,Bryan Baum, Chris Sisko, Allen Huang,
Gary Wade, Scott Bachmeier, Liam Gumley,Kathy Strabala etc.
February 2000
National Oceanic and Atmospheric Administration
NESDIS/ORA
Advanced Satellite Products Team
Cooperative Institute for Meteorological Satellite Studies
University of Wisconsin - Madison

Why ABI?:A Continuing Evolution
To keep pace with the growing needs forGOES data and products, NOAA must
continue to evolve its geostationary remotesensing capabilities.
The Advanced Baseline Imager (ABI)follows this evolutionary path. ABI
enhances the current capabilities andaddresses unmet NWS requirements.

What’s the Advance Baseline Imager:Spatial resolution Visible (0.64 µm) 0.5 km (14 µrad)
All other bands 2 km (56 µrad)
Spatial coverage Full disk 4 per hour (every 15 min)
CONUS (3000 x 5000 km) 12 per hour (every 5 min)
Operation during eclipse Yes
Lifetime Mean Mission life 8.4 years
Noise NEdT (except 13.3 µm) 0.1K @ 300K
Data rate < 15 Megabits-per second (Mbps)

When’s the ABI:GOES-__ (L) - 3 May 2000 launch
GOES-__ (M) - early 2002 (estimate) - spectrally wider water vapor - higher spatial resolution water vapor - additional 13.3 µm band - no 12 µm band
GOES-__ (N, O, P)
GOES-__ (Q) - 2008 (estimate) w/ ABI
GOES-__ (R) - 2010

1 0.52 – 0.72 0.62 Visible Daytime clouds, fog
8 1.3 – 1.9 1.6 Near IR Daytime clouds/snow, water/ice clouds
2 3.8 – 4.0 3.9 Shortwave IR Nighttime low clouds, fog, fire detection
3 6.5 – 7.0 6.75 Water Vapor 1 Upper tropospheric flow, winds
6 7.0 – 7.5 7.25 Water Vapor 2 Mid tropospheric flow, winds
4 10.2 – 11.2 10.7 IR Window 3 Clouds, low-level water vapor, fog, winds
5 11.5 – 12.5 12.0 IR Window 4 Low-level water vapor, volcanic ash
7 13.2 – 13.8 13.5 Carbon Dioxide Cloud-top parameters, heights for winds
ABI - 8 # Wavelengths Description Primary Use
Range (µm) Center

1 0.59 – 0.69 0.64 Visible Daytime clouds, fog
- 0.81 - 0.91 0.86 Solar window Day clouds, NDVI, fog, aerosol, ocean studies
- 1.36 - 1.39 1.375 Near IR Daytime thin cirrus detection
2 1.58 – 1.64 1.61 Near IR Daytime clouds/snow, water/ice clouds
3 3.8 – 4.0 3.9 Shortwave IR Nighttime low clouds, fog, fire detection
4 5.7 – 6.6 6.15 Water Vapor 1 Upper tropospheric flow, winds
5 6.8 – 7.2 7.0 Water Vapor 2 Mid tropospheric flow, winds
6 8.3 – 8.7 8.5 IR Window 1 Sulfuric acid aerosols, cloud phase, sfc
7 10.1 – 10.6 10.35 IR Window 2 Cloud particle size, sfc properties
8 10.8 – 11.6 11.2 IR Window 3 Clouds, low-level water vapor, fog, winds
9 11.8 – 12.8 12.3 IR Window 4 Low-level water vapor, volcanic ash
10 13.0 – 13.6 13.3 Carbon Dioxide Cloud-top parameters, heights for winds
ABI - 12# Wavelengths Description Primary Use
Range (µm) Center

ABI-8 (IR only) Channels
ABI-12 (IR only) Channels
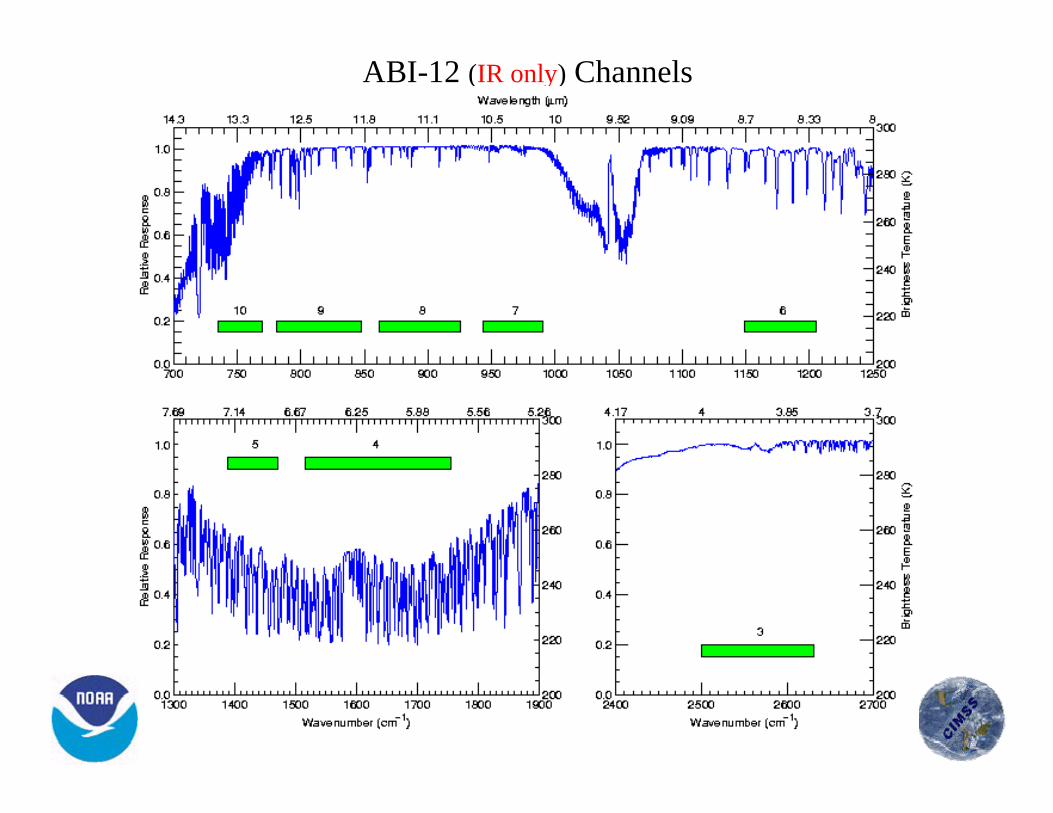
ABI-12 (top bars) and ABI-8 (bottom bars) IR Channels

Weighting Functions for the IR Channels
Units: µm and K

ABI High Spatial Resolution Visible (0.64 µm)Based on GOES Imager Ch 1

ABI Channel 2 (1.61 um)Based on AVHRR/3 and MODIS
Example of MAS 0.66, 1.61, and 1.88 um

ABI Channel 2 (1.61 um)Example of MAS 0.66 and 1.61 um
convective cumulonimbus surrounded by lower-level water clouds(King et al., JAOT, August 1996)

Snow cover over western Canada for 1999 March 11.
• Left: AVHRR channel-3a (1.6 µm) showing mostlysolar energy reflected from low clouds.
• Center: Principle Component Image 3 (containingprimarily input from AVHRR channel-3a)discriminating between snow (white) and cloud(dark).
• Right: AVHRR channel-1 (0.6 µm) verifying snowcover by texture, but not discriminating betweensnow and cloud.
ABI Channel 2 (1.61 um) AVHRR/3a

ABI Channel 2 (1.61 um)Snow detection example from VIRS
Snow
Clouds
Thin Cirrus

ABI Channel 2 (1.61 um)spectral width was narrowed (was 1.3 to 1.9 um)

1.88 µm is helpful for contrail detection
Examples from MAS (Chs 2, 10, 16)

ABI Channel 3 (3.9 µm)Based on GOES Imager Ch 2
useful for fog, snow, and cloud detection
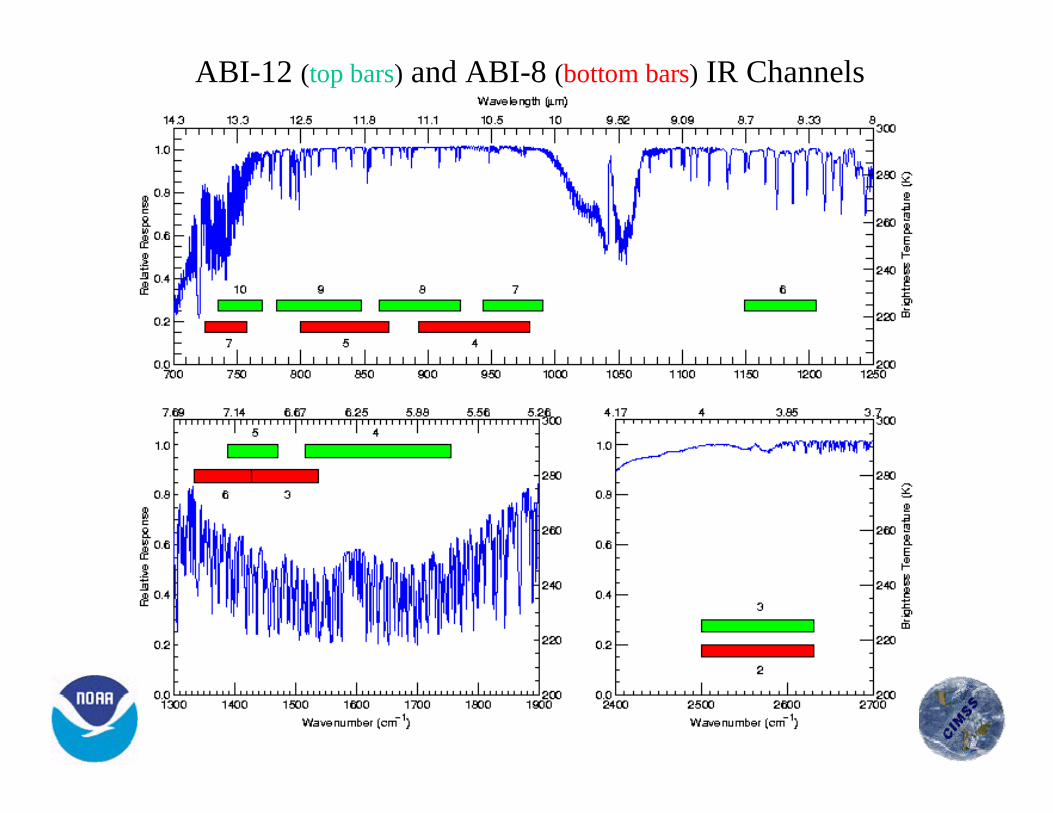
ABI Channel 3 (3.9 µm)useful for fire and smoke detection
GOES-8 imagery on 9 May 1998 at 15:45 UTC
fire detection using the 3.9 and 11 µm
visible imagery showing smoke

ABI Channel 4 (6.15 µm)Based on MSG/ SEVIRI
Used together with ABI Ch 5
Units: µm and K

ABI Channel 5 (7.0 µm)Based on GOES Sounder Ch 11
Used together with ABI Ch 4

Current Phase Discrimination
Daytime phase discrimination is most effective for fairly thick clouds

Future Phase Discrimination
With the addition of the 8.5 µm, phase discrimination is improved for both day/night time clouds for non-opaque clouds

ABI Channel 6 (8.5 µm)Based on MODIS
used with ABI Chs 7, 8, 9, 10 to separate water from ice clouds
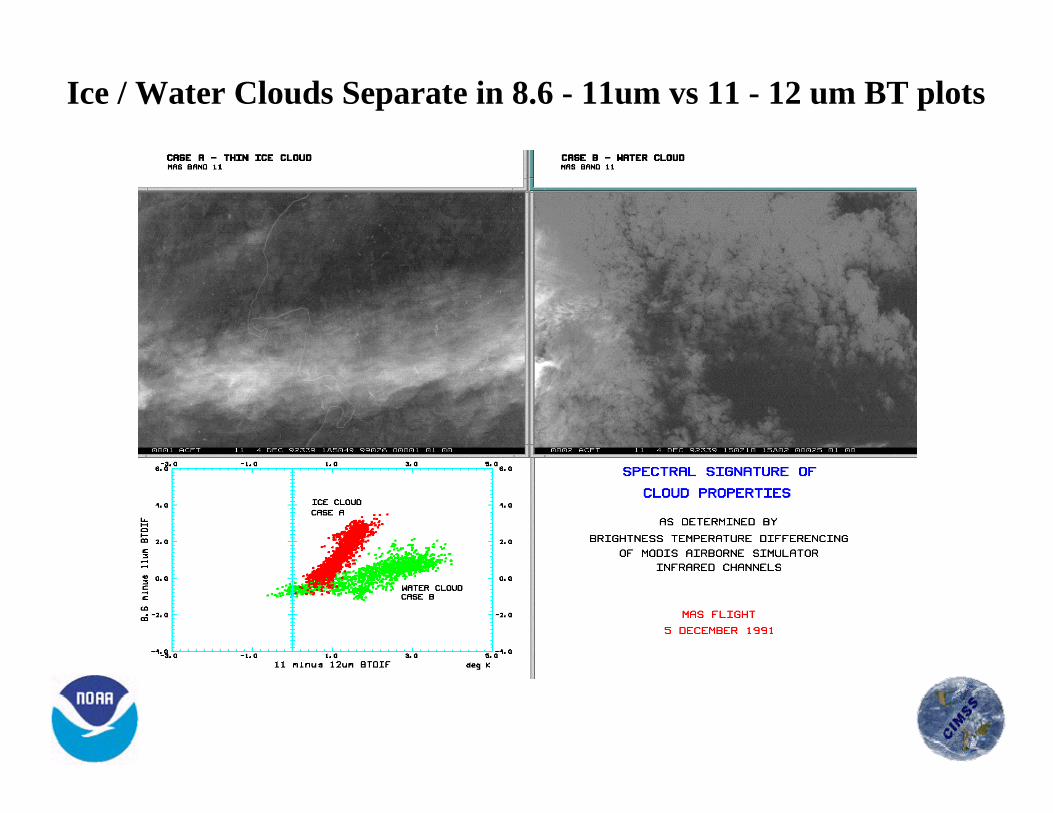
Ice / Water Clouds Separate in 8.6 - 11um vs 11 - 12 um BT plots

ABI Channel 6 (8.5 µm)Based on MODIS
used with ABI Chs 8 & 9 to improve volcanic cloud detection
similar to MSG (8.7) and proposed VOLCAM (8.6)
H2SO4

ABI Channel 6 (8.5 µm)- volcanic cloud detection can be improved by detecting sulfuric acidaerosols (Realmuto et al., JGR, July 1997)- microphysical properties of clouds can be determined. This includesa more accurate and consistent delineation of ice from water cloudsduring the day or night- international commonality is furthered as MSG carries a similarchannel (8.5 to 8.9 µm) as well as MODIS and GLI- thin cirrus can be detected in conjunction with the 11 µm. This willimprove other products derived from the split window (SST or low-level moisture) by avoiding cloud contamination- SST estimates can be improved by a better atmospheric correctionin relatively dry atmospheres- surface properties can be observed in conjunction with the 10.35µm channel.

ABI Channel 6 (8.5 µm)10 km too coarse for volcanic ash detection
~10 km resolution (sounder) ~4 km resolution (imager)
Split Window Differences
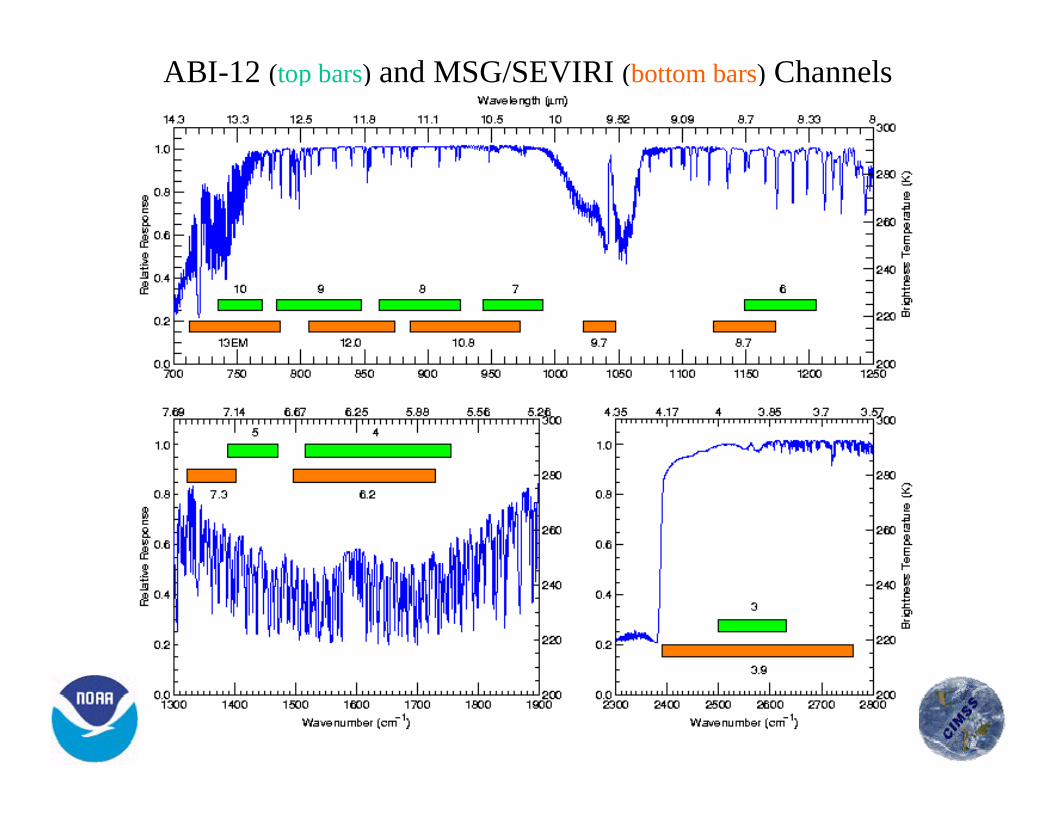
ABI-12 (top bars) and MSG/SEVIRI (bottom bars) Channels

ABI and MSG/SEVIRI Weighting Functions

ABI and MSG Weighting Functions

ABI Channel 7 (10.35 µm)Examples of MAS 0.66, 10.5-11.0, and 8.6-10.5 um
reveal utility of new IR window for seeing through clouds to ice floes

Cloud particle size emerges in high resolution IR window spectraBased on HIS data, ABI Chs 7, 8, & 9 useful for effective radius

ABI Channel 7 (10.35 µm)- microphysical properties of clouds can be determined. Thisincludes a more accurate determination of cloud particle sizeduring the day or night
- cloud particle size is revealed along with cloud liquid watercontent.
- particle size may be related to the “enhanced V” signature
- surface properties can be observed in conjunction with the 8.6,11.2, and 12.3 µm bands
- low level moisture determinations are enhanced with more splitwindows

ABI Channel 8 (11.2 µm)Based on GOES Sounder Ch 8
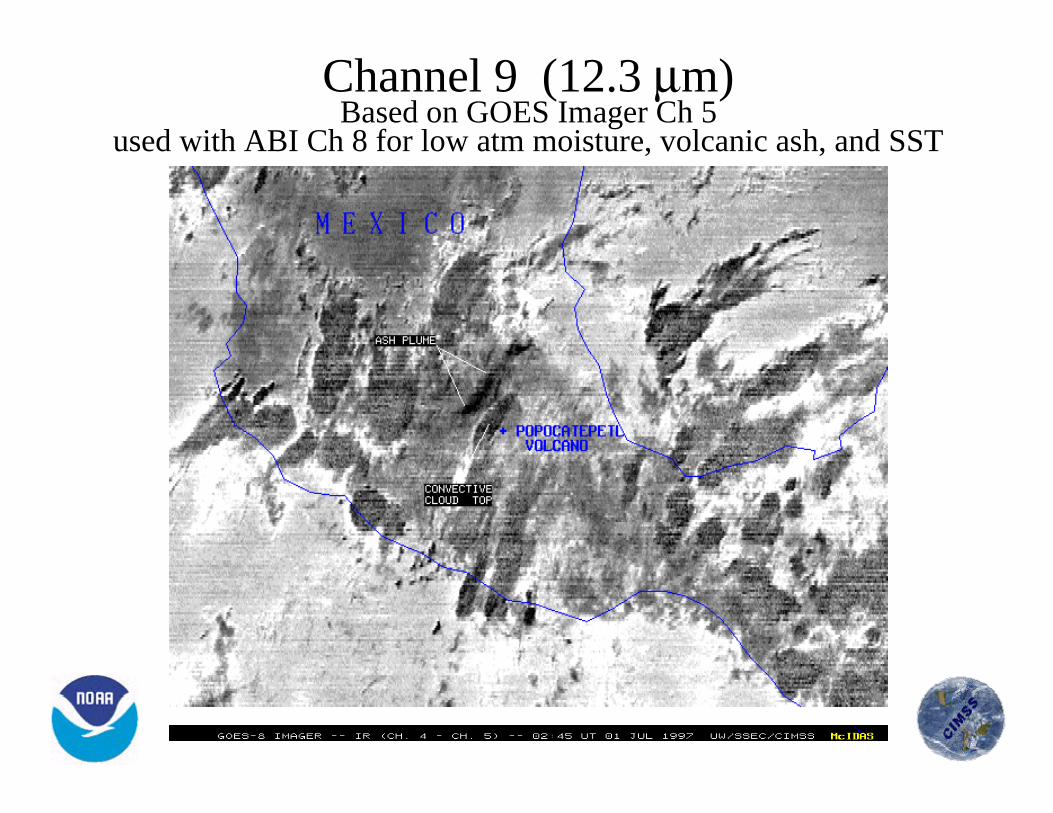
Channel 9 (12.3 µm)Based on GOES Imager Ch 5
used with ABI Ch 8 for low atm moisture, volcanic ash, and SST

ABI Channel 10 (13.3 µm)Based on GOES Sounder Ch 5
used with ABI Ch 8 for cloud heights
Clear Low Cloud High Cloud
ABI-8 (Threshold) ; ABI-12 (Goal)In order of priority: 8.5, 10.35, 0.86 and 1.375 µm.
The 0.86 µm channel: - provides synergy with the AVHRR/3; - determining vegetation amount, aerosols and ocean/land studies; - also enables localized vegetation stress monitoring, fire dangermonitoring, and albedo retrieval.
The 1.38 µm channel: - is modeled on the band on MODIS; - does not see into the lower troposphere due to water vaporsensitivity and thus it provides excellent daytime sensitivity to verythin cirrus.

Example of 0.93 um (Band 10 on FY-1C)

ABI and NWS REQUIREMENTS:
(ABI channels in order of increasing wavelength)
Visible (1): Daytime cloud imaging, snow and ice cover, severe thunderstorm detection, clouddrift winds, precipitation estimates, fog, flash floods, winter storms
Near IR (2): Daytime automated discrimination of clouds from snow for estimating total cloudcover, discrimination of water clouds from ice clouds (in aviation), detection of smoldering fires
Shortwave IR window (3): Nighttime detection of low clouds and fog detection when used withthe IR and “dirty” IR windows; identification of fires; daytime detection of cloud over snow, fog
IR water vapor 1 (4): Delineates broad scale mid-tropospheric patterns, mid-tropospheric watervapor drift winds (used for numerical model initialization and hurricane track prediction)
IR water vapor 2 (5): Delineates upper-tropospheric water vapor-drift winds (used for numericalmodel initialization), broad scale patterns corresponding with jet stream cores

IR window 1 (6): Determination of cloud phase (ice or water)
IR window 2 (7): Determination of cloud particle size, discrimination of surface water and ice incloudy scenes
IR window 3 (8): Continuous day and night detection of cloud cover and cloud top heights, low-level water vapor, fog, when used with the “dirty” IR window 4, precipitation estimates, surfacetemperatures, hurricane winds, winter storms
IR window 4 (9): Determination of low-level water vapor when used with IR window, detectionof volcanic ash, and estimation of SST
IR carbon dioxide (10): Used with the IR window to determine cloud top heights and cloudparameters above 12,000 feet complementing ASOS and providing cloud information toforecasters and numerical models; parameters include sky cover, heights of cloud tops, and cloudopacity

The following figure demonstrates the simulation comparisons ofwater vapor images of current GOES-8, GOES-12, and two proposedABI water vapor bands. High spectral resolution data from the NAST(NPOES Atmospheric Sounder Testbed) were convoluted with thevarious GOES spectral response functions (SRF) to derive the field ofbrightness temperatures.
The ABI water vapor band (5.7-6.6 µm) is very similar to the currentGOES. Additional low-level water vapor information is provided bythe new band of 6.8-7.2 µm. The mean brightness temperaturedifference between the GOES-8 and ABI 6.15 µm is approximatelythe same size (2 K) as between GOES-8 and the spectrally widerGOES-12 water vapor band.
Simulated Water Vapor Images

SRF bandpass images derived from NAST-I.
These water vapor images were simulated from NAST-I 2.6 kmresolution data collected during WALLOPS 99 field experiment(September 13, 1998).
GOES-8 ABIABIGOES-12

Units: µm and K

11 µm brightness temperatures similar to existing instrument
Units: µm and K

Summary• ABI 12 channels address NWS requirements for cloud, moisture, and
surface products.
• Original ABI ( 8) channels have been adjusted:- experience with new channels/applications on the MAS (MODIS Airborne
Simulator) suggested new channels,
- additional window channels will be on future NPOESS instruments,
- some channels were modified to conform to other sensors that will be in-orbit in the same time frame,
- channel selection continues on an evolutionary path.
• A second visible channel was added (as a goal) for NDVI and aerosoldetection.
• A second near IR channel was added (as a goal) for daytime thincirrus detection.
• IR Window brightness temperatures will be similar to those onexisting instruments.

What if we could have more bands?
• 9.6 µm -- total ozone
• 14.2 µm -- better cloud heights
• 4.57 µm -- better TPW
• 0.47 µm -- aerosols particle size (over land)

More information can be found at• http://cimss.ssec.wisc.edu/goes/abi/
• http://cimss.ssec.wisc.edu/modis1/modis1.html– MODIS
– MAS
• http://cimss.ssec.wisc.edu/nast/index.html
• http://cimss.ssec.wisc.edu/goes/goes.html– Real-time Sounder page
– GOES Gallery
– Biomass Burning
• http://www2.ncdc.noaa.gov/docs/klm/html/c3/sec3-0.htm– NOAA KLM User's Guide
• http://www.eumetsat.de/en/– MSG..System..MSG..Payload..Spectral bands..Spectral bands

Acronyms• ABI -- Advanced Baseline Imager• AGS -- Advanced Geostationary Studies• AVHRR -- Advanced Very High Resolution Radiometer• CIMSS -- Cooperative Institute for Meteorological Satellite Studies• GLI -- Global Imager• HIS -- High-resolution Interferometer Sounder• MAS -- MODIS Airborne Simulator• MODIS -- MODerate-resolution Imaging Spectrometer• MSG -- Meteosat Second Generation• NWS -- National Weather Service• GOES -- Geostationary Operational Environmental Satellite• SEVIRI -- Spinning Enhanced Visible and Infra Red Imager• VIRS -- Visible Infrared Scanner

ABI and MSG Weighting Functions